Article

Personalization of the Car-Sharing Fleet Selected for Commuting to Work or for Educational Purposes—An Opportunity to Increase the Attractiveness of Systems in Smart Cities

Department of Road Transport, Faculty of Transport and Aviation Engineering, Silesian University of Technology, 8 Krasińskiego Street, 40-019 Katowice, Poland
Smart Cities 2024, 7(4), 1670-1705; https://doi.org/10.3390/smartcities7040066
Submission received: 10 May 2024 / Revised: 26 June 2024 / Accepted: 28 June 2024 / Published: 2 July 2024
(This article belongs to the Section Smart Transportation)

Abstract

:
Car-sharing services, which provide short-term vehicle rentals in urban centers, are rapidly expanding globally but also face numerous challenges. A significant challenge is the effective management of fleet selection to meet user expectations. Addressing this challenge, as well as methodological and literature gaps, the objective of this article is to present an original methodology that supports the evaluation of the suitability of vehicle fleets used in car-sharing systems and to identify the vehicle features preferred by users necessary for specific types of travel. The proposed methodology, which incorporates elements of transportation system modeling and concurrent analysis, was tested using a real-world case study involving a car-sharing service operator. The research focused on the commuting needs of car-sharing users for work or educational purposes. The study was conducted for a German car-sharing operator in Berlin. The research was carried out from 1 January to 30 June 2022. The findings indicate that the best vehicles for the respondents are large cars representing classes D or E, equipped with a combustion engine with a power of 63 to 149 kW, at least parking sensors, navigation, hands-free, lane assistant, heated seats, and high safety standards as indicated by Euro NCAP ratings, offered at the lowest possible rental price. The results align with market trends in Germany, which focus on the sale of at least medium-sized vehicles. This suggests a limitation of small cars in car-sharing systems, which were ideologically supposed to be a key fleet in those kinds of services. The developed methodology supports both system operators in verifying whether their fleet meets user needs and urban policymakers in effectively managing policies towards car-sharing services, including fleet composition, pricing regulations, and vehicle equipment standards. This work represents a significant step towards enhancing the efficiency of car-sharing services in the context of smart cities, where personalization and optimizing transport are crucial for sustainable development.

1. Introduction

Recent global attention has been directed towards responsible and sustainable urban mobility, with the primary objective of mitigating the adverse effects of motorization on the environment. Achieving this goal not only requires the provision of adequate infrastructure, legislation, promotional efforts, and information but also critically requires the development of services that facilitate sustainable advancement for future generations [1].
In the context of smart cities, this means using advanced technologies and data analytics to create integrated, efficient, and user-friendly transport systems that combine a variety of innovative transport solutions to address the complexities of urban mobility. That kind of transport solution includes, i.e., electric vehicles, autonomous cars, and, for example, shared mobility services. Shared mobility, including car sharing, plays a crucial role in achieving the sustainability goals of smart cities. By reducing the number of vehicles on the road, shared mobility decreases traffic congestion and reduces greenhouse gas emissions. It also promotes a more efficient use of urban space since fewer cars are needed to serve the same number of users. Shared mobility includes a wide range of services, such as ride-sharing, bike-sharing, scooter-sharing, and car-sharing. These services are integrated into the larger transportation network, offering residents multiple options to suit their mobility needs while minimizing the dependency on private car ownership [2]. It includes the following:
  • Ride-sharing services, like those offered by Uber and Lyft, enable multiple passengers to share a single vehicle for their journeys, reducing the number of cars on the road and consequently lowering emissions and traffic congestion. These services are enhanced by sophisticated algorithms that optimize routes and match passengers traveling in the same direction, improving user efficiency and convenience [3].
  • Bike-sharing systems provide an environmentally friendly and health-promoting alternative for short-distance travel. Users can pick up a bike from one station and drop it off at another, making it a flexible option for navigating urban environments [4]. This mode of transport not only reduces carbon emissions but also helps alleviate traffic congestion [4].
  • Scooter-sharing has emerged as a popular option for short, spontaneous trips in many cities [5]. Electric scooters can be rented using mobile apps, offering a convenient and sustainable solution to last-mile connectivity [5]. These systems often complement public transportation by solving the problem of reaching destinations that are not accessible directly by bus or train [5].
  • Car-sharing is a service that provides members with access to a fleet of vehicles on a short-term, as-needed basis [6]. Unlike traditional car rental services, which typically cater to longer rental periods and often involve visiting a rental location, car sharing is designed for short-term use, often measured in minutes or hours, and vehicles are typically located within local neighborhoods for easy access [6].
Among these shared mobility solutions, car-sharing systems stand out for their ability to significantly reduce the need for private car ownership. They are recognized for their sustainability, efficiency, modernity, autonomy, and convenience, are prominent among such services in smart city transportation solutions [6,7,8]. Within the smart cities’ framework, they leverage cutting-edge technology to improve the accessibility of urban transportation. Shaheen and Cohen highlight that car-sharing systems have dramatically decreased the total number of vehicles on the road, substantially lowering greenhouse gas emissions and easing urban congestion, thus directly contributing to the environmental and operational goals of smart cities [9].
In the broader landscape of smart city transport services, car-sharing stands out due to its ability to complement other modes of transportation, such as public transit, cycling, and walking. By providing a flexible and convenient alternative to private car ownership, car sharing helps bridge the gaps in public transport networks, offering first- and last-mile connectivity that enhances the overall efficiency of urban mobility [10]. This synergy is crucial for the holistic development of sustainable transport ecosystems in smart cities.
To further elucidate the technological synergies, Litman discusses how smart technologies facilitate the integration of car sharing with existing public transport systems [11]. This integration improves the fluidity of transport, which is crucial for optimizing urban space and managing city resources more effectively [11]. This integration supports the smart city initiative to create a cohesive and efficient urban transport network, ultimately fostering a more sustainable urban environment.
The socio-economic implications of car sharing, discussed by Martin and Shaheen, illustrate its role in promoting a shift towards collaborative consumption [12]. This change is essential to reduce the ecological footprint and support sustainable urban practices, aligning with the larger urban sustainability strategies embraced by smart cities [12]. Car-sharing exemplifies how technology-enabled services can catalyze significant behavioral and structural changes within urban societies, promoting more responsible consumption patterns among urban dwellers.
Adding to the discourse, George and Julsrud note the potential of car-sharing systems to incorporate electric and hybrid vehicles, thereby promoting cleaner transportation alternatives. This adoption plays a pivotal role in advancing the environmental objectives of smart cities by reducing vehicular emissions and facilitating the transition to a low-carbon urban environment [13].
Moreover, the data-driven aspect of car sharing is crucial for smart urban planning. Millard-Ball et al. highlight how extensive data collected from car-sharing operations can be used to analyze and predict traffic patterns, optimize public transportation schedules, and inform urban infrastructure developments [14]. This application of big data is fundamental to improving the adaptability and responsiveness of urban transport systems, making cities smarter and more attuned to the needs of their inhabitants [14].
In addition to the environmental and technological benefits, car sharing also promotes social equity. Ang et al. emphasize that car-sharing offers affordable access to transportation for diverse urban populations, including lower-income groups who might not afford personal vehicle ownership. This accessibility is essential to improving social inclusivity within smart cities, ensuring that all residents can benefit from advanced urban mobility solutions [15]. Through these multifaceted contributions, car-sharing emerges not just as a component of urban transport but as a transformative element that encapsulates the ideals of smart cities—integration, sustainability, efficiency, and inclusivity. By addressing congestion, emissions, resource optimization, and social equity, car-sharing services sculpt the foundational aspects of smart urban development, making cities not only more manageable and less polluted but also more equitable and forward-looking.
From a technical point of view, car sharing involves automated, short-term vehicle rentals accessed through websites or mobile applications. These services have increased in popularity due to their ability to enable access to vehicular transport without the need for ownership (buying or leasing), with more than 50 million users registered worldwide in 2022 [16] and a fleet that included 380,000 vehicles [17]. Projections suggest that by 2025, car-sharing systems will host over 7.5 million vehicles [18,19]. Given that vehicles are central to car-sharing services, their effective integration into fleets is crucial, ensuring they are operationally flawless. It is imperative that vehicles in car-sharing fleets not only complement urban transport modes but also help reduce reliance on private vehicle ownership. This alignment is essential, particularly in light of the anticipated rapid expansion of car-sharing vehicles in urban areas. Inadequate fleet composition can exacerbate issues related to urban planning, such as excessive occupancy of parking spaces or increased traffic congestion, which are antithetical to the principles of shared mobility.
Research on the vehicle fleets utilized in car-sharing systems forms a significant segment within the scholarly discourse on urban mobility and is extensively covered in the literature. Studies primarily delve into aspects such as:
From the point of view of vehicle relocation, many topics were considered regarding the car-sharing business model type, appropriate time to move vehicles, or appropriate prices to enable proper distribution of cars. For example, Brendel et al. showed that dividing car-sharing operation zones into price areas will reduce the need for increased vehicle relocation [20]. In turn, Zhang et al. propose a hybrid approach to fleet relocation, pointing to the potential of an approach that hybridizes the Ant Colony Optimization (ACO) metaheuristics into the column generation framework to quickly solve pricing subproblems [21]. In another work, Barrios and Godier focused on free-floating carsharing and explored the trade-offs between fleet size and hired vehicle redistributors, intending to maximize the demand level that could be satisfactorily served [22]. In turn, Carlier et al. proposed a mathematical programming-oriented approach and introduced a simple linear model based on integer flow variables [23]. Their solution was based on three optimization criteria: maximizing satisfied carsharing demands while minimizing the fleet of vehicles and the relocation operations [23]. Martin et al. emphasize that car-sharing allocation optimization involves reasoning about the number of cars to assign to geographical regions, proposing to predict the expected utilization of a car when added to a region [24]. In their work, they present the possibility of using the integer linear programming method that solves the relocation problem while considering the model predictions and relocation distances [24]. The above research indicates that effective fleet relocation in car-sharing systems is crucial to maximizing customer satisfaction and minimizing operational costs. The use of advanced optimization techniques such as metaheuristics, mathematical programming, and hybrid approaches allows for dynamic and effective vehicle relocation management. Properly managing fleet relocation requires understanding and integrating many aspects, such as business models, demand forecasting, cost optimization, and the effective use of human resources. Thanks to these approaches, it is possible to create more sustainable and efficient car-sharing systems that better respond to the needs of users.
Referring to fleet management in car-sharing in terms of the size of the fleet, many research works can be found, especially in the division into fleets equipped with internal combustion engines and electric engines. For example, Huang et al. used a mixed-integer nonlinear program model with a strategic planning level that decides the fleet size and the station capacity and an operational level that decides on the required relocation operations by specifying how to optimize the size of the fleet to properly manage vehicle routes and considering demand fluctuations and the limited battery capacity of the vehicles [25]. In turn, Fanti et al., considering car-sharing as a discrete event system in a closed queuing network framework, found that the size of the fleet is influenced by user flows in different time periods of the day or the exit of the customers from the stations when they do not find an available car-sharing vehicle [26]. While Monteiro et al. focused on optimizing fleet size to maximize the number of clients served [27], they used advanced optimization techniques, including mathematical programming, to balance vehicle availability and operational costs. Their findings demonstrated that precise demand modeling and flexible fleet management can significantly enhance the efficiency of car-sharing systems, allowing more clients to be served at lower operational costs [27]. In turn, Nourinejad and Roorda focused on a dynamic car-sharing decision support system, pointing out that fleet size in carsharing services is dependent on the pattern of user requests [28]. Ströhle et al. employed scenario analysis and optimization models to explore how customer flexibility can be leveraged for fleet optimization in car-sharing systems [29]. They used real operational data to calibrate their models. Their research showed that encouraging users to make more flexible choices, such as off-peak reservations, can lead to more efficient fleet utilization and reduce the required number of vehicles without compromising service quality [29]. Deng et al. employed an optimization model to analyze the fleet size and charger allocation problem in electric car-sharing systems [30]. They used a linear programming approach to develop strategies for managing both the fleet and the charging infrastructure. Their findings showed that appropriate planning and optimization could significantly enhance the efficiency of car-sharing systems while minimizing operational costs related to vehicle charging [30]. Bazan et al. applied a complex approach combining simulation, optimization, and queuing network analysis to the problem of rebalancing and determining fleet size in mobility-on-demand networks [31]. They used a combination of simulation and optimization methods to develop operational models for various scenarios. Their research demonstrated that integrating different analytical methods can lead to more precise and efficient solutions in car-sharing fleet management, allowing for better alignment of vehicle numbers with changing demand [31]. Furthermore, Xu and Meng determined that the main parameters to be considered when indicating the size of the vehicle fleet should be the fixed cost of the electric vehicle, the relocation cost, the electricity cost, the service charge, the driving range of the electric vehicle, the efficiency of the charging, and the number of rentals in the performance of a one-way electric car-sharing system [32]. Overall, these studies suggest that effective fleet management in car-sharing systems requires a nuanced approach that considers demand fluctuations, user behavior, vehicle type, and operational costs. Advanced optimization techniques, dynamic decision support systems, and integrated analytical methods are essential for optimizing fleet size and ensuring efficient and cost-effective car-sharing services. By understanding and addressing these factors, car-sharing operators can improve service quality and operational efficiency, ultimately leading to more sustainable and user-friendly car-sharing systems.
Another of the thematic areas of research on the car-sharing fleet are ecological aspects of the energy transformation in relation to the car-sharing fleet. A lot of research work has been carried out in companies of this type. For example, Liao and Correia showed that car-sharing electric vehicles are mainly used for short trips, and their current users are mostly middle-aged men with relatively high incomes and education [33]. Shaheen et al., examining the approach of system users to the fleet of alternatively powered vehicles, indicated that the pairing of shared electric or plug-in hybrid vehicles increased user sympathy for the use of car sharing [34]. In turn, Schlüter and Weyer emphasized that the experience of using car-sharing services can lead to greater acceptance of electric vehicle technology, which entails greater market penetration [35]. These results were also confirmed by Campisi et al., who stated that the results show that the experience of using electric vehicles from car-sharing schemes leads to greater acceptance of this new technology [36]. Furthermore, a correlation was found between the gender distribution and the operational and infrastructure characteristics of the service, such as the presence of reserved parking spaces with charging stations [36]. This study lays the foundation for more in-depth research on service design and reconversion through the introduction of shared electric vehicles, improving their use for domestic and leisure travel, and discouraging the use of a private vehicle [36]. Although Migliore et al. estimated the environmental benefits related to carsharing [37], their research has shown that there are benefits deriving from the use of carsharing in terms of reducing emissions of pollutants: there is a reduction of 25% for PM10 and 38% for CO2 [37]. In summary, the research indicates that car-sharing based on electric vehicles not only provides environmental benefits by reducing emissions but also enhances user acceptance and market penetration of electric vehicle technology. These findings support the continued development and integration of electric vehicles into car-sharing fleets, highlighting their role in promoting sustainable urban mobility and reducing the reliance on private vehicles.
Another area of research on the car-sharing fleet concerns the consideration of vehicles in car-sharing systems and their impact on economic and social issues. For example, Hui et al. considered the impact of car-sharing on the willingness to postpone car purchases, indicating that 50% of respondents in the Chinese city of Hangzhou will postpone car-sharing by participating in car-sharing [38]. For comparison, Jochem et al., based on a survey conducted among car-sharing users in 11 European cities, found that car-sharing had a positive impact on the reduction of vehicles in cities, and one car-sharing vehicle is able to replace twenty individual cars [39]. For comparison, Jain et al., in their research of the Australian city of Melbourne, showed that residents of densely populated inner suburbs used a shared car to avoid or delay owning a car, while residents of the middle suburbs used car sharing to avoid buying a second car [40]. In turn, Liao et al., who conducted research in the Netherlands, obtained results showing that around 40% of the respondents’ car drivers indicated that they are willing to replace some of their private car trips with car sharing, and 20% indicated that they could abandon a planned purchase or lose a current car if car sharing becomes available near them [33,41].
The studies collectively show that car-sharing systems can effectively influence individuals’ decisions regarding car ownership and usage, which in turn affects the overall fleet size and composition. The research indicates that car-sharing can lead to a postponement or avoidance of purchasing personal vehicles. For instance, studies in cities like Hangzhou, European cities, and Melbourne demonstrate that car-sharing can reduce the need for individual car ownership. In densely populated urban areas, residents often use car-sharing to avoid or delay the purchase of a personal vehicle, while in suburban areas, car-sharing helps residents avoid buying additional cars. This dynamic directly impacts the size and composition of car fleets in these regions. Further, the studies reveal that one car-sharing vehicle can replace multiple private cars, significantly reducing the number of vehicles on the road. This reduction in vehicle numbers not only alleviates urban congestion but also decreases the overall environmental footprint. In the Netherlands, a substantial portion of drivers expressed willingness to replace some private car trips with car-sharing, and a notable percentage indicated they might forgo purchasing a new car or get rid of their current one if car-sharing options are readily available. These findings emphasize that car-sharing systems can contribute to more sustainable urban mobility by optimizing the fleet size and reducing the total number of vehicles needed. This reduction in fleet size helps lower emissions and promotes efficient use of resources, making car-sharing a viable strategy for addressing urban transportation challenges and fostering economic and social benefits in both urban and suburban environments.
Another area of research on the car-sharing fleet is the maintenance and operation of the fleet of cars. In this regard, research is undertaken on the technical condition of vehicles, the need for more frequent servicing of vehicles, or the replacement of parts. For example, Kubik et al. indicated the frequency of servicing the fleet [42]. In their work, the authors showed numerous irregularities related to insufficient servicing of vehicles, especially in the area of their daily servicing. Moreover, they emphasized the need to implement additional procedures to check the technical condition of car-sharing vehicles due to the multitude of drivers using cars [42]. In another of the works, attention was drawn to the issues of damage to vehicles that cars from car-sharing are subject to, and it was also indicated how the technical condition of vehicles affects the users [43]. Despite the importance of issues related to vehicle maintenance and their direct impact on the safety of both car-sharing users and the environment, this topic is not popular among research studies. In turn, Bruglieri et al. addressed their research on predictive maintenance and operational efficiency in car-sharing fleets [44]. The researchers utilized advanced data analytics and machine learning techniques to develop predictive models for vehicle maintenance [44]. By analyzing historical data on vehicle usage and maintenance records, the study created a framework for anticipating maintenance needs before failures occur [44]. The results showed that predictive maintenance could significantly reduce downtime and maintenance costs, leading to more reliable fleet operations and improved service availability [38]. Similar studies were performed by authors Tchorek and Targowski that focused on integrated fleet management and maintenance strategies for car-sharing systems [45]. The authors used an integrated approach that combined fleet management practices with proactive maintenance strategies [45]. They used a combination of statistical analysis and optimization techniques to develop a comprehensive management framework [45]. The results indicated that integrating fleet management with proactive maintenance could enhance vehicle availability, reduce operational disruptions, and lower overall maintenance costs [45]. This integrated approach ensures that car-sharing operators can maintain a high level of service quality while optimizing their operational expenditures. The reviewed studies highlight various methodologies and findings related to operational and maintenance issues in car-sharing fleets. Collectively, these findings contribute to a deeper understanding of how to enhance the efficiency, reliability, and sustainability of car-sharing systems through effective operational and maintenance practices.
The last of the thematic areas undertaken in the field of vehicle fleets in car-sharing are issues of car-sharing fleet selection. This topic was taken up by the author of the article in some scientific works, i.e., [46,47]. She noticed the problem of the research gap related to determining the type of vehicles depending on the type of car-sharing customers. Performing user segmentation, she conducted research for one of the operators operating on the Polish market. In addition, she also conducted research for people who currently do not use car-sharing systems to illustrate their preferences and, on this basis, develop recommendations that will help convince them of the idea of short-term car sharing. It is worth mentioning that the research conducted by the author was considering the implementation of a new type of vehicle fleet without considering the cars currently available within a given system. In this article, she proposes an approach that combines the selection of vehicles with the earlier determination of the utility of vehicles currently used in car-sharing systems. What is more, she connected the developed method to travel destinations and types of users. The developed method supports car-sharing operators that already exist and have specific types of fleets. By using it, it is possible to adjust the already owned cars to the needs of customers, but, if necessary, it is also possible to include a new fleet for implementation in the systems.
To sum up, the literature analysis shows that issues related to car-sharing vehicle fleets are the subject of the research interests of authors around the world. Importantly, however, in the current research, the authors mainly focus on issues related to the proper management of systems in terms of fleet volume and optimization of their operating zones and not on references to specific types of vehicles or their parameters used in fleets. Typically, these studies treat cars as essential travel instruments, but they often lack detailed guidance on the optimal composition of the vehicle fleet, only suggesting that such systems should include passenger or freight vehicles. Moreover, specific or general criteria that car-sharing vehicle models should meet in order to meet users’ expectations depending on the type of trip undertaken are rarely provided. The selection of appropriate vehicles is an integral part of companies’ dynamic management strategies [48], and the specific characteristics of these vehicles critically influence users’ perceptions [49].
Given that car-sharing services aim to foster the adoption of innovative forms of mobility, replace passenger car ownership, support the development of alternative forms of mobility in smart cities, and provide operators with the ability to provide efficient and cost-effective services, the functionality of the vehicle fleet is paramount. This need underlies the need for focused research on assessing car-sharing vehicle fleets in terms of their suitability for different user preferences and travel purposes. Referring to car-sharing, taking into account all the activities currently taking place in Europe aimed at its intensification, including initiatives and policies for sustainable transport, urban restrictions on individual motorization, or the upcoming transport revolution in terms of the ban on the sale of vehicles with combustion engines, there is a real need to improve systems to meet the needs of society, especially when it comes to their main element, which is offered in cars under them.
In order to attempt to meet these challenges, this article is devoted to presenting the methodology of the usability of a car-sharing fleet along with determining the composition of the car fleet to meet the diverse needs of system users. This article presents an innovative approach to the car-sharing fleet by filling the following gaps:
  • A theoretical gap, stemming from a scarcity of detailed studies on the utility of car-sharing fleets and the selection of appropriate vehicles, coupled with a lack of clear definitions for fleet requirements and parameters;
  • A methodological gap, characterized by the absence of standardized tools and methods for assessing the utility of car-sharing fleets;
  • An empirical gap, related to insufficient research and observations on how societies perceive car-sharing vehicles;
  • A practical gap due to the absence of tailored recommendations for car-sharing system operators.
This approach aims to provide actionable insights for both current and future car-sharing service providers in optimizing and modernizing their fleets, as well as for city authorities in choosing service providers whose fleets align with public expectations, especially to better develop the functioning of sustainable mobility systems in smart cities.
In line with the main objective of this article, specific novelty objectives have been delineated as follows:
  • Systematizing knowledge concerning the operation of car-sharing systems within urban transportation networks, spanning technical, organizational, economic, and environmental aspects;
  • Establishing indicators for the utilization of vehicle fleets in car-sharing systems,
  • Elucidating the purposes for using car-sharing services and the criteria for segmenting customers of such systems;
  • Formulating rules for calculating the overall utility of car attributes tailored to different customer segments of car-sharing services;
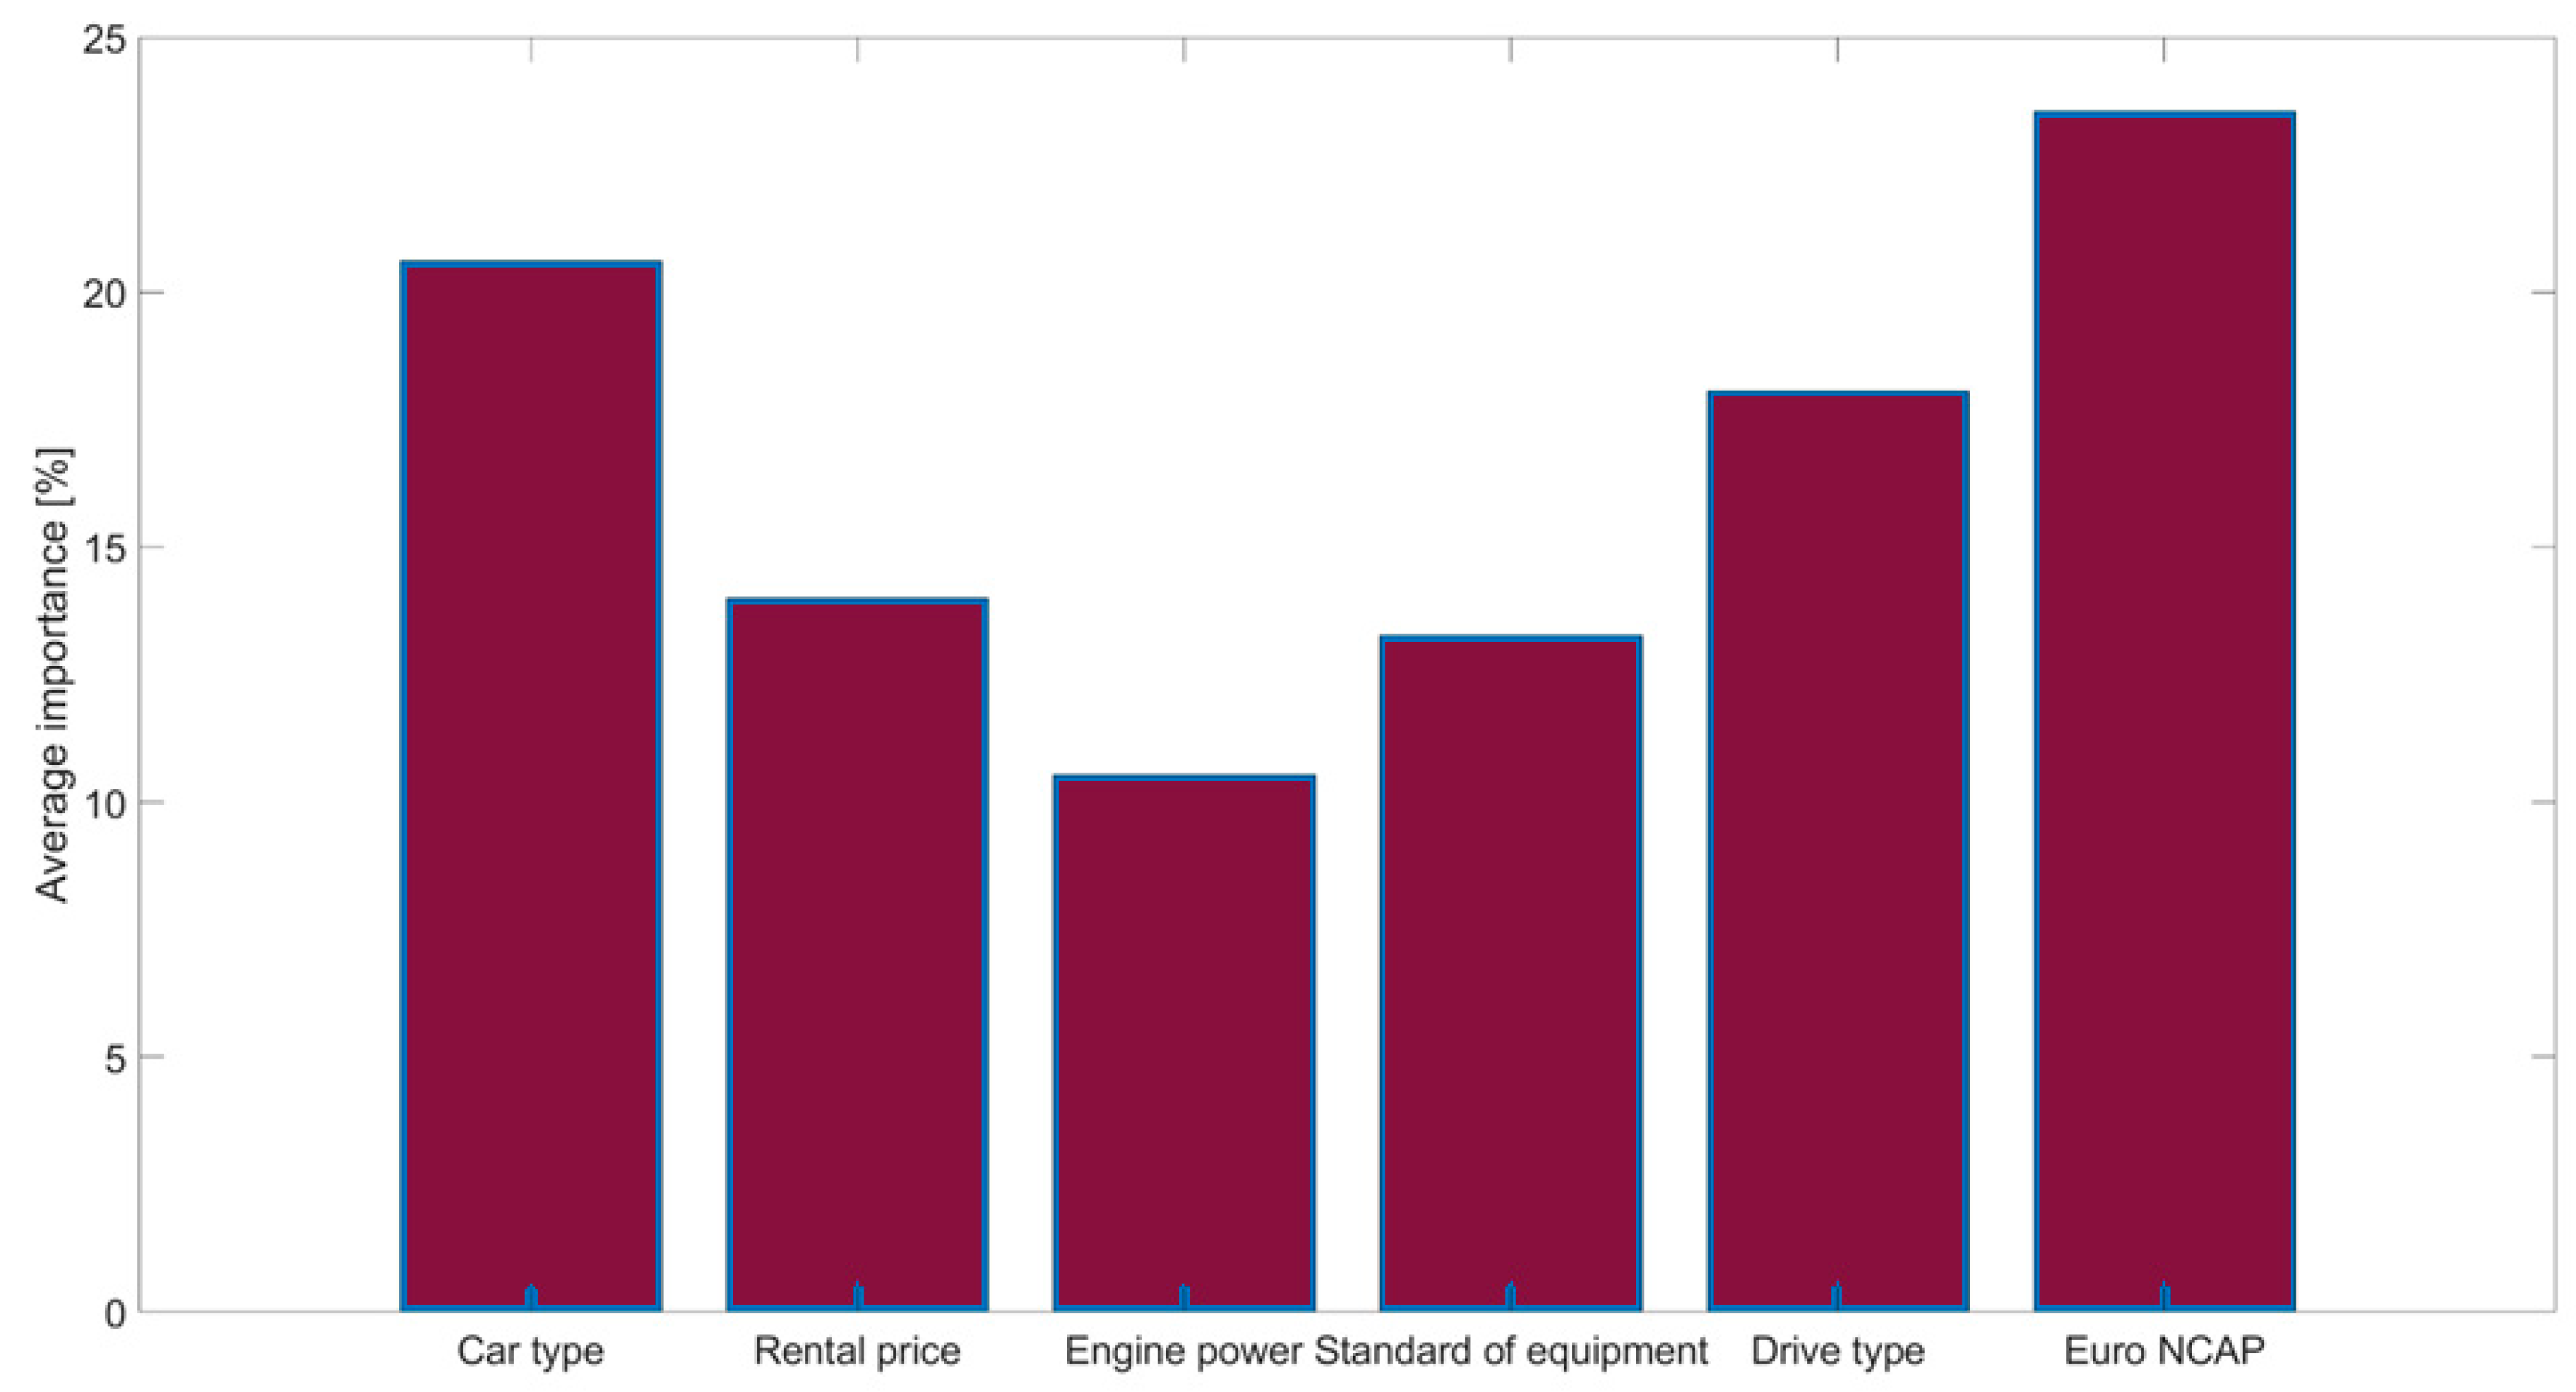
  • Assessing the relative importance of attributes in customer decisions when choosing car-sharing services based on specific vehicles;
  • Outlining the rules for the composition of vehicles in a car-sharing fleet;
  • Developing recommendations for the selection of vehicle fleets for car-sharing.
The structure of this article is organized around the main and specific objectives, adhering to established scientific writing conventions, including several key components: the main text, a summary, and a list of references. The main text comprises five chapters, each varying in theoretical, methodological, and empirical focus.
The first chapter introduces the genesis of the study, presents the car-sharing fleet review, its objectives, the research problem identified, and the scope and organization of the work. The second part introduces the author’s methodology for determining the utility and composition of a car-sharing fleet. It begins with a detailed explanation of the methodology’s assumptions and sequentially defines each stage of the method, from preparation through computation to the final stage. The third chapter presents a case study using the author’s methodology to determine preferences for vehicle features to achieve specific travel goals, showcasing detailed calculations and resulting recommendations for improvements to the current fleet. The fourth chapter presents a discussion of the obtained results, their applications, and their transferability to all of the shared mobility markets. The fifth and last part concludes the article, reflecting on future research directions in the field and presenting research limitations.

2. Methods

Vehicle fleets utilized in car-sharing systems are composed of cars that function as short-term transportation options for users. Thus, the vehicles offered should inherently possess a high level of utility, defined as the ability to meet user needs and provide satisfaction through the use of specific vehicle types within car-sharing systems. Despite the foundational economic discussions on the utility of goods or services initiated in the nineteenth century by the German economist H. Gossen [50], contemporary literature lacks precise recommendations for vehicle specifications in car-sharing services. In the absence of explicit guidelines for the implementation of specific car types within car-sharing fleets, operators are compelled to adopt diverse approaches to equipping their services. Observations indicate variability across the market: some fleets consist exclusively of compact urban vehicles that occupy minimal parking space, while others feature a diverse array of vehicle sizes and specifications, often with only a single vehicle representing an entire category. Additionally, some fleets are restricted to vehicles from specific manufacturers due to partnerships, and others comprise only specialized vehicles such as vans, which are suited for transporting goods. This lack of detailed guidance on fleet composition and functionality poses challenges for operators, who report underutilization of their fleets due to inconsistent and unpredictable usage patterns. Moreover, the absence of data on the specific purposes for which vehicles are employed results in some vehicles remaining idle within operational zones, thus not meeting the specific needs of certain customers. Recognizing these challenges, it is posited that the utilization of car sharing is a decision-making problem, encompassing the purpose of the rental and individual preferences regarding vehicle features. Consequently, a novel method has been proposed for assessing the utility of vehicles in car-sharing systems. This methodology integrates elements of transport modeling, concurrent analysis, and decomposition calculations performed using the R language to evaluate the operational efficiency of a car-sharing fleet.
Conjoint analysis is employed to classify and analyze consumer preferences within the realm of microeconomics [51]. It utilizes a decomposition approach to assess how respondents might react in specific situations, allowing for the collective consideration of data features [52,53]. By presenting respondents with various product or service profiles, defined by selected attributes, concurrent analysis facilitates the extraction of comprehensive preference information [51]. This method has been widely recognized for its application across various research fields, including mobility management [54], construction [55], and tourism [56]. However, its application to car-sharing system studies has not been previously documented.

Procedural Steps in the Methodology

In the first step of proposed methodology for assessing fleet utility and composition in car-sharing systems, the initial step involves gathering comprehensive information about the car-sharing operator for which the evaluation is intended. This includes conducting a thorough analysis of the car-sharing market in the relevant area, emphasizing the exploration of competing services and the variety of vehicles they offer for car-sharing.
Following this market overview, it is essential to detail the operational principles of the car-sharing operator, covering several key aspects:
  • The business model under which the car-sharing operator functions;
  • The operating model of the car-sharing service;
  • The geographic areas where the car-sharing service operates;
  • The pricing structure for vehicle rentals offered by the operator;
  • The types of rentals available.
The subsequent task in this phase is to meticulously prepare information about the characteristics of the vehicle fleet, designated as F V M C S , which the operator makes available for rental. This involves a thorough review and categorization of the fleet. The proposed method recommends classifying the vehicles according to one of the following systems:
  • EURO Car Segment, which categorizes vehicles into classes commonly used in Europe, such as passenger cars or vans, each designated for specific functions or characteristics [57],
  • EURO NCAP class, which defines vehicle sizes based on assessments by the European New Car Assessment Programme (EURO NCAP), an independent non-profit organization focused on vehicle safety, supported by various entities and some European government bodies [58],
  • US EPA Size Class, a system used predominantly in North America that categorizes vehicle sizes as defined by the Environmental Protection Agency (EPA), an independent U.S. federal agency charged with environmental protection [59],
  • A common colloquial classification used within the car-sharing community likens vehicle sizes to clothing sizes, making it easier for users to identify vehicles without the need to understand specific automotive classifications.
Subsequently, evaluating the utilization rate of the fleet and its specific categories is essential. To achieve this, it is critical to calculate the average number of vehicles rented over a specified period using Formula (1):
I A V c s = 1 t 1 t A N V C S T N V c s d t · 100 %
where
I A V c s —indicator of the average number of rented vehicles from car-sharing in a given period of time;
A N V c s —average number of rented cars in a given period of time;
T N V c s —total number of cars available in the car-sharing operator’s fleet.
Next, it is necessary to determine the indicator of the average number of rented vehicles in a given category, in accordance with Formula (2):
I A V C A T c s = 1 t 1 t A N V C A T c s T N V c s d t   · 100 %
where
I A V C A T c s —indicator of the average number of vehicles of a given category rented over a given period of time,
A N V C A T c s —the average number of cars in a given class rented over a given period of time.
The indicator of the average number of rented vehicles in a given category will make it possible to determine what type of vehicles are most or least frequently used in the fleet and will be an indication for the proper determination of the research objective of the analysis.
Then, the analyzed car-sharing service should be modeled. Car-sharing rental service S V C S will constitute a rental by a user S C S , specific type of car V M c s , attributes that characterize a given service A t C S with specific values called levels l C S , for a specified period of time T C S and a certain distance D C S , at the specified rental price P X C S and for a specific destination P u C S , which, according to the formal notation of the model, can be defined as (3):
S V C S = < S C S , V M c s , , A t C S l C S , T C S , D C S , P X C S , P u C S >
Any of the car-sharing services S V C S is a separate variant of vehicle rental V M c s , which is called a preference profile P P C S . Preference profile P P C S is defined by attributes A t c s . An attribute that can be a real object, phenomenon or process is defined by Formula (4):
A t c s = f ( X , , X m , ε r )
In this method, the attributes of the car-sharing service A t C S technical parameters defining each of the analyzed vehicles will be defined V M c s e.g., parameters related to its performance, size, or availability, but also e.g., a specific rental price. For each attribute A t c s for each attribute, specify its characteristics or ranges, called levels l c s . Attributes should be defined based on the fleet of vehicles available in a given system. Attributes and their levels will be used to define preference profiles P p c s . Preference profiles P p c s will be assessed by car-sharing users referred to as respondents. When selecting the number of attributes to be tested, follow Formula (5):
A t c s = A t c s R : 3 A t c s 10
In practice, the number of attributes included in conjoint analysis studies is usually limited to six. Note that selecting more than ten attributes would generate too many comparison profiles, which could be problematic for respondents. The number of levels for each attribute should be between two and five.
Based on the selected attributes and their levels, possible combinations of preference profiles should be developed. Preference profiles should be linked to the purposes of the trips that the user makes. The travel destinations P u c s should be adopted according to the analyst’s preferences as the types of travel types using car-sharing, assuming defined travel destinations or indicating their own, in accordance with Formula (6):
P u c s = P u v C S , v = 1 , n u C S ¯
where
n u C S —number of elements of the set of purposes for using car-sharing vehicles.
An example of building a combination of preference profiles is presented in Table 1.
The minimum number of preference profiles P u c s , to be created is given by Formula (7) [54]:
n P p c s n l n A t + 1
where
n P p c s —number of preference profiles assessed by respondents,
n l —number of levels for all attributes,
n A t c s —number of attributes.
Conversely, the maximum potential number of preference profiles that can be generated is the product of the levels specified for each attribute. When many attributes are considered, the resulting number of profiles may become too extensive for respondents to evaluate effectively, potentially leading to a reduced response rate [60]. To circumvent this issue, an orthogonal factorial design is recommended to reduce the number of preference profiles presented to respondents for assessment. This approach offers significant statistical advantages. Specifically, it eliminates the need to recalculate the estimates for the remaining parameters of the model if certain terms are omitted, provided that the measurements adhere to the orthogonal design specified for that model. For many models and measures of planning quality, orthogonal designs are considered optimal [61].
An orthogonal design facilitates the exploration of possible combinations of attributes and their levels (achieving maximum differentiation) while minimizing the number of preference profiles generated, often reducing them from several hundred to just a few possibilities [62]. Implementing an orthogonal design enables precise estimations of the so-called main effects, which are the impacts of individual attributes and their levels on the overall preference level for the service being analyzed. The creation of an orthogonal plan should ideally be performed using orthogonal coding within the R programming language.
Utilizing the established orthogonal plan, it is essential to verify the accuracy of the formulated preference profiles, removing any that are implausible, such as those involving a vehicle with a specific engine power that is incompatible with a given size or type of drive, among other inconsistencies. After the validation of the orthogonal plan, a social survey should be crafted. This survey will enable respondents to articulate their preferences by assessing each of the individual profiles.
To express users’ preferences, a rating scale is proposed, according to Formula (8):
P e v = 1 , , 6
where P e v —evaluation of a given profile, determined from the Formula (9):
P e v   = 1 = u n s a t i s f a c t o r y /   u n a c c e p t a b l e   p r o f i l e 2 = m e d i o c r e / p r o f i l e   b e l o w   t h e   m i n i m u m   c r i t e r i a 3 = s a t i s f a c t o r y / s u f f i c i e n t l y   a c c e p t a b l e   p r o f i l e 4 = g o o d / a c c e p t e d   p r o f i l e 5 = v e r y   g o o d   / v e r y   w e l l   a c c e p t a b l e   p r o f i l e 6 = e x c e l l e n t   /   t h e   m o s t   a c c e p t a b l e   p r o f i l e  
Respondents will assess individual preference profiles on a positional scale, where extreme values mean the least acceptable and most acceptable profiles for them, respectively. Please note that each respondent will be presented with the same set of profiles for evaluation.
Having defined preference profiles, it is necessary to create a research questionnaire that will be used to collect ratings from respondents. Ultimately, the respondents in this method should be users of the car-sharing system, as determined according to Formula (10). Purposeful selection should be used.
S C S = s 1 , , s 2 , , s 3 , , , n
where S C S —car-sharing users (respondents).
When defining the research sample, it is possible to focus on the total number of customers using the car-sharing system or on a specific segment of customers using the car-sharing system. The possibility of limiting the sample to a given customer segment is particularly desirable in a situation where the operator notices irregularities in the use of the fleet from the point of view of a specific type of person. It can be done in two ways. The first of them is the use of introductory questions in the questionnaire, which will indicate the frequency of use of car-sharing systems by users, and on this basis segmentation, of customers according to Formula (11):
Z c z = 1 t z d d t f o r t = 365 1 t z w d t f o r t = 54   [ h / year ] 1 t z m d t f o r t = 12
where
Z c z —frequency of using car-sharing services;
z d —number of daily rentals;
z m —number of monthly rentals;
z w —number of weekly rentals.
Based on the received frequencies, users should be segmented using Formula (12). The purpose of segmentation research is to isolate groups of user units (segments) that have certain common characteristics defined as non-users ( S N U ) , occasional users ( S O U ) , rare users ( S R U ) , frequent users ( S F U ) , regular users ( S R E G U ) .
S E G C S = 0 h / y e a r = > S N U 0 h / y e a r < 10 h / y e a r = > S O U 50 h / y e a r < 100 h / y e a r = > S R U 100 h / y e a r < 200 h / y e a r = > S F U > 200 h / y e a r = > S R E G U
where S E G C S —customer segments of car-sharing services. It is possible to use your own customer segmentation according to the analyst’s needs.
Next, indicate the percentage distribution of individual customer segments of a given operator in accordance with Formula (13):
P R E G U = 1 S S E G C S S c s 100 %
where P R E G U —percentage distribution of user segments.
To determine the number of respondents, the research sample should be defined. The minimum research sample size is presented by Formula (14):
S m i n = P ( α 2 · f 1 f ) P · e 2 + α 2 · f 1 f S c s S m i n
where
S m i n —minimum sample size in a social study;
P —the size of the population from which the sample is taken;
α —confidence level for the result;
f —fraction size;
e —assumed maximum error.
It is important to note that the values for the fraction size (f), which means the estimated proportion of the population that possesses the attribute of interest, and the maximum error (e), which is the margin of error, represent the maximum expected difference between the true population parameter and the sample estimate and should fall within the 0–1 range. Should the fraction size within the population be unknown, a default value of 0.5 is recommended. Regarding the confidence level (α), which represents the probability that the sample accurately reflects the population, one can incorporate the corresponding value from the normal distribution for the specified significance level into the formula; for instance, a 95% confidence level corresponds to a value of 1.96. This implies that with a randomly selected study group, there is a 95% probability that the actual population parameter will fall within this range. Literature suggests that for segmentation studies, which aim to determine the proportion of individual customers in the market and represent a subsequent phase of this methodology, a minimum sample size of 800 respondents is advisable [63]. Conversely, if the study pertains to a car-sharing system in the market with fewer users than the minimum sample size derived from Formula (14), the total number of users registered in that system may be considered the population size. However, it must be acknowledged that employing such a substitution method leads to a more deliberate sampling choice and could potentially impact the reliability of the research findings.
Once the respondent group has been established, the next step involves the execution of the research. Given the strong correlation between car-sharing services and online activities, it is advisable to carry out the survey via the internet. Utilizing the Computer-Assisted Web Interview (CAWI) method, which involves conducting an electronic public opinion survey, is recommended for this purpose. The CAWI method is utilized primarily in social and market research to allow respondents to answer surveys online [64]. The selection of the CAWI method was influenced by several factors [65,66]:
  • Wide geographic and demographic reach: CAWI enables access to a large number of geographically dispersed respondents, a feat challenging to achieve with traditional methods such as in-person or telephone interviews.
  • Cost reduction: The CAWI method is more cost-effective than traditional survey methods. Cost savings arise from the elimination of the need for interviewers’ physical presence, travel expenses, and lower data processing costs due to electronic collection and processing of responses.
  • Homogeneity and consistency of data: Online surveys ensure that all respondents receive questions in the same form and order, minimizing the risk of subjective errors by the interviewer in the formulation of questions and instructions.
  • Speed of data collection and processing: Data are collected in real time, allowing immediate analysis and application in ongoing decisions. This method eliminates delays typically associated with manual data entry found in paper surveys.
  • Increased response rates from specific demographic groups: Younger generations, who may find traditional research methods challenging, are more likely to participate in online surveys. This attribute makes CAWI particularly effective in researching new technologies or consumer trends, which is vital in studies on car-sharing services that leverage digital technologies.
  • Anonymity and respondent comfort: Online surveys can be conducted anonymously, encouraging more honest responses, particularly on sensitive topics. Additionally, respondents can complete surveys at their convenience, enhancing their comfort and willingness to participate.
Based on the answers received in the social survey, it is necessary to proceed with data analysis. In the first step, if the survey is addressed to all car-sharing users, analyses should be made in terms of customer segmentation and its percentage distribution in accordance with Formulas (12) and (13). If the study targets a specific customer segment, it should be checked whether the frequency of car-sharing use indicated by the users coincides with the data received from the operator. Next, it is necessary to analyze the travel distances covered by car-sharing vehicles. For this purpose, Formula (15) should be used:
Z k m = 1 t l k m d t   [ k m / y e a r ]
where
Z k m —distance covered by car-sharing users [km/year];
l k m —the number of kilometers traveled per unit of time.
Then, model estimation should be carried out. The purpose of a model estimation is to estimate the values of the levels of attributes, defined as the partial utilities of the levels of attributes. Partial utilities can be estimated for each respondent separately or as average values for the segment of the surveyed sample or the surveyed customers. Based on the Conjoint Analysis method, a linear multiple regression model should be formulated, whose parameters, i.e., partial utilities of attribute levels, are estimated using the classic least squares method. In the multiple regression analysis, the dependent variable assumes the values of the weights assigned by a given respondent to individual preference profiles obtained at the stage of social research. The impact of each level of individual attributes on the rating (weight) assigned to the profiles by a given respondent is considered by introducing artificial variables into the regression model. Create an additive conjoint analysis multiple regression model given by Formula (16) [52]:
Y = β 0 + k = 1 p β k A t C S k + ε
where
Y —the dependent variable whose values are the respondents’ preferences;
β 0 —model free expression;
β 1 , ,   β p —model parameters;
A t C S k —attributes describing the analyzed service profiles;
k = 1 , , p —attribute number;
ε —random component of the model.
Subsequently, the attributes describing the service profiles should be encoded using artificial variables that indicate the presence of specific levels of attributes in individual profiles. For this purpose, quasi-experimental coding should be used [16]. The coding aims to replace p attributes with new dummy variables expressed as X 1 , ,   X m . The number of artificial variables m is expressed by Formula (17) [61]:
m = k = 1 p l c s p
To encode all levels of a given attribute, the number of dummy variables 1 place higher than the number of levels of a given attribute is sufficient. An example of quasi-experimental coding is shown in Table 2.
After recoding the attributes, the conjoint analysis model with artificial variables should be written as (18) [52]:
Y ^ = b 0 + j = 1 m b j X j  
where
Y ^ —theoretical values of the explanatory variable;
b 0 —model free expression;
b 1 , , b m —model parameters;
X 1 , ,   X m —artificial variables representing levels of non-metric attributes;
j = 1 , , m —the number of the artificial variable.
This model is estimated at the aggregated level, i.e., across all respondents constituting the surveyed sample or a given customer segment. The model can also be expressed for a selected respondent, and then it uses Formula (19):
Y ^ = b 0 s + j = 1 m b j s X j
where s = 1 , , S —respondent number.
To calculate the model, due to the multitude of analyzes, it is proposed to use the R program package. The R program is an interpreted programming language and an environment for statistical calculations and visualization of results.
As a result of model estimation, the values of parameters b 0 , , b m are obtained, which are interpreted as partial utilities of attribute levels. Partial utilities of reference levels related to dummy variables omitted from the coding process are computed according to quasi-experimental coding principles. An example of how partial utilities are calculated for an attribute with three levels is presented in Table 3.
Partial utilities can be calculated at the aggregate or individual level for individual respondents. Knowledge of the partial utilities makes it possible to determine the utility of the total preference profiles that are the subject of the analyses. The total utility of the i-th profile for the s-th respondent is calculated according to Formula (20) [61]:
U P p s = j = 1 m U j l j i s + b 0 s
where
U P p s —total utility of the i-th preference profile for respondent s;
U j l i i s —partial utility of the l-th level of the j-th variable of the i-th profile for the respondent s.
The average total utility at the aggregate level for the entire sample of respondents and for the i-th profile should be calculated from Formula (21) [61]:
U P p = 1 S s = 1 S ( j = 1 m U j l j i s + b 0 s )
Knowledge of partial utilities also enables estimation of the relative importance of each attribute in the assessment of profiles. The relative importance of the j-th attribute for the s-th respondent should be determined from Formula (22):
W A t C S j s = m a x l j U j l j s m i n U j l j s j = 1 m ( m a x l j U j l j s m i n U j l j s ) · 100 %
Partial utilities determine the relative contribution of particular levels of attributes to the total utility of preference profiles [52]. This means that the higher the value of partial utilities, the higher the level of a given attribute is preferred by the respondents [61].
The average importance of individual attributes across the entire sample of respondents W A t C S j should be calculated from Formula (23):
W A t C S j = 1 S s = 1 S W A t C S j S
The obtained results can be sorted depending on the frequency and distance of vehicle use by car-sharing users.
Having determined the utility of individual attributes concerning the fleet of vehicles depending on the destinations of the trip, the analysis is completed at this stage, and the resulting conclusions regarding the characteristics of the operator’s current fleet of vehicles can be presented.

3. Results

The developed method was implemented for a case study of a car-sharing service provider offering the possibility of short-term vehicle rentals in the German capital, Berlin. In the case of the analyzed car-sharing system, it is currently one of the ten available in Berlin. The German car-sharing operator market is currently considered the largest market for short-term car rental services in Europe [67]. As of 1 January 2023, there were 4,472,800 users registered in car-sharing schemes in Germany [68]. The number of vehicles offered in car-sharing increased by 12.4 percent over the same period to 33,930 vehicles available for rental [68]. At the turn of 2022/2023, 1082 cities and municipalities had car-sharing systems offered in Germany [68]. This amounts to 147 more locations than in the previous year [68]. New car-sharing offers have since appeared, especially in smaller towns and communities in rural areas. Currently, 925 locations with less than 50,000 inhabitants in Germany offer car-sharing services [68].
The German car-sharing capital is Karlsruhe, with 4.34 car-sharing vehicles per 1000 inhabitants. Munich (2.02), Berlin (1.98), and Hamburg (1.89) are ranked second, third, and fourth, respectively [68].
A very large selection of car-sharing services is available in the Berlin area. Ten operators currently offer their systems on a B2C and B2B basis. Among the operating models, the most common are free-floating or a hybrid model combining free-floating with base models. Among the car fleets available in car-sharing systems, there are many vehicle models, from class A to vans. Due to the very strong market competition, operators are forced to constantly monitor their services and improve them to reach as many customers as possible. In the case of the analyzed car-sharing system, it is currently one of the ten available in Berlin. The detailed characteristics of the analyzed car-sharing system are presented in Table 4.
The operator currently has 10 vehicle models (5 models of small vehicles, 2 models of medium vehicles, and 3 models of large vehicles). The operator provided rental data for the last year ( t = 365 ). On their basis, the indicator of the average number of rented vehicles from car-sharing on an annual basis following Formula (1) was determined.
I A V c s = 1 t 0 t A N V C S T N V c s d t 100 % = 1 t   A N V C S   t T N V C S 365 0 = 1 365 405 365 647 0 = 62.60 %
Then, the average number of rented vehicles in a given category was determined according to Formula (2):
I A V C A T c s s m a l l = 1 t 0 t A N V C A T c s s m a l l T N V c s d t 100 % = 1 t   A N V C A T c s s m a l l   t T N V C S 365 0 = = 1 365 139 365 647 0 = 21.48 % I A V C A T C S m e d i u m = 1 t 0 t A N V C A T c s m e d i u m T N V c s d t 100 % = 1 t   A N V C A T c s m e d i u m   t T N V C S 365 0 = = 1 365 212 365 647 0 = 32.77 % I A V C A T c s l a r g e = 1 t 0 t A N V C A T c s l a r g e T N V c s d t 100 % = 1 t   A N V C A T c s l a r g e   t T N V C S 365 0 = = 1 365 54 365 647 0 = 8.35 %
Based on the indicators, it was determined that, among rentals, there is a problem of uneven distribution for rentals of specific sizes of vehicles, indicating that small and large vehicles account for 47% of all vehicles rented annually. While the medium class accounts for 53% of all rented vehicles annually.
This only underscores the need for a further detailed analysis of these classes of vehicles.
Based on their own customer data, the operator determined that the greatest problems related to the uneven distribution of vehicle rentals occur among occasional users (   S O U ) i.e., people using the systems for up to 10 h a year. The operator’s intention is to find out the answer to the question of whether the fleet currently used in the system meets the expectations of customers who occasionally use these systems. The operator’s goal is to encourage occasional customers to rent more often within the scope of the offered system and to cause a more even use of all types of the offered fleet.
The defined research problem addressed here is P6: the problem of underutilization of a fleet of vehicles by a specific customer segment.
Then, a goal was defined, from the point of view of which the Conjoint Analysis was carried out, which included: P u 1 C S —using a car-sharing vehicle for commuting to work (including dealing with professional matters and travel to business meetings as business daily trips) or commuting to a place of education (e.g., school, university, etc.),
Subsequently, six attributes ( A t c s = 6 ) were selected, which were considered during the detailed utility analysis of the car fleet. The attributes and their individual levels were defined directly based on the fleet of vehicles offered by the analyzed operator. A detailed list of the included attributes and their levels is presented in Table 5.
Following the attributes and their levels that will be taken into account in the analysis being defined, an orthogonal plan was created to determine the preference profiles. Sequentially repetitive and impossible combinations of preference profiles were removed, which allowed for the generation of thirteen preference profiles, which were then used to create the research questionnaire. The orthogonal plan is presented in Table 6.
Having developed an orthogonal plan, it was checked in accordance with Formula (7) to see whether it meets the condition of the minimum number of profiles that can be taken into account.
n P p c s n l n A t + 1
13 18 6 + 1 condition fulfilled
Subsequently, a social research questionnaire was created, a part of which is shown in Appendix A.

3.1. Computational Stage for the Analyzed Case Study

The survey was conducted from 1 January 2022 to 30 June 2022. Among the occasional users of the car-sharing operator. The car-sharing operator for whom the research was carried out displayed a link to the survey in the application addressed to people who use the systems occasionally, i.e., whose frequency of using car-sharing is in the range of 0 h/year < 10 h/year, according to Formula (12). According to the assumptions, the research was carried out for a service available to users in Berlin, Germany. study according to the proposed methodology was carried out using the CAWI.
The number of respondents in the research sample was defined based on Formula (14):
S m i n = P ( α 2 · f 1 f ) P · e 2 + α 2 · f 1 f = 83200000 ( 1.96 2 · 0.5 1 0.5 ) 83200000 · 0.03 2 + 1.96 2 · 0.5 1 0.5 = 1067
In total, 1571 participants contributed to the survey. The data collected indicate that the majority of users of the car-sharing system in Berlin are male, making up 73.45% of the surveyed individuals, while women represent 26.54%. This reaffirms the commonly held belief that car-sharing users are predominantly male. In terms of age distribution, the largest portion (53.21%) falls within the young adult bracket of 18 to 25 years old. The following age group, from 26 to 35, comprises 25.65% of the respondents, and the subsequent group, aged 36 to 45, accounts for 2.54%. The least represented demographic includes individuals aged 46 and above, collectively constituting less than 5% of the respondents. Regarding residency, participants hail from both cities with populations exceeding 250,000 and those with populations below that threshold, potentially indicating proximity to or residence in Berlin. The majority of respondents are employed, comprising 43.98%, or students, amounting to 35.77%. Conversely, the unemployed and retirees constitute the smallest segments, at 1.65% and 1.15% of respondents, respectively. Concerning marital status, the largest proportion of respondents are single, at 65.05%, followed by 34.25% who are married, with only 0.70% being divorced. Notably, the largest income bracket consists of individuals earning below EUR 1500 per month, encompassing 33.86% of respondents. Subsequently, those earning between EUR 1501 and EUR 2500 are the next largest group. The wealthiest individuals, earning over EUR 4501 monthly, comprise the smallest segment, at 18.20%. In terms of education, respondents predominantly possess secondary education (49.78%), followed closely by those with higher education (44.94%). Individuals with lower educational attainment, such as basic vocational, junior high school, and basic education, represent a smaller portion of respondents, at 2.23%, 2.86%, and 0.19%, respectively. Table 7 provides a comprehensive overview of the demographic characteristics of the survey participants.
Next, for model estimation, a regression model was determined for the analyzed example. In the analyzed example, there are six attributes with three levels. Thus, eighteen artificial variables were introduced into the multiple regression model, yielding the following:
Y s ^ = b 0 + b 1 X 1 + + b 12 X 12
where
b 1 , , b 12 —regression equation parameters;
b 0 s —free expression;
X 1 , , X 12 —artificial variables.
Based on the multiple regression formula and using R language programming, the importance of individual attributes was defined for each of the preference profiles in light of the analyzed purpose of using car-sharing, and the utility values of the attributes for the purpose were calculated. Then, the results of the importance and usefulness of individual attributes were discussed in detail.

3.2. Research Results for the Purpose of Using a Car-Sharing Vehicle for Commuting to Work or to a Place of Education

Analyzing the results at the aggregate level for the first of the implemented goals, i.e., commuting to work (including dealing with professional matters and travel to business meetings as business daily trips) or commuting to a place of education (e.g., school, university, etc.), stated that for the respondents, the key attribute turned out to be the safety of the vehicle (23.54%), followed by the size of the car (20.60%) and the type of engine used in it (18.06%). The rental price (14.00%) and the standard of equipment (13.26%) were at a similar level. In turn, the least important issue turned out to be car engine power (10.54%). A detailed distribution of the average importance of attributes is presented in Figure 1.
Moving on to a detailed analysis of the usefulness of individual attributes, for most of the respondents, the best choice is a large car, i.e., representing class D or E of vehicles; for the rest, however, it is a small car representing class A or B. What is important is that medium-class cars, i.e., C-class cars, are not preferred by the respondents. It is worth emphasizing that, referring to the current fleet of the operator, most of the vehicles are small cars, which may translate into an insufficient number of large-size cars, especially when renting them during peak hours, when commuting to work or school is usually carried out. This is an important lesson for the operator regarding the composition of his fleet. Detailed utility values are presented in Figure 2.
From the point of view of the price of renting a car for commuting to work or school, the rental cost should be between EUR 0.40 and EUR 0.60 per km. Other price ranges are not considered by the respondents at all when achieving the indicated goal. These results provide important insights into the operator’s current list of prices, which currently does not offer any large vehicles priced from EUR 0.40 to EUR 0.60. This may be one of the key reasons why respondents occasionally use the operator’s vehicles for commuting to work or school. This result is a valuable clue to the need to make changes to the current price list of services. A detailed utility distribution is presented in Figure 3.
From the point of view of the engine power that vehicles for commuting to work or school can be equipped with, the users indicated that a vehicle with an average engine power, i.e., in the range of 63 to 149 kW, would be the most preferred. Few respondents could accept a car with a power of 40 to 62 kW. Interestingly, vehicles with engine power above 150 kW were not preferred. What is important, however, is that the utility values of this type of attribute are at a very low level, which means that it is not a leading attribute when choosing a car for commuting to work or school. The distribution of individual utilities is presented in Figure 4.
Moving on to a detailed utility analysis of the equipment standard, it should be stated that the respondents’ preference is the average vehicle's equipment. What is important is that the remaining vehicle equipment levels are not preferred by the respondents. This indicates that the respondents, when looking for a car for work, focus on an averagely equipped vehicle that provides relative travel comfort. The distribution of individual utilities is presented in Figure 5.
Regarding the type of drive, from the point of view of the type of drive of the vehicles offered for commuting to work or school, the respondents prefer a vehicle with a combustion engine or possibly a hybrid drive. An electric car is not preferred. These results may indicate a greater trust of respondents in vehicles with known types of engines and a possible fear of insufficient energy in the battery of an electric vehicle, which could result in the need to return it by connecting it to a charging station, for which people commuting to work or school may not have time, especially during peak hours. The distribution of individual utilities is presented in Figure 6.
Considering the level of vehicle placement in the Euro NCAP ranking, respondents indicated that their preference is medium to high, at three to four stars, followed by five-star cars. Respondents therefore value medium- to high-safety cars, completely excluding cars with the lowest star value in the Euro NCAP rating. The distribution of individual utilities is presented in Figure 7.
To sum up, according to the preferences of respondents who occasionally use car-sharing systems, when commuting to work or school, the vehicle that would best meet the expectations of most users would be a large car, equipped with a combustion engine with a power of 63 to 149 kW, equipped with at least parking sensors, navigation, handsfree, lane assistant, heated seats, and a Euro NCAP star rating of at least 3 and above, offered at the lowest possible rental price.

4. Discussion

The analysis conducted on preferences regarding car-sharing for commuting to work or school revealed a multitude of insights essential for understanding user behaviors and shaping the future of transportation in smart cities. Safety emerged as the predominant concern among respondents, indicating a collective consciousness towards secure mobility solutions within urban environments. This sentiment aligns seamlessly with the overarching goals of smart cities, where safety and sustainability are paramount.
In tandem with safety, the size of the vehicle emerged as a crucial factor, reflecting the diverse needs of commuters navigating urban landscapes. Referring to the obtained results and comparing them to the fleet of vehicles offered by competitors in the car-sharing market in Berlin, it is evident that market-leading operators are shifting towards a reduced share of small cars. This trend aligns with the findings of our study and current market trends. Additionally, statistical data on new car purchases by individuals in Germany in 2022 shows a preference for medium-sized cars (class C), which coincides with the optimal solutions identified in our analyses.
These correlations suggest that the study’s results, although based primarily on feedback from young respondents, are broadly applicable due to their alignment with prevailing market trends. The preferred car models, aside from those chosen for testing vehicles or systems, are medium-powered cars with ample seating and luggage capacity, making them suitable for a wider demographic, including families or individuals requiring extra luggage space.
The obtained results are a solution to the problem of underutilization of a vehicle fleet by users occasionally using car-sharing systems. It can therefore be concluded that the currently owned fleet does not fully meet the requirements of its utility for customers occasionally using car-sharing and requires reorganization. The results of the developed tests were presented to the operator, and changes in the fleet are planned for the second half of 2023.
A practical application of the method was presented as a case study of the German operator of car-sharing services, for which the analyses were made. The results allowed for the current fleet assessment, the development of conclusions regarding the owned vehicles, and recommendations regarding the possibility of their improvement. The case study made it possible to test the developed method on a real-market example of an operator providing car-sharing services and to demonstrate its feasibility.

4.1. Transferability of the Results to the Shared Mobility Market

Thus, it is essential to consider the extent to which the findings from the Berlin case study can be generalized to other cities or regions with different demographic, cultural, and geographic characteristics. The transferability of this framework and its findings to diverse contexts should be carefully discussed, highlighting the implications for practitioners and policymakers beyond Berlin. This discussion will help in understanding how the observed trends and preferences might manifest in varied environments and guide strategic decisions in car-sharing and urban mobility planning.
The importance of engine type and rental pricing further accentuates the significance of affordability and environmental consciousness within the context of smart cities. As hubs of innovation and sustainability, smart cities prioritize the adoption of eco-friendly transportation solutions [69,70,71]. Thus, car-sharing operators must not only offer competitively priced services but also ensure a balance between cost-effectiveness and environmental impact, aligning with the ethos of smart urban development.
Delving deeper into user preferences, the significance of vehicle power and equipment standards underscores the importance of user experience and comfort. In the context of smart cities, where seamless connectivity and user-centric design are fundamental principles [72,73,74,75], car-sharing operators must prioritize the integration of advanced technologies and amenities that enhance the overall commuting experience. By leveraging data-driven insights and predictive analytics, operators can optimize fleet composition and service offerings, thereby fostering greater user satisfaction and loyalty.
Moreover, the preference for specific drive types reflects evolving attitudes towards mobility and energy consumption in smart cities. While traditional combustion engines remain prevalent, the growing interest in hybrid drives signifies a gradual shift towards more sustainable transportation options. In this regard, smart cities serve as catalysts for innovation [76], driving the adoption of electric and alternative fuel vehicles to mitigate environmental impact and promote cleaner, greener urban mobility solutions.
The findings from the Berlin car-sharing study provide valuable insights that can support and enhance the development of various shared mobility services. Safety as a primary concern is critical across all forms of shared mobility. Laa and Leth [77] found safety to be significant in the adoption of e-scooters in Vienna, and Jie et al. [78] emphasized its importance in Australia. These findings suggest that maintaining high safety standards is essential for building user trust in any shared mobility service.
Vehicle size and comfort are also crucial, as highlighted by Öztaş Karlı et al. [79] in Turkey and Soltani et al. [80] in Adelaide, who found user preferences for larger, more comfortable vehicles in e-scooter and ridesharing services, respectively. This aligns with the Berlin study’s recommendations for medium-sized cars, suggesting that shared mobility services should consider these preferences to meet user needs effectively.
Sustainability is a key driver for shared mobility, supported by findings from Nikiforiadis et al. [81] on MaaS platforms and Efthymiou et al. [82] on vehicle sharing systems. The Berlin study’s call for more hybrid and electric vehicles is consistent with these trends, promoting eco-friendly transportation solutions that meet regulatory and consumer demands for sustainability.
Advanced features and user-centric design are essential for enhancing the shared mobility experience. Aguilera-García et al. [83] found that technological features significantly influence e-scooter usage in Madrid, while Turoń et al. [84] highlighted the importance of visual communication and technology in smart cities. The Berlin study’s focus on integrating advanced features aligns with these findings, suggesting that such innovations can improve user satisfaction and service appeal.
Flexible pricing strategies, as discussed by Aifadopoulou et al. [85], and the economic opportunities highlighted by Jonek-Kowalska and Wolniak [86], are crucial for optimizing shared mobility services. The Berlin study’s recommendations for dynamic pricing mechanisms align with these insights, indicating that adaptable pricing models can enhance service competitiveness and utilization.
The policy implications from the Berlin study are broadly applicable. Öztaş Karlı et al. [87] emphasized the need for regulatory frameworks ensuring safety, affordability, and sustainability. Jie et al. [78] and Standing et al. [88] also highlighted the importance of supportive policies in Australia. By adopting similar policies, other shared mobility services can promote more efficient, sustainable, and user-centric urban transportation systems.
Additionally, the work by D’Andreagiovanni et al. [89] on the service coverage and regulation of e-scooter sharing in Rome highlights the necessity of robust regulatory frameworks to manage shared mobility services effectively. Carrese et al. [90] also emphasize the importance of optimizing public infrastructure, such as parking slots, to support car-sharing services. These studies further underscore the relevance of the Berlin study’s findings and implications for broader applications in urban mobility planning. Patel et al. [91] further highlight that socio-economic factors significantly influence the adoption of electromobility solutions, which supports the emphasis on affordability and environmental impact in the Berlin study.

4.2. Research Implications

The specific implications for the development of car-sharing systems in smart cities, derived from the analysis results, are as follows:
(1)
Fleet Optimization:
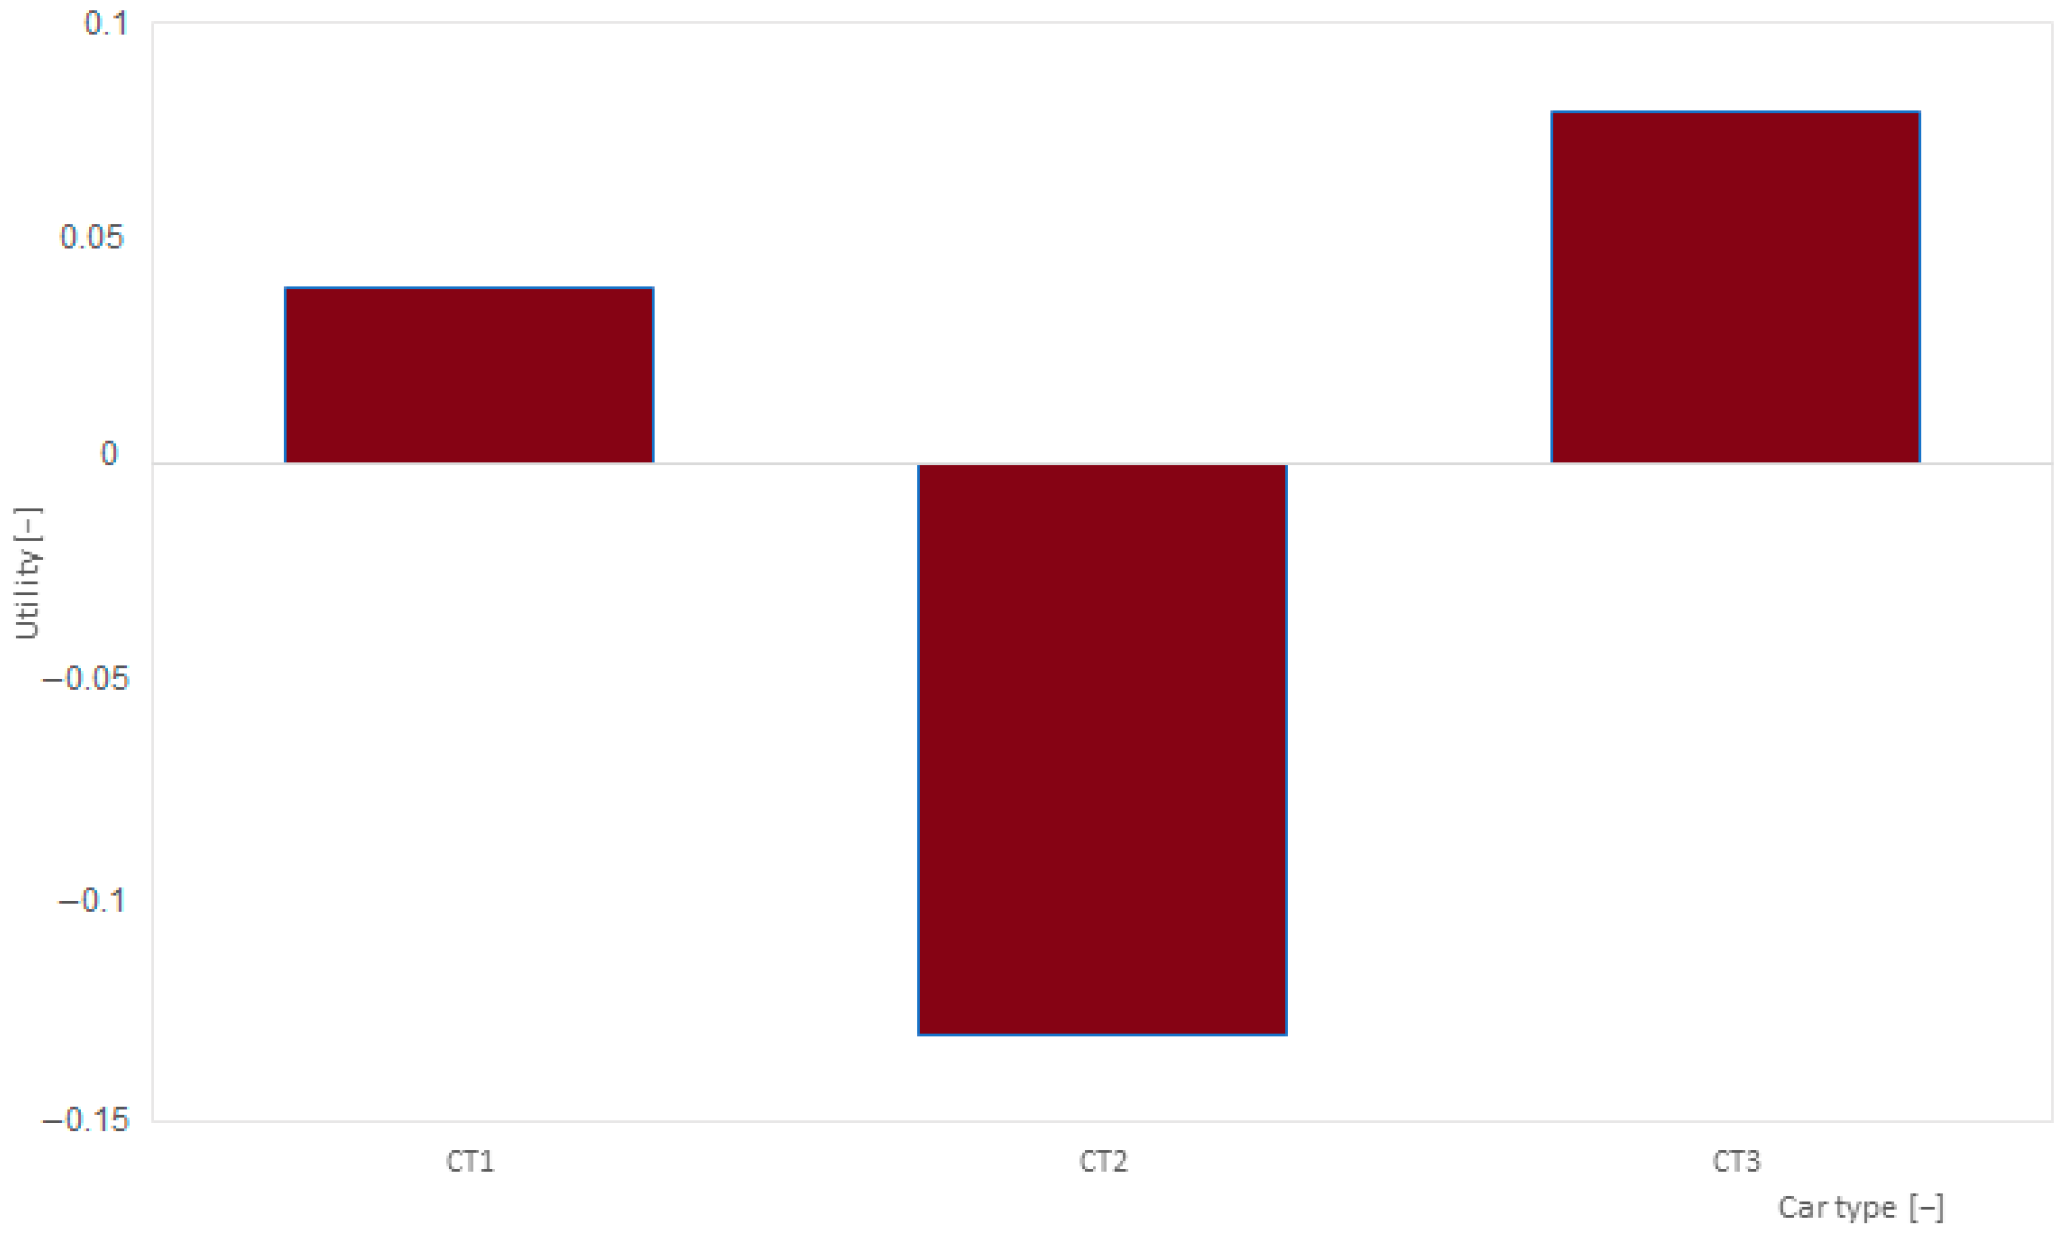
  • Expansion of the vehicle fleet to include a greater proportion of class D and E vehicles to accommodate user preferences for enhanced travel comfort and versatility.
  • Strategic planning to ensure an adequate supply of larger vehicles during peak commuting hours to meet demand fluctuations effectively.
(2)
Flexible Pricing Strategies:
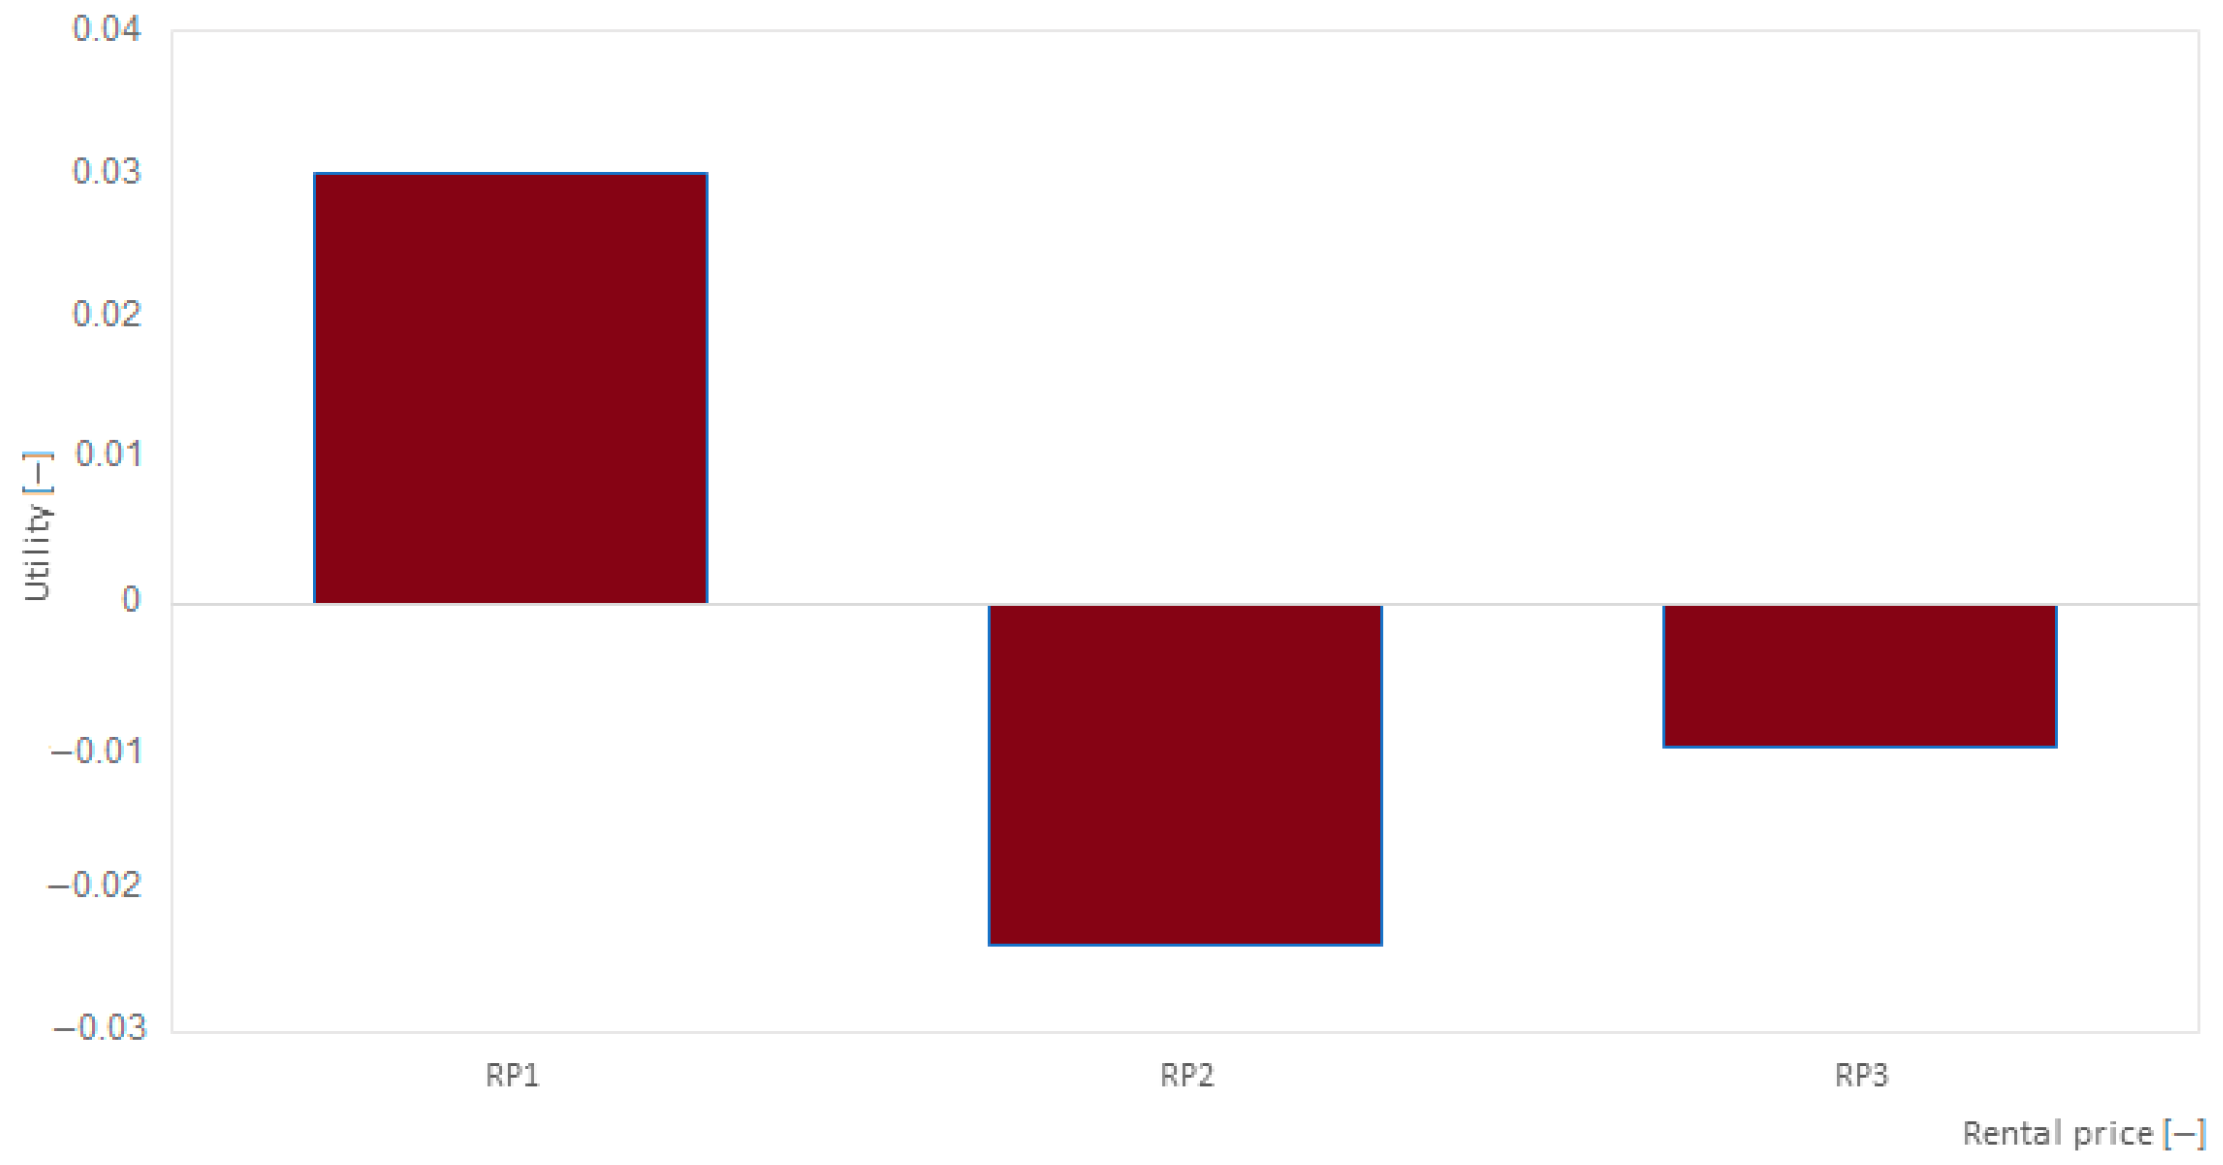
  • Implementation of dynamic pricing mechanisms to align rental costs with user expectations, particularly in terms of per-kilometer pricing, ideally falling within the range of EUR 0.40 to EUR 0.60.
  • Consideration of flexible pricing structures to offer competitive rates during peak demand periods, thereby enhancing service appeal and utilization.
(3)
Integration of Sustainable Mobility Solutions:
  • Promotion of sustainability by increasing the deployment of hybrid and electric vehicles within car-sharing fleets, reflecting a growing consumer preference for eco-friendly transportation options.
  • Investment in the expansion of electric vehicle charging infrastructure across smart city networks to facilitate widespread adoption and accessibility of environmentally conscious mobility alternatives.
(4)
Enhancement of Vehicle Features:
  • Upgrading vehicle specifications to meet user expectations for comfort and convenience, including the integration of advanced technologies and amenities such as navigation systems and internet connectivity.
  • Adoption of a user-centric approach to vehicle design and outfitting to ensure optimal user experience and satisfaction.
(5)
Educational Initiatives and Marketing:
  • Implementation of educational campaigns to underscore the societal benefits of car-sharing in smart cities, emphasizing reductions in traffic congestion, carbon emissions, and transportation expenses.
  • Promotion of a culture of resource sharing in transportation as a cornerstone of sustainable urban development, fostering increased public awareness and acceptance of car sharing as a viable mobility solution.
(6)
Policy implications:
  • The emphasis on safety as the dominant issue among respondents emphasizes the need to introduce strict regulations and safety standards for car-sharing vehicles. Decision-makers should prioritize checking the technical condition of vehicles and require daily maintenance of vehicles to eliminate possible irregularities before using users’ cars. Ensuring that shared vehicle fleets meet high safety standards will be consistent with the overarching goals of smart cities to provide safe mobility solutions.
  • Users’ preference for larger vehicles highlights the need for consultation between area operators to validate their fleet composition. Moreover, this indicates that it is also necessary to develop policies specifying the principles of fleet selection to meet the expectations of individual user groups. This type of procedure will make the use of car-sharing services a real transport option for those interested and will meet their needs.
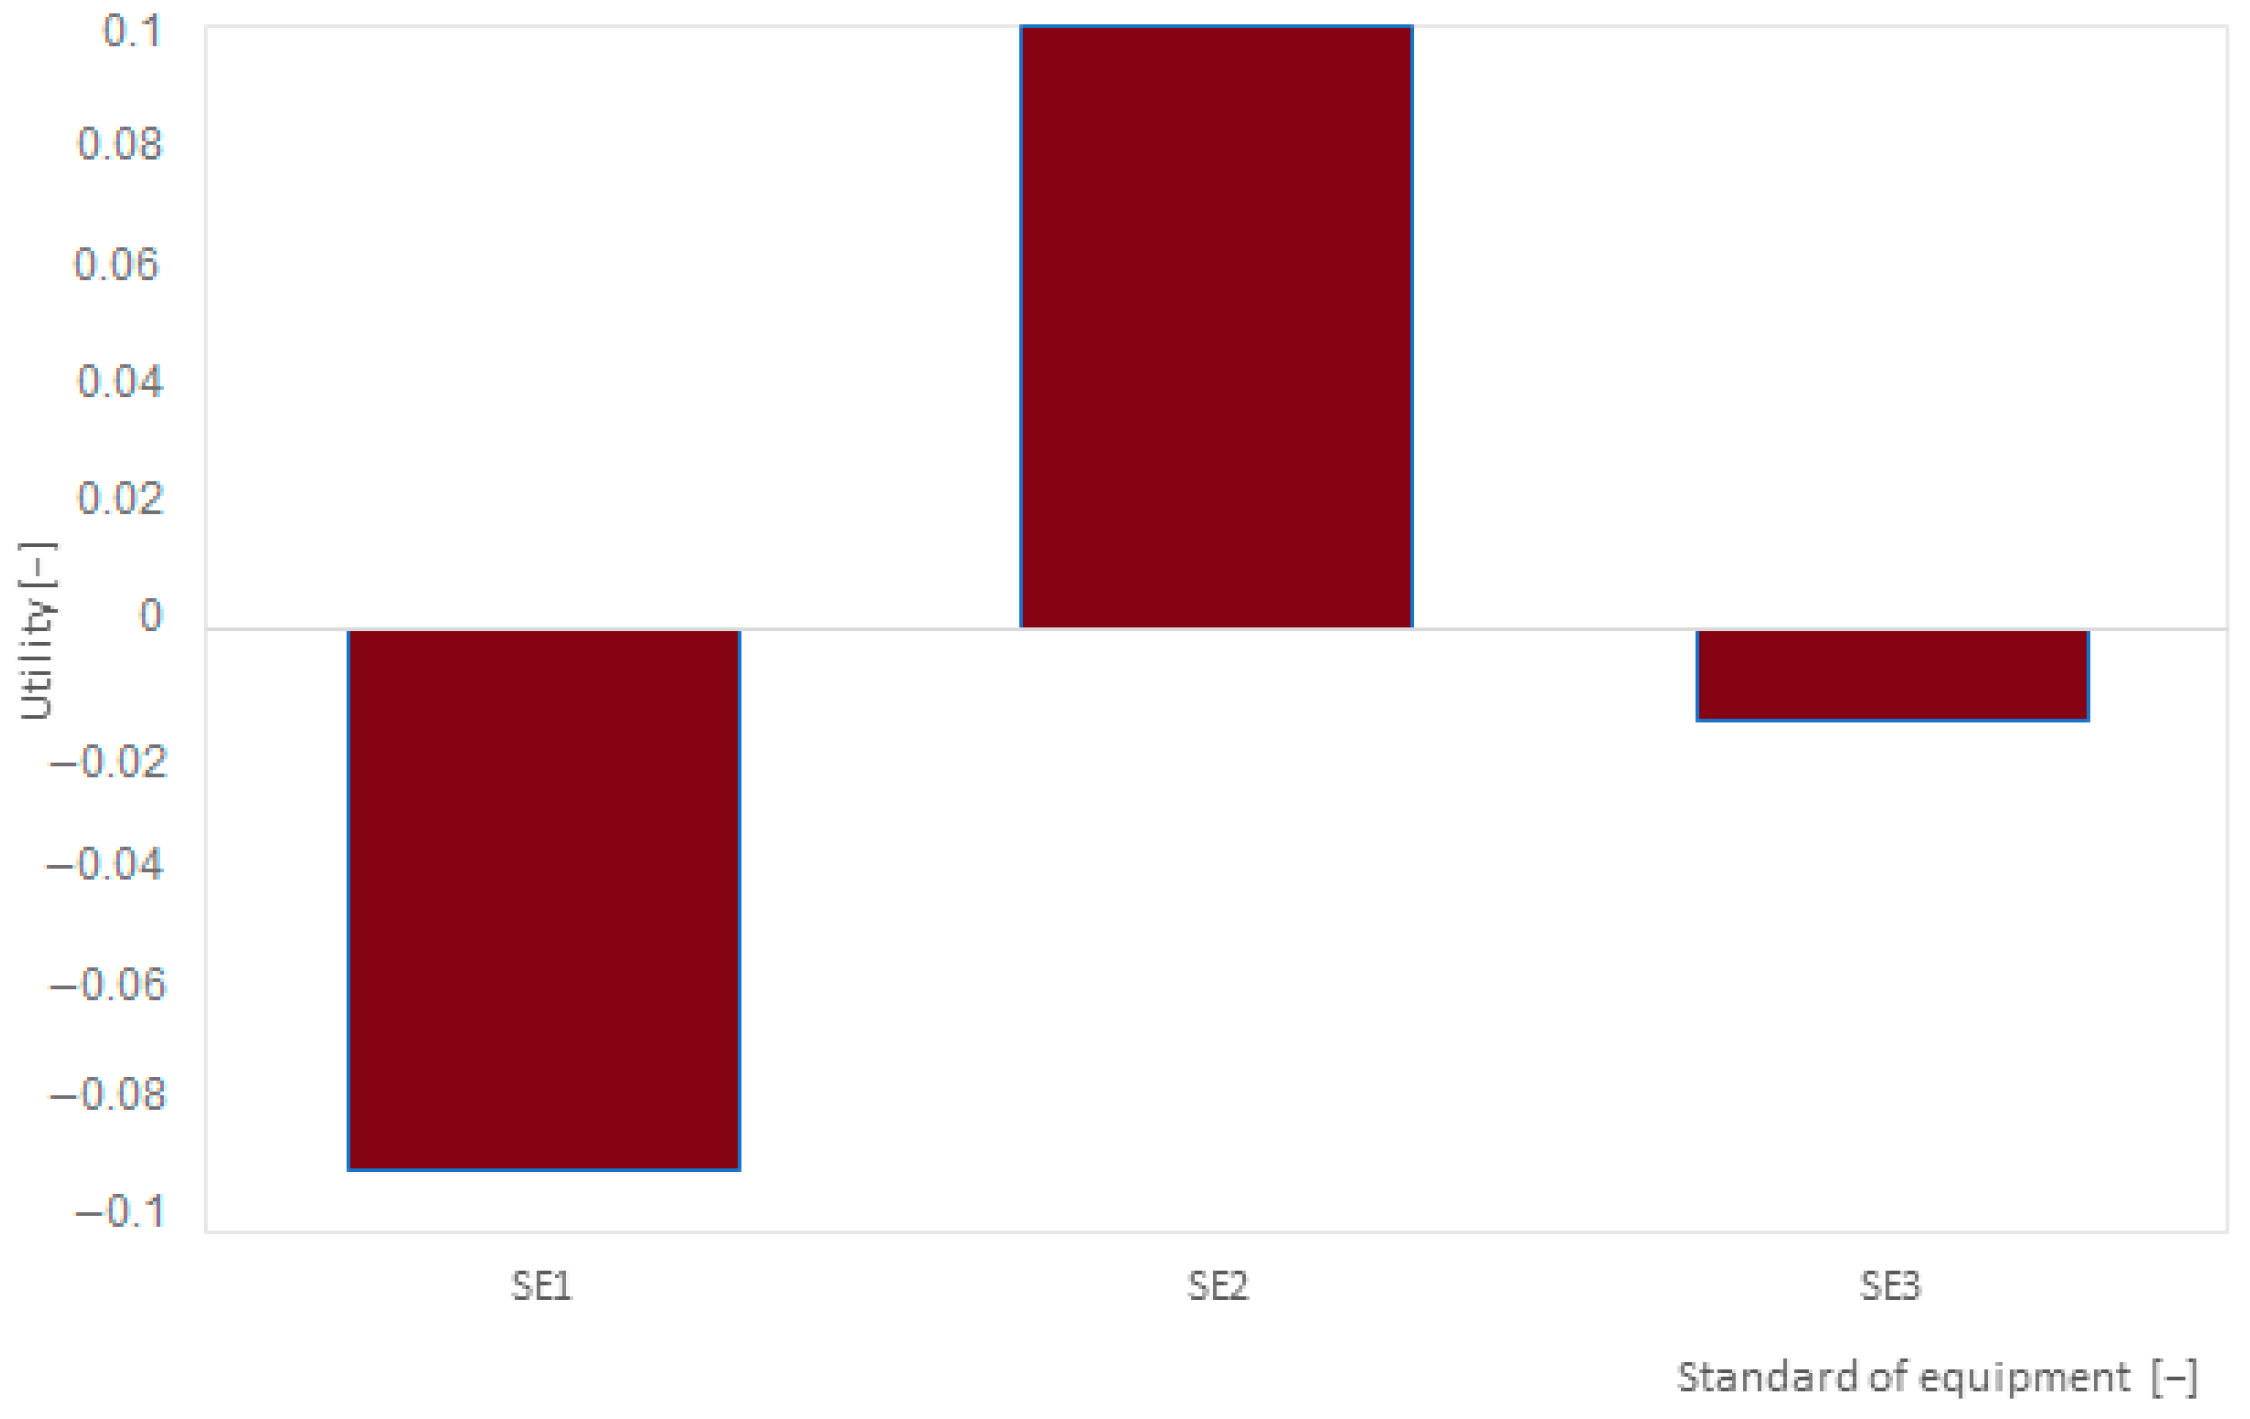
  • Findings regarding the importance of the level of vehicle equipment standards indicate the importance of integrating advanced technologies and amenities in car-sharing cars. This type of preference is consistent with the general assumptions of smart cities and may contribute to their even faster development.
  • The importance of rental prices highlights the need for policies that balance affordability with environmental awareness. Policymakers should promote pricing strategies that make car-sharing services competitively priced with individual car use, while encouraging the use of environmentally friendly transportation options. Incentives for hybrid and electric vehicles in car-sharing fleets can accelerate the transition to sustainable urban mobility, in line with the ethos of smart urban development.
By heeding these implications, car-sharing operators can methodically tailor their services to align with user preferences and meet the evolving mobility needs of smart city inhabitants, thereby contributing to the creation of more sustainable, efficient, and user-centric urban transportation ecosystems.

5. Conclusions

The comprehensive analysis of preferences regarding car-sharing for commuting to work or school has yielded a multitude of insights critical for understanding user behaviors and guiding the future of transportation in smart cities. Safety emerged as the predominant concern among respondents, aligning with the overarching goals of smart cities that prioritize secure and sustainable mobility solutions. The preference for medium-sized vehicles reflects the diverse needs of urban commuters and corresponds with broader market trends, as evidenced by the shift in fleet compositions among leading car-sharing operators and new car purchase statistics in Germany.
The study’s findings suggest that the preferences of young respondents in Berlin are broadly applicable, highlighting the importance of vehicle size, engine type, rental pricing, and advanced features. The analysis emphasized the need for car-sharing operators to balance cost-effectiveness with environmental impact, integrating hybrid and electric vehicles to align with the sustainability ethos of smart cities.
The discussion on the transferability of these results to other urban contexts underscores the importance of considering demographic, cultural, and geographic characteristics. The alignment with global trends in user preferences and technological advancements indicates that these insights are relevant across different forms of shared mobility, such as e-scooter sharing, bike sharing, and ride-hailing.
Specific implications for the development of car-sharing systems in smart cities include fleet optimization to accommodate user preferences for larger vehicles, implementation of dynamic pricing strategies, integration of sustainable mobility solutions, enhancement of vehicle features, educational initiatives, and policy recommendations to ensure safety and affordability.
By addressing these implications, car-sharing operators can better align their services with user preferences and the evolving mobility needs of smart city inhabitants, contributing to more sustainable, efficient, and user-centric urban transportation ecosystems.
To sum up, the obtained results provide a solution to the problem of underutilization of a vehicle fleet by users occasionally using car-sharing systems. It can therefore be concluded that the current fleet does not fully meet the requirements of its utility for occasional users and requires reorganization. The results of the developed tests were presented to the operator, leading to planned changes in the fleet for the second half of 2023. The practical application of the method was demonstrated through a case study of a German car-sharing operator, providing a current fleet assessment, conclusions, and recommendations for improvement. This case study validated the feasibility of the developed method in a real-market scenario.
Like every research method, this one also has its limitations. The first limitation is the scope of application of the method. Please note that this method is adapted to already-existing car-sharing systems. In a similar vein, the second limitation is related to the need to cooperate with a given car-sharing operator for whom the analyses are to be performed, which involves the need to provide some data on the fleet, its use, and its users, which often, due to the “closed” nature of the industry, can be problematic.
From the perspective of the employed CAWI (Computer-Assisted Web Interviewing) method, it is important to acknowledge its inherent limitations, as is the case with any survey methodology. The primary limitation is the requirement for respondents to have internet access, which may exclude certain demographics, such as the elderly. However, it is pertinent to emphasize that in the context of car-sharing services, internet access is essential for utilizing the systems through the service operator’s application. Consequently, this limitation does not significantly impede the applicability of the CAWI method in this scenario. Furthermore, as with any survey method, there is a potential for respondent reluctance to complete the survey. To mitigate this issue, an intuitive and relatively brief survey format was adopted to prevent respondent fatigue and encourage completion. Additionally, the survey was made available online for a specified period, allowing respondents to complete it at their convenience, thereby enhancing the quality of the responses. Despite these limitations, the study methodology did not compromise the reliability of the results. The structured design and focused approach facilitated the collection of pertinent and actionable data, ensuring the effective attainment of the research objectives.
It is also worth emphasizing that the method evaluates specific preference profiles composed of attributes and their levels as defined in the analysis. The obtained preferences, in terms of the attributes and their utility, therefore apply specifically to the assumed data. Referring them to the analysis of the composition of the fleet and real data characterizing specific cars, there is a possibility that the results will indicate vehicles with even better parameters than those preferred by respondents when determining profile preferences. For example, when respondents indicate that safety is the most important issue for them, which, when assessing preference profiles, is at the level of four stars in the Euro NCAP ranking, and the analysis of the fleet composition shows that the best-chosen vehicle will have five stars according to Euro NCAP, the result should be considered correct because it not only takes into account the minimum preference of the respondents but also allows to meet the validity of the safety criterion even with excess.
The developed method made it possible to achieve the aims of this work. However, this article does not exhaustively cover all the issues related to the fleets used in car-sharing systems. It is an impulse to conduct further research in this area and to deepen it, becoming a starting point for further studies. The proposed directions for further research may concern the extension of the method with further analyses based on the other purposes of using cars from car-sharing systems.

Funding

The Article Processing Charge was financed under the European Funds for Silesia 2021–2027 Program co-financed by the Just Transition Fund—project entitled “Supporting the staff in intensifying scientific activities in the field of transport transformation towards a green and digital economy”. Project number: FESL.10.25-IZ.01-03AF/23-00; Project number at the Silesian University of Technology: 12/010/FSD24/1161.

Institutional Review Board Statement

According to our University Ethical Statement, the following shall be regarded as research requiring a favorable opinion from the Ethic Commission in the case of human research (https://lex.polsl.pl/423-lista/d/20088/5/?reporef=%2F%3FsearchKey%3D194726769 accessed on 10 May 2024): research in which persons with limited capacity to give informed or research on persons whose capacity to give informed or free consent to participate in research and who have a limited ability to refuse research before or during their implementation, in particular: children and adolescents under 12 years of age, persons with intellectual disabilities persons whose consent to participate in the research may not be fully voluntary prisoners, soldiers, police officers, employees of companies (when the survey is conducted at their workplace), persons who agree to participate in the research on the basis of false information about the purpose and course of the research (masking instruction, i.e., deception) or do not know at all that they are subjects (in so-called natural experiments); research in which persons particularly susceptible to psychological trauma and mental health disorders are to participate mental health, in particular: mentally ill persons, victims of disasters, war trauma, etc., patients receiving treatment for psychotic disorders, family members of terminally or chronically ill patients; research involving active interference with human behavior aimed at changing it research involving active intervention in human behavior aimed at changing that behavior without direct intervention in the functioning of the brain, e.g., cognitive training, psychotherapy, psychocorrection, etc. (this also applies if the intended intervention is intended to benefit the subject (e.g., to improve his/her memory); research concerning controversial issues (e.g., abortion, in vitro fertilization, death penalty) or requiring particular delicacy and caution (e.g., concerning religious beliefs or attitudes towards minority groups); research that is prolonged, tiring, physically or mentally exhausting. Our research is not conducted on people meeting the mentioned conditions. Any of the people researched had a limited capacity to be informed; any of them had been susceptible to psychological trauma and mental health disorders; the research did not concern the controversial issues mentioned above; the research was not prolonged, tiring, physically or mentally exhausting.

Informed Consent Statement

Informed consent was obtained from all subjects involved in the study.

Data Availability Statement

Data are contained within the article.

Conflicts of Interest

The author declares no conflicts of interest.

Appendix A

RESEARCH QUESTIONNAIRE
  • Ladies and Gentlemen,
  • As part of the implementation of scientific research on improving the adaptation of the car-sharing fleet of the X company to adopt to the needs of users, I cordially invite you to take part in this survey. This questionnaire is devoted to the utility of individual attributes concerning vehicles and car-sharing systems depending on the purpose of the trip. The survey is addressed to people who occasionally use car-sharing systems, i.e., up to 10 h a year.
  • The survey is anonymous and will not take more than 10 min.
  • Thank you very much for your participation.
  • Katarzyna Turoń, PhD. Eng. DSc.
  • Silesian University of Technology,
  • Faculty of Transport and Aviation Engineering, Department of Road Transport
  • Demographics
  • Year of birth: …..
  • Sex:
    Female.
    Male.
  • Education level:
    Basic.
    Junior high school.
    Basic vocational.
    High school.
    Higher.
  • Domicile:
    Village.
    City up to 50,000 residents.
    City up to 100,000 residents.
    City up to 250,000 residents.
    City over 250,000 residents.
  • Professional situation:
    Learning.
    Working.
    Unemployed.
    Pensioner.
    Learning and working.
  • Family status:
    Bachelor/Maiden.
    Married.
    Divorced.
  • Monthly earnings:
    Up to EUR 1500.
    EUR 1501–EUR 2500.
    EUR 2501—EUR 4500.
    Over 4500 EUR.
PROFILE PREFERENCES
  • Imagine that you have to make several trips using a car from a car-sharing system for commuting to work/school.
  • For each trip, you are offered a different type of vehicle defined by six parameters as:
-
Car type [-]—Classification that determines the size of the vehicle: small (A, B class), medium (C class), large (D, E class).
-
The average car-sharing vehicle rental price [€/km]—the average cost of renting a car per 1 km of travel,
-
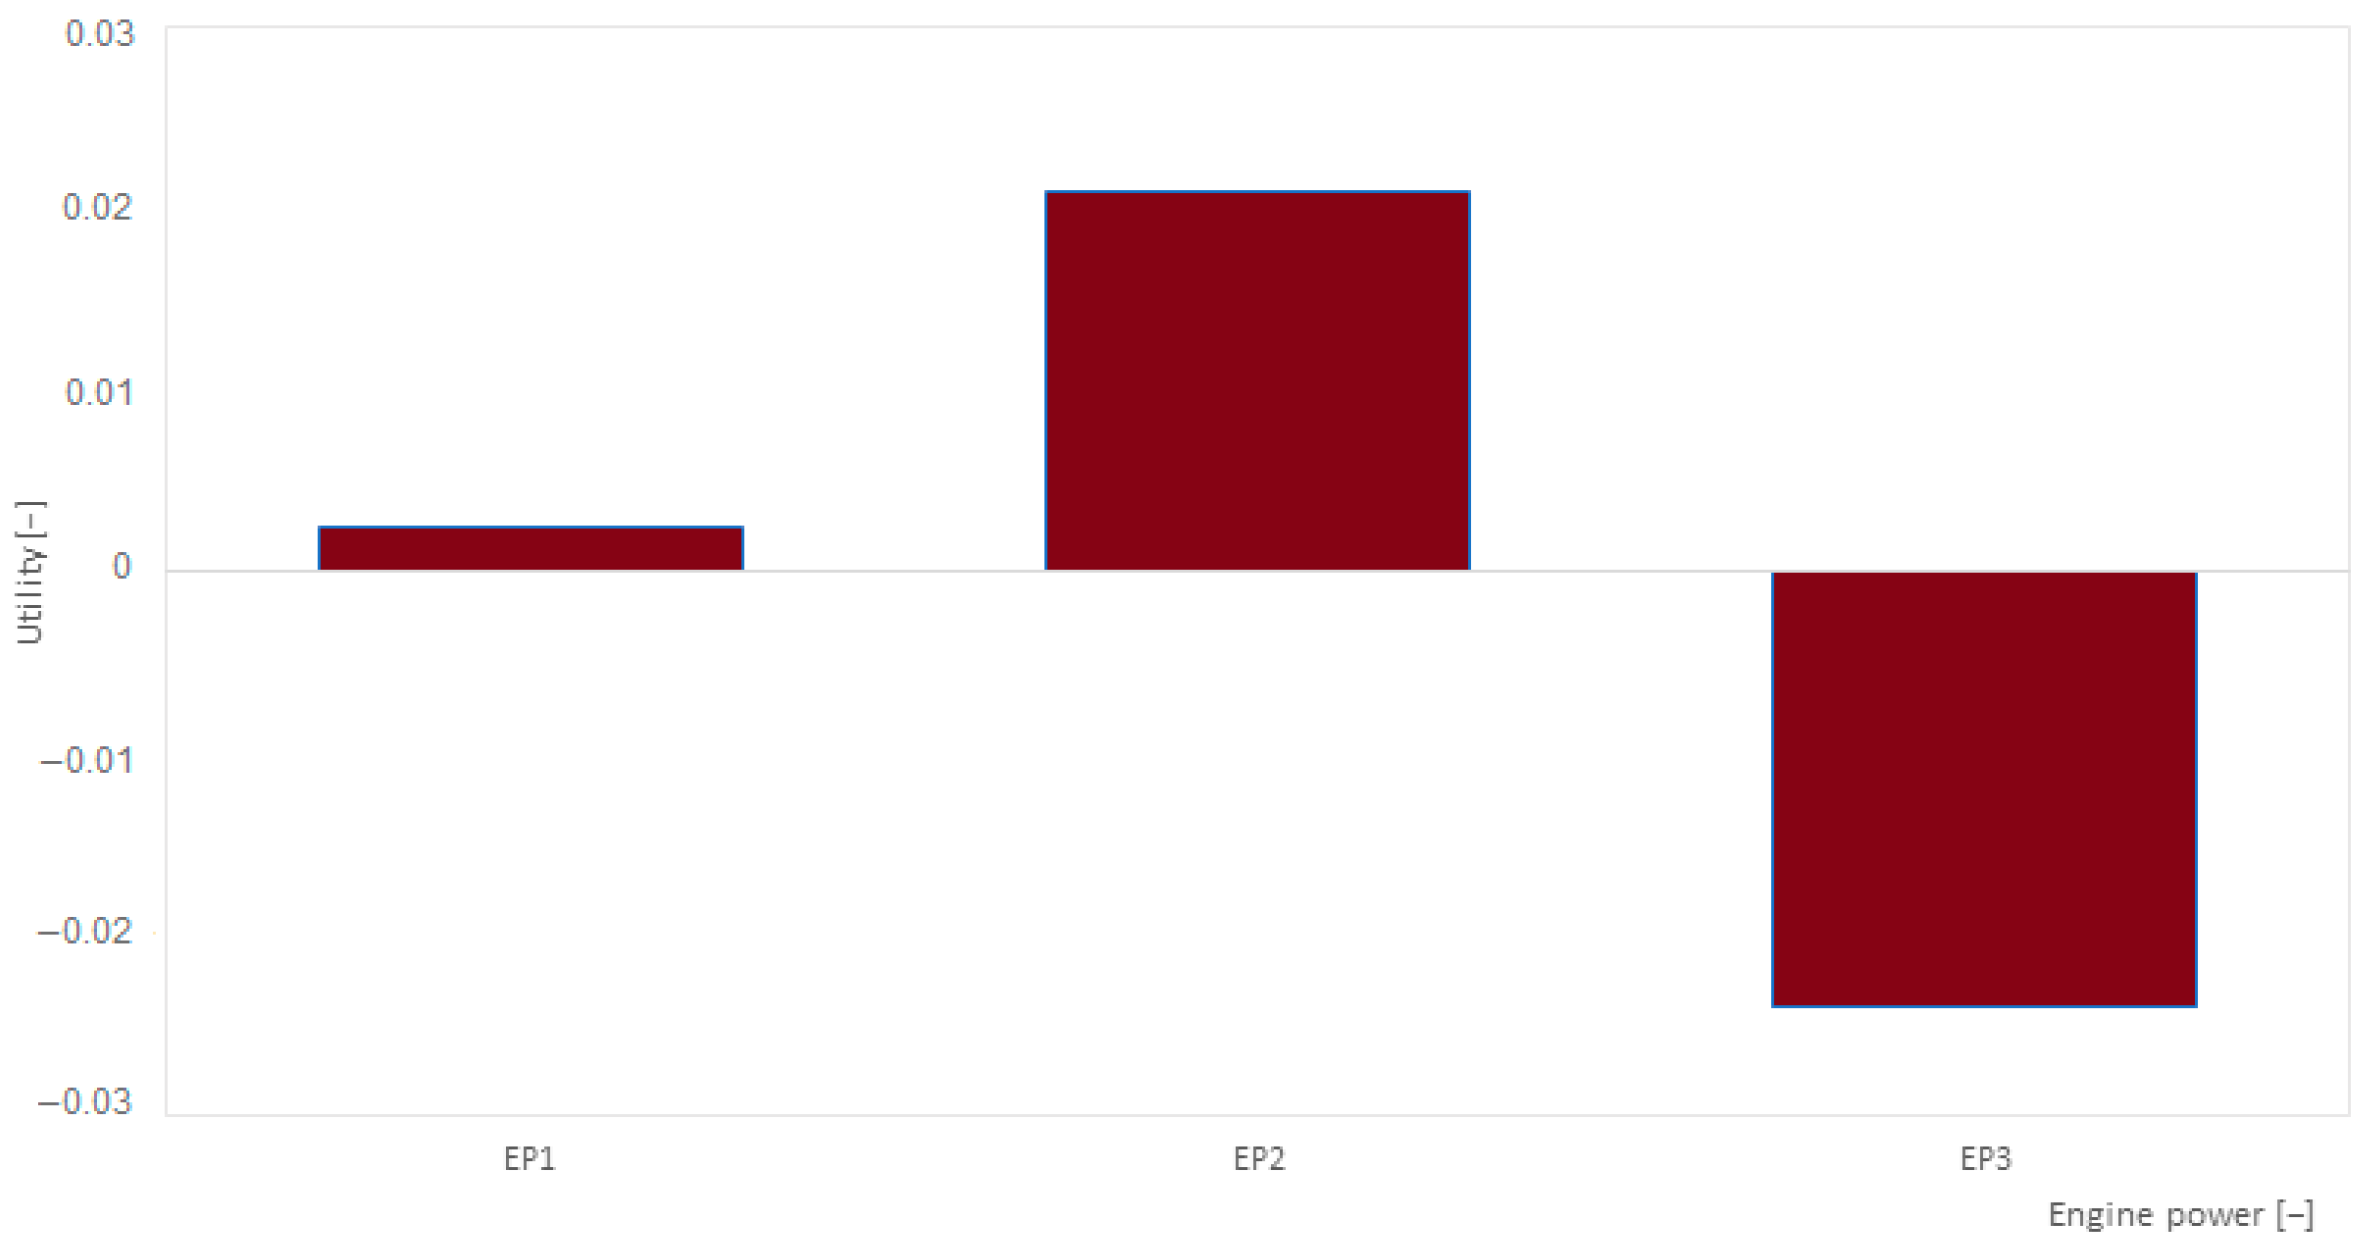
Engine power [kW]—The amount of work an engine can do in a given time,
-
Car-sharing vehicle equipment standard [-]—Additional vehicle equipment that increases the level of its safety, comfort, or vehicle quality.
-
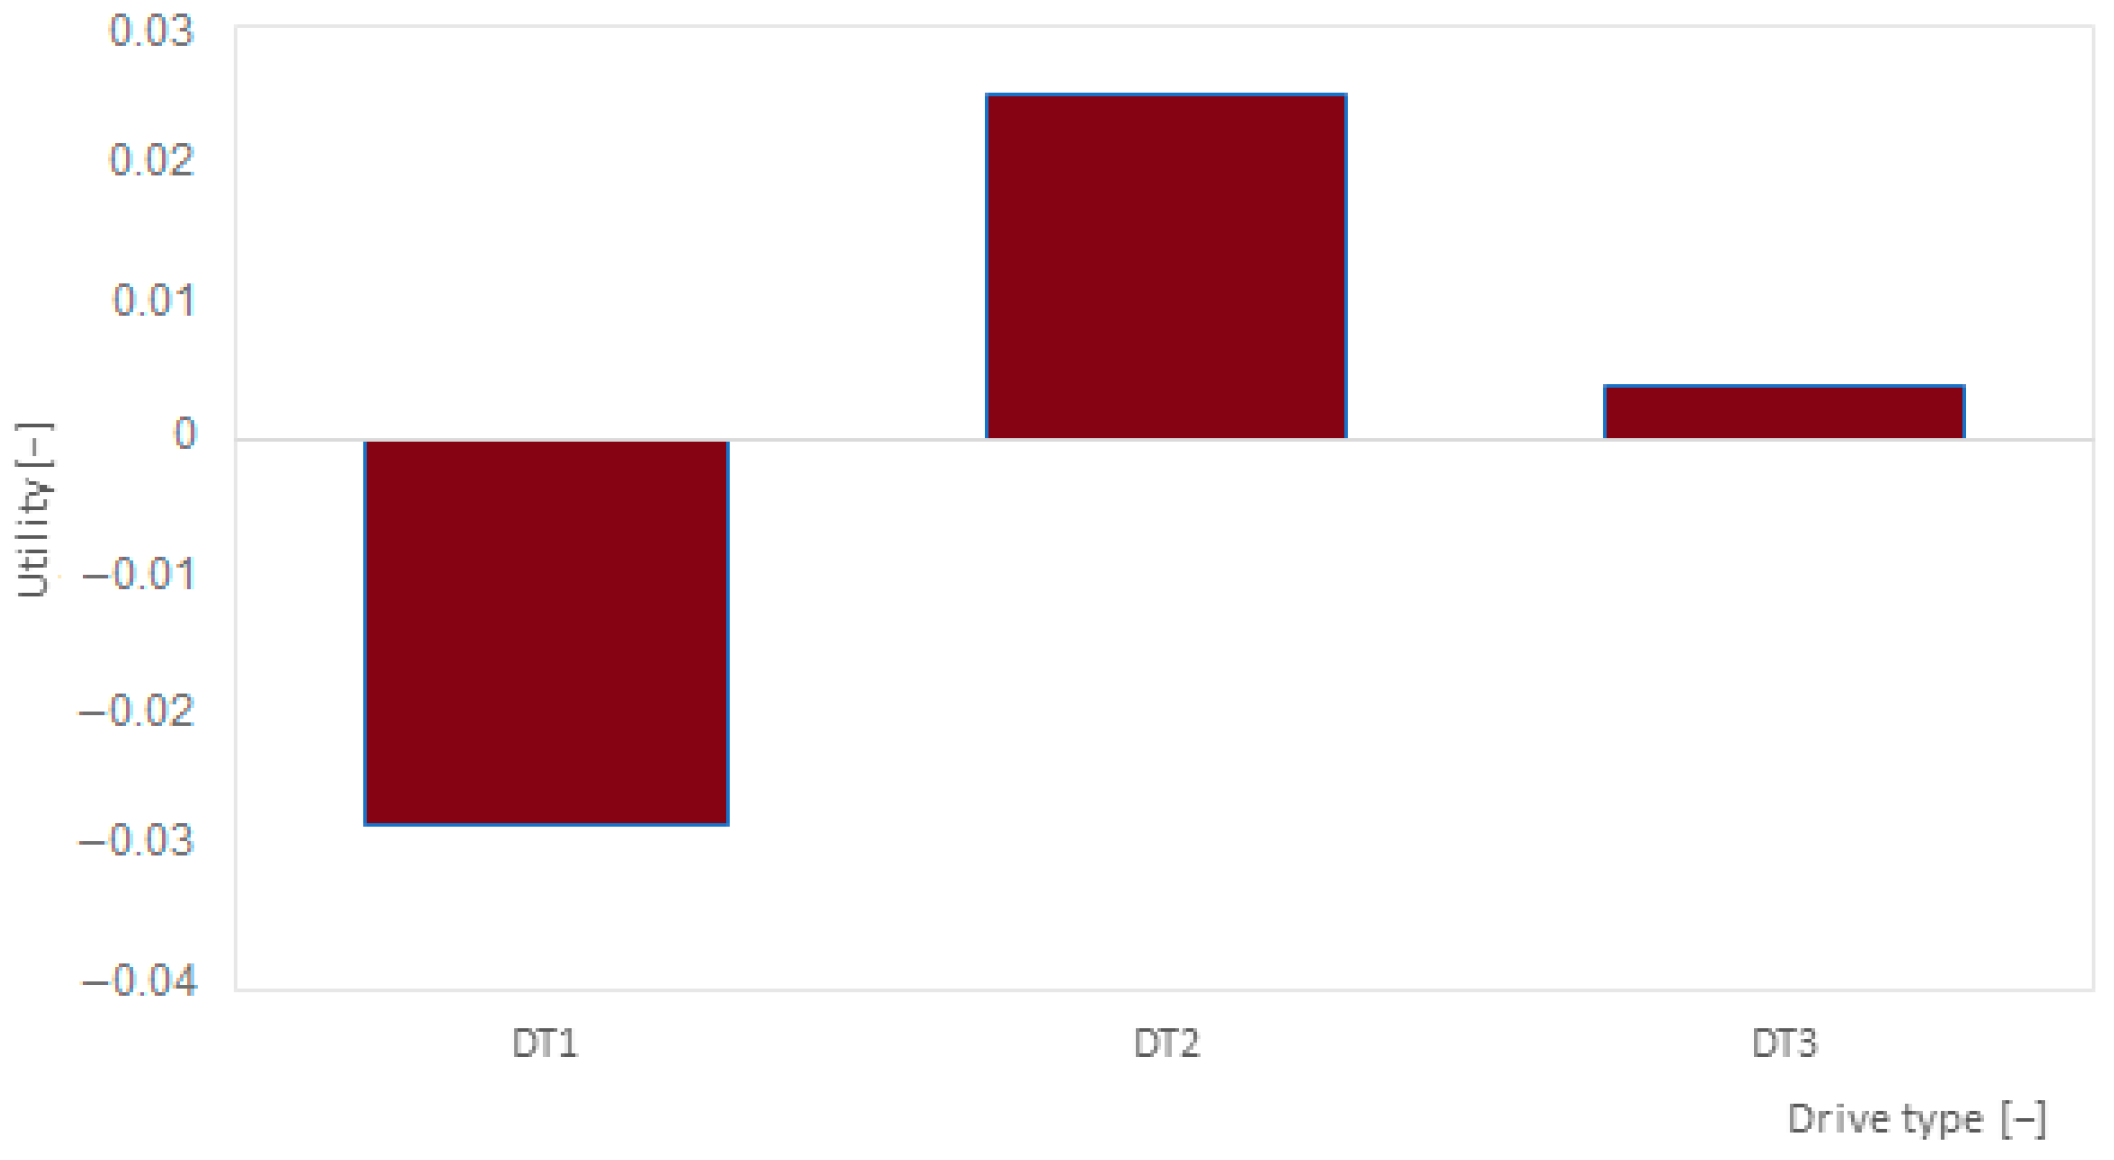
Drive type of the vehicle [-]—The type of engine the car is equipped with,
-
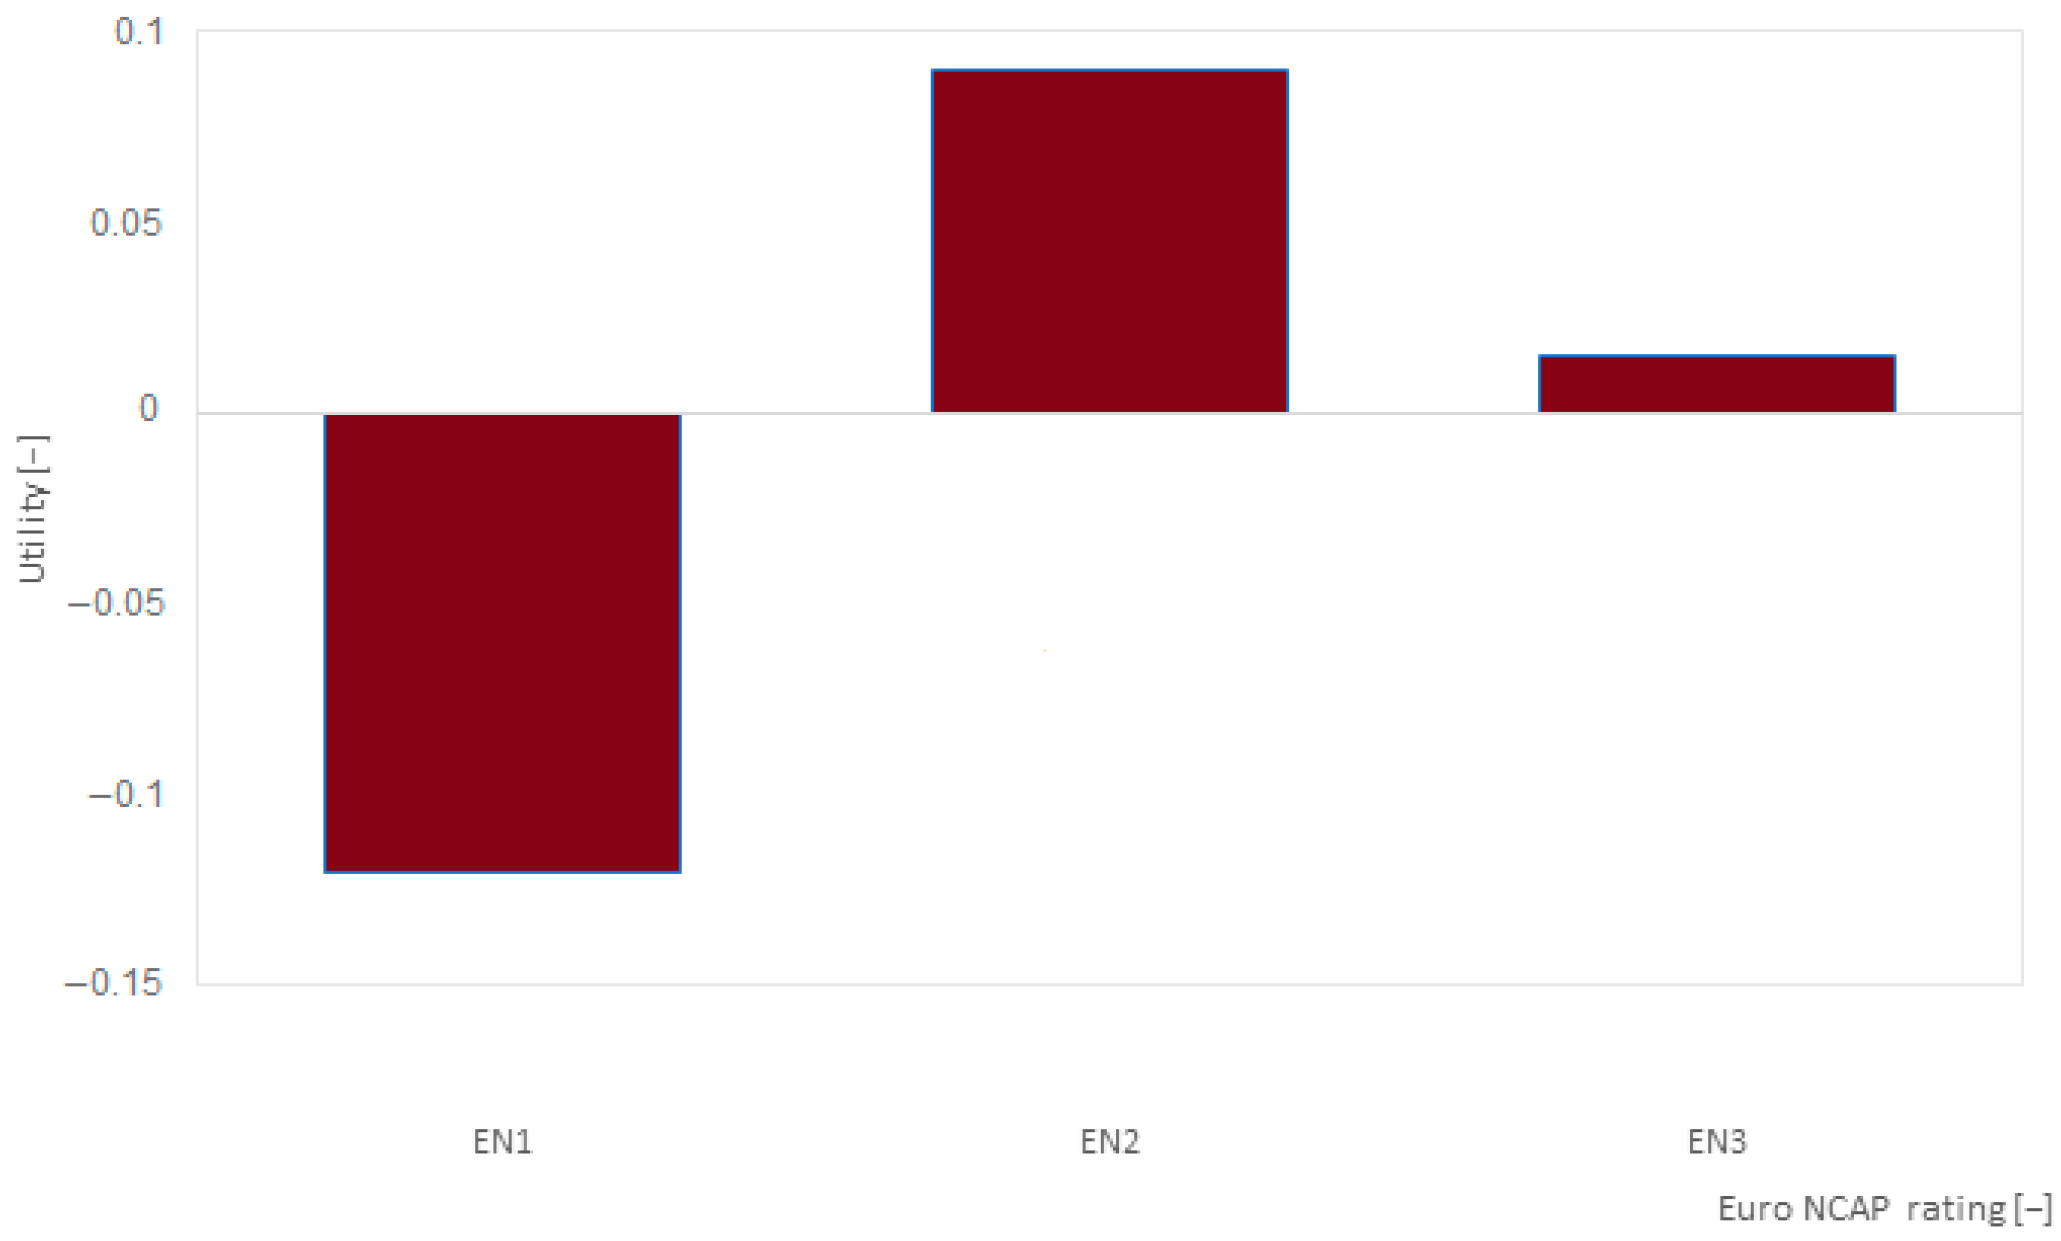
Euro NCAP rating [-]—Five-star safety rating system to help consumers identify the safest choice for their needs. The safety rating is determined from a series of vehicle tests designed and carried out by the Euro NCAP organization (on a 5-star scale, 1 is the lowest and 5 is the highest safety value).
Your task is to assess how much a vehicle defined by individual features would be suitable for you when carrying out a journey for a given purpose. Please, evaluate the variant of the trip, giving a score from 1 to 6, where:
1
unsatisfactory
2
mediocre
3
satisfactory
4
good
5
very good
6
excellent
An example of a completed questionnaire is presented below.
EXAMPLE
# 0Purpose: Using of a Car-Sharing Vehicle for Commuting to Work (Including Dealing with Professional Matters and Travel to Business Meetings as Business Daily Trips) or Commuting
to Place of Education (e.g., School, University, etc.)
AttributesCar type [-]The average car-sharing vehicle rental price [€/km]Engine power [kW]Car-sharing vehicle equipment standard [-]Drive type of the vehicle [-]Euro NCAP raring [-]Grade
Levelssmall0.40–0.6063–149Parking sensorsElectric engine3–4 stars6
small0.40–0.6040–62Parking sensorsInternal Combustion engine1–3 stars2
PREFERENCE PROFILES FOR YOUR ASSESSMENT
# 1Using of a Car-Sharing Vehicle for Commuting to Work (Including Dealing with Professional Matters and Travel to Business Meetings as Business Daily Trips)
or Commuting to Place of Education (e.g., School, University, etc.)
AttributesCar type [-]The average car-sharing vehicle rental price [€/km]Engine power [kW]Car-sharing
vehicle equipment standard [-]
Drive type of the vehicle [-]Euro NCAP rating [-]Grade
LevelsSmall0.40–0.6063–149Parking sensorsElectric engine3–4 stars
Small0.40–0.6040–62Parking sensorsInternal Combustion Engine1–3 stars
Largeover 0.91Over 150Parking sensors, navigation, handsfree, lane assistant, heated seats, cruise controlInternal Combustion Engine5 stars

References

  1. Budnitz, H. Sustainable Mobility. In Encyclopedia of Sustainability in Higher Education; Leal Filho, W., Ed.; Springer International Publishing: Cham, Switzerland, 2019; pp. 1833–1842. [Google Scholar]
  2. Machado, C.A.S.; De Salles Hue, N.P.M.; Berssaneti, F.T.; Quintanilha, J.A. An Overview of Shared Mobility. Sustainability 2018, 10, 4342. [Google Scholar] [CrossRef]
  3. Mitropoulos, L.; Kortsari, A.; Ayfantopoulou, G. A Systematic Literature Review of Ride-Sharing Platforms, User Factors and Barriers. Eur. Transp. Res. Rev. 2021, 13, 61. [Google Scholar] [CrossRef]
  4. Fishman, E. Bikeshare: A Review of Recent Literature. Transp. Rev. 2016, 36, 92–113. [Google Scholar] [CrossRef]
  5. Badia, H.; Jenelius, E. Shared E-Scooter Micromobility: Review of Use Patterns, Perceptions and Environmental Impacts. Transp. Rev. 2023, 43, 811–837. [Google Scholar] [CrossRef]
  6. Golalikhani, M.; Oliveira, B.B.; Carravilla, M.A.; Oliveira, J.F.; Antunes, A.P. Carsharing: A Review of Academic Literatureand Business Practices toward an Integrated Decision-Support Framework. Transp. Res. Part E Logist. Transp. Rev. 2021, 149, 102280. [Google Scholar] [CrossRef]
  7. Guyader, H.; Friman, M.; Olsson, L.E. Shared Mobility: Evolving Practices for Sustainability. Sustainability 2021, 13, 12148. [Google Scholar] [CrossRef]
  8. Nansubuga, B.; Kowalkowski, C. Carsharing: A Systematic Literature Review and Research Agenda. J. Serv. Manag. 2021, 32, 55–91. [Google Scholar] [CrossRef]
  9. Shaheen, S.A.; Cohen, A.P. Carsharing and Personal Vehicle Services: Worldwide Market Developments and Emerging Trends. Int. J. Sustain. Transp. 2013, 7, 5–34. [Google Scholar] [CrossRef]
  10. Firnkorn, J.; Müller, M. What Will Be the Environmental Effects of New Free-Floating Car-Sharing Systems? The Case of Car2go in Ulm. Ecol. Econ. 2011, 70, 1519–1528. [Google Scholar] [CrossRef]
  11. Litman, T. Not So Fast Better Speed Valuation for Transportation Planning. Available online: https://www.vtpi.org/nsf.pdf (accessed on 3 May 2024).
  12. Martin, E.W.; Shaheen, S.A. Greenhouse Gas Emission Impacts of Carsharing in North America. IEEE Trans. Intell. Transport. Syst. 2011, 12, 1074–1086. [Google Scholar] [CrossRef]
  13. George, C.; Julsrud, T.E. Cars and the Sharing Economy: The Emergence and Impacts of Shared Automobility in the Urban Environment. In Advances in Transport Policy and Planning; Elsevier: Amsterdam, The Netherlands, 2019; Volume 4, pp. 7–38. [Google Scholar] [CrossRef]
  14. Millard-Ball, A.; Murray, G.; Ter Schure, J.; Fox, C.; Burkhardt, J. Car-Sharing: Where and How It Succeeds. Transportation Research Board 2015. Available online: https://nap.nationalacademies.org/read/13559/chapter/1 (accessed on 3 May 2024).
  15. Ang, F.; Van Passel, S.; Mathijs, E. An Aggregate Resource Efficiency Perspective on Sustainability: A Sustainable Value Application to the EU-15 Countries. Ecol. Econ. 2011, 71, 99–110. [Google Scholar] [CrossRef]
  16. Hoerler, R.; Van Dijk, J.; Patt, A.; Del Duce, A. Carsharing Experience Fostering Sustainable Car Purchasing? Investigating Car Size and Powertrain Choice. Transp. Res. Part D Transp. Environ. 2021, 96, 102861. [Google Scholar] [CrossRef]
  17. European Shared Mobility Index. Available online: https://www.linkedin.com/pulse/european-shared-mobility-index-fluctuo/ (accessed on 3 May 2024).
  18. ING Forecast. Car-Sharing Unlocked. Available online: https://www.ing.nl/zakelijk/kennis-over-de-economie/uw-sector/automotive/car-sharing-unlocked-english.html (accessed on 3 May 2024).
  19. Research and Markets. Car Sharing Market: Global Industry, Trends, Share, Size, Growth, Opportunity and Forecast 2021–2026. Available online: https://www.researchandmarkets.com/reports/5483424/car-sharing-market-global-industry-trends?gclid=Cj0KCQiAg_KbBhDLARIsANx7wAwu3FD0-eUeYdxZZQ_qtTYEijaNKLC6gwGPSOUPK-_T3J0l7VsLwnwaAvwgEALw_wcB (accessed on 3 May 2024).
  20. Brendel, A.B.; Brennecke, J.T.; Hillmann, B.M.; Kolbe, L.M. The Design of a Decision Support System for Computation of Carsharing Pricing Areas and Its Influence on Vehicle Distribution. IEEE Trans. Eng. Manag. 2023, 70, 819–833. [Google Scholar] [CrossRef]
  21. Zhang, X.; Shao, C.; Wang, B.; Huang, S.; Mi, X.; Zhuang, Y. Exploring the Role of Shared Mobility in Alleviating Private Car Dependence and On-Road Carbon Emissions in the Context of COVID-19. Front. Environ. Sci. 2022, 10, 931763. [Google Scholar] [CrossRef]
  22. Barrios, J.A.; Godier, J.D. Fleet Sizing for Flexible Carsharing Systems: Simulation-Based Approach. Transp. Res. Rec. 2014, 2416, 1–9. [Google Scholar] [CrossRef]
  23. Carlier, A.; Munier-Kordon, A.; Klaudel, W. Optimization of a one-way carsharing system with relocation operations. In Proceedings of the 10th International Conference on Modeling, Optimization and SIMulation MOSIM 2014, Nancy, France, 5 November 2014. [Google Scholar]
  24. Martin, G.; Donain, M.; Fromont, E.; Guns, T.; Roze, L.; Termier, A. Prediction-Based Fleet Relocation for Free Floating Car Sharing Services. In Proceedings of the 2021 IEEE 33rd International Conference on Tools with Artificial Intelligence (ICTAI), Washington, DC, USA, 1–3 November 2021; IEEE: Washington, DC, USA, 2021; pp. 1187–1191. [Google Scholar]
  25. Huang, K.; An, K.; Correia, G.H.d.A. Planning Station Capacity and Fleet Size of One-Way Electric Carsharing Systems with Continuous State of Charge Functions. Eur. J. Oper. Res. 2020, 287, 1075–1091. [Google Scholar] [CrossRef]
  26. Fanti, M.P.; Mangini, A.M.; Pedroncelli, G.; Ukovich, W. Fleet Sizing for Electric Car Sharing System via Closed Queueing Networks. In Proceedings of the 2014 IEEE International Conference on Systems, Man, and Cybernetics (SMC), San Diego, CA, USA, 5–8 October 2014; IEEE: San Diego, CA, USA, 2014; pp. 1324–1329. [Google Scholar] [CrossRef]
  27. Monteiro, C.M.; Machado, C.A.S.; Lage, M.D.O.; Berssaneti, F.T.; Davis, C.A.; Quintanilha, J.A. Optimization of Carsharing Fleet Size to Maximize the Number of Clients Served. Comput. Environ. Urban Syst. 2021, 87, 101623. [Google Scholar] [CrossRef]
  28. Nourinejad, M.; Roorda, M.J. A dynamic carsharing decision support system. Transp. Res. Part E Logist. Transp. Rev. 2014, 66, 36–50. [Google Scholar] [CrossRef]
  29. Ströhle, P.; Flath, C.M.; Gärttner, J. Leveraging Customer Flexibility for Car-Sharing Fleet Optimization. Transp. Sci. 2019, 53, 42–61. [Google Scholar] [CrossRef]
  30. Deng, Y.; Gupta, A.K.; Shroff, N.B. Fleet Sizing and Charger Allocation in Electric Vehicle Sharing Systems. IFAC J. Syst. Control 2020, 22, 100210. [Google Scholar] [CrossRef]
  31. Bazan, P.; Djanatliev, A.; Pruckner, M.; German, R.; Lauer, C. Rebalancing And Fleet Sizing Of Mobility-On-Demand Networks With Combined Simulation, Optimization And Queueing Network Analysis. In Proceedings of the 2018 Winter Simulation Conference (WSC), Gothenburg, Sweden, 9–12 December 2018; pp. 1527–1538. [Google Scholar]
  32. Xu, M.; Meng, Q. Fleet Sizing for One-Way Electric Carsharing Services Considering Dynamic Vehicle Relocation and Nonlinear Charging Profile. Transp. Res. Part B Methodol. 2019, 128, 23–49. [Google Scholar] [CrossRef]
  33. Liao, F.; Correia, G. Electric Carsharing and Micromobility: A Literature Review on Their Usage Pattern, Demand, and Potential Impacts. Int. J. Sustain. Transp. 2022, 16, 269–286. [Google Scholar] [CrossRef]
  34. Shaheen, S.; Martin, E.; Totte, H. Zero-Emission Vehicle Exposure within U.S. Carsharing Fleets and Impacts on Sentiment toward Electric-Drive Vehicles. Transp. Policy 2020, 85, A23–A32. [Google Scholar] [CrossRef]
  35. Schlüter, J.; Weyer, J. Car Sharing as a Means to Raise Acceptance of Electric Vehicles: An Empirical Study on Regime Change in Automobility. Transp. Res. Part F Traffic Psychol. Behav. 2019, 60, 185–201. [Google Scholar] [CrossRef]
  36. Campisi, T.; Ignaccolo, M.; Tesoriere, G.; Inturri, G.; Torrisi, V. The Evaluation of Car-Sharing to Raise Acceptance of Electric Vehicles: Evidences from an Italian Survey among University Students. SAE Tech. Pap. 2020. [Google Scholar] [CrossRef]
  37. Migliore, M.; D’Orso, G.; Caminiti, D. The environmental benefits of carsharing: The case study of Palermo. Transp. Res. Procedia 2020, 48, 2127–2139. [Google Scholar] [CrossRef]
  38. Hui, Y.; Wang, Y.; Sun, Q.; Tang, L. The Impact of Car-Sharing on the Willingness to Postpone a Car Purchase: A Case Study in Hangzhou, China. J. Adv. Transp. 2019, 2019, 1–11. [Google Scholar] [CrossRef]
  39. Jochem, P.; Frankenhauser, D.; Ewald, L.; Ensslen, A.; Fromm, H. Does Free-Floating Carsharing Reduce Private Vehicle Ownership? The Case of SHARE NOW in European Cities. Transp. Res. Part A Policy Pract. 2020, 141, 373–395. [Google Scholar] [CrossRef]
  40. Jain, T.; Rose, G.; Johnson, M. Changes in Private Car Ownership Associated with Car Sharing: Gauging Differences by Residential Location and Car Share Typology. Transportation 2022, 49, 1–25. [Google Scholar] [CrossRef] [PubMed]
  41. Liao, F.; Molin, E.; Timmermans, H.; Van Wee, B. Carsharing: The Impact of System Characteristics on Its Potential to Replace Private Car Trips and Reduce Car Ownership. Transportation 2020, 47, 935–970. [Google Scholar] [CrossRef]
  42. Kubik, A.; Turoń, K.; Stanik, Z. Car-sharing systems vehicles versus taxis in urban transport system—Legal requirements, technical service, operation. In Proceedings of the International Conference on Traffic and Transport Engineering: ICTTE, Belgrade, Serbia, 27–28 September 2018; Cokorilo, O., Ed.; City Net Scientific Research Center: Belgrade, Serbia, 2018. [Google Scholar]
  43. Kubik, A.; Turoń, K.; Folęga, P.; Chen, F. CO2 Emissions—Evidence from Internal Combustion and Electric Engine Vehicles from Car-Sharing Systems. Energies 2023, 6, 2185. [Google Scholar] [CrossRef]
  44. Bruglieri, M.; Pisacane, O. A Survey on Emergent Trends in the Optimization of Car-sharing Systems. Int. Trans. Oper. Res. 2023, 30, 2867–2908. [Google Scholar] [CrossRef]
  45. Tchorek, G.; Targowski, F. Car Sharing in Poland—The Perspective of Operators and Cities in the First Comparative Research Study. Studia i Materiały 2019, 2, 47–63. [Google Scholar] [CrossRef]
  46. Turoń, K. Carsharing Vehicle Fleet Selection from the Frequent User’s Point of View. Energies 2022, 15, 6166. [Google Scholar] [CrossRef]
  47. Turoń, K. Car-sharing problems—Multi-criteria overview. In Proceedings of the International Conference on Traffic and Transport Engineering. ICTTE, Belgrade, Serbia, 27–28 September 2018; Cokorilo, O., Ed.; City Net Scientific Research Center: Belgrade, Serbia, 2018; pp. 916–922. [Google Scholar]
  48. Cooke, P.N. Zarządzanie flotą samochodową. Strategie; IPM: Wrocław, Poland, 2005; ISBN 83-921812-1-2. [Google Scholar]
  49. Sharma, A.; Shukla, D. Perception of Consumers Towards Car Purchase Decision. SSRN J. 2019. [Google Scholar] [CrossRef]
  50. Begg, D.; Fisher, S. Mikroekonomia; Polskie Wydawnictwo Ekonomiczne: Warszawa, Poland, 2008; ISBN 9788320820881. [Google Scholar]
  51. Walesiak, M.; Bąk, A. Conjoint analysis w badaniach marketingowych; Wydawnictwo Akademii Ekonomicznej we Wrocławiu: Wrocław, Poland, 2000; ISBN 8370114415. [Google Scholar]
  52. Alriksson, S.; Oberg, T. Conjoint analysis for environmental evaluation—A review of methods and applications. Environ. Sci. Pollut. Res. Int. 2008, 15, 244–257. [Google Scholar] [CrossRef] [PubMed]
  53. Ben-Akiva, M.; McFadden, D.; Train, K. Foundations of Stated Preference Elicitation: Consumer Behavior and Choice-based Conjoint Analysis. Found. Trends Econom. 2019, 10, 1–144. [Google Scholar] [CrossRef]
  54. Maas, B. Conjoint analysis of mobility plans in the city of Dresden. Eur. Transp. Res. Rev. 2021, 13, 1–15. [Google Scholar] [CrossRef]
  55. Arning, K.; Offermann-van Heek, J.; Ziefle, M. What Drives Public Acceptance of Sustainable CO2-Derived Building Materials? A Conjoint-Analysis of Eco-Benefits vs. Health Concerns. Renew. Sustain. Energy Rev. 2021, 144, 110873. [Google Scholar] [CrossRef]
  56. Altınay Özdemir, M. Travellers’ Destination Attribute Preferences: A Choice-Based Conjoint (CBC) Analysis. Acad. Tur. 2022, 15, 217–231. [Google Scholar] [CrossRef]
  57. Regulation (EEC) No 4064/89; Merger Procedure, Office for Official Publications of the European Communities. European Commission Standard: Brussel, Belgium, 1999.
  58. Euro NCAP. Available online: https://www.euroncap.com/en (accessed on 6 May 2024).
  59. EPA—U.S. Environmental Protection Agency. Available online: https://www.epa.gov/ (accessed on 6 May 2024).
  60. Orme, B. Sample Size Issues for Conjoint Analysis Studies; Sawtooth Software, Ressearch Publishers LLC: Sequim, DC, USA, 1998; ISBN 0972729747. [Google Scholar]
  61. Bąk, A. Analiza conjoint. In Statystyczna Analiza Danych z Wykorzystaniem Programu R; Walesiak, M., Gatnar, E., Eds.; Wydawnictwo Naukowe PWN: Warszawa, Poland, 2012. [Google Scholar]
  62. Nigam, A.K.; Gupta, V.K. Construction of Orthogonal Main-Effect Plans Using Hadamard Matrices. Technometrics 1985, 27, 37–40. [Google Scholar] [CrossRef]
  63. Green, P.E.; Srinivasan, V. Conjoint Analysis in Marketing: New Developments with Implications for Research and Practice. J. Mark. 1990, 54, 3–19. [Google Scholar] [CrossRef]
  64. Fiorello, D.; Martino, A.; Zani, L.; Christidis, P.; Navajas-Cawood, E. Mobility Data across the EU 28 Member States: Results from an Extensive CAWI Survey. Transp. Res. Procedia 2016, 14, 1104–1113. [Google Scholar] [CrossRef]
  65. Majchrowicz, B. Factors Influencing Decision Making on Donating Organs for Transplantation in the Opinion of the Respondents—Study Using the CAWI Method. J. Educ. Health Sport 2022, 13, 183–189. [Google Scholar] [CrossRef]
  66. Tomaselli, V.; Battiato, S.; Ortis, A.; Cantone, G.G.; Urso, S.; Polosa, R. Methods, Developments, and Technological Innovations for Population Surveys. Soc. Sci. Comput. Rev. 2022, 40, 994–1013. [Google Scholar] [CrossRef]
  67. Vejchodská, E.; Brůhová Foltýnová, H.; Rybičková, A. Carsharing Users’ Behaviour and Attitudes. The Role of Car Availability in Households. Transportation 2023, 1–23. [Google Scholar] [CrossRef]
  68. Number of Registered Car Sharing Users in Germany from 2014 to 2024. Available online: https://www.statista.com/statistics/415635/car-sharing-registered-users-gemany/ (accessed on 5 May 2024).
  69. Ashraf, A.; Idrisi, M.J. Smart and Sustainable Public Transportation—A Need of Developing Countries. Int. J. Netw. Distrib. Comput. 2024, 12, 144–152. [Google Scholar] [CrossRef]
  70. Etukudoh, E.A.; Adefemi, A.; Ilojianya, V.I.; Umoh, A.A.; Ibekwe, K.I.; Nwokediegwu, Z.Q.S. A Review of Sustainable Transportation Solutions: Innovations, Challenges, and Future Directions. World J. Adv. Res. Rev. 2024, 21, 1440–1452. [Google Scholar] [CrossRef]
  71. Elassy, M.; Al-Hattab, M.; Takruri, M.; Badawi, S. Intelligent Transportation Systems for Sustainable Smart Cities. Transp. Eng. 2024, 16, 100252. [Google Scholar] [CrossRef]
  72. Li, C.; Pan, Y. A Comprehensive Study on User-Centric Smart Life Solutions: Integrating Mobile Integrated Technology and Big Data Analytics for Digitalized Smart City Environments. J. Inform. Syst. Eng. 2024, 9, 24684. [Google Scholar] [CrossRef]
  73. Rejeb, A.; Rejeb, K.; Simske, S.; Treiblmaier, H.; Zailani, S. The Big Picture on the Internet of Things and the Smart City: A Review of What We Know and What We Need to Know. Internet Things 2022, 19, 100565. [Google Scholar] [CrossRef]
  74. AlAli, D.; Manivannan, N.; Xu, Y. A Framework for Effective Design Thinking Based Smart Cities Projects in Qatar. Smart Cities 2023, 6, 531–562. [Google Scholar] [CrossRef]
  75. Wolniak, R. The Implementation of Industry 4.0 Concept in Smart City. Sci. Pap. Silesian Univ. Technol. Organ. Manag. Ser. 2023, 2023, 753–770. [Google Scholar] [CrossRef]
  76. Jiang, H.; Geertman, S.; Witte, P. The Contextualization of Smart City Technologies: An International Comparison. J. Urban Manag. 2023, 12, 33–43. [Google Scholar] [CrossRef]
  77. Laa, B.; Leth, U. Survey of E-Scooter Users in Vienna: Who They Are and How They Ride. J. Transp. Geogr. 2020, 89, 102874. [Google Scholar] [CrossRef]
  78. Jie, F.; Standing, C.; Biermann, S.; Standing, S.; Le, T. Factors Affecting the Adoption of Shared Mobility Systems: Evidence from Australia. Res. Transp. Bus. Manag. 2021, 41, 100651. [Google Scholar] [CrossRef]
  79. Öztaş Karlı, R.G.; Karlı, H.; Çelikyay, H.S. Investigating the Acceptance of Shared E-Scooters: Empirical Evidence from Turkey. Case Stud. Transp. Policy 2022, 10, 1058–1068. [Google Scholar] [CrossRef]
  80. Soltani, A.; Allan, A.; Khalaj, F.; Pojani, D.; Mehdizadeh, M. Ridesharing in Adelaide: Segmentation of Users. J. Transp. Geogr. 2021, 92, 103030. [Google Scholar] [CrossRef]
  81. Nikiforiadis, A.; Tsavdari, D.; Mizaras, V.; Ayfantopoulou, G. Identifying Barriers and Expectations in MaaS: Users’ and Stakeholders’ Perspective. Future Transp. 2023, 3, 1240–1252. [Google Scholar] [CrossRef]
  82. Efthymiou, D.; Chaniotakis, E.; Antoniou, C. Factors Affecting the Adoption of Vehicle Sharing Systems. In Demand for Emerging Transportation Systems; Elsevier: Amsterdam, The Netherlands, 2020; pp. 189–209. [Google Scholar] [CrossRef]
  83. Aguilera-García, Á.; Gomez, J.; Rangel, T.; Baeza, M.D.L.Á.; Vassallo, J.M. Which Factors Influence the Use of Shared and Privately-Owned e-Scooters in the City of Madrid? Implications for Urban Mobility. Cities 2024, 147, 104785. [Google Scholar] [CrossRef]
  84. Turoń, K.; Kubik, A.; Ševčovič, M.; Tóth, J.; Lakatos, A. Visual Communication in Shared Mobility Systems as an Opportunity for Recognition and Competitiveness in Smart Cities. Smart Cities 2022, 5, 802–818. [Google Scholar] [CrossRef]
  85. Aifadopoulou, G.; Nikiforiadis, A.; Tsaples, G.; Boufidis, N.; Salanova Grau, J.M.; Chrysostomou, K. A holistic approach to the re-balancing problem of vehicle-sharing schemes. In Proceedings of the 99th Annual Meeting of the Transportation Research Board, Washington, DC, USA, 12–16 January 2020. [Google Scholar]
  86. Jonek-Kowalska, I.; Wolniak, R. Economic Opportunities for Creating Smart Cities in Poland. Does Wealth Matter? Cities 2021, 114, 103222. [Google Scholar] [CrossRef]
  87. Karlı, R.G.Ö.; Çelikyay, S. Current Trends in Smart Cities: Shared Micromobility. In Innovations in Smart Cities Applications Volume 5; Lecture Notes in Networks and Systems; Ben Ahmed, M., Boudhir, A.A., Karaș, İ.R., Jain, V., Mellouli, S., Eds.; Springer International Publishing: Cham, Switzerland, 2022; Volume 393, pp. 187–198. [Google Scholar] [CrossRef]
  88. Standing, C.; Jie, F.; Le, T.; Standing, S.; Biermann, S. Analysis of the Use and Perception of Shared Mobility: A Case Study in Western Australia. Sustainability 2021, 13, 8766. [Google Scholar] [CrossRef]
  89. D’Andreagiovanni, F.; Nardin, A.; Carrese, S. An Analysis of the Service Coverage and Regulation of E-Scooter Sharing in Rome (Italy). Transp. Res. Procedia 2022, 60, 440–447. [Google Scholar] [CrossRef]
  90. Carrese, S.; D’Andreagiovanni, F.; Giacchetti, T.; Nardin, A.; Zamberlan, L. An Optimization Model for Renting Public Parking Slots to Carsharing Services. Transp. Res. Procedia 2020, 45, 499–506. [Google Scholar] [CrossRef]
  91. Patel, A.R.; Tesoriere, G.; Campisi, T. Users’ Socio-Economic Factors to Choose Electromobility for Future Smart Cities. In Computational Science and Its Applications—ICCSA 2022 Workshops; Lecture Notes in Computer Science; Gervasi, O., Murgante, B., Misra, S., Rocha, A.M.A.C., Garau, C., Eds.; Springer International Publishing: Cham, Switzerland, 2022; Volume 13380, pp. 331–344. [Google Scholar] [CrossRef]
Figure 1. Detailed distribution of the average importance of attributes for the purpose of using a car-sharing vehicle for commuting to work or to a place of education.
Smartcities 07 00066 g001
Figure 2. Details of utility values for the “car type” attribute from the point of view of using it for commuting to work or to a place of education.
Smartcities 07 00066 g002
Figure 3. Details of utility values for the “rental price” attribute from the point of view of using a car-sharing vehicle for commuting to work or to a place of education.
Smartcities 07 00066 g003
Figure 4. Details of utility values for the “engine power” attribute from the point of view of using a car-sharing vehicle for commuting to work or to a place of education.
Smartcities 07 00066 g004
Figure 5. Details of utility values for the “standard of equipment” attribute from the point of view of using a car-sharing vehicle for commuting to work or to a place of education.
Smartcities 07 00066 g005
Figure 6. Details of utility values for the “drive type” attribute from the point of view of using a car-sharing vehicle for commuting to work or to a place of education.
Smartcities 07 00066 g006
Figure 7. Details of utility values for the “Euro NCAP rating” attribute from the point of view of using a car-sharing vehicle for commuting to work or to a place of education.
Smartcities 07 00066 g007
Table 1. An example of building a combination of preference profiles.
Travel Purpose: ….
Attributes
Examples
Average
Rental Price
Car
Type
Vulnerable Road User (VRU)
Protection
Rate
Luggage Compartment
Capacity (Seats Up)
Engine
Power
Safety
Assist Rate
Average
Rental Price
Levels1252351
4123133
3332242
2213251
Table 2. Attribute coding using artificial variables.
AttributeQuasi-Experimental Coding
Z1X1X2X3
Level I100
Level II010
Level III−1−1−1
Table 3. Method of calculating partial utilities for an attribute with three levels.
AttributeQuasi-Experimental Coding
Z1 b 1 X 1 b 2 X 2 b 3 X 3
Level I b 1 0 U 1 = b 1
Level II0 b 2 U 2 = b 2
Level III b 1 b 2 U 3 = ( b 1 + b 2 )
Source: the author’s own elaboration based on [61], where U 1 , U 2 , U 3 –partial utilities of an attribute A t C S .
Table 4. Characteristics of the analyzed car-sharing system.
FeatureDetailed Data
Type of business model of the systemFor profit: B2C/B2B
type of system operating modelFree-floating
Area/areas of operationBerlin city area
Vehicle rental price list0.40—over a 0.91 [€/km]
+ 1€ Unlock Fee (2€ premium vehicles)
+ 0.29€/min stopover
+ Reservation (10 min for free)
Types of available rental offersmin/km/long-term offers.
Table 5. Attributes and their levels considered in the case study analysis.
AttributeAttribute Levels
Car type [-]1. Small
2. Medium
3. Large
The average car-sharing vehicle rental price [€/km]1. 0.40–0.60 [€/km]
2. 0.61–0.90 [€/km]
3. over 0.91 [€/km]
Engine power [kW]1. 40–62 [kW]
2. 63–149 [kW]
3. over 150 [kW]
Car-sharing vehicle equipment standard [-]1. Parking sensors, navigation, handsfree, lane assistant, heated seats, cruise control
2. Parking sensors, navigation, handsfree, lane assistant, heated seats
3. Parking sensors
Drive type of the vehicle [-]1. Electric engine
2. Internal Combustion Engine
3. Hybrid engine
Euro NCAP rating [-]1. 1–3 stars
2. 3–4 stars
3. 5 stars
Table 6. Orthogonal plan for the analyzed case study.
AttributesCar Type [-]The Average Car-Sharing Vehicle Rental Price [€/km]Engine Power [kW]Car-Sharing Vehicle Equipment Standard
[-]
Drive Type of the Vehicle [-]Euro NCAP Rating [-]
Levels112312
111321
111312
111322
113213
112222
232212
222233
222223
333113
332223
333113
333123
Table 7. The results of the survey regarding the demographic data of the respondents.
FeatureNumber of Respondents [-]Number of Respondents [%]
Age
18–2583653.21%
26–3540325.65%
36–4525416.17%
46–55402.55%
Over 55382.42%
Sex
Women41726.54%
Men115473.45%
Domicile
Village744.71%
City up to 50,000 inhabitants19412.35%
City up to 100,000 inhabitants38624.57%
City up to 250,000 inhabitants42627.12%
City over 250,000 inhabitants49131.25%
Professional situation
Learning56235.77%
Working69143.98%
Unemployed261.65%
Pensioner181.15%
Learning and working27417.44%
Family status
Bachelor/Maiden102265.05%
Married53834.25%
Divorced/Divorced110.70%
Monthly earnings
Up to EUR 150053233.86%
EUR 1501—EUR 250043227.50%
EUR 2501—EUR 450032120.43%
over EUR 450128618.20%
Education
Basic30.19%
Junior high school452.86%
Basic vocational352.23%
High school78249.78%
Higher70644.94%
Disclaimer/Publisher’s Note: The statements, opinions and data contained in all publications are solely those of the individual author(s) and contributor(s) and not of MDPI and/or the editor(s). MDPI and/or the editor(s) disclaim responsibility for any injury to people or property resulting from any ideas, methods, instructions or products referred to in the content.

