Article

Micro-Level Bicycle Infrastructure Design Elements: A Framework for Developing a Bikeability Index for Urban Areas

by
Tufail Ahmed
1,*,
Ali Pirdavani
1,2,
Geert Wets
1 and
Davy Janssens
1
1
UHasselt, The Transportation Research Institute (IMOB), Martelarenlaan 42, 3500 Hasselt, Belgium
2
UHasselt, Faculty of Engineering Technology, Agoralaan, 3590 Diepenbeek, Belgium
*
Author to whom correspondence should be addressed.
Smart Cities 2025, 8(2), 46; https://doi.org/10.3390/smartcities8020046
Submission received: 17 December 2024 / Revised: 28 February 2025 / Accepted: 5 March 2025 / Published: 12 March 2025
(This article belongs to the Section Smart Transportation)

Abstract

:

Highlights

What are the main findings?
  • This research introduced a new analytical bikeability index framework integrating micro-level indicators based on five internationally recognized bicycle infrastructure design principles: safety, comfort, attractiveness, directness, and coherence.
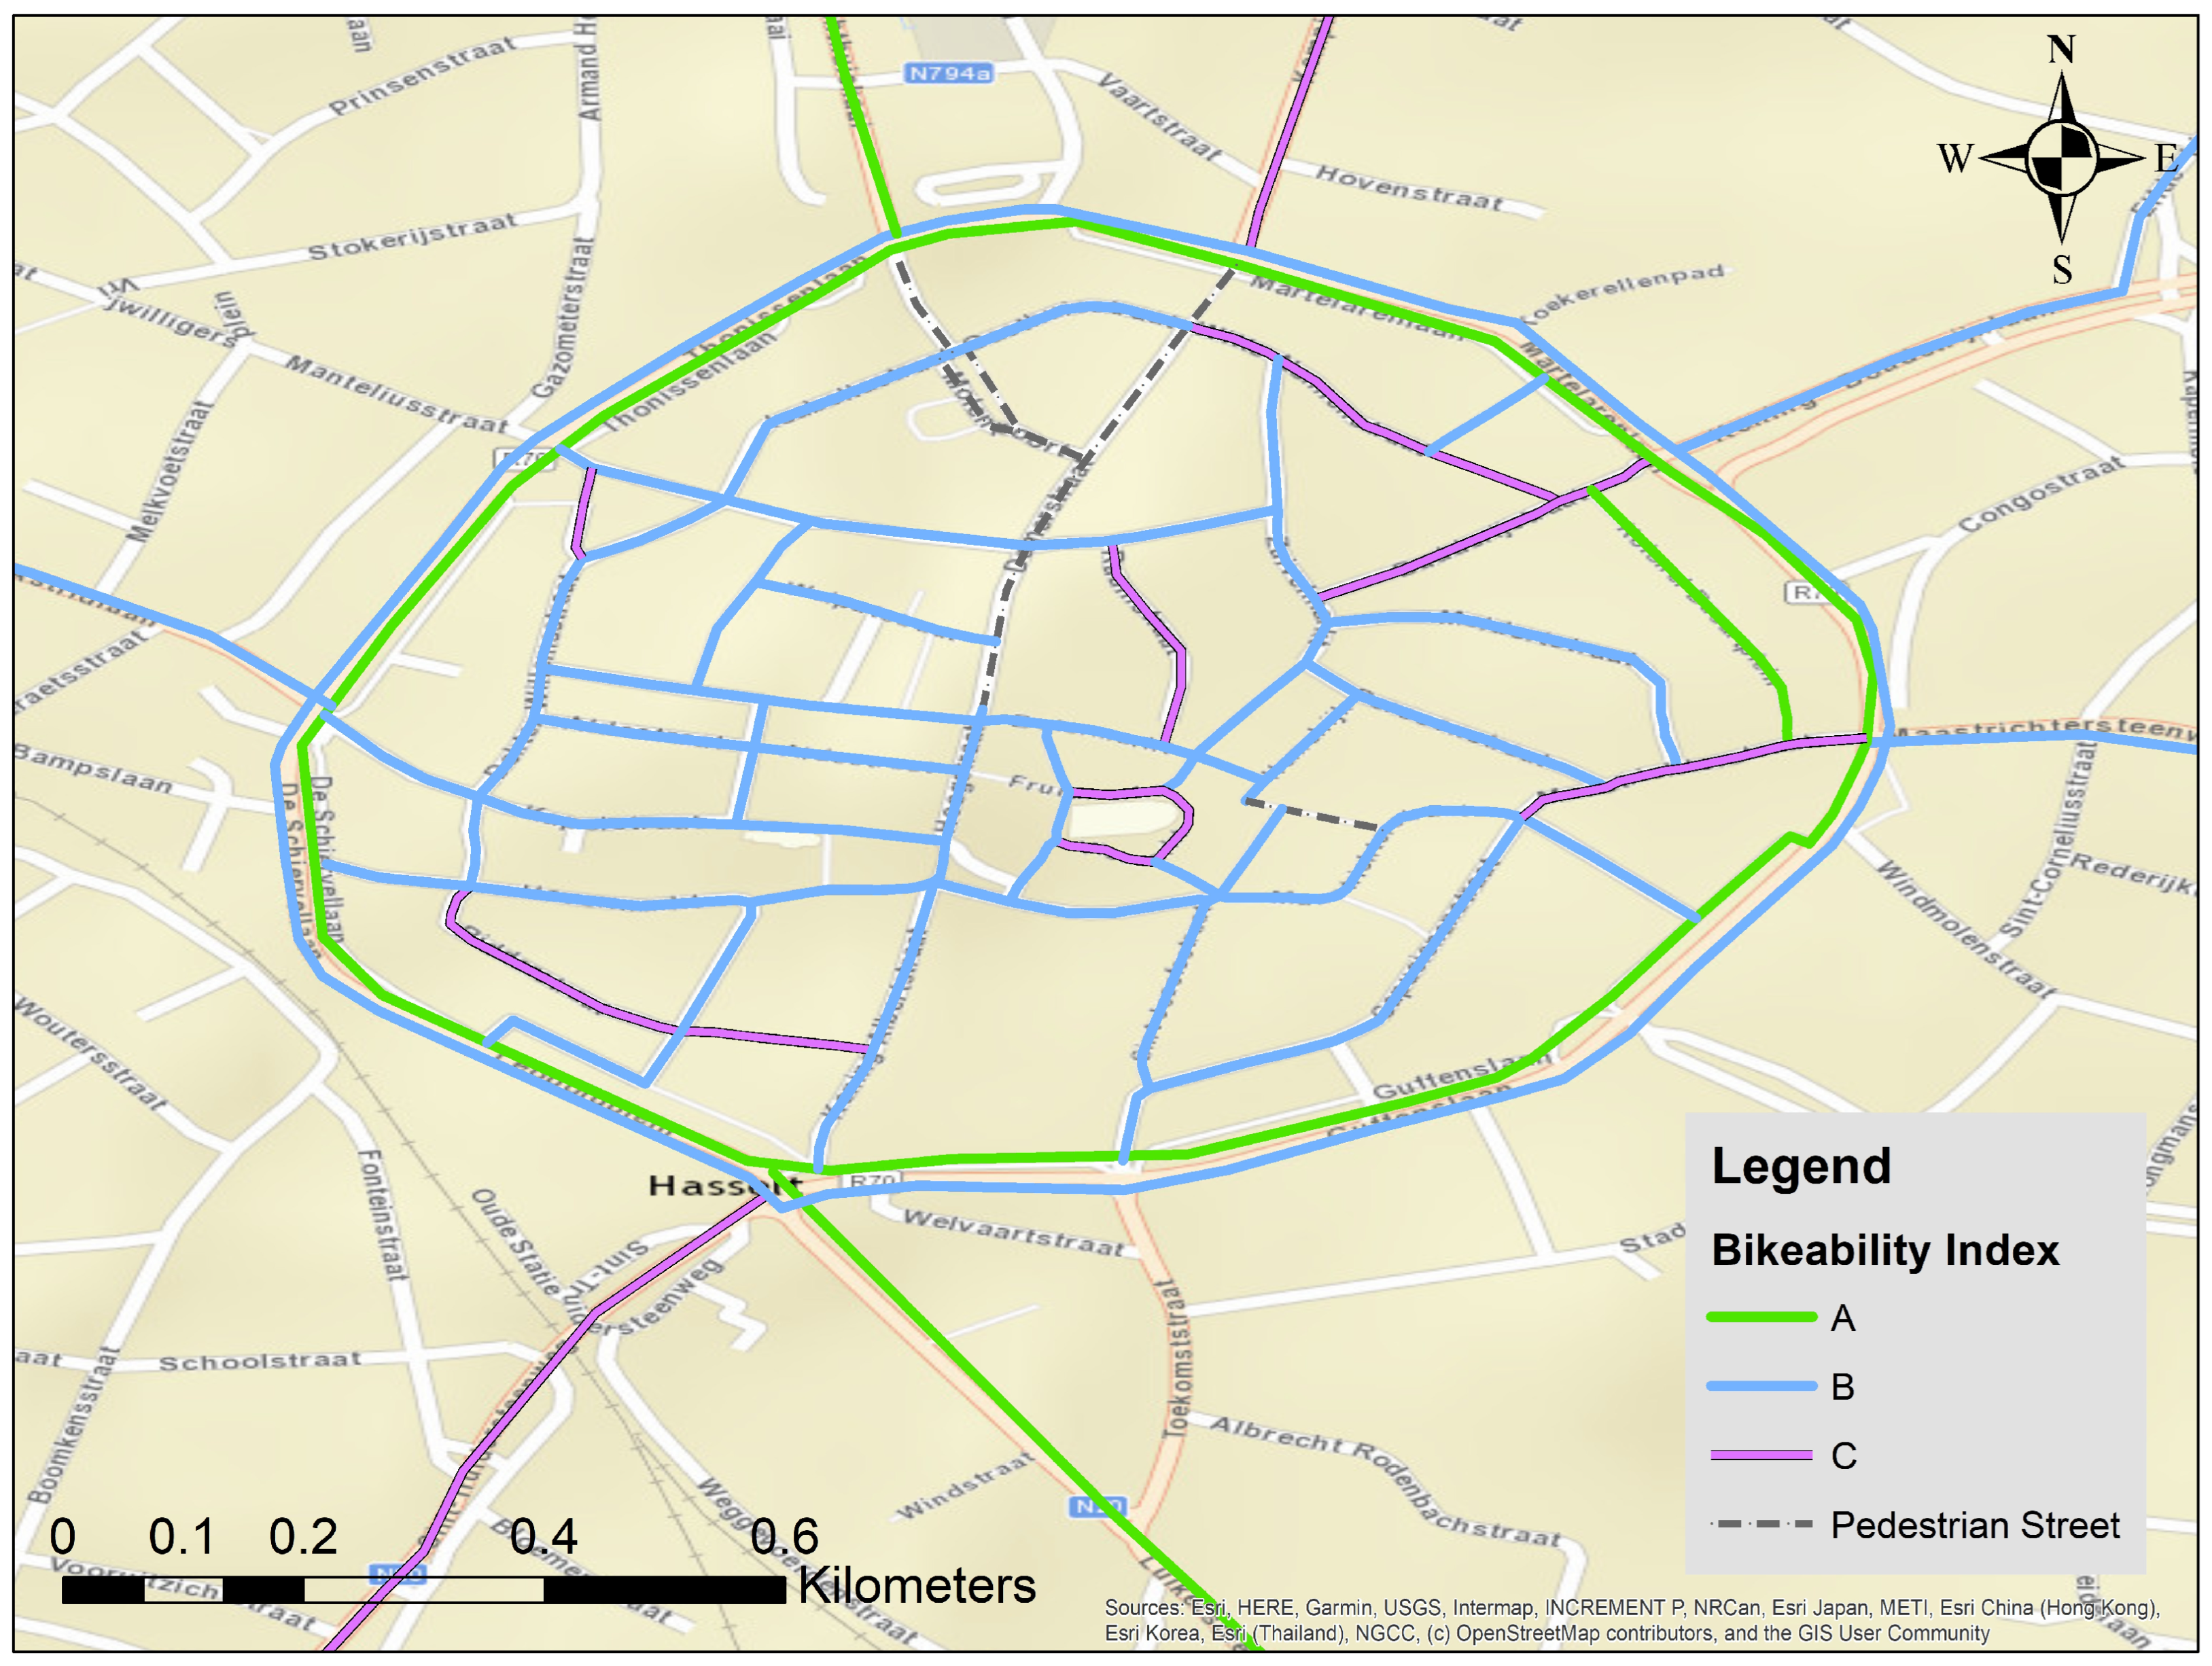
  • The proposed framework was applied in Hasselt, Belgium, successfully identifying low and high-bikeable areas.
What are the implications of the main findings?
  • The BI framework provides urban planners with a practical tool to identify low bikeability areas and suggests improvements in cycling infrastructure.
  • This tool’s scalable and adaptable nature makes it relevant for cities committed to enhancing cycling environments and promoting a sustainable mode of transport by making cycling-friendly cities.

Abstract

Modern and smart cities prioritize providing sufficient facilities for inclusive and bicycle-friendly streets. Several methods have been developed to assess city bicycle environments at street, neighborhood, and city levels. However, the importance of micro-level indicators and bicyclists’ perceptions cannot be neglected when developing a bikeability index (BI). Therefore, this paper proposes a new BI method for evaluating and providing suggestions for improving city streets, focusing on bicycle infrastructure facilities. The proposed BI is an analytical system aggregating multiple bikeability indicators into a structured index using weighed coefficients and scores. In addition, the study introduces bicycle infrastructure indicators using five bicycle design principles acknowledged in the literature, experts, and city authorities worldwide. A questionnaire was used to collect data from cyclists to find the weights and scores of the indicators. The survey of 383 participants showed a balanced gender distribution and a predominantly younger population, with most respondents holding bachelor’s or master’s degrees and 57.4% being students. Most participants travel 2–5 km per day and cycle 3 to 5 days per week. Among the criteria, respondents graded safety as the most important, followed by comfort on bicycle paths. Confirmatory factor analysis (CFA) is used to estimate weights of the bikeability indicators, with the values of the resultant factor loadings used as their weights. The highest-weight indicator was the presence of bicycle infrastructure (0.753), while the lowest-weight indicator was slope (0.302). The proposed BI was applied to various bike lanes and streets in Hasselt, Belgium. The developed BI is a useful tool for urban planners to identify existing problems in bicycle streets and provide potential improvements.

1. Introduction

Bicycles play a vital role in smart mobility systems by offering environmental advantages and affordability and encouraging healthier lifestyles. Using bicycles offers long-term environmental impacts with zero emissions and a reduction in noise pollution [1]. Traffic congestion, traffic accidents, noise pollution, and environmental pollution are common issues in cities these days [2,3]. These problems are strongly linked with motorized vehicles, which makes bicycling a more attractive mode of transport [4]. Using the bicycle offers other advantages as it is inexpensive, while in traffic congestion, it can be faster than other modes of transportation [5].
Previously, transportation planners focused on safe motorized vehicle movement while giving less consideration to sustainable modes such as bicycling in cities [6,7]. However, the policymaker’s paradigm has been shifted, diverting trips from private cars [7,8]. They see cycling as an alternative travel mode due to increasing concerns over greenhouse gas emissions polluting the environment, traffic congestion, increased travel time, and other related urban traffic issues [9,10]. In addition, using bicycles as a mode of transport comes with various benefits to individuals and the community. Hence, governments worldwide promote programs and policies to encourage bicycle use in cities. Consequently, robust bicycle infrastructure is essential for smart cities to promote sustainable transportation and minimize dependency on motorized vehicles.
Past studies show that supportive cycling infrastructure is crucial for attracting new bicycle users. The provision of new cycle lanes, routes, streets, and paths has significantly increased the daily bicycle use for different activities [11]. For example, Copenhagen, Denmark, is among the most bicycle-friendly cities globally due to its extensive bicycle infrastructure planning [12]. One study shows that the bicycling mode share for traveling increased and reached 45% of all trips to educational institutes or workplaces in Copenhagen [13]. Other researchers have also emphasized the importance of cycle infrastructures in a study conducted for 43 large cities in the U.S. [14]. Further, research in Patras, Greece, found that developing bicycling infrastructure facilities will likely increase citizens’ sense of having a transport means that offers flexibility for their mobility needs [15].
Bicycle facility planning, construction, and management are time-consuming and costly processes. Hence, it is crucial to ensure that cyclists use the provided facilities. Many variables impact the experience and uptake of bicycling, such as connectivity to destinations, vehicular traffic, road conditions, gradient, and weather [16]. Objective and subjective evaluations may assist in determining which factors can make a bicycle pathway, an area, a zone, or a location more or less bicycle-friendly. The idea of bikeability has emerged from research on walkable cities and walkability [6,17]. Some researchers have stated that bikeability is the degree to which the actual and perceived environment favors bicycling [18,19]. Bikeability is influenced by various infrastructure factors, which can be quantified using indicators. These indicators contribute to an overall bikeability index, which helps assess cycling conditions systematically. Promoting cycling use must be accompanied by providing appropriate infrastructure facilities which can serve as indicators. Bicycle infrastructure should be designed to make cycling comfortable, safe, convenient, and attractive for everyone [20]. Also, research has found a significant relationship between bicycle mode choice and infrastructure accessibility. It shows that a 10% increase in the accessibility index resulted in a 3.7 percent increase in bicycle use [21].
Several methods to assess the bicycle environment have been developed over the years. The evaluation tools can assess bike infrastructure and identify areas for improvement. Level of service (LOS) was established based on users’ perceptions of evaluating bicycle paths [22]. Some of the most popular methods in the literature are bicycle level of service (BLOS), bicycle safety index rating (BSIR), bicycle suitability rating, bicycle compatibility index (BCI), and BI [10,16,23,24]. The BI measures the bicycle network’s ability, comfort, and convenience for a cyclist to reach the destinations [6,16,25]. Some of the well-known BI methods are the Active Commuting Route Environment Scale (ACRES), BikeDNA, Area-Wide Bikeability Assessment Model (ABAM), Bike Score®, and Bikeability and Walkability Table (BiWET).
Compared to existing bikeability indices, which often focus on a limited number of factors such as safety, comfort, or connectivity, this research introduces a more comprehensive framework. By integrating micro-level infrastructure indicators with cyclists’ perceptions and employing a mathematical weighing and scoring model, the proposed BI provides a more practical and adaptable tool for urban planners. This addresses gaps in previous methodologies, which either lack user-centric perspectives or fail to incorporate essential bicycle infrastructure design principles holistically. The developed BI framework will have specific advantages, such as being easy to follow, easy to compute, adaptable to various streets in the city, and user-centric. Moreover, the index helps detect low-bikeability areas on street and road networks, which helps suggest improvements in such areas.

2. Literature Review

Previously, different methodologies have been developed to assess the bicycle infrastructure. Hence, reviewing the research on urban bikeability methods available to evaluate bicycle lanes or streets is important. Besides, reviewing previous studies provides a strong base for the present research work. There are various methods for evaluating bicycle infrastructure. BSIR uses traffic volume, pavement condition, speed limit, number of lanes, the width of the outermost lane, and also location as the main indicators considered for the assessment [26]. This model rates the bicycle paths on a scale of excellent to poor. However, in this method, several bicycle infrastructure facilities and variables that affect bicyclist safety and comfort (e.g., road marking, bike box at the intersection, and gradient) are not factored into the equation [4]. Also, the classification of the streets is achieved based on the author’s decision, which reduces the method’s reliability. Afterward, this method was modified, and a new modified roadway condition index (RCI) model was proposed [27]. In RCI, some indicators, such as pavement factors and location, were modified. At the same time, the lane width was multiplied by the speed limit, considering narrow roads with high speeds to place higher weightage. The modified method was compared to bicycle accident rates, and it was discovered that the revised RCI rating only illustrates 18% of the variation in bicycle crash rates [27]. This suggests a weak relationship between the modified RCI rating and actual bicycle safety on bicycle streets and lanes. Similarly, BSIR was revised to make another model called the Bicycle Suitability Rating (BSR) model [28]. It was achieved by removing the intersection evaluation index from the rating criteria, leaving only the roadway segment index as a component of a BSR.
Another assessment model, the interaction hazard score (IHS), was developed to evaluate bicycle suitability in cities [29]. IHS recognized the significance of roadside development patterns and curb cut (or on-street parking) frequencies. Another approach improved this model by proposing BCI and including bicycle lanes’ effects [30]. Furthermore, Landis et al. [22] later validated the IHS model to create a BLOS model.
Multiple methodologies have been implemented for BLOS, and the literature has increased in the last three decades [31]. The BLOS approach was one of the famous metrics for rating bicycle infrastructure [32]. Additionally, it can be used to determine and estimate LOS experienced by bicyclists on the cycleway [33]. Other prominent methods in the literature include the Highway Capacity Manual LOS approach for bicycles (HCM, 2010), BLOS [4,22,34,35], non-motorized level of service [36], and level of traffic stress [37].
In recent years, research on bikeability has grown significantly [6,38]. The concept of bikeability has emerged from research on walkable cities and societies [17] and concepts like 15-min cities, which promote communities that are more walkable, bike-friendly, and transit-oriented [39]. Though there are some similarities between bikeability and walkability, significant differences exist in how the two are measured [16]. For example, the availability of infrastructure is more important than land use for bicycling [17]. In 2002, the U.S. Department of Transport gave some criteria that may describe bikeability: the availability of high-quality bicycle road infrastructure, the condition of the road infrastructure’s pavement, the ease of crossing an intersection, and the ease of riding a bike [40]. The ACRES was developed to assess the perceptions of pedestrians and cyclists regarding various aspects of their riding and commuting route environment [41]. Physical, traffic, and social environment factors were considered. However, the model does not consider bicycle infrastructure attractiveness and coherence factors such as signage, continuity, cycling route directness, etc. Moreover, this tool requires medium expertise, cost, and time [16].
Similarly, the BiWET method was developed in 2007 at the University of Graz, Austria [42]. The BiWET tool comprises 15 characteristics that are organized by the physical environment attributes of land use, traffic safety, attractiveness, and walking/cycling infrastructure. It is an efficient data collection method because evaluators audit while riding their bikes. However, this method is subjective, which increases biases in the data collection method since it solely depends on the researcher’s perception. In addition, BiWET calculation is based on 10-m street segments, which can be time-consuming if BI for the whole city is needed.
The Bike Score is another bikeability method inspired by the concept of the walk score [43]. Neighborhood bikeability can be rated on a scale of 0 to 100 using this method [44]. Many studies have later used the developed tool to examine cycling behavior in two countries (the U.S. and Canada) [45,46]. However, this method does not incorporate the users’ perception in computing the Bike Score, which many researchers argue is essential for such studies [6,10]. In addition, Bike Score may be more problematic for research purposes due to the lack of transparency in calculating the score [16]. Moreover, Bike Score only uses four attributes to calculate BI: the bike lane score, hill score, destinations and connectivity score, and bike commuting mode share, which may not show the whole picture of bicycle facilities.
The methods mentioned above are primary mathematical models that rate the streets and environment for cycling. However, the developed BIs mostly considered comfort and safety while developing the method. Some researchers [42,43] only rely on subjective evaluation, which can create biased results. In addition, most studies have ignored the users’ perception in computing the bikeability for the area, limiting the use of such techniques. Researchers argued that users’ perception is critical in the walkability or bikeability methods [6,16,47]. In addition, while methods such as BLOS, Bike Score, and BiWET provide meaningful evaluations of urban bikeability, they often lack integration of key infrastructure principles or rely solely on objective factors without incorporating user perception. The proposed framework bridges this gap by incorporating a comprehensive set of indicators derived from bicycle infrastructure design principles and cyclist preferences, ensuring a more comprehensive and actionable assessment. As a result, the first goal of this research is to identify the key bikeability indicators under each infrastructure design principle and the possible measurement levels that influence the BI at the micro-level. This study does not include macro-level indicators, such as network connectivity, overall network density, etc. The second goal is to combine these into a mathematical model that can be used to assess and classify various streets in cities. Thus, an effort is being made to include all important bicycle infrastructure facility indicators in BI, and using the developed method will help suggest improvements to the existing bicycle streets.

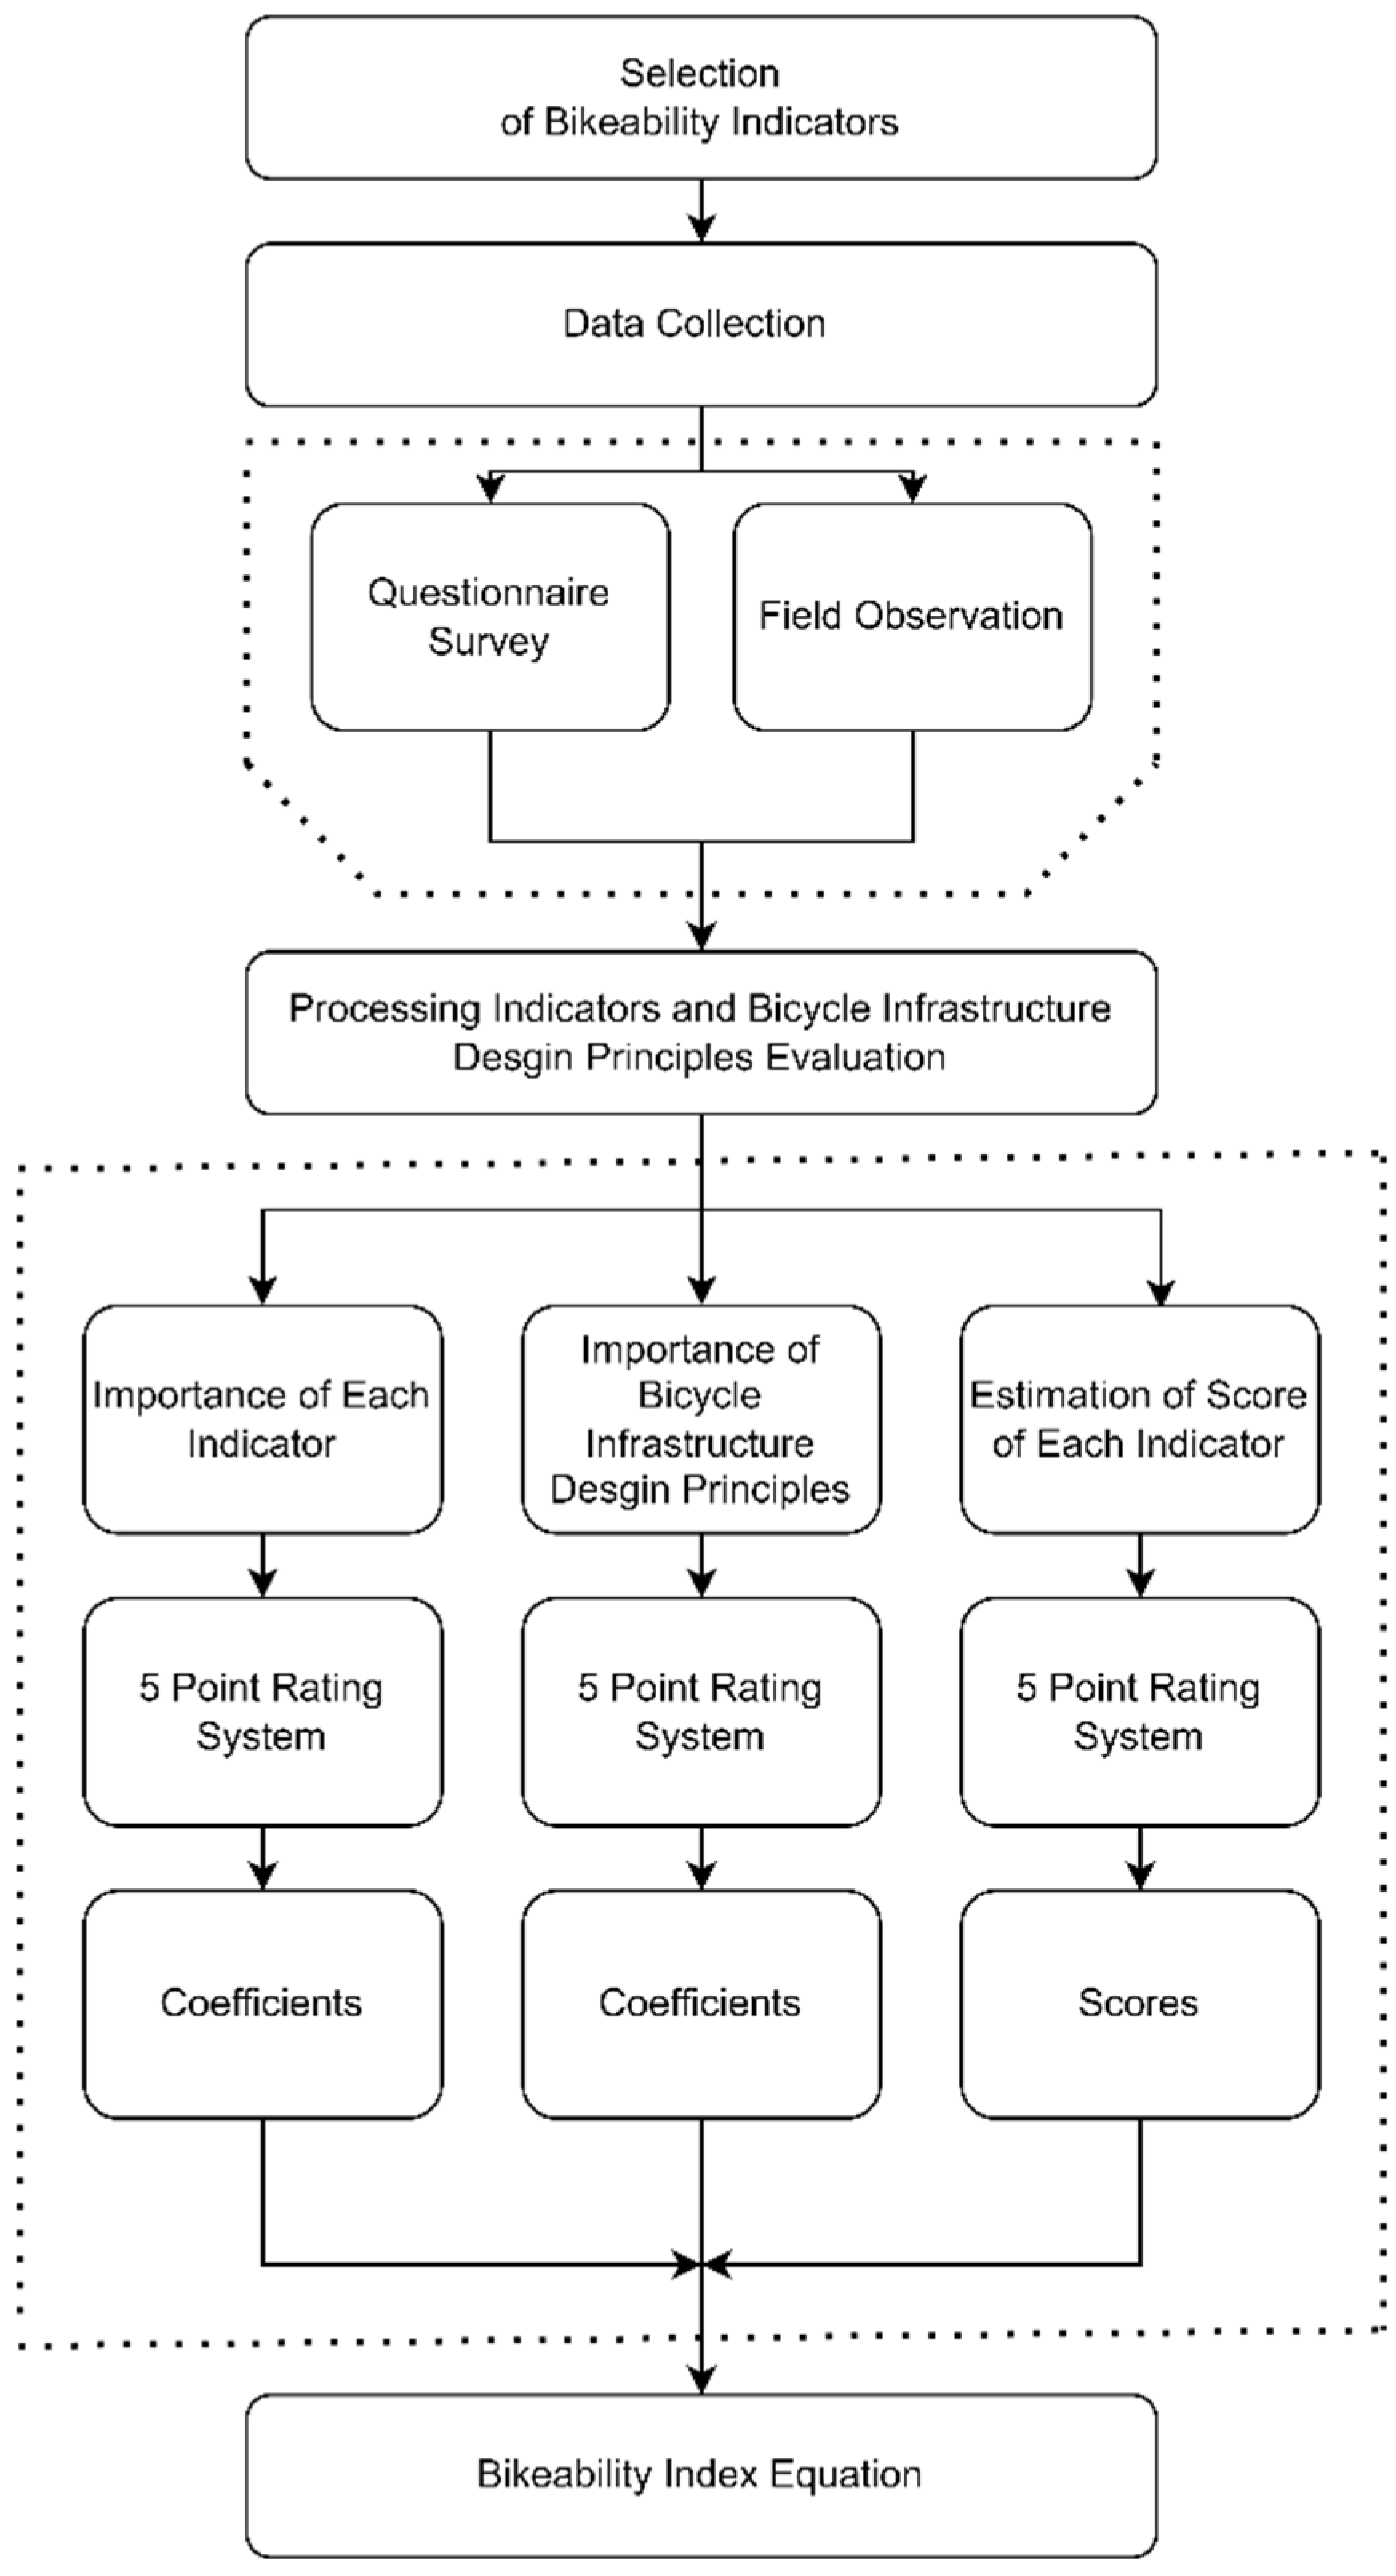
3. Materials and Methods

This study employed a quantitative approach to developing an index for measuring bikeability in urban areas. Figure 1 comprehensively describes the methodology adopted for developing urban BI. The methodology was developed in four steps to create a new BI. The first step includes selecting the relevant bikeability indicators. Since all the indicators do not equally affect the bikeability of a street, the weights represent the importance of each indicator in the BI calculation. The next step involved estimating the weights of the selected indicators. The third step involves estimating the scores for each indicator. Indicators can be assigned a score based on their comfort, safety, or attractiveness to cyclists. The safer or more comfortable cyclists perceive an indicator to be, the higher the score it receives. The following step combines each criterion’s weight, indicator’s weights, and scores to determine the selected street classifications. The classification of streets helps interpret the results by understanding the bikeability levels. In addition, it helps identify areas that need improvement. Finally, data were collected (field visits, Google Street View) to apply the developed method to assign scores based on observed indicators. The new BI is inspired by methodologies previously used for research, such as the BLOS, urban walkability index, comfort walkability index, and bicycle safety index [10,48,49,50].

3.1. Selection of Bikeability Indicators

Firstly, a literature review of research articles and bicycle infrastructure design guidelines was conducted using Scopus, Web of Science, and Google Scholar to shortlist the indicators. The review focused on identifying indicators related to bicycle facilities. Important bicycle facility indicators used in multiple research articles were selected to be measured at the micro level, ensuring a detailed evaluation of infrastructure characteristics. This research employs the five bicyclists’ needs, in other words, bicycle infrastructure design principles. These design principles are the bicycle network’s coherence, directness, attractiveness, safety, and comfort. The criteria and indicators selected in this research are classified in the framework of these five design principles. Such criteria are accepted internationally as valid criteria for evaluating bicycle infrastructure [12,21,51]. After a comprehensive review, 15 bikeability indicators grouped into five design principles were selected. The classification of indicators under each design principle was based on how they have been most commonly used in previous studies assessing bikeability. While some indicators, such as bicycle parking and road signage, could fit into multiple categories, they were assigned to the category where they have been predominantly applied in the literature. Two principles, directness and coherence, were combined as they both contribute to creating an efficient and seamless cycling network by minimizing detours, interruptions, and ensuring connectivity. The overlapping effects of these principles lie in their shared goal of optimizing route efficiency and network continuity. Specifically, directness focuses on minimizing travel distance and time, while coherence ensures logical route connections without unnecessary deviations. Table 1 shows the selected indicators for constructing the BI.

3.2. Estimation of Weights of Selected Indicators

The relative importance or weight of an indicator represents its impact on BI. The importance of bikeability indicators was collected using a questionnaire. Each indicator’s importance, representing the weight, was estimated using a five-point Likert scale questionnaire. The five-point is a widely accepted method for capturing subjective perceptions and measuring the relative importance of indicators in transportation studies [49,66]. Moreover, the Likert scale is often preferred for assessing subjective opinions due to its simplicity, ability to capture a range of responses, including a neutral midpoint, and ease of use compared to other scales [67]. The participants could rate the bikeability indicators from 1 to 5 based on their importance for using bicycles as a mode of transport in cities. A scale of 5 shows that the indicator is very important, while a scale of 1 represents the least important indicator. The questionnaire was distributed in major locations in the city. The survey is divided into three sections: (i) demographic information, (ii) bicycle use patterns, and (iii) Likert scale questions in which cyclists ranked indicators and sub-indicators.
The survey was administered using a mixed-mode approach, combining online and physical distribution methods to enhance reach and diverse participation. Specifically, the questionnaire was distributed through online links on various social media platforms, targeting active cyclists who are likely to engage in digital spaces. Additionally, the pamphlets with QR codes were distributed at major locations in Hasselt, Belgium, including public squares, educational institutes, libraries, bus stops, train stations, city centers, and cycling routes. This dual approach was aimed at maximizing participation.
The sampling strategy combined convenience and voluntary response sampling, capitalizing on the accessibility of online platforms and public distribution points. While this approach facilitated a broad reach, it may have introduced self-selection bias, as participants with a stronger interest in cycling or digital accessibility were more likely to respond. Despite this limitation, the sample size (n = 383) was sufficient for statistical analysis, providing meaningful insights into the relative importance of bikeability indicators. The sample size of 383 respondents was determined based on a 5% margin of error and a 95% confidence interval. The survey was conducted between August 2023 and February 2024. Six hundred eighty-four participants opened the survey link, and 383 completed it.
Several statistical tests were conducted to ensure the collected data’s reliability and validity. The reliability of the questionnaire was assessed using Cronbach’s alpha, which evaluates internal consistency. Principal Component Analysis (PCA) with Varimax rotation is used to analyze the collected data, a widely used method for Exploratory Factor Analysis (EFA). It was employed to identify patterns and group indicators into meaningful dimensions. The Kaiser–Meyer–Olkin (KMO) test was used to assess sample adequacy, with a minimum threshold of 0.70. In the second step, the CFA was performed in AMOS (Analysis of Moment Structures version 28) to further validate the structure. The detailed results of these assessments, including statistical values and interpretations, are provided in the Results section.

3.3. Measuring Scores of Indicators

Similar to estimating weights of selected bikeability indicators, the scores were assigned to each measurement variable (sub-indicator) for the selected indicators. Each indicator can have multiple possible sub-indicators; for example, the presence of bicycle infrastructure can be measured and scored based on the presence of a solitary bike path, physically separated (by height or space) bicycle lane, bicycle lane, bicycle prioritized streets, suggested bicycle paths, bicycle paths shared with motorized traffic.
To determine the score for each measurement variable, we conducted a survey in which respondents evaluated their importance using a Likert scale (e.g., “very important” to “not important”). The responses gathered from this survey were essential in establishing scores for each measurement variable. Each measurement variable’s mean score was computed based on the survey response. These Likert-scale responses were then normalized using Min–Max normalization, which ensures that all scores fall within the 0 to 1 range. The normalization was performed using the following formula:
x = X X m i n X m a x X m i n
where the following applies:
x is the normalized score ranging from 0 to 1.
X represents the mean Likert score for a specific sub-indicator.
X m a x is the highest mean score recorded among all sub-indicators in the respective category.
X m i n is the lowest mean score recorded among all sub-indicators in the respective category.
This approach ensures that the lowest-rated measurement variable in each category receives a score of 0, the highest-rated variable receives a score of 1, and all other variables are scaled proportionally between these values. For example, if a physically separated bike lane had the highest mean Likert score, it would be assigned a normalized score of 1.0, while a shared bike lane with motorized traffic, with a much lower mean Likert score, would receive a normalized score of 0. A dual-method approach was used to assess the actual infrastructure conditions: on-site field visits and Google Street View analysis. This method enabled us to evaluate each street directly and assign a score based on its current conditions, thus categorizing its BI. This approach ensures a comprehensive and realistic assessment of bikeability indicators grounded in on-site conditions. The final scores derived from this process were used in Equation (2) to compute the overall BI for urban streets.

3.4. BI Mathematical Definition

The current research measures bike path bikeability by considering the bicycle design principle. For this purpose, a new assessment tool (BI) has been developed. Because each of the fifteen indicators affects bikeability differently, it is represented by its coefficients for developing the BI assessment tool shown in Equation (2) below. The equation represents a weighed additive function and also incorporates bicycle user perception. The additive function is chosen because each indicator contributes independently to bikeability, and their combined effect determines the overall assessment. This approach ensures that all relevant indicators are appropriately weighed and scored in the function. This assessment tool formulation considers different particularities such as bicycle facilities, bicycle user preferences, and perception.
B I W = j c ( i = 1 n C c i S c i ) + j s ( j = 1 m C s j S s j ) + j a ( k = 1 p C a k S a k ) + j d c ( l = 1 q C d c l S d c l )
where the following applies:
BIW = bikeability weighted index
jc = coefficient/weight of comfort criteria
js = coefficient/weight of safety criteria
ja = coefficient/weight of attractiveness criteria
jdc = coefficient/weight of directness and coherence criteria
C c i = coefficient/weight of comfort indicators
S c i = score of comfort indicators
C s j = coefficient/weight of safety indicators
S s j = score of safety indicators
C a k = coefficient/weight attractiveness indicators
S a k = score of attractiveness indicators
C d c l = coefficient/weight of directness and coherence indicators
S d c l = score of directness and coherence indicators
n,m,p,q = total number of indicators in each category (comfort, safety, attractiveness, directness and coherence)
The BIW illustrates the bikeability score, while C shows the coefficient of the indicators, which is different for each indicator. The coefficient of indicator (C) represents the importance of the indicators for a cyclist and its priority in the BI calculation. This coefficient was calculated from the data collected via a questionnaire from bicycle users. Similarly to [4,68], data was collected for each indicator’s score to calculate BI. Each measurement variable (sub-indicator) describes the bicycle path and surrounding characteristics that affect BI. For all fifteen indicators, sub-indicators (measurement variable) that contribute to quantifying the score of each indicator are defined. The indicator’s highest score value is 1, showing that it is approaching the perfect condition, while the lowest value is 0, suggesting that it is very far from perfect.
After calculating BIW, the next step is to find the maximum weighted score (BIMS) for each indicator. Each indicator’s BIMS is calculated by multiplying one (maximum possible score of the indicator) by each criterion’s weight. Similarly, the maximum possible bikeability index (BIMP) is calculated, which is achieved by adding the BIMS of all the indicators in each criterion. The maximum BIMP is shown in Equation (3).
B I M P = r = 1 R B I M S r
R = n + m + p + q, where n, m, p, and q are the number of indicators for each criterion (comfort, safety, attractiveness, and directness and coherence).

3.5. Bikeability Classification in Categories

After calculating the BIW and BIMP based on Equations (2) and (3), the BI% can be defined for the bicycle paths. Equation (4) is used to calculate the BI%, which can be used to classify the results and interpret the results obtained for the bicycle paths.
B I % = B I W B I M P × 100
Based on the Equation (4), the resultant score ranges from 0–100. Most BI studies classify the streets based on the resultant values [10,43,69]. The resulting scores for the examined segments are classified into five BI classes utilizing a basic concept often employed in traffic research [16,22,50]. The categorization of the results makes the resultant values more understandable [50]. BI% can be used to compare the bikeability indicators with the perfect condition and can be used to suggest improvements based on the assigned rating. Table 2 shows the interpretation of the results after calculating BI%.

4. Results

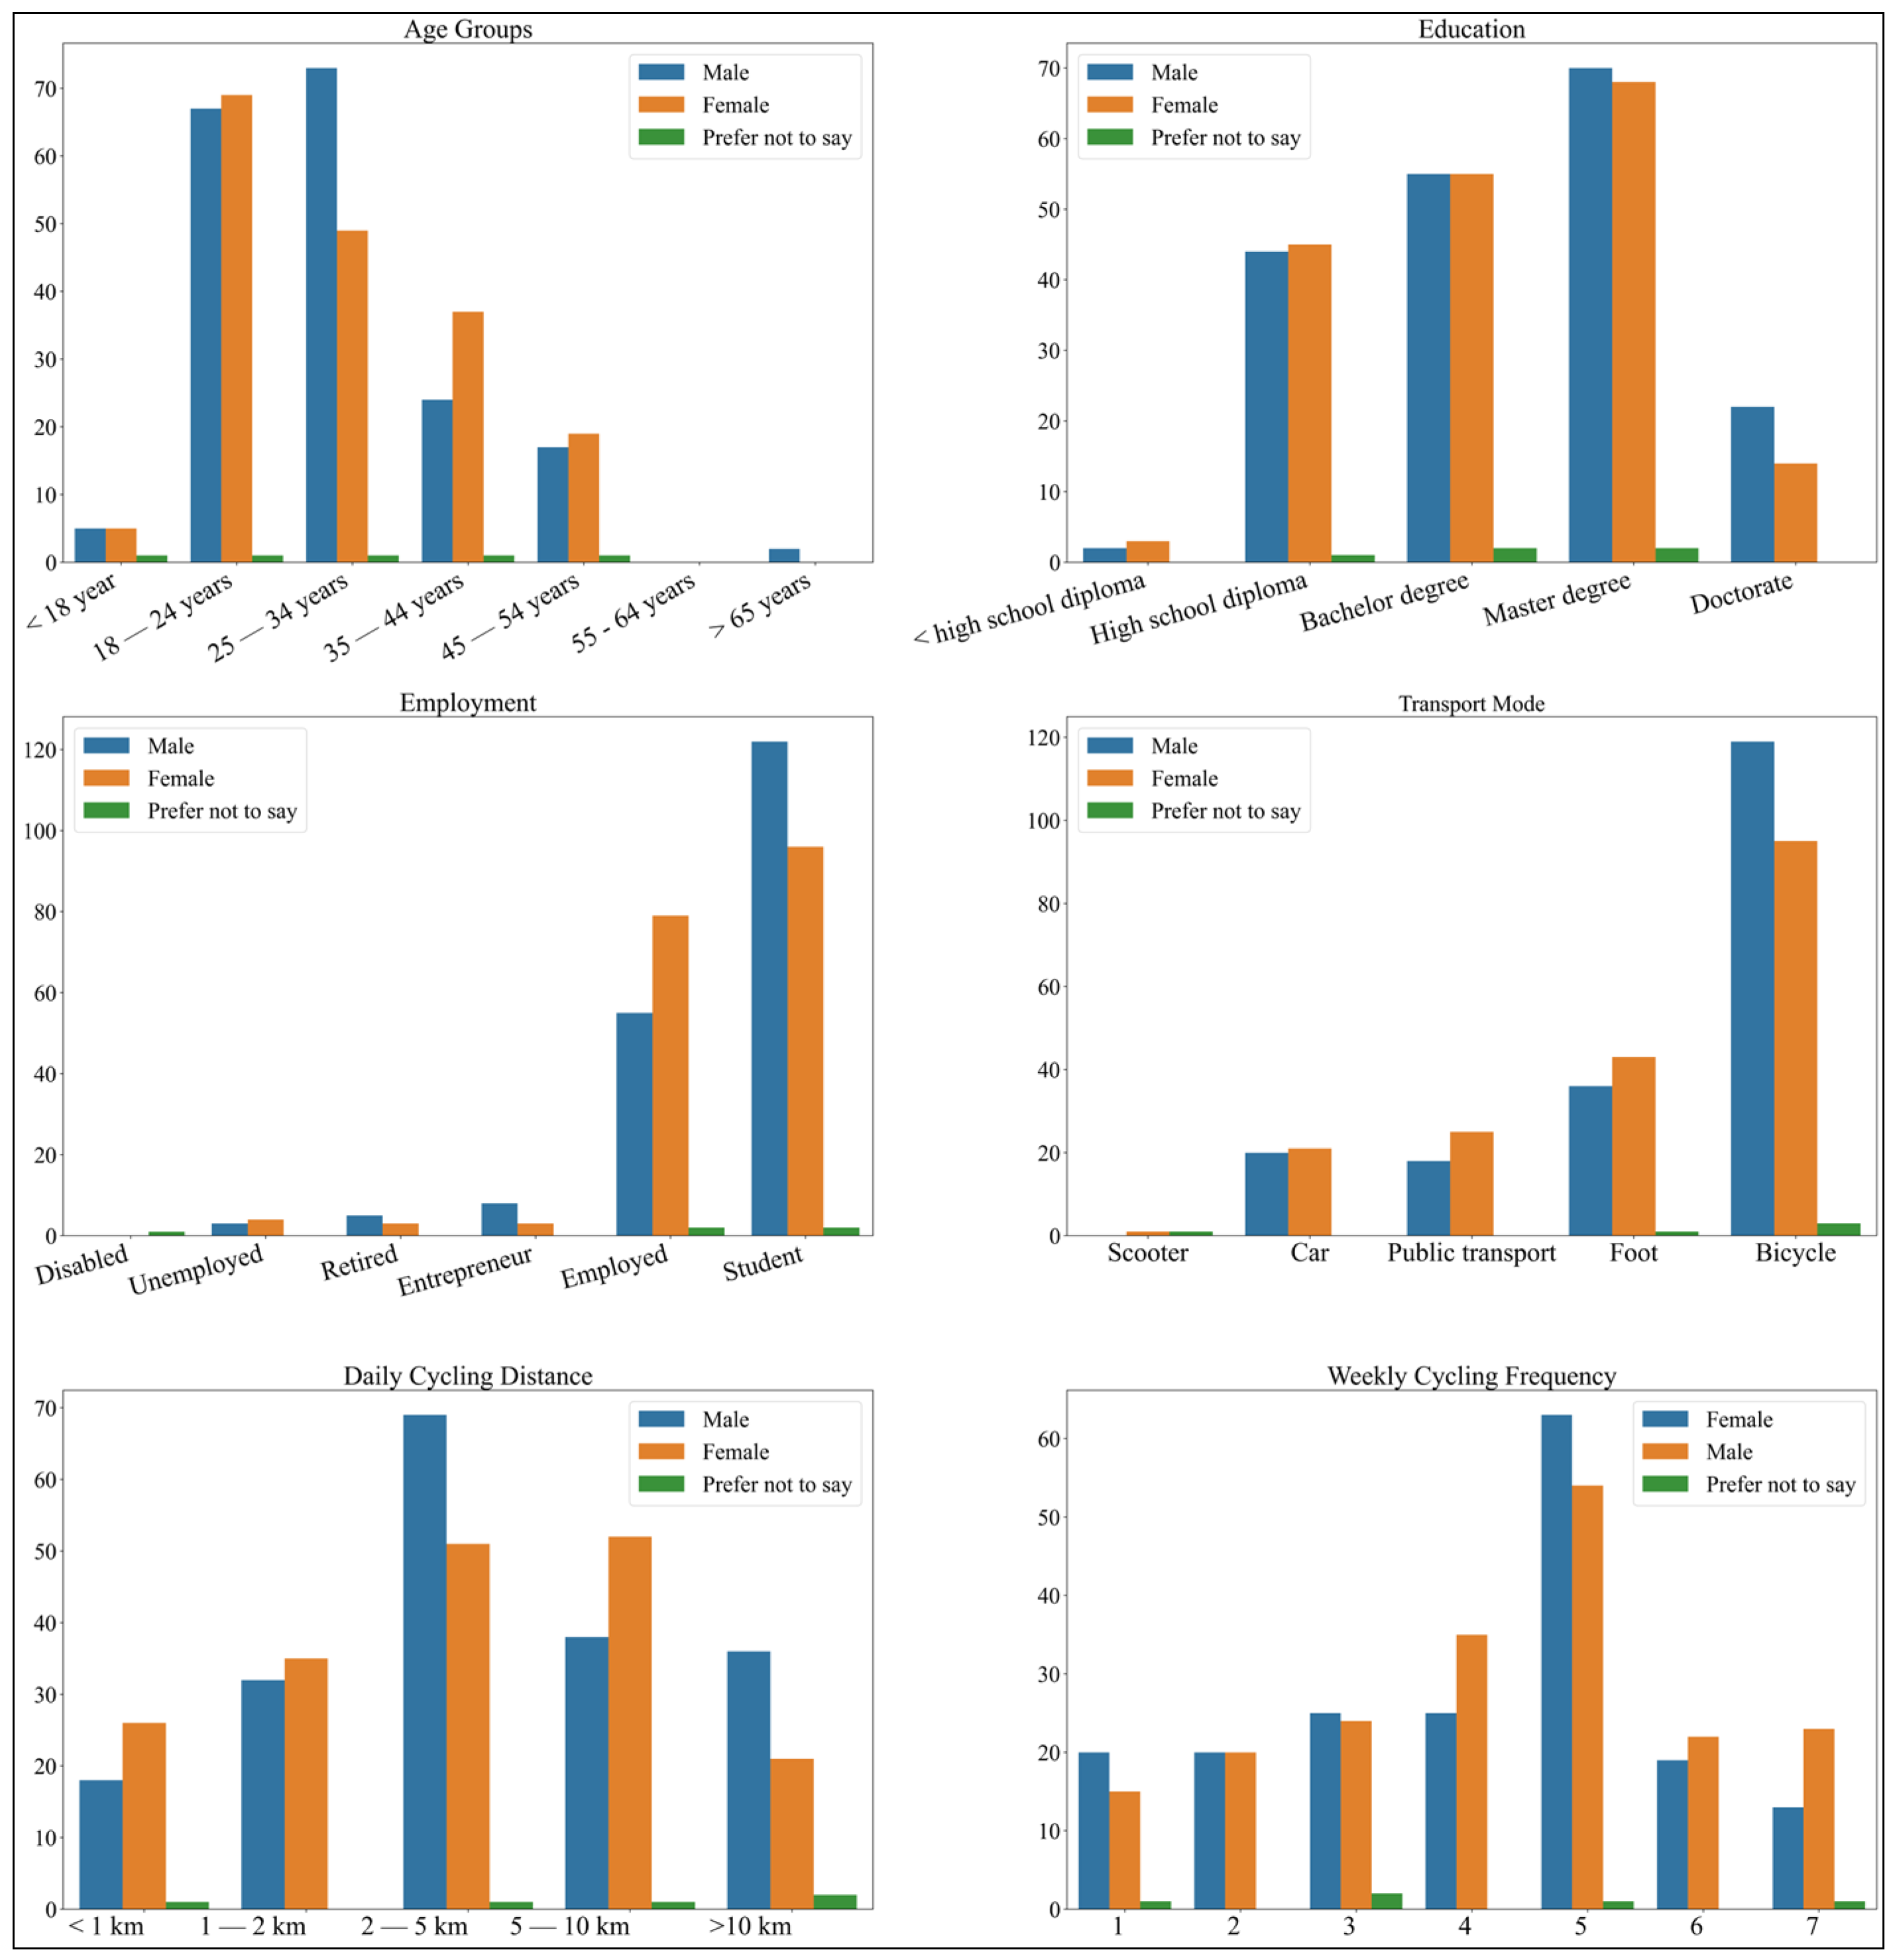
4.1. Summary Statistics

Figure 2 shows the sociodemographic characteristics and bicycle use of the 383 participants. The distribution of genders among participants was balanced, comprising 50.4% males and 48.3% females, with five individuals opting not to reveal their gender. Most participants (35.8%) fell within the 18–24 age bracket, with those aged 25–34 the next largest group (32.1%). There were only two participants over 65 years, and the 55–64 age group was similarly small, with just five participants. Most common were having bachelor’s (28.5%) or master’s (36.3%) degrees. The survey showed a significant presence of students (57.4%), reflecting a younger population responding to the survey, followed by those in employment (35.5%). Entrepreneurs comprised a smaller portion of the respondents (2.9%), and there was only one disabled respondent, with seven reporting as unemployed. Based on the survey, cycling emerged as a favored means of transportation for both men and women, with over half of the participants preferring to use a bicycle in urban areas. Daily cycling distances varied from under 1 km to more than 10 km, with the 2–5 km distance being the most frequently reported. The regularity of cycling per week also showed variation, with the majority cycling for 3 to 5 days.

4.2. Coefficient and Scores of Bikeability Indicators

The survey results for the importance of the bikeability indicators are shown in Figure 3. The respondents’ perceptions were measured on a five-point Likert scale across bikeability domains: attractiveness, comfort, directness and coherence, and safety. Figure 3 shows mean values of bicyclists’ responses towards the importance of the bikeability indicators. Five of the 15 indicators assessed were rated above 4.0, signifying strong importance from participants. These include ‘CMF01’ (4.26) under the comfort domain, ‘SFT01’ (4.14), and ‘SFT04’ (4.12) in Safety, alongside ‘ATR02’ (4.01) in Attractiveness. Two indicators, ‘CMF04’ and ‘CM05’, have mean values lower than 3. ‘CMF05’ (3.10) was rated as the least important indicator.
The data were used to find the coefficient of each indicator, which will later be used in Equation (2) to calculate the bikeability of streets in urban areas. In step 1, the PCA analysis with a Varimax rotation, a widely used method for EFA, is used to identify patterns among the items in the questionnaire. The Kaiser–Meyer–Olkin (KMO) test is used to assess the adequacy of the sample, with a minimum acceptable value of 0.70 [70]. The KMO Measure of Sampling Adequacy for the questionnaire was 0.814. The Cronbach’s Alpha coefficient test included all items and was 0.815. A Cronbach’s alpha coefficient of over 0.8 indicates good consistency in the questionnaire responses, suggesting that the questionnaire responses are reliable and consistent [71].
The PCA extracted four main components after Varimax rotation with Kaiser normalization, which collectively captured the essence of bikeability in the urban setting. The EFA suggests clustering into four dimensions (facilities, comfort, infrastructure, and traffic), as shown in Table 3.
The categorization was based on the loading patterns of the indicators on each component. Specifically:
Facilities: Indicators influencing the ease of navigation and connectivity, such as Directness and Coherence (DC01, DC02) and Attractiveness (ATR01, ATR02).
Comfort: Indicators related to the perceived ease and convenience of cycling, including CMF04, CMF05, CMF03, and CMF02.
Infrastructure: Indicators assessing the physical environment’s suitability, such as CMF01 and SFT01.
Traffic: Indicators measuring safety and interaction with motor vehicles, including SFT05, DC03, and SFT02.
This categorization ensures consistency with the original principles of bikeability while enhancing interpretability. However, some ambiguity arose due to overlapping effects between directness, coherence, and attractiveness, which were grouped under facilities. This decision was made because both sets of indicators create an efficient and seamless cycling network by minimizing detours and interruptions while making the ride more pleasant for cyclists. Therefore, they were combined to reduce redundancy and improve model coherence. The results from Table 3 are critical in developing the BI, as they determine the weight of each indicator in the model.
Table 4 shows the summary statistics of the CFA model fit performed in AMOS (See Appendix B for the structure of the CFA Model). In our CFA, we examined the fit of our proposed model with the observed data. The model demonstrated a good fit, as indicated by a chi-square statistic-to-degrees of freedom ratio (CMIN/DF) of 1.977, suggesting a good fit. The p-value associated with the test was highly significant (p < 0.001).
Similarly, other indices indicate a good model fit, including the Root Mean Square Residual (RMR) of 0.047 and Root Mean Square Error of Approximation (RMSE) of 0.051, significantly below the minimum level of 0.08 [72]. The Goodness-of-Fit Index (GFI) of 0.950, Comparative Fit Index (CFI) of 0.926, and Tucker–Lewis Index (TLI) of 0.902 are well above the acceptable level. Research suggests that the value of these indices should be over 0.90 for an acceptable model fit [73,74]. These results suggest that our model provides a reasonably good fit for the data [75].
The weights of the indicators that Table 5 shows are obtained from CFA and are used in Equation (2) as coefficients of indicators. The values of the resultant factor loadings are used as the weights of indicators. Similar to indicators, the criteria also affect the proposed BI. Therefore, each criterion can have a specific coefficient (weight) based on its association with inclusive bicycle streets or bicycle paths for biking. Table 5 shows the criteria coefficient (weight) for all four criteria calculated using the mean values. We followed a similar approach to finding criteria weights or importance [76,77]. The mean value for safety criteria was 4.66, the highest, followed by comfort, having a mean of 4.01.
In contrast, attractiveness had the lowest mean value of 3.30. The coefficient of safety was considered 1.00 as it is the most crucial criterion for cyclists among the four. The rest of the coefficients are calculated based on the highest mean value, 4.66 (safety). For instance, comfort with a mean of 4.01 is obtained by dividing it by the highest mean value, 4.66, resulting in a coefficient of 0.86 (4.01/4.66 = 0.86). The process is followed for attractiveness, directness and coherence, resulting in a coefficient of 0.70 and 0.76, respectively.

4.3. Bikeability Indicators Score

Table 6 presents the scores for each sub-indicator, calculated based on survey participant ratings, as shown in Appendix A. The Min–Max method was employed to define scores for each sub-indicator, allowing for a standardized comparison across criteria. Scores assigned to sub-indicators range from 0–1 under each criterion. The standardized scoring method ensures a consistent and objective evaluation of bikeability indicators, allowing for direct comparisons between urban cycling conditions. Each indicator can be assigned a score based on the specific type of infrastructure facility available. For example, if the bicycle lane of a path is paved with asphalt, a score of 1 should be assigned, while 0 should be if the bicycle path is cobblestone paved. Similarly, if the bicycle lane is double-direction wide, a score of 1 should be assigned; unidirectional narrow is assigned a score of 0.40, and 0 is assigned to double-direction narrow.
The variation in scores reflects differences in how survey participants rated various cycling conditions and infrastructure types. Participants provided assessments based on their experiences and perceptions of safety, comfort, attractiveness, directness, and coherence. For example, a fully separated bike path was rated higher than a shared road (with motorists) because it offers more protection.

4.4. Bikeability of Streets and Lanes in Hasselt

The developed BI framework was tested based on the criteria weightage and indicators scores and weightage. Using the developed method, we estimated BIs for the bicycle lanes and streets in Hasselt, the capital and largest city of the Limburg province in the Flemish Region of Belgium. Hasselt has excellent bicycle infrastructure facilities, including separated bicycle lanes, routes, bicycle-prioritized streets, bicycle signals at intersections, and shared bicycle lanes with pedestrians. In addition, the city also offers varied contexts, including different types of paved streets, diverse bicycle prioritization at traffic signals, and a range of bicycle facilities, making it a suitable case study for applying the methodology. Table 7 shows the calculation of BI for the inner inner-ring Hasselt bicycle path.
Figure 4 shows the bikeability map of Hasselt City. It was evident from applying the developed method that it can be utilized in different contexts. Hasselt has various streets, including bicycle lanes, bicycle prioritized streets, bicycle paths, and shared bicycle streets. Different bikeability scores and categories resulted from bicycle street or lane characteristics. It was observed that most of the inner-city streets—with most of the streets prioritizing bicycles—were rated as B. The inner ring of the newly constructed bicycle path was rated as A (Extremely bikeable), as almost all the indicators were present along the path. The Kempische Steenweg bicycle lane, graded as C, could see an improved bikeability score by prohibiting car parking where allowed without a buffer from the cycle lane and adding a buffer between the bicycle lane and the sidewalk.

5. Discussion and Conclusions

Although several studies have found that adequate and well-designed cycling facilities effectively ensure safe and comfortable cycling [4,12,14,78], integrating bicycle infrastructure design principles (safety, comfort, attractiveness, directness, and coherence) in cities can encourage more people to cycle [6,79]. However, studies rarely incorporate all five bicycle infrastructure principles into developing metrics for assessing the bikeability of lanes and streets in urban areas. Therefore, this study explores the micro level of necessary bicycle facilities and introduces a framework to evaluate urban bikeability. The bicycle facilities and infrastructure are taken as indicators in this study, which are needed to ensure an enjoyable environment for cyclists. Safety is a critical component, with the presence of bicycle paths and the absence of intersections enhancing cyclists’ safety perception [80]. Comfort is influenced by various factors, including infrastructure elements such as road width and traffic volume [81]. Attractiveness is linked to environmental features; greenery and recreational areas are associated with a more attractive cycling experience [82]. Cohesiveness refers to the continuous and connected nature of cycling infrastructure, which is important for perceived safety and the overall quality of the cycling experience [10]. The overall cycling experience can be improved by incorporating them in designing bicycle paths or streets.
Studies have proposed evaluating a bikeable environment in urban areas for cyclists on street segments, zones, and intersections [57,58,63]. However, some shortcomings prevent them from accurately evaluating bicycle streets and suggesting improvements. Some of these models are complex, and some methods require technical skills. For example, the need for technical skills in GIS-based clustering, mapping, fuzzification [66], OSM data handling [69], and advanced statistical modeling [57] makes some BI methods more complex and challenging to implement. Moreover, some methods do not cover the bicycle infrastructure design principles for selecting a wide range of cycling facility indicators at a micro level (with details), and linking them to the design process is complicated. These methods often focus on aggregated or macro-level assessments, lacking the details needed to evaluate diverse infrastructure elements such as pavement quality, lane width, or bicycle facility at intersections, which are crucial for effective micro-level planning. For instance, the BI model was developed at the city level at a 100 × 100 m scale and majorly considered safety indicators [52]. Other BI methods have considered very few bikeability indicators, limiting their practical use, for example, methods developed by Ros-McDonnell et al. (2020) [62], Winters et al. (2016) [43], and Hardinghaus et al. (2021) [54].
Thus, we present a new practical tool of BI that complements previous research by providing a practical and score-based tool that is easily understandable and replicable. Indicators are extracted from a five-bicycle infrastructure design principle acknowledged in the literature and city authorities for suggesting improvement or planning new facilities for cyclists. Our method emphasizes the importance of bicycle infrastructure design principles and micro-level bicycle facility design indicators, ensuring a more detailed and practical evaluation. More importantly, our approach integrates cyclist opinions by weighing and scoring these indicators based on their perspective. This aspect was not fully addressed in past methods.
A limitation of this study is the skew towards a younger population, with a significant proportion of students (57.4%) among the respondents. This demographic bias may affect the generalizability of the findings to older age groups or non-student populations. Additionally, while the criteria for comfort, safety, attractiveness, directness, and coherence provide a comprehensive framework, they may be influenced by additional indicators not covered in this study. Future research could explore a wider range of indicators to enhance the robustness and inclusivity of the bikeability assessment.
Because this study attempts to assess the bikeable environment in the cities for cyclists, urban and transportation planners can plan biking routes that are safe, comfortable, and more enjoyable and improve the existing routes. The proposed BI results are easily interpreted and helpful in providing practical suggestions for improvements in urban street conditions. Although this study was conducted in Hasselt, the proposed methodology is adaptable to other cities. However, for applicability to other regions, some adjustments might need to be made to capture the different socioeconomic, cultural, and infrastructural characteristics. For example, the weighing of indicators is based on cyclist opinions in this study, which may reflect a certain degree of homogeneity in perception. Future studies could refine the model further by incorporating varied cyclist demographics, cultural factors, and urban infrastructure characteristics. The preference might differ in other regions and localities. Cultural, environmental, and sociodemographic characteristics can influence users’ preferences and priorities regarding indicators.

Author Contributions

Conceptualization, T.A., A.P., G.W. and D.J.; Methodology, T.A., A.P. and D.J.; Software, T.A.; Validation, A.P. and D.J.; Formal analysis, T.A.; Investigation, T.A.; Resources, A.P., G.W. and D.J.; Data curation, A.P. and D.J.; Writing—original draft, T.A.; Writing—review and editing, A.P., G.W. and D.J.; Visualization, T.A.; Supervision, A.P., G.W. and D.J. All authors have read and agreed to the published version of the manuscript.

Funding

This research received no external funding.

Data Availability Statement

The original contributions presented in this study are included in the article. Further inquiries can be directed at the corresponding author.

Acknowledgments

We acknowledge the Higher Education Commission (HEC) Pakistan for funding Tufail Ahmed’s Ph.D. research.

Conflicts of Interest

The authors declare no conflicts of interest.

Appendix A. Participant Ratings of Sub-Indicators

Smartcities 08 00046 i001

Appendix B. Structure of the CFA Model

Smartcities 08 00046 i002

References

  1. Heinen, E.; van Wee, B.; Maat, K. Commuting by Bicycle: An Overview of the Literature. Transp. Rev. 2010, 30, 59–96. [Google Scholar] [CrossRef]
  2. Silvestri, F.; Babaei, S.H.; Coppola, P. Improving Urban Cyclability and Perceived Bikeability: A Decision Support System for the City of Milan, Italy. Sustainability 2024, 16, 8188. [Google Scholar] [CrossRef]
  3. Ferreira, J.M.; Costa, D.G. Enhancing Cycling Safety in Smart Cities: A Data-Driven Embedded Risk Alert System. Smart Cities 2024, 7, 1992–2014. [Google Scholar] [CrossRef]
  4. Asadi-Shekari, Z.; Moeinaddini, M.; Zaly Shah, M. A Bicycle Safety Index for Evaluating Urban Street Facilities. Traffic Inj. Prev. 2015, 16, 283–288. [Google Scholar] [CrossRef]
  5. Castañon, U.N.; Ribeiro, P.J.G.; Mendes, J.F.G. Evaluating Urban Bikeability: A Comprehensive Assessment of Póvoa de Varzim’s Network. Sustainability 2024, 16, 9472. [Google Scholar] [CrossRef]
  6. Ahmed, T.; Pirdavani, A.; Wets, G.; Janssens, D. Bicycle Infrastructure Design Principles in Urban Bikeability Indices: A Systematic Review. Sustainability 2024, 16, 2545. [Google Scholar] [CrossRef]
  7. Oliveira, F.; Costa, D.G.; Lima, L.; Silva, I. iBikeSafe: A Multi-Parameter System for Monitoring, Evaluation and Visualization of Cycling Paths in Smart Cities Targeted at Cycling Adverse Conditions. Smart Cities 2021, 4, 1058–1086. [Google Scholar] [CrossRef]
  8. Wang, L. Planning for Cycling in a Growing Megacity: Exploring Planners’ Perceptions and Shared Values. Cities 2020, 106, 102857. [Google Scholar] [CrossRef]
  9. Ahmed, T.; Pirdavani, A.; Janssens, D.; Wets, G. Utilizing Intelligent Portable Bicycle Lights to Assess Urban Bicycle Infrastructure Surfaces. Sustainability 2023, 15, 4495. [Google Scholar] [CrossRef]
  10. Arellana, J.; Saltarín, M.; Larrañaga, A.M.; González, V.I.; Henao, C.A. Developing an Urban Bikeability Index for Different Types of Cyclists as a Tool to Prioritise Bicycle Infrastructure Investments. Transp. Res. Part A Policy Pract. 2020, 139, 310–334. [Google Scholar] [CrossRef]
  11. Pucher, J.; Buehler, R. Making Cycling Irresistible: Lessons from the Netherlands, Denmark and Germany. Transp. Rev. 2008, 28, 495–528. [Google Scholar] [CrossRef]
  12. Zhao, C.; Carstensen, T.A.; Nielsen, T.A.S.; Olafsson, A.S. Bicycle-Friendly Infrastructure Planning in Beijing and Copenhagen—Between Adapting Design Solutions and Learning Local Planning Cultures. J. Transp. Geogr. 2018, 68, 149–159. [Google Scholar] [CrossRef]
  13. Gössling, S. Urban Transport Transitions: Copenhagen, City of Cyclists. J. Transp. Geogr. 2013, 33, 196–206. [Google Scholar] [CrossRef]
  14. Carr, T.; Dill, J. Bicycle Commuting and Facilities in Major U.S. Cities: If You Build Them, Commuters Will Use Them. Transp. Res. Rec. 2003, 1828, 116–123. [Google Scholar]
  15. Milakis, D.; Athanasopoulos, K. What about People in Cycle Network Planning? Applying Participative Multicriteria GIS Analysis in the Case of the Athens Metropolitan Cycle Network. J. Transp. Geogr. 2014, 35, 120–129. [Google Scholar] [CrossRef]
  16. Kellstedt, D.K.; Spengler, J.O.; Foster, M.; Lee, C.; Maddock, J.E. A Scoping Review of Bikeability Assessment Methods. J. Community Health 2021, 46, 211–224. [Google Scholar] [CrossRef]
  17. Muhs, C.D.; Clifton, K.J. Do Characteristics of Walkable Environments Support Bicycling? Toward a Definition of Bicycle-Supported Development. J. Transp. Land Use 2016, 9, 147–188. [Google Scholar] [CrossRef]
  18. Koh, P.P.; Wong, Y.D. Influence of Infrastructural Compatibility Factors on Walking and Cycling Route Choices. J. Environ. Psychol. 2013, 36, 202–213. [Google Scholar] [CrossRef]
  19. Hartanto, K. Developing a Bikeability Index to Enable the Assessment of Transit-Oriented Development (TOD) Nodes: Case Study in Arnhem-Nijmegen Region, Netherlands. Master’s Thesis, University of Twente, Enschede, The Netherlands, 2017. [Google Scholar]
  20. Marqués, R.; Hernández-Herrador, V.; Calvo-Salazar, M.; García-Cebrián, J.A. How Infrastructure Can Promote Cycling in Cities: Lessons from Seville. Res. Transp. Econ. 2015, 53, 31–44. [Google Scholar] [CrossRef]
  21. Zahabi, S.A.H.; Chang, A.; Miranda-Moreno, L.F.; Patterson, Z. Exploring the Link between the Neighborhood Typologies, Bicycle Infrastructure and Commuting Cycling over Time and the Potential Impact on Commuter GHG Emissions. Transp. Res. Part D Transp. Environ. 2016, 47, 89–103. [Google Scholar] [CrossRef]
  22. Landis, B.W.; Vattikuti, V.R.; Brannick, M.T. Real-Time Human Perceptions: Toward a Bicycle Level of Service. Transp. Res. Rec. 1997, 1578, 119–126. [Google Scholar] [CrossRef]
  23. Lowry, M.; Callister, D.; Gresham, M.; Moore, B. Assessment of Communitywide Bikeability with Bicycle Level of Service. Transp. Res. Rec. 2012, 2314, 41–48. [Google Scholar] [CrossRef]
  24. Porter, A.K.; Kohl, H.W.; Pérez, A.; Reininger, B.; Pettee Gabriel, K.; Salvo, D. Bikeability: Assessing the Objectively Measured Environment in Relation to Recreation and Transportation Bicycling. Environ. Behav. 2020, 52, 861–894. [Google Scholar] [CrossRef]
  25. Anciaes, P.R.; Jones, P. Estimating Preferences for Different Types of Pedestrian Crossing Facilities. Transp. Res. Part F Traffic Psychol. Behav. 2018, 52, 222–237. [Google Scholar] [CrossRef]
  26. Davis, J. Bicycle Safety Evaluation; Auburn University, City of Chattanooga, and Chattanooga-Hamilton County Regional Planning Commission: Chattanooga, TN, USA, 1987. [Google Scholar]
  27. Epperson, B. Evaluating Suitability of Roadways for Bicycle Use: Toward a Cycling Level-of-Service Standard. Transp. Res. Rec. 1994, 1438, 9–16. [Google Scholar]
  28. Davis, W.J. Bicycle Test Route Evaluation for Urban Road Conditions. In Proceedings of the Transportation Congress, San Diego, CA, USA, 22–26 October 1995; ASCE: Reston, VA, USA, 1995. Volumes 1 and 2: Civil Engineers—Key to the World’s Infrastructure. pp. 1063–1076. [Google Scholar]
  29. Landis, B.W. Bicycle Interaction Hazard Score: A Theoretical Model. Transp. Res. Rec. 1994, 1438, 3–8. [Google Scholar]
  30. Harkey, D.L.; Reinfurt, D.W.; Knuiman, M. Development of the Bicycle Compatibility Index. Transp. Res. Rec. 1998, 1636, 13–20. [Google Scholar] [CrossRef]
  31. Kazemzadeh, K.; Laureshyn, A.; Winslott Hiselius, L.; Ronchi, E. Expanding the Scope of the Bicycle Level-of-Service Concept: A Review of the Literature. Sustainability 2020, 12, 2944. [Google Scholar] [CrossRef]
  32. Nikiforiadis, A.; Basbas, S.; Mikiki, F.; Oikonomou, A.; Polymeroudi, E. Pedestrians-Cyclists Shared Spaces Level of Service: Comparison of Methodologies and Critical Discussion. Sustainability 2021, 13, 361. [Google Scholar] [CrossRef]
  33. Petritsch, T.A.; Landis, B.W.; Huang, H.F.; McLeod, P.S.; Lamb, D.; Farah, W.; Guttenplan, M. Bicycle Level of Service for Arterials. Transp. Res. Rec. 2007, 2031, 34–42. [Google Scholar] [CrossRef]
  34. Dixon, L.B. Bicycle and Pedestrian Level-of-Service Performance Measures and Standards for Congestion Management Systems. Transp. Res. Rec. 1996, 1538, 1–9. [Google Scholar] [CrossRef]
  35. Mozer, D. Calculating Multi-Mode Levels-of-Service. Int. Bicycl. Fund 1994, 1, 1–9. [Google Scholar]
  36. Asadi-Shekari, Z.; Moeinaddini, M.; Zaly Shah, M. Non-Motorised Level of Service: Addressing Challenges in Pedestrian and Bicycle Level of Service. Transp. Rev. 2013, 33, 166–194. [Google Scholar] [CrossRef]
  37. Faghih Imani, A.; Miller, E.J.; Saxe, S. Cycle Accessibility and Level of Traffic Stress: A Case Study of Toronto. J. Transp. Geogr. 2019, 80, 102496. [Google Scholar] [CrossRef]
  38. Tijana, Đ.; Tomić, N.; Tešić, D. Walkability and Bikeability for Sustainable Spatial Planning in the City of Novi Sad (Serbia). Sustainability 2023, 15, 3785. [Google Scholar] [CrossRef]
  39. Allam, Z.; Khavarian-Garmsir, A.R.; Lassaube, U.; Chabaud, D.; Moreno, C. Mapping the Implementation Practices of the 15-Minute City. Smart Cities 2024, 7, 2094–2109. [Google Scholar] [CrossRef]
  40. Eliou, N.; Galanis, A.; Proios, A. Evaluation of the Bikeability of a Greek City: Case Study “City of Volos”. WSEAS Trans. Environ. Dev. 2009, 5, 545–555. [Google Scholar]
  41. Wahlgren, L.; Schantz, P. Bikeability and Methodological Issues Using the Active Commuting Route Environment Scale (ACRES) in a Metropolitan Setting. BMC Med. Res. Methodol. 2011, 11, 6. [Google Scholar] [CrossRef]
  42. Hoedl, S.; Titze, S.; Oja, P. The Bikeability and Walkability Evaluation Table: Reliability and Application. Am. J. Prev. Med. 2010, 39, 457–459. [Google Scholar] [CrossRef]
  43. Winters, M.; Teschke, K.; Brauer, M.; Fuller, D. Bike Score®: Associations between Urban Bikeability and Cycling Behavior in 24 Cities. Int. J. Behav. Nutr. Phys. Act. 2016, 13, 18. [Google Scholar] [CrossRef]
  44. Zuo, T.; Wei, H. Bikeway Prioritization to Increase Bicycle Network Connectivity and Bicycle-Transit Connection: A Multi-Criteria Decision Analysis Approach. Transp. Res. Part A Policy Pract. 2019, 129, 52–71. [Google Scholar] [CrossRef]
  45. Fuller, D.; Winters, M. Income Inequalities in Bike Score and Bicycling to Work in Canada. J. Transp. Health 2017, 7, 264–268. [Google Scholar] [CrossRef]
  46. Li, W.; Joh, K. Exploring the Synergistic Economic Benefit of Enhancing Neighbourhood Bikeability and Public Transit Accessibility Based on Real Estate Sale Transactions. Urban Stud. 2017, 54, 3480–3499. [Google Scholar] [CrossRef]
  47. Asadi-Shekari, Z.; Moeinaddini, M.; Zaly Shah, M. A Pedestrian Level of Service Method for Evaluating and Promoting Walking Facilities on Campus Streets. Land Use Policy 2014, 38, 175–193. [Google Scholar] [CrossRef]
  48. Aghaabbasi, M.; Moeinaddini, M.; Zaly Shah, M.; Asadi-Shekari, Z. A New Assessment Model to Evaluate the Microscale Sidewalk Design Factors at the Neighbourhood Level. J. Transp. Health 2017, 5, 97–112. [Google Scholar] [CrossRef]
  49. Labdaoui, K.; Mazouz, S.; Acidi, A.; Cools, M.; Moeinaddini, M.; Teller, J. Utilizing Thermal Comfort and Walking Facilities to Propose a Comfort Walkability Index (CWI) at the Neighbourhood Level. Build. Environ. 2021, 193, 107627. [Google Scholar] [CrossRef]
  50. Asadi-Shekari, Z.; Moeinaddini, M.; Aghaabbasi, M.; Cools, M.; Zaly Shah, M. Exploring Effective Micro-Level Items for Evaluating Inclusive Walking Facilities on Urban Streets (Applied in Johor Bahru, Malaysia). Sustain. Cities Soc. 2019, 49, 101563. [Google Scholar] [CrossRef]
  51. Arellana, J.; Saltarín, M.; Larrañaga, A.M.; Alvarez, V.; Henao, C.A. Urban Walkability Considering Pedestrians’ Perceptions of the Built Environment: A 10-Year Review and a Case Study in a Medium-Sized City in Latin America. Transp. Rev. 2020, 40, 183–203. [Google Scholar] [CrossRef]
  52. Codina, O.; Maciejewska, M.; Nadal, J.; Marquet, O. Built Environment Bikeability as a Predictor of Cycling Frequency: Lessons from Barcelona. Transp. Res. Interdiscip. Perspect. 2022, 16, 100725. [Google Scholar] [CrossRef]
  53. Karolemeas, C.; Vassi, A.; Tsigdinos, S.; Bakogiannis, D.E. Measure the Ability of Cities to Be Biked via Weighted Parameters, Using GIS Tools. the Case Study of Zografou in Greece. Transp. Res. Procedia 2022, 62, 59–66. [Google Scholar] [CrossRef]
  54. Hardinghaus, M.; Nieland, S.; Lehne, M.; Weschke, J. More than Bike Lanes—A Multifactorial Index of Urban Bikeability. Sustainability 2021, 13, 11584. [Google Scholar] [CrossRef]
  55. Ito, K.; Biljecki, F. Assessing Bikeability with Street View Imagery and Computer Vision. Transp. Res. Part C Emerg. Technol. 2021, 132, 103371. [Google Scholar] [CrossRef]
  56. Schmid-Querg, J.; Keler, A.; Grigoropoulos, G. The Munich Bikeability Index: A Practical Approach for Measuring Urban Bikeability. Sustainability 2021, 13, 428. [Google Scholar] [CrossRef]
  57. Lin, J.J.; Wei, Y.H. Assessing Area-Wide Bikeability: A Grey Analytic Network Process. Transp. Res. Part A Policy Pract. 2018, 113, 381–396. [Google Scholar] [CrossRef]
  58. Gu, P.; Han, Z.; Cao, Z.; Chen, Y.; Jiang, Y. Using Open Source Data to Measure Street Walkability and Bikeability in China: A Case of Four Cities. Transp. Res. Rec. 2018, 2672, 63–75. [Google Scholar] [CrossRef]
  59. Tran, P.T.M.; Zhao, M.; Yamamoto, K.; Minet, L.; Nguyen, T.; Balasubramanian, R. Cyclists’ Personal Exposure to Traffic-Related Air Pollution and Its Influence on Bikeability. Transp. Res. Part D Transp. Environ. 2020, 88, 102563. [Google Scholar] [CrossRef]
  60. Beura, S.K.; Chellapilla, H.; Bhuyan, P.K. Urban Road Segment Level of Service Based on Bicycle Users’ Perception under Mixed Traffic Conditions. J. Mod. Transp. 2017, 25, 90–105. [Google Scholar] [CrossRef]
  61. Dai, B.; Dadashova, B. Review of Contextual Elements Affecting Bicyclist Safety. J. Transp. Health 2021, 20, 101013. [Google Scholar] [CrossRef]
  62. Ros-McDonnell, L.; de-la-Fuente-Aragon, M.V.; Ros-McDonnell, D.; Carboneras, M.C. Development of a Biking Index for Measuring Mediterranean Cities Mobility. Int. J. Prod. Manag. Eng. 2020, 8, 21–29. [Google Scholar] [CrossRef]
  63. Krenn, P.J.; Oja, P.; Titze, S. Development of a Bikeability Index to Assess the Bicycle-Friendliness of Urban Environments. Open J. Civ. Eng. 2015, 05, 451–459. [Google Scholar] [CrossRef]
  64. Kwiatkowski, M.A.; Karbowiński, Ł. Why the Riverside Is an Attractive Urban Corridor for Bicycle Transport and Recreation. Cities 2023, 143, 104611. [Google Scholar] [CrossRef]
  65. Castañon, U.N.; Ribeiro, P.J.G. Bikeability and Emerging Phenomena in Cycling: Exploratory Analysis and Review. Sustainability 2021, 13, 2394. [Google Scholar] [CrossRef]
  66. Saadi, I.; Aganze, R.; Moeinaddini, M.; Asadi-Shekari, Z.; Cools, M. A Participatory Assessment of Perceived Neighbourhood Walkability in a Small Urban Environment. Sustainability 2022, 14, 206. [Google Scholar] [CrossRef]
  67. South, L.; Saffo, D.; Vitek, O.; Dunne, C.; Borkin, M.A. Effective Use of Likert Scales in Visualization Evaluations: A Systematic Review. Comput. Graph. Forum 2022, 41, 43–55. [Google Scholar] [CrossRef]
  68. Labdaoui, K.; Mazouz, S.; Moeinaddini, M.; Cools, M.; Teller, J. The Street Walkability and Thermal Comfort Index (SWTCI): A New Assessment Tool Combining Street Design Measurements and Thermal Comfort. Sci. Total Environ. 2021, 795, 148663. [Google Scholar] [CrossRef]
  69. Wysling, L.; Purves, R.S. Where to Improve Cycling Infrastructure? Assessing Bicycle Suitability and Bikeability with Open Data in the City of Paris. Transp. Res. Interdiscip. Perspect. 2022, 15, 100648. [Google Scholar] [CrossRef]
  70. Hair, J.F., Jr.; Hult, G.T.M.; Ringle, C.M.; Sarstedt, M.; Danks, N.P.; Ray, S. Partial Least Squares Structural Equation Modeling (PLS-SEM) Using R: A Workbook; Springer Nature: Cham, Switzerland, 2021; ISBN 978-3-030-80519-7. [Google Scholar]
  71. de Vet, H.C.W.; Mokkink, L.B.; Mosmuller, D.G.; Terwee, C.B. Spearman–Brown Prophecy Formula and Cronbach’s Alpha: Different Faces of Reliability and Opportunities for New Applications. J. Clin. Epidemiol. 2017, 85, 45–49. [Google Scholar] [CrossRef]
  72. Ashraf Javid, M.; Ali, N.; Abdullah, M.; Campisi, T.; Shah, S.A.H. Travelers’ Adoption Behavior towards Electric Vehicles in Lahore, Pakistan: An Extension of Norm Activation Model (NAM) Theory. J. Adv. Transp. 2021, 2021, 7189411. [Google Scholar] [CrossRef]
  73. Browne, M.W.; Cudeck, R. Alternative Ways of Assessing Model Fit. Sociol. Methods Res. 1992, 21, 230–258. [Google Scholar] [CrossRef]
  74. Bentler, P.M. Some Contributions to Efficient Statistics in Structural Models: Specification and Estimation of Moment Structures. Psychometrika 1983, 48, 493–517. [Google Scholar] [CrossRef]
  75. Ong, A.K.S.; Prasetyo, Y.T.; Lagura, F.C.; Ramos, R.N.; Sigua, K.M.; Villas, J.A.; Nadlifatin, R.; Young, M.N.; Diaz, J.F.T. Determining Tricycle Service Quality and Satisfaction in the Philippine Urban Areas: A SERVQUAL Approach. Cities 2023, 137, 104339. [Google Scholar] [CrossRef]
  76. Chellapilla, H.; Beura, S.K.; Bhuyan, P.K. Modeling Bicycle Activity on Multi-Lane Urban Road Segments in Indian Context and Prioritizing Bicycle Lane to Enhance the Operational Efficiency. In Proceedings of the 12th Transportation Planning and Implementation Methodologies for Developing Countries (TPMDC), Bombay, India, 19–21 December 2016; pp. 1–11. [Google Scholar]
  77. Nawaz, I.; Almoshaogeh, M.; Ahmed, T.; Moeinaddini, M.; Jamal, A.; Alharbi, F. An Empirical Framework to Quantify the Individual Traffic Congestion Cost for Private Motorized Vehicle Users. Sage Open 2024, 14, 21582440241249801. [Google Scholar] [CrossRef]
  78. Krizek, K.J.; Barnes, G.; Thompson, K. Analyzing the Effect of Bicycle Facilities on Commute Mode Share over Time. J. Urban Plan. Dev. 2009, 135, 66–73. [Google Scholar] [CrossRef]
  79. Hull, A.; O’Holleran, C. Bicycle Infrastructure: Can Good Design Encourage Cycling? Urban Plan. Transp. Res. 2014, 2, 369–406. [Google Scholar] [CrossRef]
  80. Bialkova, S.; Ettema, D.; Dijst, M. How Do Design Aspects Influence the Attractiveness of Cycling Streetscapes: Results of Virtual Reality Experiments in the Netherlands. Transp. Res. Part A Policy Pract. 2022, 162, 315–331. [Google Scholar] [CrossRef]
  81. Hardinghaus, M.; Papantoniou, P. Evaluating Cyclists’ Route Preferences with Respect to Infrastructure. Sustainability 2020, 12, 3375. [Google Scholar] [CrossRef]
  82. Černá, A.; Černý, J.; Malucelli, F.; Nonato, M.; Polena, L.; Giovannini, A. Designing Optimal Routes for Cycle-Tourists. Transp. Res. Procedia 2014, 3, 856–865. [Google Scholar] [CrossRef]
Figure 1. The proposed approach for developing the new BI.
Smartcities 08 00046 g001
Figure 2. Sociodemographic characteristics and bicycle use.
Smartcities 08 00046 g002
Figure 3. Mean values of the bikeability indicators based on a questionnaire.
Smartcities 08 00046 g003
Figure 4. Bikeability map of Hasselt.
Smartcities 08 00046 g004
Table 1. Indicators in bikeability studies.
CategoryIndicatorsNotationSource
ComfortPresence of bicycle infrastructureCMF01[24,52,53,54,55,56]
Pavement typeCMF02[10,23,55]
Bike lane widthCMF03[10,23,55,57]
Presence of sidewalkCMF04[42,55,58]
GradeCMF05[10,53,55,59]
SafetyPresence of bicycle infrastructureSFT01[6,10]
Motorized traffic speedSFT02[10,23,60,61]
Traffic control devicesSFT03[51,55,56]
Street lighteningSFT04[54,55,62]
Car parking along the cycle pathSFT05[52,62]
AttractivenessTrees/green area and landscapingATR01[51,54,57,59,61,63,64]
Bicycle parkingATR02[6,56,62,65]
Directness and Coherence Presence of cycle facilities at a traffic signalDC01[54]
Road signageDC02[24,55,62]
InterruptionsDC03[51]
Table 2. BI rating, score, and description.
BI % RatingScoreDescription Improvements Needed
A81–100Extremely Bikeable Very few improvements are needed
B61–80BikeableFew improvements are needed
C41–60Fairly BikeableSome improvements are needed
D21–40less BikeableMajor improvements are needed
E0–20Not BikeableExtensive improvements are needed
Table 3. Rotated factor matrix using PCA.
Rotated Component Matrix
Component
FacilitiesComfortInfrastructureTraffic
DC010.669
ATR020.634
SFT040.628
SFT030.622
DC020.619
ATR010.490
CMF04 0.742
CMF05 0.648
CMF03 0.609
CMF02 0.603
CMF01 0.787
SFT01 0.705
SFT05 0.753
DC03 0.687
SFT02 0.534
Table 4. Model fit summary of CFA.
CMINDFpCMIN/DFRMRGFIAGFINFITLICFIRMSEA
CFA model194.259790.0001.9770.0470.950.9230.8640.9020.9260.051
CMIN = Chi-square, DF = degree of freedom, p = p-value for chi-square test, CMIN/DF = Normed chi-square, AGFI = Adjusted Goodness-of-Fit Index.
Table 5. Criteria weights and indicators weights and scores.
CriteriaCriteria WeightsIndicatorsWeights of Indicators
Comfort0.86CMF010.595
CMF020.646
CMF030.653
CMF040.598
CMF050.302
Safety1SFT010.753
SFT020.640
SFT030.561
SFT040.471
SFT050.423
Attractiveness0.70ATR010.477
ATR020.486
Directness and Coherence0.76DC010.658
DC020.555
DC030.334
Table 6. Scores of bikeability sub-indicators.
CriteriaIndicatorsSub-IndicatorsScores
ComfortCMF01Solitary bike path1.00
Physically separated (by height or space) bicycle lane0.66
Bicycle lane0.41
Bicycle prioritized streets0.63
Suggested bicycle paths0.14
Bicycle paths shared with motorized traffic0.00
CMF02Asphalt paved1.00
Concrete paved0.79
Paving slabs0.42
Cobblestones paved0.00
CMF03Unidirectional wide (≥2 meters)1.00
Unidirectional narrow (<2 meters)0.40
Double direction wide (≥3 meters)0.93
Double direction narrow (<3 meters)0.00
Shared0.30
CMF04Buffered from cycle lane1.00
Adjacent to cycle lane0.48
Shared with cyclist0.00
CMF05Low (1–3%)1.00
Medium (3–6%)0.57
High (>6%)0.00
SafetySFT01Solitary bike Path1.00
Physically separated (by height or space) bicycle lane0.80
Bicycle lane0.44
Bicycle prioritized streets0.60
Suggested bicycle paths0.21
Bicycle paths shared with motorized traffic0.00
SFT02Shared with motorized traffic0.91
Adjacent cycle paths next to a road with a speed limit of 30 km/h1.00
Adjacent cycle paths next to a road with a speed limit of 50 km/h0.67
Adjacent cycle paths next to a road with a speed limit of 70 km/h0.00
SFT03Availability of traffic signals at intersections1.00
Non-availability of traffic signals0.00
SFT04Good street Lighting (not exceeding 60 m apart from one another) 1.00
Limited street lighting (the distances between the light poles are longer)0.38
No street lighting0.00
SFT05No car parking1.00
Car parking with a buffer area0.65
Car parking without a buffer area0.00
AttractivenessATR01Bicycle route/lane along trees and landscaping or water area1.00
Bicycle route/lane without trees and landscaping or water area0.00
ATR02Parking facilities at key destinations (e.g., shops, stations, etc.)1.00
No parking facilities at key destinations (e.g., shops, stations, etc.)0.00
Directness and CoherenceDC01Presence of bicycle facilities at intersections1.00
Partial presence of bicycle facilities at intersections0.88
Non-presence of bicycle facilities at intersections0.00
DC02Well signposted 1.00
Partial signposted/signage missing at key location0.47
No signage available0.00
DC031 or no interruption1.00
2 or more interruptions0.00
Table 7. Example of the BI calculation.
CriteriaCriteria Weight
(1)
Indicators
(2)
Indicators Weight
(3)
Score of Indicators (4)Indicators Weighed Score (5)
= (3) × (4)
BIMS (6)
= (3) × 1
BIW (7) = (1) × ∑(5)BIMP (8) = (1) × ∑(6)BI% =
∑(7)/∑(8) × 100
Comfort0.86CMF010.5951.000.5950.5951.8492.40386.26
CMF020.6461.000.6460.646
CMF030.6530.930.6070.653
CMF040.5980.000.0000.598
CMF050.3021.000.3020.302
Safety1SFT010.7531.000.7530.7532.8482.848
SFT020.6401.000.6400.640
SFT030.5611.000.5610.561
SFT040.4711.000.4710.471
SFT050.4231.000.4230.423
Attractiveness0.7ATR010.4771.000.4770.4770.6740.674
ATR020.4861.000.4860.486
Directness and Coherence0.76DC010.6581.000.6580.6580.7541.176
DC020.5550.000.0000.555
DC030.3341.000.3340.334
Disclaimer/Publisher’s Note: The statements, opinions and data contained in all publications are solely those of the individual author(s) and contributor(s) and not of MDPI and/or the editor(s). MDPI and/or the editor(s) disclaim responsibility for any injury to people or property resulting from any ideas, methods, instructions or products referred to in the content.

