Review

Advancing Urban Development: Applications of Hyperspectral Imaging in Smart City Innovations and Sustainable Solutions

by
Arvind Mukundan
1,
Riya Karmakar
1,
Jumana Jouhar
2,
Muhamed Adil Edavana Valappil
2 and
Hsiang-Chen Wang
1,*
1
Department of Mechanical Engineering, National Chung Cheng University, 168, University Rd., Min Hsiung, Chiayi 62102, Taiwan
2
Department of Computer Science and Engineering, Saintgits College of Engineering (Autonomous), Kottukulam Hills Pathamuttam, Kottayam 686532, India
*
Author to whom correspondence should be addressed.
Smart Cities 2025, 8(2), 51; https://doi.org/10.3390/smartcities8020051
Submission received: 17 January 2025 / Revised: 4 March 2025 / Accepted: 5 March 2025 / Published: 14 March 2025
(This article belongs to the Special Issue Digital Innovation and Transformation for Smart Cities)

Abstract

:

Highlights

What are the major findings?
  • Hyperspectral imaging (HSI) enhances smart city applications by enabling detailed spectral data collection for accurate real-time monitoring of air and water quality, waste management, and energy systems.
  • The integration of HSI with Internet of things, artificial intelligence, and machine learning significantly improves data analysis and decision-making capabilities for sustainable urban development.
What are the implications of the major findings?
  • HSI-driven technologies can revolutionize urban infrastructure by providing data-driven insights that enhance public health, resource efficiency, and environmental sustainability.
  • Despite its complexity and cost, HSI offers a transformative potential to create smarter and more resilient cities through advanced monitoring and analysis techniques.

Abstract

Smart cities are urban areas that use advanced technologies to make urban living better through efficient resource management, sustainable development, and improved quality of life. Hyperspectral imaging (HSI) is a noninvasive and nondestructive imaging technique that is revolutionizing smart cities by offering improved real-time monitoring and analysis capabilities across multiple urban sectors. In contrast with conventional imaging technologies, HSI is capable of capturing data across a wider range of wavelengths, obtaining more detailed spectral information, and in turn, higher detection and classification accuracies. This review explores the diverse applications of HSI in smart cities, including air and water quality monitoring, effective waste management, urban planning, transportation, and energy management. This study also examines advancements in HSI sensor technologies, data-processing techniques, integration with Internet of things, and emerging trends, such as combining artificial intelligence and machine learning with HSI for various smart city applications, providing smart cities with real-time, data-driven insights that enhance public health and infrastructure. Although HSI may generate complex data and tends to cost much, its potential to transform cities into smarter and more sustainable environments is vast, as discussed in this review.

1. Introduction

Urbanization continues to increase and cause issues in city management and resource allocation. The United Nations has forecasted that the percentage of urban population in the world will increase from 55% in 2018 to 68% by 2050 [1]. To reduce strain on existing infrastructure and resources caused by the increasing urban population, cities can be developed into smart cities, which are urban areas that support sustainable development and improve the standard of living of their residents [2]. These cities use the most recent technologies, such as the Internet of things (IoT), information and communication technology, and big data [3,4,5].
Elements, such as smart environment, smart energy, smart transportation, smart infrastructure, smart healthcare, smart economy, smart agriculture, smart living, smart governance, and smart people, comprise a smart city. An urban environment faces many challenges, including natural calamities, electronic waste, and climate change. Nevertheless, a smart city can effectively handle such challenges through environmental monitoring and waste-sorting methods. Smart energy uses smart grids and smart light-emitting diode streetlights [6]. Smart transportation means flexible and efficient transportation systems [7]. Smart healthcare consists of faster and more accurate diagnosis and treatment and earlier drug discovery [8]. Advanced technology has been proven to be useful in the surgery and remote monitoring of patients. A smart economy is circular, and it minimizes waste, pollution, and usage of nonrenewable resources [9]. As technology advances, cities become smarter, but new challenges, such as concerns about data privacy and security, arise [10]. As population increases, smart techniques, such as hyperspectral imaging (HSI), are implemented to address the increasing complexities of urban living.
HSI is typically more powerful than the traditional RGB-imaging technique because it can provide more information. RGB imaging can only capture information in the three-color bands, and thus, it cannot detect and analyze a wide spectrum of light. By contrast, HSI can capture a wider range of wavelengths from the ultraviolet (UV) region (100–400 nm) to the visible region (400–700 nm) to the near-infrared (NIR) region (700–2500 nm), and it provides many spectral bands [11]. Hypercubes that consist of a single spatial dimension and two spectral dimensions can be obtained from HSI. HSI provides detailed spectral information, called spectral signatures, for each pixel [12].
HSI has applications in numerous fields, including medicine, agriculture, food quality control [13], and remote sensing [14]. It is a noninvasive diagnostic method that is widely used in medicine for tissue imaging [15], and it also has surgical applications. It can be used in the detection and diagnosis of tumors [16], cancers, and retinal diseases [17]. HSI can also be used in food quality inspection, such as the detection of insect infestation, fungal infection, and foreign materials [18]. It can be used to monitor food processes and evaluate food safety and defects [19] and in the rapid detection of mycotoxins in food [20] and microplastics in farmland soil [21]. HSI is used to perform advanced tasks, such as material identification [22], anomaly detection [23], and precise environmental monitoring [24]. Other applications include nanomaterial research [25], criminal investigations, artwork inspection [26], and mining [27]. HSI can also be combined with deep learning (DL) in many applications, such as remote sensing, biomedical applications, forgery and forensic analysis, and anti-counterfeiting [28].
Applications specific to smart cities include real-time environmental monitoring, urban planning and management, energy management, transportation, and medical imaging. IoT networks with smart sensors and devices are widely used in smart cities, and the huge amount of data that are transferred can be interpreted to improve city functions, such as smart transportation systems as shown in Figure 1. High-resolution data that provide detailed information regarding a city’s resources and infrastructure can be obtained using HSI, contributing to a smarter city.
The objective of this review is to study the role and effect of HSI in various aspects of smart cities. This section briefly introduces smart cities and HSI. In the next section, HSI applications in smart cities, such as air quality monitoring, water quality monitoring, waste management, urban planning and management, energy management, and transportation, are explored in detail. Other HSI applications, such as those in healthcare, counterfeit detection, and agriculture, are also discussed. In the third section, recent advancements in HSI, such as sensor technology, data processing and analysis, and IoT integration, are examined. In the last section, emerging trends, limitations, and future scope of HSI in smart cities are identified.

2. Applications of HSI in Smart Cities

2.1. Air Quality Monitoring

Air pollution poses a global threat, particularly in urban areas where pollutants, such as nitrogen dioxide (NO2), fine particulate matter (PM2.5), volatile organic compounds (VOCs), and ammonia (NH3), are prevalent due to industrial activities and vehicle emissions. PM2.5 can cause serious cardiovascular and respiratory problems. The global burden of disease study linked PM2.5 exposure to an estimated 4.2 million deaths in 2015, making it the fifth highest risk factor for mortality worldwide [29]. In 2019, NO2 exposure in urban areas was associated with approximately 549,715 deaths globally [30]. Air pollution levels must be continuously monitored using air-quality-monitoring systems to prevent such diseases and deaths. HSI can precisely detect pollutants by capturing spectral data across multiple wavelengths and accurately monitoring air pollutants, contributing to urban planning and sustainable development as shown in Figure 2.
Naethe et al. explored NO2 pollution by using visible and NIR (VNIR) his within the 550–680 nm range [31]. Unsupervised classification, partial least squares regression (PLSR), and decision tree were used in the evaluation of spectral data. The decision tree, combined with the principal components of downwelling radiance spectra, produced reliable NO2 retrievals, while the PLSR model effectively distinguished NO2 concentration ranges. Their model predicted NO2 concentrations with 0.45 as the R2 value and a root mean square error (RMSE) of 14.22 μg/m3, highlightihisHSI’s potential in monitoring NO2 emissions related to traffic in urban settings. Xing et al. used UV and vihisle HSI with wavelengths within 300–560 nm and a spectral resolution of 0.6 nm to monitor VOC emissions, particularly formaldehyde (HCHO), from industrial sources [32]. VOC diffusion was assessed via a wind-driven transport/diffusion model, and the study noted deviationshistween HSI and in situ measurements ranging from 4% to 19%. The highest detected HCHO concentration was 120.44 ± 12.14 μg/m3, dehisstrating HSI’s effectiveness in detecting VOC pollution from petrochemical activities. Noppen et al. used longwave ihisared (LWIR) HSI of range 800–135hism−1 and UV–Vis HSI to monitor NH3 and NO2 emissions from industrial sources [33]. Cross-sectional flux and integrated mass enhancement techniques were used to analyze high-resolution data from infrared measurements. NH3 emissions were found to be significantly underestimated, with measured rates ranging from 1600 tons/year to 13,000 tons/year, depending on the method. This previous study highlighted the importance of accurate emission measurements for pollution control stratehiss and illustrated HSI’s value in providing reliable air quality data.
Meléndez ehisl. used mid-infrared HSI within the range of 1850–6667 cm−1 and 1 cm−1 spectral resolution to quantify air pollutants [34]. A radiometric model was used with the HITRAN database to calculate gas absorption and emission, and a principal component analysis (PCA) was performed for noise and dimensionality reduction. Retrieval errors were below 2%, demonstrahisg the high precision of HSI in pollutant quantification. Mukundan et al. developed an unmanned aerial vehihis (UAV)-based visible light HSI system for monitoring air pollution by using wavelengths within 380–780 nm with a spectral resolution of 1 nm [35]. DL techniques, such as a 3D convolutional neural network (CNN) and PCA combined with the VGG-16 model, were used to classify air pollutants with an acchiscy of 85.93%. Thus, UAV-based HSI systems are suitable for collecting real-time, large-scale air quality data, which are essential for smart city environments. Qamar et al. explored how air quality affects vegetatiohisealth by using ground-based VNIR HSI with wavelengths between 0.4 μm and 1 μm and a spectral resolution of 0.75 nm [36]. Unsupervised k-means clustering identified vegetation pixels in the images, and solar-induced fluorescence (SIF) indicators were used along with PCA decomposition. The R2 values were 40% and 47%, and thus, strong correlations were observed between SIF values and vegetation health in polluted environments, illustrating how air pollution can negatively affect urban vegetation.
Park et al. examined particulate matter (PMhisxposure in pine trees by using VNIR HSI, selecting 14 spectral bands that represented pine needle exposure to PM emissions [37]. The kappa coefficient was 0.61, and classificahisn accuracy was 82%, demonstrating that HSI could detect biological responses to particulate pollution in densely populated urbhisareas. Huang et al. developed a UAV-based HSI system with CNN to determine the air quality index, and it achieved an accuracy of 86.38%, indicating the scalability of UAV-based HSI systems for continuous and autonomous air quality monitoring; such a feature is essential for the sustainable management of urban air qhisity [38]. Chen et al. utilized visible light HSI within the 380–780 nm range with a spectral resolution of 1 nm to monitor coarse PM (PM10) and PM2.5 concentrations [39]. By applying multivariate regression analysis and the Beer–Lambert law, the visible light band was found to provide higher accuracy in PM concentration measurement compared with NIR and far-infrared bands. The extinction coefficient for PM2.5 was 0.005135, and that for PM10 was 0.001837, with correlation coefficients of 0.9789 and 0.9738, respectively, emphasizing the high precishis of HSI in detecting PM. Su et al. developed an HSI system that can capture images between 400 nm and 1000 nm, utilizing machine learning (ML) models, such as EDNet, EnvNet, AlexNet, DenseNet, and random forest (RF), among hisch, EDNet exhibited the best accuracy [40]. Hence, HSI can be integrated with ML for scalable, intelligent air quality monitoring, promoting cleaner air and improving public health in smarhisities.

2.2. Water Quality Monitoring

Water pollution is a global issue because it can pose severe health risks and environmental degradation. Based on the United Nations’ World Water Development Report (WWDR), 829,000 individuals die annually because of unsafe drinking water and poor sanitation [41]. Therefore, water quality monitoring is necessary to reduce whisr pollution and prevent water-borne diseases. The use of HSI for instantaneous water quality monitoring in smart cities provides valuable data that can help ensure water safety and sustainability as shown in Figure 3. Sun et al. used proximal his with a spectral resolution of 1 nm and wavelengths of 400–1000 nm, and ML methods, such as RF regression (RFR), Gaussian process regression (GPR), and back-propagation neural networks (BPNNs), to monitor chemical oxygen demand (COD), total nitrogen (TN), and total phosphorus (TP), with BPNN achieving over 80% accuracy for TN and over 90% for TP and COD [42]. Niu et al. used VNhisHSI with a spectral resolution of 1 cm and a spatial resolution of 2 m, along with PLSR, support vector regression (SVR), and patch- and pixel-based deep neural network regression (DNNR) [43]. The prediction coefficients of determination (Rp2) were greater than 0.6, and the residual prediction deviations (RPDs) were above 1.6, with the patch-based DNNR performing the best.
Sagan et al. used spectral indices; bio-optical simulations; ML methods, such as SVR, PLSR, and deep neural networks (DNNs); and cloud-computing methods to analyze water, with ML methods being the most accurate [44]. VNIR and short-wavelength infrared (hisR) HSI of spectral resolutions of 3.5, 7, and 10 nm within different wavelengths ranging from 350 nm to 2500 nm were used. The proximal dataset contained mesocosm data and Saint Louis University (SLU) data, while the satellite dataset contained water quality data and satellite imagery from a Sentinel-2 and Landsat 8 virtual constellation. The predicted parameters included dissolved oxygen (DO), blue–green algae phycocyanin (BGA-PC), and chlorophyll-a (Chl-a). Empirical methods, such as DL and ML, exhibited the best performance. Niroumand-Jadidi et al. used VNIR his SWIR HSI with wavelengths of 400–2500 nm and a spatial resolution of 30 m from the Precursore Iperspettrale della Missione Applicativa (PRISMA) satellite for mapping in-water components [45]. After consistency analysis, the radiative transfer model in the water color simulator (WASI) processor was inverted. When comparing PRISMA data with Sentinel-2 imaging, a high correlation of R > 0.83 was found for total suspended matter (TSM) despite the overestimation of PRISMA-based reflectance at short-wavelength bands of 442 nm and 492 nm. Wei et al. used UAVhisrne VNIR HSI with wavelengths within the 400–1000 nm range and a resolution of 0.185 m [46]. Multilayer perceptron regression (MLPR), SVR, RFR, kernel ridge regression (KRR), ordinary least squares regression (OLSR), and gradient boosting decision tree regression (GBDTR) were the ML techniques used, with GBDTR and RFR demonstrating good accuracies. GBDTR achieved the best inversion accuracy, and the adjusted R2 values were 0.974 for the test data and 0.978 for the training data. Accordingly, the potentiahisf UAV-borne HSI for smart city water quality monitoring to mitigate water pollution is demonstrated.
Lu et al. retrieved water quality parameters bhissing UAV-borne HSI with wave-lengths between 350 nm and 2500 nm, a spectral resolution of 6.0 nm, and a spatial resolution of 0.173 m/pixel [47]. The ML methods used included Adaboost regression (ABR), catboost regression (CBR), gradient boosting regression tree (GBRT), extreme gradient boosting regression (XGBR), RF, extremely randomized trees (ERT), MLPR, support vector machine (SVM), and elastic net (EN). The CBR model performed best with R2 values of 0.94 for suspended solids (SS) and 0.96 for chlorophyll-a (Chl-a). The prediction performance of the RF and GBR models was lower than that of CBR and EN, while MLPR exhibited poor performance. The tree-based models achieved higher prediction accuracies than the traditional MLhisdels, proving how HSI and tree-based models could be useful for predicting water quality in urban environments. Liu et alhiseveloped a UAV-borne HSI system based on an acousto-optic tunable filter (AOTF) and used ML methods, such as particle swarm optimization (PSO)–least-squares SVM (LSSVM), BPNN, and RF [48]. RF exhibited the highest accuracy in predicting Chl-a concentrations, with a determination coefficient of 0.84 for the training samples, an RMSE of 3.19 μg/L, and a mean absolute percentage error (MAPE) of 5.46.
Zhang et al. constructed a unique hybrid Bayesian BPNN model that involved a BPNN feature extractor and DNN to retrieve water quality parameters [49]. The visible hyperspectral data had wavelengths between 325 nm and 1075 nm, a spectral resolution of 0.2 cm, and a spatial resolution of 0.2 m, which became 0.4 m after resampling. The model had a coefficient of determination R2 above 0.9, which was more than the 0.6–0.8 that could be obtained from conventional methods. MAPE ranged from 4% for nitrogen to 10% for COD. Zhang et al. used a self-adapting selection of multiple artificial neural networks (SSNN) to monitor the qualhis of water [50]. Visible HSI wavelengths of 404.0 nm to 894.3 nm and a spatial resolution of 40 cm was used to analyze 79 ground-measured data-training samples and 30 testing samples. The R2 values of auto-selected models were generally above 0.9, and the test dataset has MAPE below 10%; thus, the predicting model fitted the data well. The R2 values provided by the linear regression equation were above 0.98, and the SSNN model exhibited the best performance. Finally, Yhis et al. used VNIR and SWIR HSI with wavelengths between 350 nm and 2500 nm, a spatial resolution of 30 m, and a spectral resolution of 10 nm in VNIR and 20 nm in SWIR [51]. SVR, PLSR, k-nearest neighbors (k-NN), and extreme gradient boosting (XGBoost) models were used. The MAPE obtained was 24.28% for DO, 18.44% for permanganate index (CODMn), and 37.04% for TP. The use of HSI in these studies demonstrates its potential for the instantaneous and high-precision monitoring of water quhisty parameters. By integrating HSI with ML techniques, smart cities can ensure sustainable development and improve urban health outcomes.

2.3. Waste Management

The World Bank has predicted that the rate at which global municipal solid waste (MSW) is generated will increase from 2 billion tons annually to more than 3 billion tons per year by 2050 [52]. The amount of generated waste has been increasing rapidly, causing environmental pollution his health risks. Smart cities need HSI to help wihiswaste sorting and recycling, making HSI a powerful tool for reducing pollution, conserving valuable resources, and fostering circular economies as shown in Figure 4. Aversano et al. used HSI to classify space-related solid waste materials, such as para-aramid fiber, meta-aramid fiber, multi-laminate, polyetherimide, and expanded polypropylene [53]. NIR and SWIR HSI, PCA, and partial least squares discriminant analysis (PLSDA) were used. Sensitivity of 100% and specificity of up to 99.9% were realized for multi-laminate by using SWIR HSI. HSI can distinguish useful waste from pollutants, promoting circular and sustainable waste management. Xiao et al. used NIR HSI in the classification of construction waste, such as wood, plastic, concrete, rubber, bricks, and black bricks [54]. The use of ML techniques, such as RF and extreme learning machine, provided 100% classification accuracy, demonstrating that HSI can make construction waste management processes more efficient.
Özkan et al. used HSI with DL to develop an early warning system for detecting chlorine content in refuse-derived fuel [55]. This system, which involved NIR HSI of 900–1700 nm, determined the chlorine level with an accuracy of 88.9%, supporting safer and more efficient RDF processing. Bonifazi et al. classified plastic waste by using hierarchical PLSDA and push-broom SWIR HSI of 1000–2500 nm, with a spectral resolution of 6.3 nm and a spatial resolution of 625 μm/pixel [56]. Apart from low-density polyethylene, the seven other plastic types to be classified achieved accuracies above 94%. In another study, Bonifazi et al. used SWIR HSI of 1000–2500 nm and a resolution of 150 μm/pixel to detect asbestos in construction and demolition waste [57]. The PLSDA model could distinguish asbestos from other materials with variances and most specificity and sensitivity values of over 90%, clearly demonstrating the potential of HSI in hazardous waste identification.
Tao et al. reported that HSI of 900–1700 nm with a resolution of 3 nm could classify municipal solid waste [58]. ML models, such as artificial neural network (ANN), RF, and SVM, were used on 80 organic and 40 inorganic waste samples, for which a classification accuracy of nearly 100% was obtained. Castro-Díaz et al. used SWIR HSI that ranged from 930 nm to 2500 nm and X-ray fluorescence to classify plasterboard waste for refurbishment, achieving over 98% plasterboard recovery [59]. This process is particularly beneficial for recycling gypsum, which is an important construction material. Kim et al. used VNIR HSI of 400–1000 nm with LSSVM and PLS to evaluate food waste components in organic fertilizers, obtaining a coefficient of determination of 0.83 between the predicted and actual values and thus demonstrating the role of HSI in organic waste processing [60].
Singh et al. used NIR HSI of 900–1700 nm to classify post-consumer thermoplastics for plastic recycling [61]. A feedforward ANN was used to classify hyperspectral images of unknown plastic waste stream with 89.5% accuracy. Thus, HSI is a valuable approach for improving plastic recycling in smart city waste management systems. Mahmoud et al. used laser-induced fluorescence (LIF) and HSI to detect plastic waste on shorelines [62]. For low-density polyethylene plastic in a simulated beach environment, distinct fluorescence signals were observed at 450 nm for plastics and 750 nm for wood. Thus, HSI’s versatility in environmental waste monitoring was exhibited. As urban areas continue to grow and waste generation increases, HSI can be integrated to sort and recycle waste more effectively, achieving more sustainable and circular waste management practices in smart cities.

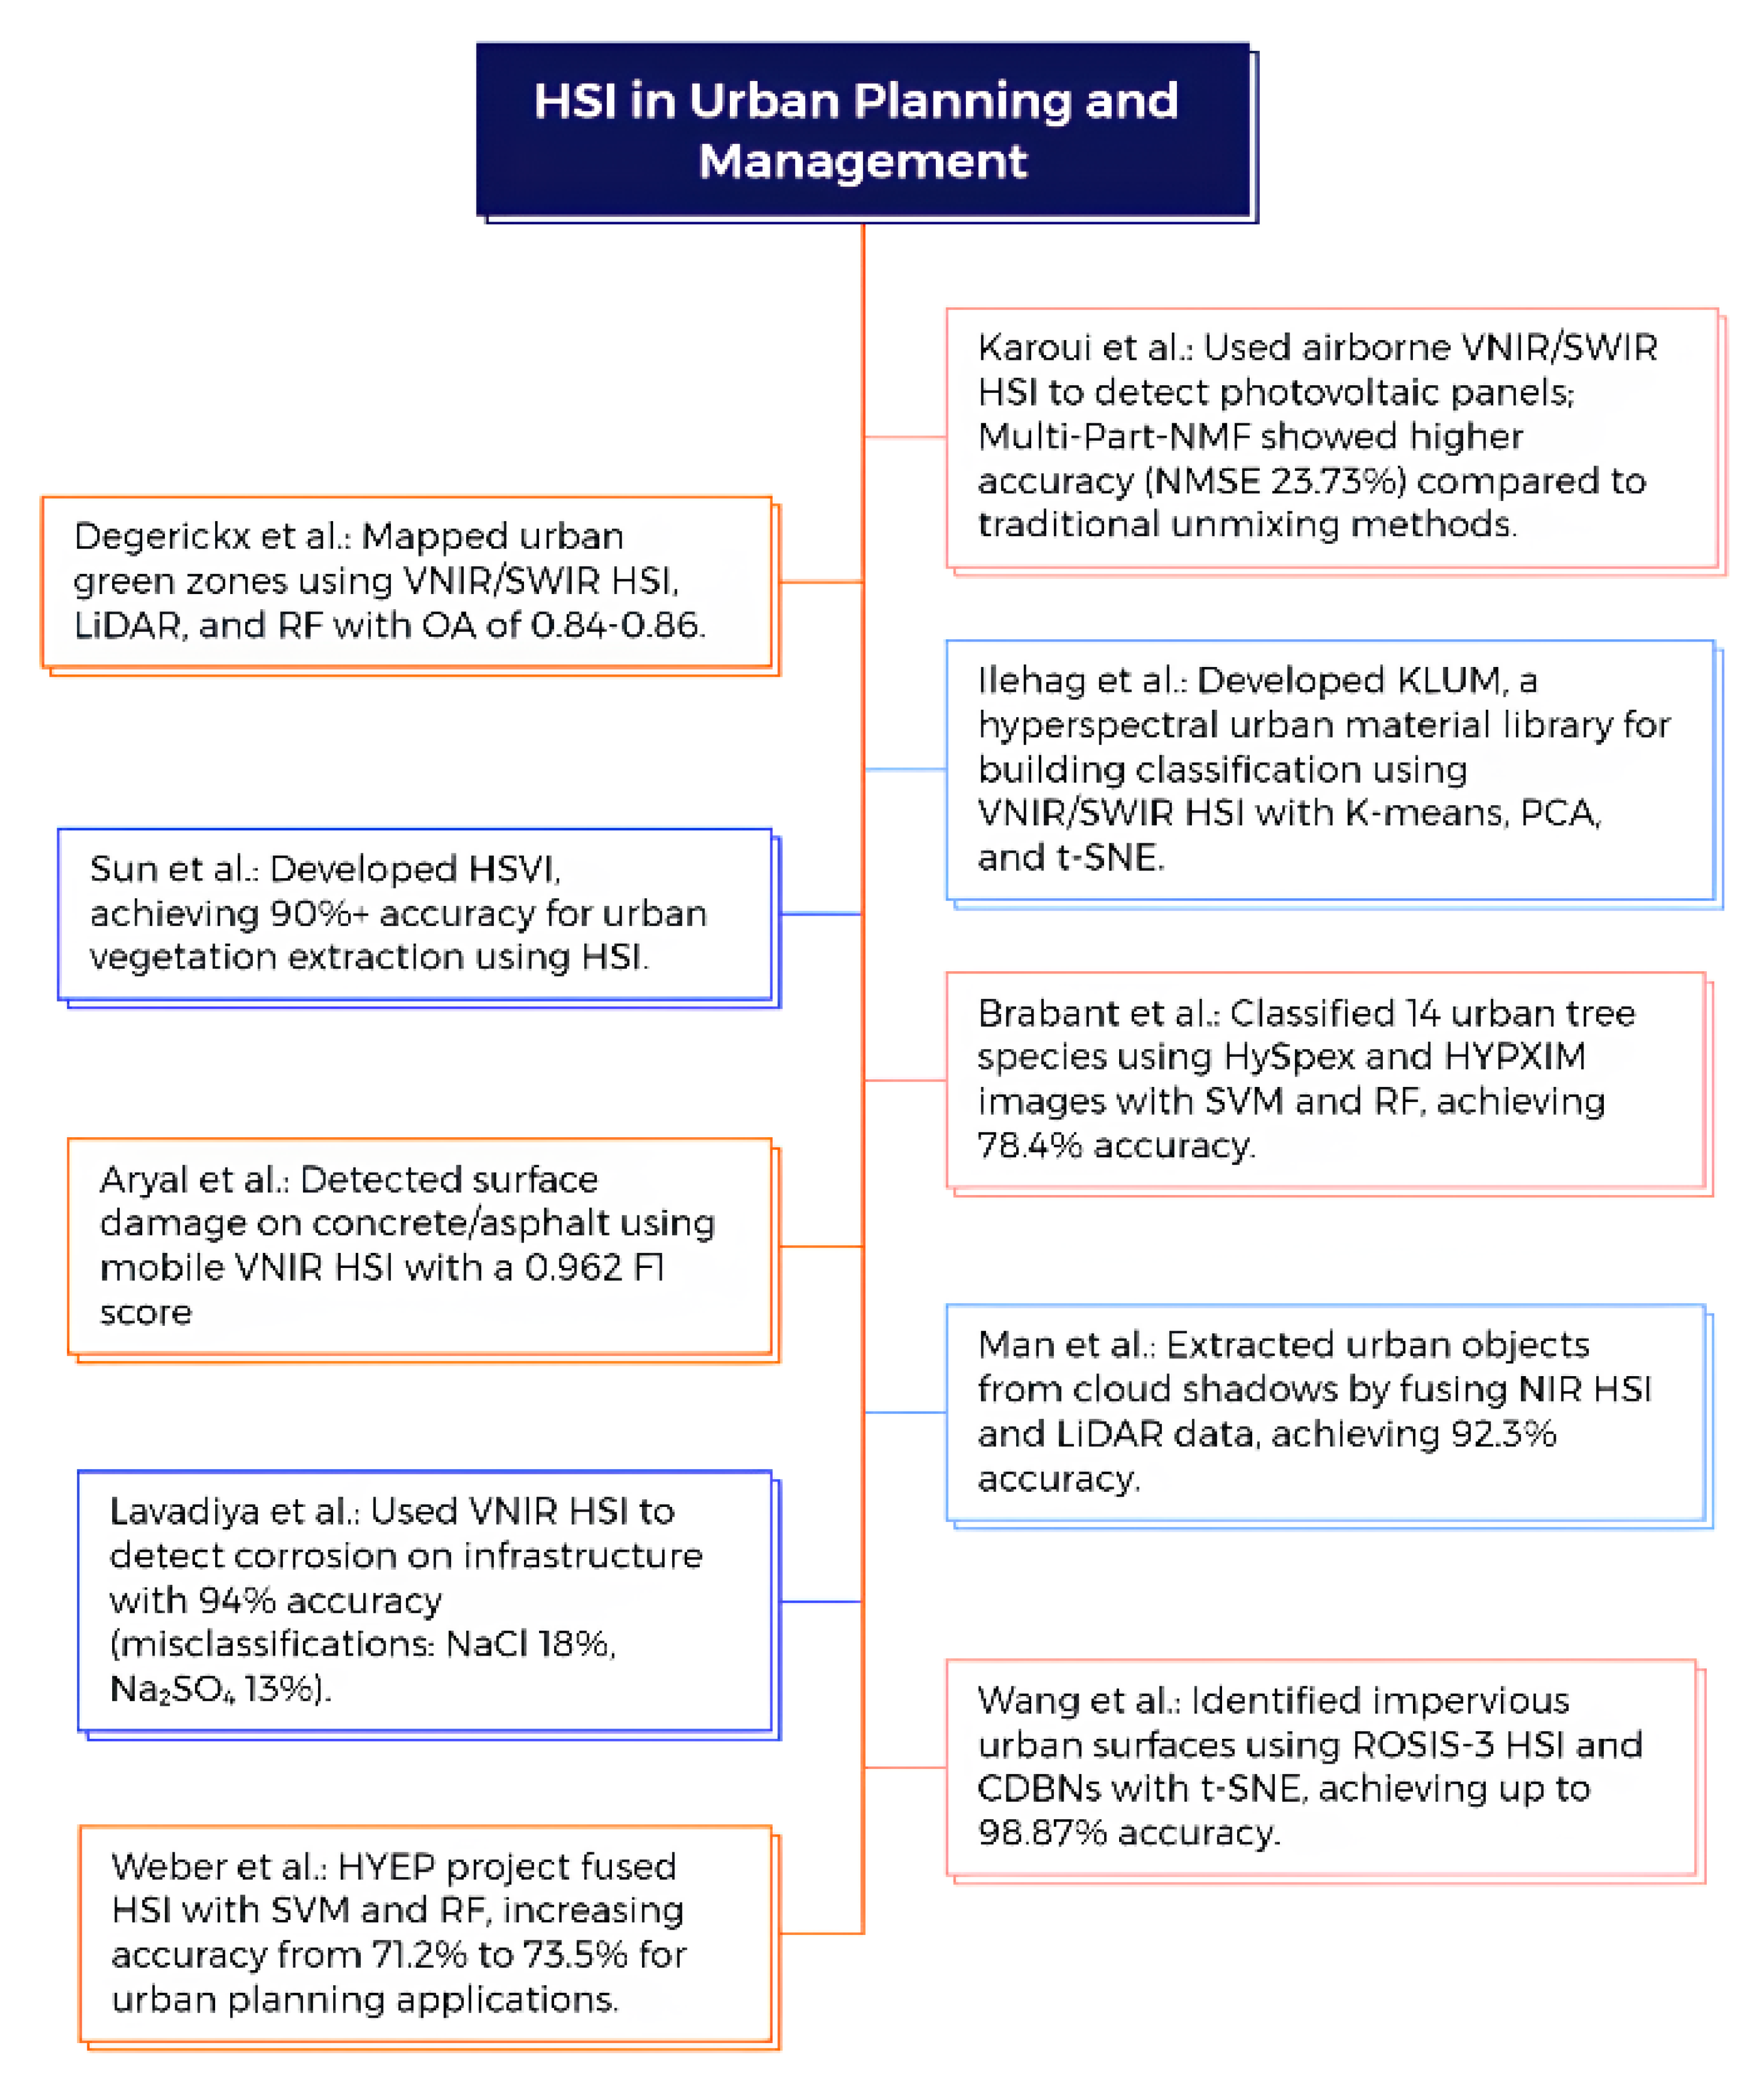
2.4. Urban Planning and Management

HSI is useful for urban planning and management in smart cities because it can provide comprehensive data on different areas across various wavelengths, allowing for the precise classification of urban materials that are critical for infrastructure monitoring as shown in Figure 5. Karoui et al. detected and estimated areas of photovoltaic (PV) panels from real airborne hyperspectral data [63]. Hyspex hyperspectral cameras were used to collect data in the VNIR range within the 400–1000 nm wavelength, a spectral resolution of 3.7 nm, and a spatial resolution of 0.84 m, and in the SWIR range within the 1000–2500 nm wavelength, with a spectral resolution of 6 nm, and a spatial resolution of 1.6 m. Partial linear nonnegative matrix factorization (NMF)-based unmixing techniques, such as multipart-NMF and grd-part-NMF, surpassed conventional NMF unmixing techniques, such as grd-NMF, multi-NMF, and the one class classification-based approach. Multipart-NMF had a mean normalized mean square error (NMSE) of 23.73% for solar panels, while in the literature, the multi-NMF had a mean NMSE of 98.64%. For grd-part-NMF, NMSE was 84.0% compared with the literature’s grd-NMF mean NMSE of 103.03%. For the |CC| criterion, the multipart-NMF had a mean of 0.98 compared with 0.49 for the literature multipart-NMF, while the grd-part-NMF had a mean of 0.74 instead of 0.47.
Ilehag et al. created the Karlsruhe Library of Urban Materials (KLUM), which contains building materials [64]. FieldSpec has wavelengths that range from 350 nm to 2500 nm, with 1.4 nm spectral sampling and a spectral resolution of 3 nm in the VNIR range and 1.1 nm spectral sampling and a spectral resolution of 8 nm in the SWIR1 and SWIR2 ranges. A total of 181 material samples, including roof, façade, and ground samples, were divided into 12 urban material classes and 33 subclasses. Among these, the three largest material classes were ceramic with 48 samples, concrete with 38 samples, and granite with 16 samples. k-means, PCA, and t-distributed stochastic neighbor embedding (t-SNE) were the techniques used. KLUM helps in the identification and classification of urban materials for urban planning and upkeep. Brabant et al. compared hyperspectral methods to classify urban tree varieties [65]. HySpex images with a resolution of 2 m and prototype HYPXIM images with a resolution of 4 m offered high accuracy in recognizing 14 tree species when using SVM and RF. A multispectral Sentinel-2 image was simulated from an airborne Hyspex image at 10 m, producing prototypal spaceborne hyperspectral images called HYPXIM at 4 m and 8 m. The HYPXIM 4 m and HySpex 2 m that were reduced by minimum noise fraction (MNF) provided the best classification accuracy of around 78.4% on 14 species and a kappa index of agreement of 0.7 with SVM.
Man et al. extracted urban objects from cloud shadows by fusing airborne light detection and ranging (LiDAR) point cloud data and NIR HSI data with a spectral resolution of 4.8 nm and a spatial resolution of 2.5 m [66]. The accuracy with SVM was 87.30%, while the decision fusion accuracy of the combined SVM and object-based classifiers was 92.30%. Wang et al. used a multi-feature extraction model (MFEM) to identify impervious urban surfaces by using features extracted from visible to shortwave Reflective Optics System Imaging Spectrometer-3 hyperspectral images that ranged from 0.43 μm to 0.86 μm with a spatial resolution of 1.3 m [67]. Spectral and spatial feature extraction was achieved by integrating convolutional deep belief networks (CDBNs) with t-SNE in the model. MFEM had a high overall accuracy (OA) of 96.16% in the city center scene and 98.87% in the university scene. That is, OA improved by 8.75% in the former and 3.83% in the latter.
Degerickx et al. used high-resolution remote sensing data to map functional urban green types [68]. They used 2 m VNIR and SWIR hyperspectral imagery with a spatial resolution of 4 m, which became 8 m after resampling. Active airborne LiDAR remote sensing technology and 0.5 m multispectral optical imagery and RF were used. The most valuable dataset was airborne LiDAR, but fusion with hyperspectral data was required to map the most detailed classes. The OA of initial maps was 0.84 and 0.86 for the detailed and basic vegetation classes, respectively. A Sentinel-2 multispectral dataset was simulated at a resolution of 10 m. Sun et al. created a new hyperspectral vegetation index (HSVI) and used HSI with a spectral range of 380–1050 nm and a resolution of 1 m per pixel for one dataset and a spectral range of 393–1012 nm and a resolution of 0.25 m per pixel for two other datasets [69]. With more than 90% accuracy in vegetation extraction, HSVI surpassed conventional vegetation indices, making it a reliable tool for tracking urban green zones. Aryal et al. studied the use of mobile VNIR HSI with a wavelength of 450–950 nm and a spectral resolution of 8 nm to detect material surface damage [70]. Among the 68 hyperspectral image instances and their companion gray-level images, 43 were concrete surfaces, and 25 were asphalt surfaces. Hyperspectral pixels with dimensionality reduction identified 8 different surface objects and outperformed gray-valued images with higher spatial resolution. Meanwhile, ML techniques, such as multiclass SVM (MSVM), found surface flaws accurately. The F1 score for fracture detection was 0.962.
Lavadiya et al. used VNIR HSI with 397–1004 nm wavelength to eliminate visual ambiguity in corrosion detection to determine the reasons for corrosion on infrastructure surfaces [71]. The training dataset comprised 35,000 data points, while the test dataset contained 15,000 data points. SVM was used to achieved 94% accuracy, but 18% misclassification occurred in NaCl corrosion and 13% in Na2SO4 corrosion. Weber et al. used multispectral and hyperspectral data of urban area studies as part of the hyperspectral imagery for an environmental urban planning (HYEP) project [72]. One dataset contained ground and airborne data collected during the 2012 Umbra experiment, while the other consisted of data collected during the 2015 trial. HSI was in the VNIR and SWIR range with a wavelength of 400–2500 nm and a resolution of 0.4–4 µm. Using HSI alone provided an accuracy of only 71.2%, and thus, it was fused with SVM, RF, and NMF to obtain an accuracy of 73.5%. For MS VHR image alone, accuracy was 69.2%, and it increased to 73.5% after fusion. The best classification method was SVM, followed by RF with MNF. The aforementioned studies show how HSI helps with several elements of urban planning and management in smarter cities by offering comprehensive data on urban conditions and components.

2.5. Smart Transportation

HSI is capable of improving how transportation works in smart cities. By gathering detailed information across a wide range of wavelengths, HSI is used in every aspect—from helping self-driving cars navigate to assessing road conditions and detecting objects—making cities safer and more efficient as shown in Figure 6. Around 290 million vehicles were on the road in the U.S. in 2022, and an estimated 40% of individuals spend at least 1 h commuting each day [73]. As urban areas expand, traffic increases and technologies, such as his, are used to improve road safety, manage traffic flow, and maintain road infrastructurhisHSI is important in smart transportation in smart cities, because of its numerous applications in areas, such as autonomous vehicle navigation, pavement condition assessment, and object detection. Jakubczyk et al.hised HSI for mobile robot navigation, collecting data under various light and weather conditions across different terrain types, such as asphalt, forest roads, and grass [74]. The study successfully improved surface recognition by using kernel density estimation (KDE) and supervised learning with a modified nearest neighbor method. It contributed to improved path planning and the determination of permissible speeds for autonomous vehicles to establish smarter and safer transportation systems.
Taher et al. investigated whether using hyperspectral single photon LiDAR to improve autonomous vehicle perception was feasible. A total of 300 samples across 10 distinct road environment classes, including dry asphalt and snow-covered surfaces, were used [75]. Classification accuracy for RF and t-SNE increased from 50% to 94% as the number of spectral channels increased from 2 to 30. The study occurred within the 920–1620 nm wavelength. This approach emphasizes the importance of detailed spectral information for improving the reliability of autonomous systems under diverse environmental conditions. Özdemir et his used HSI to assess pavement conditions by collecting data from various soil types, paving stones, and asphalt types [76]. ANN, SVM, spectral angle mapper (SAM), and stacked autoencoders (SAEs) were the techniques used. ANN with SAM resulted in improvements that ranged from 1.2% to 21%. Data were collected with a spatial resolution of 5 cm along the track and 1 cm along the cross-track direction within the 400–900 nm rhise. Thus, HSI can be used in detailed pavement analysis to maintain road infrastructure in smart cities.
Abdellatif et al. introduced a novel asphalt crack index for pavement crack detehison by using HSI in the VNIR range of 450–550 nm [77]. The index achieved considerable improvement in detecting cracks, with a rise of 21.37% in the F1 score, and exhibited potential to contribute to automated road maintenance systems by making timely repair possible, improving the safety and efficiency of transportation networks. Lee et al. developed a lightweight CNN-based channel sampler trained through a self-supervised adversarial learning tehisique that used HSI to improve vehicle detection [78]. Single-channel images that prioritized the most critical spectral information were generated, improving object detection accuracy, providing insights into the effect of specific wavelengths on detection performance, and contributing to the development of smart transportation systems that rely on real-time data processing.
Gutiérrez-Zaballa et al. studied fully convolutional networkhisFCNs) for on-chip HSI segmentation in autonomous driving [79]. By utilizing the HSI-Drive 1.1 dataset, their study compared field-programmable gate array (FPGA)-programmable system on chip (PSoC) and graphics processing unit (GPU)-SoC architectures and demonstrated that FPGA-PSoC achieved better energy consumption and processing latency. This procedure was performed in the VNIR range between 535 nm and 975 nm, with a reduced resolution ohis16 × 409 × 25. Thus, HSI paves the way for more responsive and energy-efficient autonomous drhisng systems. Integrating HSI into various aspects of smart transportation can make transportation systems smarter, safer, and mhis efficient. The ability of HSI to provide comprehensive spectral data across a range of wavelengths and conditions enhances the functionality of autonomous vehicles and supports the maintenance of road infrastructure, making cities smarter and more livable.

2.6. Smart Energy

Smart energy systems are important to the success of smart cities, particularly as they move toward 100% renewable energy. In 2018, global renewable energy production reached 376 TWh, a 6.1% rise from 2017, with solar and wind energy growinghis 28% and 11%, respectively [80]. HSI can help in the maintenance of solar and wind energy infrastructure, supporting the integration of renewable energy in urban areas as shown in Figure 7. Baliyan et al. developed an advanced ML-based analytical framework to autonomously analyze the hyperspectral Raman datasets of lithium-ion battery (LIB) electrodes [81]. By utilizing a neural network and a combination of techniques, such as PCA and NMF with self-organizing and alternating regression diagnostics (NMF-SO-ARD), an accuracy above 94% was obtained in classifying spectral signatures of LIB components, such as carbon and LiMO2, where M = Ni, Mn, Co. By using ML with HSI, real-time analytics can be achieved with minimal human intervention, making energy storage systems more reliable and efficient.
Jörges et al. used HSI in the field of solar energy, particularly spaceborne PRISMA and Airborne Visible Infrared Imaging Spectrometer—Next Generation (AVIRIS-NG) data with a resolution of 5.3 m, to detect PV power plants [82]. Spectral indices, such as the normalized hyperspectral index (nHI), normalized spectral profile index (NSPI), and advanced VNIR and SWIR indices for classifying solar PV installations, were used. The PRISMA data, which covered VNIR and SWIR range of 400–2505 nm with a resolution of 30 m, provided 70.53% user accuracy and 88.06% producer accuracy. Meanwhile, AVIRIS-NG data with a resolution of 5.3 m yielded 65.94% accuracy for the former and 82.77% accuracy for the latter. Thus, HSI can be used in renewable energy mapping and monitoring in urban areas, contributing to the optimization of solar energy integration in smart cities. Schultz et al. used hyperspectral photoluminescence (PL) imaging in the field of solar energy to spatially resolve electrical parameters in laser-patterned perovskite solar cells, enabling the fast and noninvasive determination of crucial metrics, such as quasi-Fermi level splitting and shunt resistance, which are necessary to optimize electrical interconnections in solar cells [83]. Nanosecond and picosecond laser pulses interconnected cells with minimal material alteration, proving that HSI can improve the manufacturing and performance of solar energy systems in smart cities.
Attia et al. explored a different aspect of solar energy by using k-means clustering (k-mc) and HSI for the instant testing and noncontact diagnosis of mono-Si PV cells [84]. Hyperspectral data in the VNIR range between 400 nm and 600 nm with a peak wavelength at 450 nm were used to distinguish between working and nonworking regions of the cells. This noninvasive technique offers a rapid and accurate means to assess and improve PV cell performance, facilitating better maintenance and management of solar energy systems in smart cities. Rizk et al. used HSI in the field of wind energy for the early detection of ice on wind turbine blades [85]. VNIR HSI of 3 nm spectral resolution with a wavelength between 340 nm and 1700 nm was used, allowing for the detection of ice formation as thin as 0.1 mm, which is critical for preventing turbine malfunction and optimizing wind energy generation. Rizk et al. also used HSI combined with multicriteria classification and net analyte signal algorithms to improve the detection of defects, such as cracks and erosion in wind turbine blades, attaining 100% detection accuracy by using only 55 bands, and demonstrating that HSI is necessary for the durability and operational efficiency of wind turbines in smart energy infrastructure [86]. HSI, combined with advanced analytical techniques, has advanced the monitoring, optimization, and maintenance of various energy systems, which range from batteries to solar and wind energy in smart cities, creating more sustainable and resilient urban environments.

2.7. Others

HSI contributes to smart cities in other areas, such as smart healthcare, smart agriculture, and counterfeit detection as shown in Figure 8. In healthcare, HSI boosts diagnostic accuracy and allows for continuous noninvasive monitoring, which is crucial for patient care. The smart healthcare market, which was estimated at USD 143.6 billion worldwide in 2019, continues to increase at 16% every year because innovations, such as HSI, have made it possible [87]. HSI is also used to observe crop health and soil and for resource use optimization in smart agriculture. For counterfeit detection, HSI provides a detailed analysis of forgery detection. These advances contribute to the safety and well-being of residents of smart cities. Wawerski et al. used SWIR HSI within the spectral range of 900–2500 nm to monitor glucose and silicon levels, which is necessary in managing conditions, such as diabetes [88]. The dataset contained 94,730 glucose samples and 47,375 silicon samples. Linear regression exhibited an evaluation error of about 5% for silicon and over 10% for glucose. SVR and multilayer perceptron (MLP) performed better than linear regression, demonstrating how HSI can be used in real-time health-monitoring systems in smart cities. Ahn et al. used SWIR HSI of 887–1722 nm to estimate food nutrient composition from five food categories [89]. DNN provided high accuracies for carbohydrates, proteins, and fats (CPF) values, with an average R2 of 0.885 and a symmetric mean absolute percentage error (SMAPE) of 0.1189. A nutrient analysis that uses HSI is helpful for those concerned about food intake and weight changes because of various conditions, such as diabetes and obesity. La Salvia et al. used HSI in medical imaging to detect skin cancer [90]. They analyzed 76 hyperspectral images of skin lesions from 61 subjects by using VNIR HSI within a spectral range of 450–950 nm. A vision transformer (ViT) architecture was adopted. An accuracy of 91% and a precision of 99% were obtained for malignant melanocytic lesions, demonstrating the use of HSI in medical diagnostics, and thus, HSI contributes to smart healthcare.
HSI is a pivotal technology in smart agriculture in smart cities, enabling precision farming and efficient resource management. Neri et al. developed a real-time artificial intelligence (AI)-assisted push-broom hyperspectral system to monitor plant health in lettuce and arugula crops [91]. It was operated across a wavelength of 300–1000 nm in the UV–VIS–NIR spectrum with a spatial resolution of 0.16 cm/px. This system used an MLP neural network to analyze reflectance spectra. It allowed for continuous analysis across 720 ground positions at 50 fps to improve the ability to promptly respond to agricultural needs in urban environments, such as smart cities. Ang et al. used the AVIRIS Indian pines dataset and the ICONES hyperspectral satellite image dataset to classify agricultural areas by using advanced ML techniques, such as linear discriminant analysis (LDA), SVM, k-NN, and ensemble trees [92]. An accuracy of 77.8% was obtained on the AVIRIS dataset by using SVM and HSI of 20 m spatial resolution and a spectral range from 0.2 μm to 2.4 μm. SVM obtained 98.8% and ensemble tree obtained 94.4% on the ICONES dataset within the spectral range of 365–2497 nm. Such precise classification supports smart agricultural management by accurately identifying crop types and health from large-scale remote sensing data, which is crucial for smart city planning and sustainability. Abdulridha et al. used HSI within the VNIR range of 380–1000 nm to identify and classify downy mildew severity stages in watermelon crops by using both benchtop systems and an aerial UAV [93]. Their study used MLP and decision tree, and the best accuracy was 91% for MLP when disease severity DS was high. The key wavelengths identified for disease stage differentiation were 531 nm and 700–900 nm, demonstrating the use of HSI and spectral vegetation indices (VI) in enhancing disease detection by detecting crop diseases early and improving urban agricultural productivity.
Counterfeit detection may enter under smart integrity to protect residents and businesses in a smart city. Counterfeits of pharmaceutical products, food products, documents, and artworks can be detected using HSI. Ciza et al. compared handheld NIR and Raman spectrophotometers in detecting fake pharmaceutical products, such as ibuprofen, paracetamol, and artemether–lumefantrine in tablet or capsule forms [94]. By using hierarchical clustering algorithms, data-driven soft independent modeling of class analogy, and hit quality index, NIR systems were found to exhibit better detection abilities, with Matthews’ correlation coefficients that were nearly one. Phillips et al. detected adulteration in mānuka and clover honey samples, with an accuracy of above 95%, particularly at high adulteration levels, by using ML techniques, such as k-NN and SVM with NIR HSI of 400–1000 nm and a spatial resolution of 520 × 696 [95]. The highest number of misclassification occurred for lower adulteration concentrations. Tyagi et al. used HSI and unsupervised DL to detect forged documents and identify writers [96]. The University of Western Australia’s writing-ink hyperspectral image dataset was used to distinguish between blue and black inks. By using a convolutional autoencoder (CAE) for feature extraction and SVM for classification, an accuracy of 92.78% was attained in writer identification. Zeng et al. used multiscale spatial–spectral feature fusion and CNNs to check whether three pairs of paintings were real or fake [97]. High-definition VNIR hyperspectral images of 780, 850, and 930 nm were used, while circular local binary pattern (LBP) and PCA were adopted for feature extraction. The test dataset provided an accuracy of 90.8%, which was a 3.5% improvement than the existing top-performing 3D-CNN. Hence, the use of HSI in smart cities ensures authenticity, prevents fraud, protects public health and safety, and ensures the reliability of financial, legal, and cultural institutions.

3. Technological Advancements

3.1. Sensor Technology

Traditional methods, such as multispectral imaging (MSI), thermal imaging, and LiDAR, have been widely used in various applications. Multispectral sensors may be limited by their spectral resolution, but they are still capable of capturing data across broad spectral bands for applications, such as land cover classification [98] and vegetation monitoring [99], although limited by their spectral resolution. Thermal sensors monitor urban heat emissions and help identify heat islands [100], but they struggle in differentiating materials with similar thermal radiation. LiDAR offers high-resolution 3D mapping, which is important for urban mapping [101] and infrastructure analysis [102]. LiDAR is effective for spatial mapping but lacks spectral detail, and thus, it sometimes requires integration with other sensors. Traditional sensors set the stage for more advanced sensors, and HSI marks a significant innovation.
In contrast with multispectral sensors, HSI captures data across hundreds of contiguous spectral bands, allowing for precise material identification. HSI is useful in tasks such as pollutant detection [103], vegetation identification [104], and monitoring building material degradation [105]. Its ability to capture subtle spectral differences surpasses earlier sensor limitations. HSI sensors have three major types: push broom, whisk broom, and snapshot. Push-broom sensors capture images line by line and can obtain spatial and hyperspectral data [106]. Whisk-broom sensors scan pixel by pixel and offer uniform coverage, but they can be affected by temporal illumination variations [107]. Snapshot sensors capture entire images at once and are portable, but they tend to exhibit limitations in hyperspectral data [108]. The sensor to be used depends on the specific application that it will be used for.
Commercially available HSI sensors have a variety of applications in smart cities. The spectrometers mentioned in this section have been used in the studies that have been reviewed earlier. Their respective spectral ranges and resolution given in this section are only possible examples because these specifications can be customized differently even for the same type of spectrometers. Popular spectrometers include ASD FieldSpec 3 by ASD Inc. (Falls Church, VA, USA), which is a field-portable spectrometer suitable for environmental monitoring. This sensor provides high-resolution data, with a resolution of 1 nm in the VNIR range between 350 nm and 1000 nm and a resolution of 8 nm in the SWIR region from 1000 to 2500 nm. The Avantes AvaSpec-ULS2048L has a broad spectral range of 200–1100 nm, while its resolution varies between 0.06 nm and 20 nm. It is highly suitable for air quality monitoring and other environmental studies. The Telops FIRST-MW Hypercam Fourier-transform infrared (FTIR) spectrometer operates in the mid-infrared region within the spectral range of 1850–6667 cm−1, with a spectral resolution of 1 cm−1 for applications such as pollution detection tasks in smart cities.
The NIR hyperspectral camera, Specim, with an ImSpector N17E spectrograph, which operates within the NIR range of 1000–1700 nm, can be used in waste classification and material sorting. Specim supplies the SISUChema XL workstation, which works within the SWIR range from 1000 nm to 2500 nm with a spectral resolution of 6.3 nm, and is normally used in industrial waste management. The Texas Instruments TIDA 00554 spectrometer utilizes digital micromirror device (DMD) technology in selecting precise wavelengths that allow for superior performance in high-speed dynamic applications, including waste analysis and environmental monitoring. It operates within the NIR range between 900 nm and 1700 nm. The HySpex SWIR-384 sensor, developed by Norsk Elektro Optikk, has a SWIR range of 930–2500 nm and operates with new-generation high-resolution push-broom scanning. Thus, it is highly suitable for smart transportation and infrastructure monitoring.
PRISMA is a satellite sensor developed by the Italian Space Agency. It has high spectral resolution within the 400–2500 nm range. VNIR has 66 bands, while SWIR has 171 bands, both within a spectral resolution of ±9 nm. PRISMA satellite sensor data are crucial for large-scale urban planning and environmental studies. The Headwall VNIR Hyperspec camera has been proven to be useful in smart transportation systems, because it operates within the VNIR range between 400 nm and 1000 nm with approximately 408 bands. Thus, it is good for traffic and infrastructure observation. The hyperspectral camera SOC710 from Surface Optics exhibits representation for a spectral range between 400 nm and 1000 nm with a spectral resolution of 5 nm and 128 spectral channels. It can be useful in environmental assessments and smart energy.
The Gaiasky mini2-VN is a UAV-mounted hyperspectral imager with a spectral range of 393–1012 nm across 360 bands. It was designed for several applications involved in environmental monitoring and land cover classification. It offers high-resolution data for the precise identification of ground features.
Recent advances have focused on miniaturizing hyperspectral sensors for deployment on UAVs [109] and ground vehicles. These sensors will be cost-effective, easier to integrate, and exhibit better durability and range, such that they can be used in harsh environments for comprehensive urban monitoring. Simultaneously, they will still have high spectral resolution. The multi-sensor data fusion of HSI with technologies, such as MSI, LiDAR, and thermal imaging, can provide a more holistic urban view [110]. Similarly, multispectral, HSI, LiDAR, and synthetic aperture radar (SAR) data contain detailed information that is complementary to one another, and data fusion can help obtain images with even better resolution, improving the overall efficiency and effectiveness of urban monitoring in smart cities [111].

3.2. Data Processing and Analysis

HSI is critical for smart city applications. However, considerable computational resources are required due to the huge amount of available hyperspectral data. Efficient data compression methods, such as unmixing-based algorithms, have been used to manage bandwidth limitations during data transfer, particularly in small satellites with limited power and storage. However, these computationally demanding compression processes frequently have to rely on hardware accelerators, such as FPGAs and GPUs [112]. They can be used to monitor and analyze urban landscapes in real time, ensuring timely and accurate data delivery for smart city management. Platforms that support parallel and distributed computing methods, such as FPGA-cloud and GPU-cloud platforms, improve anomaly detection in hyperspectral images, which is important for identifying unusual events in dynamic urban environments [113].
Onboard information processing for anomaly detection has achieved considerable progress, particularly with hardware-friendly algorithms embedded into reconfigurable devices, such as the HW-LbL-FAD detector, and less costly and energy-saving FPGAs can be used. This development is critical for smart city applications where real-time performance is necessary to respond to urban challenges as they arise [114]. Rapid prototyping in FPGA-based systems has enabled the use of MSVM algorithms for real-time HSI applications, which are important for smart cities [115]. Open-source hyperspectral image-processing software, such as HSI-PP, combines image processing, feature extraction, and modeling into a proper data mechanism with high throughput capacity, such that large-scale environmental data can be precisely and rapidly processed [116].
Dimensionality and noise reduction techniques, such as PCA and MNF, are crucial for making hyperspectral data manageable while retaining essential spectral information [117]. This condition is critical in smart cities, because planners and environmental managers require precise data to enable them to make appropriate decisions regarding infrastructure development and environmental conservation. ML and DL algorithms, such as CNNs [118], SVMs, and RF, improve the classification accuracy of land cover types and materials necessary for effective urban management [119]. Integrating HSI with big data analytics, AI [120], and ML techniques will help in processing and interpreting vast datasets, making data-driven decisions, and raising the utilization efficiency of resources in smart cities [121].
HSI can be used with autoencoders for encoding and decoding, possibly revealing previously hidden patterns in big datasets to ensure correctness in predictive models and decision-making in smart cities [122]. Although useful for any type of application, cloud-based analysis has been proven to be highly valuable in large-scale urban monitoring assignments, such as pollution tracking or disaster impact assessment [123]. The huge amounts of data generated by hyperspectral sensors require powerful storage and processing frameworks. Advanced big data techniques, such as the local discriminant model and global integration (LDMGI) algorithm, and big data branch definition can extract and classify spectral features hierarchically and improve the accuracy of queries within smart city databases [124]. In addition, novel computational frameworks for big hyperspectral data analytics address challenges in high-dimensional and multisource data, enhancing scalability and efficiency in a manner that is critical for the complex and multifaceted data environments of smart cities [125].

3.3. IoT Integration

HSI can be incorporated into IoT networks and used with AI for streamlined data transmission and cloud-based processing, making real-time data collection and analysis simpler and more efficient, and improving decision-making in smart cities [126]. IoT-HSI systems are necessary to keep environmental factors, such as air and water quality, in check because they are closely tied to public health. In air quality monitoring, UAVs equipped with HSI sensors can capture highly accurate air pollutant data. IoT-HSI systems can be used to monitor water bodies for pollutants, turbidity, and other water quality parameters. IoT networks ensure that data will be transferred quickly to central databases for analysis, allowing authorities to address pollution issues promptly. Such systems can also automate waste sorting and recycling by classifying waste materials in accordance with their spectral signatures, and data collected from different waste collection points are sent to a central hub for analysis, allowing cities to optimize collection routes and ultimately reducing costs.
These IoT-driven systems are also used in satellite technology to handle large-scale tasks, such as land cover classification [127]. Cities can also use edge computing with HSI for real-time urban planning. Advanced methods, such as maximum–minimum distance embedding and unsupervised classification frameworks, can be used to improve accuracy [128]. Semi-supervised learning models, such as adaptive pseudo-label feature learning (APFL), further improve classification by creating pseudo-labels and reducing interclass variance [129]. When DL models, particularly those built on batch structures, are integrated into IoT-HSI systems, they can process smaller datasets more effectively [130]. By integrating HSI and IoT, HSI will be able to identify and classify specific materials better, such as the application of HSI unmixing in identifying a specific material present in an urban background, e.g., vegetation [131]. These advanced techniques, including nonlinear unmixing with autoencoder networks, have been applied in smart farming, particularly when drones are used [132].
IoT-HSI systems can monitor and obtain real-time data from infrastructure, such as roads, railway tracks, and solar panels, in case of defects to schedule maintenance sessions if necessary. In smart healthcare, hospitals can benefit from IoT-HSI technology because it allows real-time monitoring of patients. IoT-HSI systems help monitor grain storage for food safety and pest management [133]. They also detect pesticide residues in fruits and vegetables to comply with safety regulations [134]. AI and IoT can be used with HSI to recognize plant diseases in smart farming [135]. IoT-HSI systems can help farmers make better decisions on irrigation, fertilization, and pest control, improving yields and reducing chemical use [136].
IoT-HSI systems can be used in counterfeit detection, which is necessary to ensure product authenticity and protect consumer rights. Secure cloud-aided object recognition in hyperspectral remote sensing allows for resource-constrained devices in smart cities to perform complex tasks efficiently [137]. Combining IoT and HSI technologies allows for efficient real-time monitoring, resource management, and decision-making across multiple applications. As the scale of IoT networks increases and HSI systems become more accessible, these types of systems will develop more toward smarter and sustainable modes of urban development.

4. Future Prospects

4.1. Emerging Trends

Emerging trends in HSI for smart cities include integrating advanced technologies, such as AI, ML, cloud computing, edge computing, and IoT. They enable more efficient data analysis and better real-time decisions. AI and ML can be used to process huge complex datasets generated by hyperspectral sensors [138]. As cities expand and more sophisticated tools are required to manage diverse data streams, AI and ML models are necessary to automate hyperspectral data analysis and predict environmental changes, streamline urban planning, and improve public safety measures. ML and DL are increasingly used in HSI applications, such as medical diagnosis [139,140]. Cloud computing is required to store and process huge amounts of data produced by HSI systems, providing real-time data access and enabling large-scale AI model deployment [141].
IoT-HSI systems represent a growing trend due to their uses in real-time environmental monitoring. IoT devices with hyperspectral sensors collect continuous data on factors that enable cities to make rapid adjustments. Integrating IoT can help improve smart transportation, disease diagnosis, and energy efficiency [142]. Remote sensing technologies, such as drones and satellites, are increasingly used with HSI to evaluate urban landscapes and infrastructure health. DL models have been widely used in processing highly detailed remotely sensed HSI data and address issues in a city, such as pollution [143]. Edge computing is a decentralized approach that allows hyperspectral data to be processed locally, enabling real-time adjustments to reduce congestion and ensuring that essential services, such as public safety and transportation, can operate autonomously without any delays. These emerging trends contribute to a more efficient and sustainable smart city.
Although it is currently used in more conventional fields, HSI is emerging in fields, such as nano- and micromaterials, bioimaging, and biosensing. Its value lies in its ability to reveal environment-specific optical properties, improving interpretation of structure–property relationships and nano–bio interactions. HSI’s high spectral resolution also supports optical multiplexing, which is essential for high-throughput biological imaging [144].

4.2. Real-Time Processing and Ethical and Policy Implication Challenges of AI-Powered HSI in Smart Cities

ML and DL have markedly advanced HSI applications by augmenting classification, feature extraction, and anomaly detection in the context of smart cities. Conventional ML methods, including SVM and k-NN, are extensively employed in hyperspectral data categorization due to their proficiency in managing high-dimensional spectral data with a scarcity of labeled samples. Nonetheless, they frequently encounter difficulties with feature extraction and scalability when managing extensive datasets. Conversely, DL techniques, such as CNN, have transformed HSI analysis by autonomously acquiring spatial and spectral characteristics, leading to enhanced accuracy and generalization. Recently, generative adversarial networks (GANs) have been investigated for spectral data augmentation, addressing issues associated with restricted labeled datasets, while transformer-based designs provide improved contextual learning, facilitating superior performance in intricate urban settings. Despite their benefits, DL models demand substantial computational resources and extensive training datasets, which may not always be practical in real-time smart city applications. Future research must focus on refining AI algorithms to achieve a balance between accuracy and computing efficiency, facilitating wider implementation of AI-driven HSI in urban systems. The amalgamation of HSI with edge computing and IoT presents significant opportunities for real-time smart city applications, including pollution monitoring, traffic control, and infrastructure evaluation. Nonetheless, the computational requirements of HSI pose considerable obstacles to real-time processing in edge computing and IoT settings. In contrast with traditional imaging, HSI data encompass hundreds of spectral bands per pixel, resulting in increased storage, transmission, and processing expenses. Conventional cloud-based processing models may incur latency, rendering them inappropriate for time-sensitive applications. Researchers are creating lightweight DL models that are targeted for edge deployment, including pruned CNN architecture and knowledge distillation approaches that diminish model complexity while preserving accuracy. Furthermore, progress in neuromorphic computing and FPGA-based accelerators is facilitating more energy-efficient processing of hyperspectral data directly on edge devices. By utilizing AI-driven on-chip computing, urban monitoring systems can execute real-time anomaly detection and predictive analytics independently of centralized servers. Future endeavors should focus on improving hardware–software co-optimization to provide accelerated and more scalable HSI applications in smart cities. Although AI-driven HSI offers transformative potential for urban planning, environmental monitoring, and security, its implementation poses significant ethical and policy challenges. A key concern is data privacy, because hyperspectral sensors can acquire intricate spectral signatures of materials, human activities, and urban environments, potentially resulting in inadvertent surveillance and privacy infringements. Moreover, algorithmic bias in AI-driven HSI analysis may adversely affect underprivileged communities if not meticulously managed, particularly in fields such as health monitoring, pollution evaluation, and infrastructure planning. Regulatory frameworks must be developed to guarantee transparent AI decision-making, data anonymization, and ethical AI governance in the integration of HSI into smart city infrastructures. Moreover, environmental policies must direct the judicious implementation of airborne and spaceborne HSI sensors to mitigate ecological disturbance while enhancing their effectiveness for sustainability initiatives. Involving politicians, engineers, and urban planners in interdisciplinary dialogs will be essential for creating AI-driven HSI applications that emphasize innovation and ethical accountability.

4.3. Limitations and Future Scope

HSI can be incorporated into IoT networks and used with AI for streamlined data transmission; HSI tends to generate huge datasets with high-dimensional data, which require complex data acquisition and processing techniques [145]. A huge amount of storage and high-speed processing capabilities are required. PCA and its variations may be used for dimensionality reduction, while MNF may be used for noise reduction [146]. Interpreting intricate hyperspectral data requires advanced algorithms, but current AI and ML models are not yet optimized for high-dimensional HSI data, risking inaccuracies in applications, such as pollution detection. Integrating HSI with existing urban systems remains challenging due to the need for significant upgrades in hardware, software, and data management interfaces, hindering interoperability with conventional smart city platforms.
Hyperspectral sensors tend to be expensive and pose several challenges, such as short battery endurance in UAV HSI operations [147]. Environmental factors further complicate HSI’s use because hyperspectral sensors are sensitive to weather conditions, such as cloud cover, rain, and fog, which may decrease visibility and, thus, affect data quality and reliability. Variable lighting and shadows in urban areas may also impair spectral resolution. Overcoming these challenges will require further technological advancements in a smart city as a whole. The mixed pixel problem is ubiquitous in remote sensing images for urban land use interpretation due to hardware limitations. Subpixel mapping (SPM) is a common method used to address this issue by enhancing the observation scale and achieving a more refined spatial resolution in land cover mapping. Satellite-based HSI is extensively employed in large-scale urban monitoring, but its constrained spatial resolution poses obstacles, including mixed pixels and spectral fluctuation, which diminish its capacity to reliably differentiate ground objects. These constraints result in spectrum mixing, which complicates urban categorization tasks. Recent improvements, such as spectral unmixing models, DL-based subpixel categorization, and data fusion algorithms, address these challenges by improving spatial resolution. Hybrid methodologies that combine satellite, aerial, and UAV-based hyperspectral imaging are emerging as effective methods for enhancing urban-scale monitoring. He et al. proposed a semantic information-modulated (SIM) deep subpixel mapping network (SIMNet) that utilizes low-resolution semantic images prior to enhance the representation of spatial context characteristics. Their findings indicated that the suggested SIMNet is an effective method for high-resolution urban land use mapping by utilizing readily accessible lower-resolution remote sensing imagery [148].
As cities become increasingly interconnected, HSI also becomes more important in various aspects of smart cities, such as in the real-time monitoring of infrastructure, environmental conditions, and resource usage. The high cost and need for specialized equipment limit HSI’s broader application. Accordingly, the development of portable, low-cost, and miniaturized hyperspectral acquisition devices is being explored, and it can help monitor environmental quality with more flexibility [149]. Thus, future advancements in HSI include the development of smaller and more affordable systems integrated into citywide networks that can be deployed at various scales. Improvements in microprocessors and dedicated ML cores will lead to faster data analysis and affordable detectors. These advances will facilitate the use of HSI in mobile platforms and smaller-scale operations [150]. Furthermore, techniques, such as transfer learning and graph-based convolutional networks, can enhance the handling of high-dimensional data direction [151]. With advances in AI and machine learning, HSI can provide data for predictive models that can enhance city management, including forecasting infrastructure failures and environmental hazards, allowing for autonomous decision-making to optimize city operations and improve safety.
HSI technologies have advanced considerably, presenting different compromises in spectral resolution, signal-to-noise ratio (SNR), geographic coverage, and computing efficiency. Conventional push-broom and whisk-broom sensors are extensively utilized because of their elevated spectrum resolution and exceptional SNR. Push-broom sensors simultaneously collect a complete line of pixels, resulting in enhanced spatial and spectral fidelity, while whisk-broom sensors scan pixel by pixel, attaining remarkable spectral purity but with slower data acquisition rates. However, both require mechanical scanning, limiting their portability and real-time usability in dynamic urban environments. Snapshot HSI sensors capture the complete environment in a single exposure, eliminating the necessity for scanning and facilitating real-time processing, rendering them optimal for UAV-based and handheld applications in smart cities. Metamaterial-based HSI sensors are emerging as a promising alternative, leveraging engineered nanostructures to enhance spectral selectivity and significantly reduce sensor size while maintaining high spectral fidelity. Cost is another crucial factor in sensor selection. Conventional airborne and satellite hyperspectral imaging systems, represented by Hyperion of the National Aeronautics and Space Administration and Sentinel-2 of the European Space Agency, may incur costs that amount to millions of dollars due to their superior spectral resolution and broad spatial coverage. Conversely, smaller snapshot sensors incorporated into UAVs or portable devices, such as Specim IQ and Cubert ULTRIS, are considerably more economical, generally priced between USD 10,000 and USD 50,000. The latest sensors provide onboard real-time processing, diminishing reliance on external computing resources and improving their use in smart city applications, including real-time pollution monitoring, traffic control, and infrastructure evaluation.
HSI will also integrate with emerging technologies in future smart cities, enhancing areas such as traffic management, disaster preparedness, and infrastructure maintenance. HSI already has uses in many areas, such as medical imaging, but in the future, it will be used for even more applications with advancements in technology. For urban design and planning, HSI can aid in visualizing and modeling interactions among urban materials, light, heat, and pollutants, helping planners design cities that improve livability and reduce energy consumption. Globally, HSI can connect cities through shared hyperspectral data, fostering a coordinated response to urban challenges. Thus, HSI has considerable benefits and can make smart cities more efficient.
HSI offers distinct advantages over other remote sensing technologies that are commonly used in urban monitoring, including MSI, LiDAR, and traditional optical sensors. In contrast with traditional optical sensors that capture images in three visible bands (RGB), MSI extends this capability to a limited number of discrete spectral bands that typically range from 4 to 20. Although MSI provides better spectral discrimination than RGB imaging, it lacks the fine spectral resolution of HSI, which captures hundreds of contiguous bands, enabling detailed material identification. Compared with LiDAR, which excels in 3D structural mapping and elevation modeling, HSI provides richer spectral information that allows for material differentiation, pollution detection, and vegetation health assessment. However, LiDAR surpasses HSI in generating precise topographical and structural data, making it more suitable for applications, such as urban planning and infrastructure assessment. Recent advancements integrate HSI and LiDAR data to enhance urban monitoring, combining spatial precision with spectral depth. One of the key limitations of HSI is its high computational demand and data storage requirements, which can pose challenges to real-time applications, particularly in smart cities where rapid decision-making is essential. By contrast, multispectral and LiDAR technologies offer lower data complexity and faster processing. However, with improvements in AI-driven processing, edge computing, and data fusion techniques, the real-time applicability of HSI is continuously improving, making it an indispensable tool for environmental monitoring, land use classification, and urban sustainability initiatives.

5. Conclusions

HSI holds limitless possibilities for the advancement of smart cities. Its applications in various fields, such as environmental monitoring, urban planning, energy, transportation, and healthcare, underscore its versatility and capacity to address the complex needs of urban environments. Technological advancements in sensor technology, data processing and analysis, and integration with IoT systems further enhance the potential of HSI to provide real-time, actionable insights. Emerging trends such as the integration of AI, ML, DL, cloud computing, edge computing, and IoT with HSI can make HSI more powerful than ever. As cities become smarter, the role of HSI in enhancing sustainability, safety, and efficiency becomes increasingly evident. Despite current limitations, such as high costs and data complexity, emerging trends point toward broader adoption and innovation in the field, and future research and development will likely focus on overcoming these challenges and expanding the scope of HSI applications to make cities smarter. Ultimately, integrating HSI into smart city frameworks will surely create more intelligent, responsive, and sustainable urban systems, helping cities meet their needs and address global challenges. Future research must address real-time data-processing issues by incorporating AI-driven edge computing to improve the efficiency of HSI. Furthermore, progress in sensor downsizing for UAV applications is crucial for enhancing mobility and cost-efficiency. Advanced investigation of DL models for spectrum analysis will improve classification precision. Ultimately, the integration of multimodal sensor fusion that utilizes LiDAR and thermal imaging can enhance HSI’s functionalities, rendering it more efficient for smart city applications and urban surveillance.

Author Contributions

Conceptualization, H.-C.W. and A.M.; data curation, M.A.E.V., J.J. and A.M.; formal analysis, J.J., R.K. and A.M.; funding acquisition, A.M. and H.-C.W.; investigation, J.J., R.K. and A.M.; methodology, J.J., H.-C.W. and A.M.; project administration, A.M. and H.-C.W.; resources, H.-C.W. and A.M.; software, M.A.E.V., J.J. and A.M.; supervision, R.K. and H.-C.W.; validation, J.J. and R.K.; writing—original draft, M.A.E.V., J.J., R.K. and A.M.; writing—review and editing, J.J., R.K., A.M. and H.-C.W. All authors have read and agreed to the published version of the manuscript.

Funding

This research was supported by the National Science and Technology Council, the Republic of China, under the grant NSTC 113-2221-E-194-011-MY3, 113-2634-F-194-001, and the Emerging Technology Application Project of Southern Taiwan Science Park under the grant 113CM-1-02.

Data Availability Statement

Not applicable.

Conflicts of Interest

The authors declare no conflicts of interest.

References

  1. Jiang, S.; Zhang, Z.; Ren, H.; Wei, G.; Xu, M.; Liu, B. Spatiotemporal characteristics of urban land expansion and population growth in Africa from 2001 to 2019: Evidence from population density data. ISPRS Int. J. Geo-Inf. 2021, 10, 584. [Google Scholar] [CrossRef]
  2. Ismagilova, E.; Hughes, L.; Dwivedi, Y.K.; Raman, K.R. Smart cities: Advances in research—An information systems perspective. Int. J. Inf. Manag. 2019, 47, 88–100. [Google Scholar] [CrossRef]
  3. Khan, U.T.; Zia, M.F. Smart city technologies, key components, and its aspects. In Proceedings of the 2021 International Conference on Innovative Computing (ICIC), Lahore, Pakistan, 9–10 November 2021. [Google Scholar]
  4. Kirimtat, A.; Krejcar, O.; Kertesz, A.; Tasgetiren, M.F. Future trends and current state of smart city concepts: A survey. IEEE Access 2020, 8, 86448–86467. [Google Scholar] [CrossRef]
  5. Rani, S.; Mishra, R.K.; Usman, M.; Kataria, A.; Kumar, P.; Bhambri, P. Amalgamation of advanced technologies for sustainable development of smart city environment: A review. IEEE Access 2021, 9, 150060–150087. [Google Scholar] [CrossRef]
  6. Strielkowski, W.; Veinbender, T.; Tvaronavičienė, M.; Lace, N. Economic efficiency and energy security of smart cities. Econ. Res. Ekon. Istraživanja 2020, 33, 788–803. [Google Scholar] [CrossRef]
  7. Porru, S.; Misso, F.E.; Pani, F.E.; Repetto, C. Smart mobility and public transport: Opportunities and challenges in rural and urban areas. J. Traffic Transp. Eng. (Engl. Ed.) 2020, 7, 88–97. [Google Scholar] [CrossRef]
  8. Minopoulos, G.M.; Memos, V.A.; Stergiou, C.L.; Stergiou, K.D.; Plageras, A.P.; Koidou, M.P.; Psannis, K.E. Exploitation of emerging technologies and advanced networks for a smart healthcare system. Appl. Sci. 2022, 12, 5859. [Google Scholar] [CrossRef]
  9. Van Fan, Y.; Lee, C.T.; Lim, J.S.; Klemeš, J.J.; Le, P.T.K. Cross-disciplinary approaches towards smart, resilient and sustainable circular economy. J. Clean. Prod. 2019, 232, 1482–1491. [Google Scholar] [CrossRef]
  10. Kasar, S.; Kshirsagar, M. Open challenges in smart cities: Privacy and security. In Security and Privacy Applications for Smart City Development; Springer: Berlin/Heidelberg, Germany, 2021; pp. 25–36. [Google Scholar]
  11. Ortega, S.; Fabelo, H.; Iakovidis, D.K.; Koulaouzidis, A.; Callico, G.M. Use of hyperspectral/multispectral imaging in gastroenterology. Shedding some–different–light into the dark. J. Clin. Med. 2019, 8, 36. [Google Scholar] [CrossRef]
  12. Halicek, M.; Fabelo, H.; Ortega, S.; Callico, G.M.; Fei, B. In-vivo and ex-vivo tissue analysis through hyperspectral imaging techniques: Revealing the invisible features of cancer. Cancers 2019, 11, 756. [Google Scholar] [CrossRef]
  13. Xu, H.; Ren, J.; Lin, J.; Mao, S.; Xu, Z.; Chen, Z.; Zhao, J.; Wu, Y.; Xu, N.; Wang, P. The impact of high-quality data on the assessment results of visible/near-infrared hyperspectral imaging and development direction in the food fields: A review. J. Food Meas. Charact. 2023, 17, 2988–3004. [Google Scholar] [CrossRef]
  14. Ozdemir, A.; Polat, K. Deep learning applications for hyperspectral imaging: A systematic review. J. Inst. Electron. Comput. 2020, 2, 39–56. [Google Scholar] [CrossRef]
  15. Yoon, J. Hyperspectral imaging for clinical applications. BioChip J. 2022, 16, 1–12. [Google Scholar] [CrossRef]
  16. Zhang, Y.; Wu, X.; He, L.; Meng, C.; Du, S.; Bao, J.; Zheng, Y. Applications of hyperspectral imaging in the detection and diagnosis of solid tumors. Transl. Cancer Res. 2020, 9, 1265. [Google Scholar] [CrossRef]
  17. Fei, B. Hyperspectral imaging in medical applications. Data Handl. Sci. Technol. 2019, 32, 523–565. [Google Scholar]
  18. Aviara, N.A.; Liberty, J.T.; Olatunbosun, O.S.; Shoyombo, H.A.; Oyeniyi, S.K. Potential application of hyperspectral imaging in food grain quality inspection, evaluation and control during bulk storage. J. Agric. Food Res. 2022, 8, 100288. [Google Scholar] [CrossRef]
  19. Ma, J.; Sun, D.-W.; Pu, H.; Cheng, J.-H.; Wei, Q. Advanced techniques for hyperspectral imaging in the food industry: Principles and recent applications. Annu. Rev. Food Sci. Technol. 2019, 10, 197–220. [Google Scholar] [CrossRef]
  20. Xing, F.; Yao, H.; Liu, Y.; Dai, X.; Brown, R.L.; Bhatnagar, D. Recent developments and applications of hyperspectral imaging for rapid detection of mycotoxins and mycotoxigenic fungi in food products. Crit. Rev. Food Sci. Nutr. 2019, 59, 173–180. [Google Scholar] [CrossRef]
  21. Ai, W.; Liu, S.; Liao, H.; Du, J.; Cai, Y.; Liao, C.; Shi, H.; Lin, Y.; Junaid, M.; Yue, X.; et al. Application of hyperspectral imaging technology in the rapid identification of microplastics in farmland soil. Sci. Total Environ. 2022, 807, 151030. [Google Scholar] [CrossRef]
  22. Gasser, C.; González-Cabrera, M.; Ayora-Cañada, M.J.; Domínguez-Vidal, A.; Lendl, B. Comparing mapping and direct hyperspectral imaging in stand-off Raman spectroscopy for remote material identification. J. Raman Spectrosc. 2019, 50, 1034–1043. [Google Scholar] [CrossRef]
  23. Hu, X.; Xie, C.; Fan, Z.; Duan, Q.; Zhang, D.; Jiang, L.; Wei, X.; Hong, D.; Li, G.; Zeng, X.; et al. Hyperspectral anomaly detection using deep learning: A review. Remote Sens. 2022, 14, 1973. [Google Scholar] [CrossRef]
  24. Stuart, M.B.; Davies, M.; Hobbs, M.J.; Pering, T.D.; McGonigle, A.J.S.; Willmott, J.R. High-resolution hyperspectral imaging using low-cost components: Application within environmental monitoring scenarios. Sensors 2022, 22, 4652. [Google Scholar] [CrossRef]
  25. Dong, X.; Jakobi, M.; Wang, S.; Köhler, M.H.; Zhang, X.; Koch, A.W. A review of hyperspectral imaging for nanoscale materials research. Appl. Spectrosc. Rev. 2019, 54, 285–305. [Google Scholar] [CrossRef]
  26. Cucci, C.; Casini, A. Hyperspectral imaging for artworks investigation. Data Handl. Sci. Technol. 2019, 32, 583–604. [Google Scholar]
  27. Krupnik, D.; Khan, S. Close-range, ground-based hyperspectral imaging for mining applications at various scales: Review and case studies. Earth-Sci. Rev. 2019, 198, 102952. [Google Scholar] [CrossRef]
  28. Signoroni, A.; Savardi, M.; Baronio, A.; Benini, S. Deep learning meets hyperspectral image analysis: A multidisciplinary review. J. Imaging 2019, 5, 52. [Google Scholar] [CrossRef]
  29. Chen, J.; Hoek, G. Long-term exposure to PM and all-cause and cause-specific mortality: A systematic review and meta-analysis. Environ. Int. 2020, 143, 105974. [Google Scholar] [CrossRef]
  30. Song, J.; Wang, Y.; Zhang, Q.; Qin, W.; Pan, R.; Yi, W.; Xu, Z.; Cheng, J.; Su, H. Premature mortality attributable to NO2 exposure in cities and the role of built environment: A global analysis. Sci. Total Environ. 2023, 866, 161395. [Google Scholar] [CrossRef]
  31. Naethe, P.; Delaney, M.; Julitta, T. Changes of NOx in urban air detected with monitoring VIS-NIR field spectrometer during the coronavirus pandemic: A case study in Germany. Sci. Total Environ. 2020, 748, 141286. [Google Scholar] [CrossRef]
  32. Xing, C.; Liu, C.; Lin, J.; Tan, W.; Liu, T. VOCs hyperspectral imaging: A new insight into evaluate emissions and the corresponding health risk from industries. J. Hazard. Mater. 2024, 461, 132573. [Google Scholar] [CrossRef]
  33. Noppen, L.; Clarisse, L.; Tack, F.; Ruhtz, T.; Merlaud, A.; Van Damme, M.; Van Roozendael, M.; Schuettemeyer, D.; Coheur, P. Constraining industrial ammonia emissions using hyperspectral infrared imaging. Remote Sens. Environ. 2023, 291, 113559. [Google Scholar] [CrossRef]
  34. Meléndez, J.; Guarnizo, G. Fast quantification of air pollutants by mid-infrared hyperspectral imaging and principal component analysis. Sensors 2021, 21, 2092. [Google Scholar] [CrossRef]
  35. Mukundan, A.; Huang, C.-C.; Men, T.-C.; Lin, F.-C.; Wang, H.-C. Air pollution detection using a novel snap-shot hyperspectral imaging technique. Sensors 2022, 22, 6231. [Google Scholar] [CrossRef] [PubMed]
  36. Qamar, F.; Sharma, M.S.; Dobler, G. The impacts of air quality on vegetation health in dense urban environments: A ground-based hyperspectral imaging approach. Remote Sens. 2022, 14, 3854. [Google Scholar] [CrossRef]
  37. Park, C.; Yu, J.; Park, B.-J.; Wang, L.; Lee, Y.G. Imaging particulate matter exposed pine trees by vehicle exhaust experiment and hyperspectral analysis. Environ. Sci. Pollut. Res. 2023, 30, 2260–2272. [Google Scholar] [CrossRef]
  38. Huang, C.-H.; Chen, W.-T.; Chang, Y.-C.; Wu, K.-T. An Edge and Trustworthy AI UAV System With Self-Adaptivity and Hyperspectral Imaging for Air Quality Monitoring. IEEE Internet Things J. 2024, 11, 32572–32584. [Google Scholar] [CrossRef]
  39. Chen, C.-W.; Tseng, Y.-S.; Mukundan, A.; Wang, H.-C. Air pollution: Sensitive detection of PM2.5 and PM10 concentration using hyperspectral imaging. Appl. Sci. 2021, 11, 4543. [Google Scholar] [CrossRef]
  40. Su, X.; Liu, X.; Motlagh, N.H.; Cao, J.; Su, P.; Pellikka, P.; Liu, Y.; Petäjä, T.; Kulmala, M.; Hui, P.; et al. Intelligent and scalable air quality monitoring with 5G edge. IEEE Internet Comput. 2021, 25, 35–44. [Google Scholar] [CrossRef]
  41. Lin, L.; Yang, H.; Xu, X. Effects of water pollution on human health and disease heterogeneity: A review. Front. Environ. Sci. 2022, 10, 880246. [Google Scholar] [CrossRef]
  42. Sun, X.; Zhang, Y.; Shi, K.; Zhang, Y.; Li, N.; Wang, W.; Huang, X.; Qin, B. Monitoring water quality using proximal remote sensing technology. Sci. Total Environ. 2022, 803, 149805. [Google Scholar] [CrossRef]
  43. Niu, C.; Tan, K.; Jia, X.; Wang, X. Deep learning based regression for optically inactive inland water quality parameter estimation using airborne hyperspectral imagery. Environ. Pollut. 2021, 286, 117534. [Google Scholar] [CrossRef] [PubMed]
  44. Sagan, V.; Peterson, K.T.; Maimaitijiang, M.; Sidike, P.; Sloan, J.; Greeling, B.A.; Maalouf, S.; Adams, C. Monitoring inland water quality using remote sensing: Potential and limitations of spectral indices, bio-optical simulations, machine learning, and cloud computing. Earth-Sci. Rev. 2020, 205, 103187. [Google Scholar] [CrossRef]
  45. Niroumand-Jadidi, M.; Bovolo, F.; Bruzzone, L. Water quality retrieval from PRISMA hyperspectral images: First experience in a turbid lake and comparison with sentinel-2. Remote Sens. 2020, 12, 3984. [Google Scholar] [CrossRef]
  46. Wei, L.; Huang, C.; Wang, Z.; Wang, Z.; Zhou, X.; Cao, L. Monitoring of urban black-odor water based on Nemerow index and gradient boosting decision tree regression using UAV-borne hyperspectral imagery. Remote Sens. 2019, 11, 2402. [Google Scholar] [CrossRef]
  47. Lu, Q.; Si, W.; Wei, L.; Li, Z.; Xia, Z.; Ye, S.; Xia, Y. Retrieval of water quality from UAV-borne hyperspectral imagery: A comparative study of machine learning algorithms. Remote Sens. 2021, 13, 3928. [Google Scholar] [CrossRef]
  48. Liu, H.; Yu, T.; Hu, B.; Hou, X.; Zhang, Z.; Liu, X.; Liu, J.; Wang, X.; Zhong, J.; Tan, Z.; et al. Uav-borne hyperspectral imaging remote sensing system based on acousto-optic tunable filter for water quality monitoring. Remote Sens. 2021, 13, 4069. [Google Scholar] [CrossRef]
  49. Zhang, Y.; Wu, L.; Ren, H.; Deng, L.; Zhang, P. Retrieval of water quality parameters from hyperspectral images using hybrid Bayesian probabilistic neural network. Remote Sens. 2020, 12, 1567. [Google Scholar] [CrossRef]
  50. Zhang, Y.; Wu, L.; Ren, H.; Liu, Y.; Zheng, Y.; Liu, Y.; Dong, J. Mapping water quality parameters in urban rivers from hyperspectral images using a new self-adapting selection of multiple artificial neural networks. Remote Sens. 2020, 12, 336. [Google Scholar] [CrossRef]
  51. Yang, Z.; Gong, C.; Ji, T.; Hu, Y.; Li, L. Water quality retrieval from ZY1-02D hyperspectral imagery in urban water bodies and comparison with sentinel-2. Remote Sens. 2022, 14, 5029. [Google Scholar] [CrossRef]
  52. Sharma, H.B.; Vanapalli, K.R.; Samal, B.; Cheela, V.R.S.; Dubey, B.K.; Bhattacharya, J. Circular economy approach in solid waste management system to achieve UN-SDGs: Solutions for post-COVID recovery. Sci. Total Environ. 2021, 800, 149605. [Google Scholar] [CrossRef]
  53. Aversano, N.; Bonifazi, G.; D’Adamo, I.; Palmieri, R.; Serranti, S.; Simone, A. Circular and sustainable space: Findings from hyperspectral imaging. J. Clean. Prod. 2024, 471, 143386. [Google Scholar] [CrossRef]
  54. Xiao, W.; Yang, J.; Fang, H.; Zhuang, J.; Ku, Y. A robust classification algorithm for separation of construction waste using NIR hyperspectral system. Waste Manag. 2019, 90, 1–9. [Google Scholar] [CrossRef] [PubMed]
  55. Özkan, M.; Özkan, K.; Bekgöz, B.O.; Yorulmaz, Ö.; Günkaya, Z.; Özkan, A.; Banar, M. Implementation of an early warning system with hyperspectral imaging combined with deep learning model for chlorine in refuse derived fuels. Waste Manag. 2022, 142, 111–119. [Google Scholar] [CrossRef] [PubMed]
  56. Bonifazi, G.; Capobianco, G.; Serranti, S. Fast and effective classification of plastic waste by pushbroom hyperspectral sensor coupled with hierarchical modelling and variable selection. Resour. Conserv. Recycl. 2023, 197, 107068. [Google Scholar] [CrossRef]
  57. Bonifazi, G.; Capobianco, G.; Serranti, S. Hyperspectral imaging and hierarchical PLS-DA applied to asbestos recognition in construction and demolition waste. Appl. Sci. 2019, 9, 4587. [Google Scholar] [CrossRef]
  58. Tao, J.; Gu, Y.; Hao, X.; Liang, R.; Wang, B.; Cheng, Z.; Yan, B.; Chen, G. Combination of hyperspectral imaging and machine learning models for fast characterization and classification of municipal solid waste. Resour. Conserv. Recycl. 2023, 188, 106731. [Google Scholar] [CrossRef]
  59. Castro-Díaz, M.; Osmani, M.; Cavalaro, S.; Cacho, Í.; Uria, I.; Needham, P.; Thompson, J.; Parker, B.; Lovato, T. Hyperspectral Imaging Sorting of Refurbishment Plasterboard Waste. Appl. Sci. 2023, 13, 2413. [Google Scholar] [CrossRef]
  60. Kim, G.; Lee, H.; Cho, B.-K.; Baek, I.; Kim, M.S. Quantitative evaluation of food-waste components in organic fertilizer using visible–near-infrared hyperspectral imaging. Appl. Sci. 2021, 11, 8201. [Google Scholar] [CrossRef]
  61. Singh, M.K.; Hait, S.; Thakur, A. Hyperspectral imaging-based classification of post-consumer thermoplastics for plastics recycling using artificial neural network. Process Saf. Environ. Prot. 2023, 179, 593–602. [Google Scholar] [CrossRef]
  62. Mahmoud, A.; El-Sharkawy, Y.H. Instant plastic waste detection on shores using laser-induced fluorescence and associated hyperspectral imaging. Opt. Quantum Electron. 2024, 56, 780. [Google Scholar] [CrossRef]
  63. Karoui, M.S.; Benhalouche, F.Z.; Deville, Y.; Djerriri, K.; Briottet, X.; Houet, T.; Le Bris, A.; Weber, C. Partial linear NMF-based unmixing methods for detection and area estimation of photovoltaic panels in urban hyperspectral remote sensing data. Remote Sens. 2019, 11, 2164. [Google Scholar] [CrossRef]
  64. Ilehag, R.; Schenk, A.; Huang, Y.; Hinz, S. KLUM: An urban VNIR and SWIR spectral library consisting of building materials. Remote Sens. 2019, 11, 2149. [Google Scholar] [CrossRef]
  65. Brabant, C.; Alvarez-Vanhard, E.; Laribi, A.; Morin, G.; Nguyen, K.T.; Thomas, A.; Houet, T. Comparison of hyperspectral techniques for urban tree diversity classification. Remote Sens. 2019, 11, 1269. [Google Scholar] [CrossRef]
  66. Man, Q.; Dong, P. Extraction of urban objects in cloud shadows on the basis of fusion of airborne LiDAR and hyperspectral data. Remote Sens. 2019, 11, 713. [Google Scholar] [CrossRef]
  67. Wang, Y.; Su, H.; Li, M. An improved model based detection of urban impervious surfaces using multiple features extracted from ROSIS-3 hyperspectral images. Remote Sens. 2019, 11, 136. [Google Scholar] [CrossRef]
  68. Degerickx, J.; Hermy, M.; Somers, B. Mapping functional urban green types using high resolution remote sensing data. Sustainability 2020, 12, 2144. [Google Scholar] [CrossRef]
  69. Sun, G.; Jiao, Z.; Zhang, A.; Li, F.; Fu, H.; Li, Z. Hyperspectral image-based vegetation index (HSVI): A new vegetation index for urban ecological research. Int. J. Appl. Earth Obs. Geoinf. 2021, 103, 102529. [Google Scholar] [CrossRef]
  70. Aryal, S.; Chen, Z.; Tang, S. Mobile hyperspectral imaging for material surface damage detection. J. Comput. Civ. Eng. 2021, 35, 04020057. [Google Scholar] [CrossRef]
  71. Lavadiya, D.N.; Sajid, H.U.; Yellavajjala, R.K.; Sun, X. Hyperspectral imaging for the elimination of visual ambiguity in corrosion detection and identification of corrosion sources. Struct. Health Monit. 2022, 21, 1678–1693. [Google Scholar] [CrossRef]
  72. Weber, C.; Briottet, X.; Houet, T.; Gadal, S.; Aguejdad, R.; Deville, Y.; Dalla Mura, M.; Mallet, C.; Le Bris, A.; Karoui, M.S.; et al. Hyperspectral imagery and urban areas: Results of the HYEP project. Rev. Française Photogrammétrie Télédétection 2022, 224, 75–92. [Google Scholar] [CrossRef]
  73. Oladimeji, D.; Gupta, K.; Kose, N.A.; Gundogan, K.; Ge, L.; Liang, F. Smart transportation: An overview of technologies and applications. Sensors 2023, 23, 3880. [Google Scholar] [CrossRef] [PubMed]
  74. Jakubczyk, K.; Siemiątkowska, B.; Więckowski, R.; Rapcewicz, J. Hyperspectral imaging for mobile robot navigation. Sensors 2022, 23, 383. [Google Scholar] [CrossRef]
  75. Taher, J.; Hakala, T.; Jaakkola, A.; Hyyti, H.; Kukko, A.; Manninen, P.; Maanpää, J.; Hyyppä, J. Feasibility of hyperspectral single photon lidar for robust autonomous vehicle perception. Sensors 2022, 22, 5759. [Google Scholar] [CrossRef] [PubMed]
  76. Özdemir, O.B.; Soydan, H.; Yardımcı Çetin, Y.; Düzgün, H.Ş. Neural network based pavement condition assessment with hyperspectral images. Remote Sens. 2020, 12, 3931. [Google Scholar] [CrossRef]
  77. Abdellatif, M.; Peel, H.; Cohn, A.G.; Fuentes, R. Pavement crack detection from hyperspectral images using a novel asphalt crack index. Remote Sens. 2020, 12, 3084. [Google Scholar] [CrossRef]
  78. Lee, G.; Lee, J.; Baek, J.; Kim, H.; Cho, D. Channel sampler in hyperspectral images for vehicle detection. IEEE Geosci. Remote Sens. Lett. 2021, 19, 5509405. [Google Scholar] [CrossRef]
  79. Gutiérrez-Zaballa, J.; Basterretxea, K.; Echanobe, J.; Martínez, M.V.; Martinez-Corral, U.; Mata-Carballeira, Ó.; del Campo, I. On-chip hyperspectral image segmentation with fully convolutional networks for scene understanding in autonomous driving. J. Syst. Archit. 2023, 139, 102878. [Google Scholar] [CrossRef]
  80. Ahmad, T.; Madonski, R.; Zhang, D.; Huang, C.; Mujeeb, A. Data-driven probabilistic machine learning in sustainable smart energy/smart energy systems: Key developments, challenges, and future research opportunities in the context of smart grid paradigm. Renew. Sustain. Energy Rev. 2022, 160, 112128. [Google Scholar] [CrossRef]
  81. Baliyan, A.; Imai, H. Machine learning based analytical framework for automatic hyperspectral Raman analysis of lithium-ion battery electrodes. Sci. Rep. 2019, 9, 18241. [Google Scholar] [CrossRef]
  82. Jörges, C.; Vidal, H.S.; Hank, T.; Bach, H. Detection of solar photovoltaic power plants using satellite and airborne hyperspectral imaging. Remote Sens. 2023, 15, 3403. [Google Scholar] [CrossRef]
  83. Schultz, C.; Fenske, M.; Dion-Bertrand, L.I.; Gélinas, G.; Marcet, S.; Dagar, J.; Bartelt, A.; Schlatmann, R.; Unger, E.; Stegemann, B. Hyperspectral Photoluminescence Imaging for Spatially Resolved Determination of Electrical Parameters of Laser-Patterned Perovskite Solar Cells. Sol. RRL 2023, 7, 2300538. [Google Scholar] [CrossRef]
  84. Attia, E.A.; Mahmoud, A.; Fedawy, M.; El-Sharkawy, Y.H. Instant testing and non-contact diagnosis for photovoltaic cells using K-means clustering and associated hyperspectral imaging. SN Appl. Sci. 2023, 5, 207. [Google Scholar] [CrossRef]
  85. Rizk, P.; Younes, R.; Ilinca, A.; Khoder, J. Wind turbine ice detection using hyperspectral imaging. Remote Sens. Appl. Soc. Environ. 2022, 26, 100711. [Google Scholar] [CrossRef]
  86. Rizk, P.; Younes, R.; Ilinca, A.; Khoder, J. Wind turbine blade defect detection using hyperspectral imaging. Remote Sens. Appl. Soc. Environ. 2021, 22, 100522. [Google Scholar] [CrossRef]
  87. Alshehri, F.; Muhammad, G. A comprehensive survey of the Internet of Things (IoT) and AI-based smart healthcare. IEEE Access 2020, 9, 3660–3678. [Google Scholar] [CrossRef]
  88. Wawerski, A.; Siemiątkowska, B.; Józwik, M.; Fajdek, B.; Partyka, M. Machine Learning Method and Hyperspectral Imaging for Precise Determination of Glucose and Silicon Levels. Sensors 2024, 24, 1306. [Google Scholar] [CrossRef] [PubMed]
  89. Ahn, D.; Choi, J.-Y.; Kim, H.-C.; Cho, J.-S.; Moon, K.-D.; Park, T. Estimating the composition of food nutrients from hyperspectral signals based on deep neural networks. Sensors 2019, 19, 1560. [Google Scholar] [CrossRef]
  90. La Salvia, M.; Torti, E.; Marenzi, E.; Danese, G.; Leporati, F. Edge and cloud computing approaches in the early diagnosis of skin cancer with attention-based vision transformer through hyperspectral imaging. J. Supercomput. 2024, 80, 16368–16392. [Google Scholar] [CrossRef]
  91. Neri, I.; Caponi, S.; Bonacci, F.; Clementi, G.; Cottone, F.; Gammaitoni, L.; Figorilli, S.; Ortenzi, L.; Aisa, S.; Pallottino, F.; et al. Real-Time AI-Assisted Push-Broom Hyperspectral System for Precision Agriculture. Sensors 2024, 24, 344. [Google Scholar] [CrossRef]
  92. Ang, K.L.-M.; Seng, J.K.P. Big data and machine learning with hyperspectral information in agriculture. IEEE Access 2021, 9, 36699–36718. [Google Scholar] [CrossRef]
  93. Abdulridha, J.; Ampatzidis, Y.; Qureshi, J.; Roberts, P. Identification and classification of downy mildew severity stages in watermelon utilizing aerial and ground remote sensing and machine learning. Front. Plant Sci. 2022, 13, 791018. [Google Scholar] [CrossRef]
  94. Ciza, P.H.; Sacre, P.-Y.; Waffo, C.; Coïc, L.; Avohou, H.; Mbinze, J.K.; Ngono, R.; Marini, R.D.; Hubert, P.; Ziemons, E. Comparing the qualitative performances of handheld NIR and Raman spectrophotometers for the detection of falsified pharmaceutical products. Talanta 2019, 202, 469–478. [Google Scholar] [CrossRef] [PubMed]
  95. Phillips, T.; Abdulla, W. A new honey adulteration detection approach using hyperspectral imaging and machine learning. Eur. Food Res. Technol. 2023, 249, 259–272. [Google Scholar] [CrossRef]
  96. Tyagi, P.; Agarwal, K.; Jaiswal, G.; Sharma, A.; Rani, R. Forged document detection and writer identification through unsupervised deep learning approach. Multimed. Tools Appl. 2024, 83, 18459–18478. [Google Scholar] [CrossRef]
  97. Zeng, Z.; Zhang, P.; Qiu, S.; Li, S.; Liu, X. A painting authentication method based on multi-scale spatial-spectral feature fusion and convolutional neural network. Comput. Electr. Eng. 2024, 118, 109315. [Google Scholar] [CrossRef]
  98. He, T.; Wang, S. Multi-spectral remote sensing land-cover classification based on deep learning methods. J. Supercomput. 2021, 77, 2829–2843. [Google Scholar] [CrossRef]
  99. De Castro, A.I.; Shi, Y.; Maja, J.M.; Peña, J.M. UAVs for vegetation monitoring: Overview and recent scientific contributions. Remote Sens. 2021, 13, 2139. [Google Scholar] [CrossRef]
  100. Almeida, C.R.d.; Teodoro, A.C.; Gonçalves, A. Study of the urban heat island (UHI) using remote sensing data/techniques: A systematic review. Environments 2021, 8, 105. [Google Scholar] [CrossRef]
  101. Megahed, Y.; Shaker, A.; Yan, W.Y. Fusion of airborne LiDAR point clouds and aerial images for heterogeneous land-use urban mapping. Remote Sens. 2021, 13, 814. [Google Scholar] [CrossRef]
  102. Kaartinen, E.; Dunphy, K.; Sadhu, A. LiDAR-based structural health monitoring: Applications in civil infrastructure systems. Sensors 2022, 22, 4610. [Google Scholar] [CrossRef]
  103. Cai, X.; Wu, L.; Li, Y.; Lei, S.; Xu, J.; Lyu, H.; Li, J.; Wang, H.; Dong, X.; Zhu, Y.; et al. Remote sensing identification of urban water pollution source types using hyperspectral data. J. Hazard. Mater. 2023, 459, 132080. [Google Scholar] [CrossRef] [PubMed]
  104. Fei, S.; Li, L.; Han, Z.; Chen, Z.; Xiao, Y. Combining novel feature selection strategy and hyperspectral vegetation indices to predict crop yield. Plant Methods 2022, 18, 119. [Google Scholar] [CrossRef] [PubMed]
  105. Kolokoussis, P.; Skamantzari, M.; Tapinaki, S.; Karathanassi, V.; Georgopoulos, A. 3D and hyperspectral data integration for assessing material degradation in medieval masonry heritage buildings. The International Archives of the Photogrammetry. Remote Sens. Spat. Inf. Sci. 2021, 43, 583–590. [Google Scholar]
  106. Sousa, J.J.; Toscano, P.; Matese, A.; Di Gennaro, S.F.; Berton, A.; Gatti, M.; Poni, S.; Pádua, L.; Hruška, J.; Morais, R.; et al. UAV-based hyperspectral monitoring using push-broom and snapshot sensors: A multisite assessment for precision viticulture applications. Sensors 2022, 22, 6574. [Google Scholar] [CrossRef]
  107. Funatomi, T.; Ogawa, T.; Tanaka, K.; Kubo, H.; Caron, G.; Mouaddib, E.M.; Matsushita, Y.; Mukaigawa, Y. Eliminating temporal illumination variations in whisk-broom hyperspectral imaging. Int. J. Comput. Vis. 2022, 130, 1310–1324. [Google Scholar] [CrossRef]
  108. Al-Sarayreh, M.; Reis, M.M.; Yan, W.Q.; Klette, R. Potential of deep learning and snapshot hyperspectral imaging for classification of species in meat. Food Control 2020, 117, 107332. [Google Scholar] [CrossRef]
  109. Zhang, H.; Zhang, B.; Wei, Z.; Wang, C.; Huang, Q. Lightweight integrated solution for a UAV-borne hyperspectral imaging system. Remote Sens. 2020, 12, 657. [Google Scholar] [CrossRef]
  110. Hartling, S.; Sagan, V.; Maimaitijiang, M. Urban tree species classification using UAV-based multi-sensor data fusion and machine learning. GIScience Remote Sens. 2021, 58, 1250–1275. [Google Scholar] [CrossRef]
  111. Kahraman, S.; Bacher, R. A comprehensive review of hyperspectral data fusion with lidar and sar data. Annu. Rev. Control 2021, 51, 236–253. [Google Scholar] [CrossRef]
  112. Altamimi, A.; Youssef, B.B. A systematic review of hardware-accelerated compression of remotely sensed hyperspectral images. Sensors 2021, 22, 263. [Google Scholar] [CrossRef]
  113. Du, Q.; Tang, B.; Xie, W.; Li, W. Parallel and distributed computing for anomaly detection from hyperspectral remote sensing imagery. Proc. IEEE 2021, 109, 1306–1319. [Google Scholar] [CrossRef]
  114. Caba, J.; Díaz, M.; Barba, J.; Guerra, R.; Escolar, S.; López, S. Low-power hyperspectral anomaly detector implementation in cost-optimized FPGA devices. IEEE J. Sel. Top. Appl. Earth Obs. Remote Sens. 2022, 15, 2379–2393. [Google Scholar] [CrossRef]
  115. Gyaneshwar, D.; Nidamanuri, R.R. A real-time FPGA accelerated stream processing for hyperspectral image classification. Geocarto Int. 2022, 37, 52–69. [Google Scholar] [CrossRef]
  116. ElManawy, A.I.; Sun, D.; Abdalla, A.; Zhu, Y.; Cen, H. HSI-PP: A flexible open-source software for hyperspectral imaging-based plant phenotyping. Comput. Electron. Agric. 2022, 200, 107248. [Google Scholar] [CrossRef]
  117. Dash, S.; Chakravarty, S.; Giri, N.C.; Agyekum, E.B.; AboRas, K.M. Minimum Noise Fraction and Long Short-Term Memory Model for Hyperspectral Imaging. Int. J. Comput. Intell. Syst. 2024, 17, 16. [Google Scholar] [CrossRef]
  118. Fan, R.; Feng, R.; Wang, L.; Yan, J.; Zhang, X. Semi-MCNN: A semisupervised multi-CNN ensemble learning method for urban land cover classification using submeter HRRS images. IEEE J. Sel. Top. Appl. Earth Obs. Remote Sens. 2020, 13, 4973–4987. [Google Scholar] [CrossRef]
  119. Kuras, A.; Brell, M.; Rizzi, J.; Burud, I. Hyperspectral and lidar data applied to the urban land cover machine learning and neural-network-based classification: A review. Remote Sens. 2021, 13, 3393. [Google Scholar] [CrossRef]
  120. Bhat, S.A.; Huang, N.-F. Big data and ai revolution in precision agriculture: Survey and challenges. IEEE Access 2021, 9, 110209–110222. [Google Scholar] [CrossRef]
  121. Borol, Y.D.; Thilagham, K.T.; Nagpal, A.; Harika, A.; Aravinda, K.; Shnawa, A.H. Hyperspectral Information with Big Data and Machine Learning for Agriculture. In Proceedings of the 2024 4th International Conference on Innovative Practices in Technology and Management (ICIPTM), Noida, India, 21–23 February 2024. [Google Scholar]
  122. Jaiswal, G.; Rani, R.; Mangotra, H.; Sharma, A. Integration of hyperspectral imaging and autoencoders: Benefits, applications, hyperparameter tunning and challenges. Comput. Sci. Rev. 2023, 50, 100584. [Google Scholar] [CrossRef]
  123. Haut, J.M.; Moreno-Alvarez, S.; Pastor-Vargas, R.; Perez-Garcia, A.; Paoletti, M.E. Cloud-Based Analysis of Large-Scale Hyperspectral Imagery for Oil Spill Detection. IEEE J. Sel. Top. Appl. Earth Obs. Remote Sens. 2023, 17, 2461–2474. [Google Scholar] [CrossRef]
  124. Qi, B. Hyperspectral image database query based on big data analysis technology. E3S Web Conf. 2021, 275, 03018. [Google Scholar] [CrossRef]
  125. Ang, L.-M.; Seng, K.P. Meta-scalable discriminate analytics for Big hyperspectral data and applications. Expert Syst. Appl. 2021, 176, 114777. [Google Scholar] [CrossRef]
  126. Bindhu, V.; Ranganathan, G. Hyperspectral image processing in internet of things model using clustering algorithm. J. ISMAC 2021, 3, 163–175. [Google Scholar]
  127. Lv, N.; Han, Z.; Chen, C.; Feng, Y.; Su, T.; Goudos, S.; Wan, S. Encoding Spectral-Spatial Features for Hyperspectral Image Classification in the Satellite Internet of Things System. Remote Sens. 2021, 13, 3561. [Google Scholar] [CrossRef]
  128. Guo, Y.; Yu, Q.; Gao, Y.; Liu, X.; Li, C. Max–min distance embedding for unsupervised hyperspectral image classification in the satellite Internet of Things system. Internet Things 2023, 22, 100775. [Google Scholar] [CrossRef]
  129. Chen, H.; Ru, J.; Long, H.; He, J.; Chen, T.; Deng, W. Semi-Supervised Adaptive Pseudo-Label Feature Learning for Hyperspectral Image Classification in Internet of Things. IEEE Internet Things J. 2024, 11, 30754–30768. [Google Scholar] [CrossRef]
  130. Sharma, M.; Biswas, M. A deep learning-based intelligent decision support system for hyperspectral image classification using manifold batch structure in internet of things (IoT). Wirel. Pers. Commun. 2022, 126, 2119–2147. [Google Scholar] [CrossRef]
  131. Elkholy, M.M.; Mostafa, M.; Ebeid, H.M.; Tolba, M.F. Application of hyperspectral image unmixing for internet of things. In Internet of Things—Applications and Future, Proceedings of the ITAF 2019, Cairo, Egypt, 14–15 October 2019; Springer: Berlin/Heidelberg, Germany, 2020; pp. 249–260. [Google Scholar]
  132. Boursianis, A.D.; Papadopoulou, M.S.; Diamantoulakis, P.; Liopa-Tsakalidi, A.; Barouchas, P.; Salahas, G.; Karagiannidis, G.; Wan, S.; Goudos, S.K. Internet of things (IoT) and agricultural unmanned aerial vehicles (UAVs) in smart farming: A comprehensive review. Internet Things 2022, 18, 100187. [Google Scholar] [CrossRef]
  133. Crépon, K.; Cabacos, M.; Bonduelle, F.; Ammari, F.; Faure, M.; Maudemain, S. Using Internet of Things (IoT), Near-Infrared Spectroscopy (NIRS), and Hyperspectral Imaging (HSI) to Enhance Monitoring and Detection of Grain Pests in Storage and Handling Operators. Agriculture 2023, 13, 1355. [Google Scholar] [CrossRef]
  134. Augustin, A.; Kiliroor, C.C. IoT-based pesticide detection in fruits and vegetables using hyperspectral imaging and deep learning. In Proceedings of the International Conference on Cognitive Computing and Cyber Physical Systems 2023, Bhimavaram, India, 4–6 August 2023; Springer: Berlin/Heidelberg, Germany, 2023. [Google Scholar]
  135. Orchi, H.; Sadik, M.; Khaldoun, M. On using artificial intelligence and the internet of things for crop disease detection: A contemporary survey. Agriculture 2021, 12, 9. [Google Scholar] [CrossRef]
  136. Kour, V.P.; Arora, S. Recent developments of the internet of things in agriculture: A survey. IEEE Access 2020, 8, 129924–129957. [Google Scholar] [CrossRef]
  137. Gao, P.; Zhang, H.; Yu, J.; Lin, J.; Wang, X.; Yang, M.; Kong, F. Secure cloud-aided object recognition on hyperspectral remote sensing images. IEEE Internet Things J. 2020, 8, 3287–3299. [Google Scholar] [CrossRef]
  138. Khonina, S.N.; Kazanskiy, N.L.; Oseledets, I.V.; Nikonorov, A.V.; Butt, M.A. Synergy between Artificial Intelligence and Hyperspectral Imagining—A Review. Technologies 2024, 12, 163. [Google Scholar] [CrossRef]
  139. Jaiswal, G.; Sharma, A.; Yadav, S.K. Critical insights into modern hyperspectral image applications through deep learning. Wiley Interdiscip. Rev. Data Min. Knowl. Discov. 2021, 11, e1426. [Google Scholar] [CrossRef]
  140. Khan, U.; Paheding, S.; Elkin, C.P.; Devabhaktuni, V.K. Trends in deep learning for medical hyperspectral image analysis. IEEE Access 2021, 9, 79534–79548. [Google Scholar] [CrossRef]
  141. Wu, Z.; Sun, J.; Zhang, Y.; Zhu, Y.; Li, J.; Plaza, A.; Benediktsson, J.A.; Wei, Z. Scheduling-guided automatic processing of massive hyperspectral image classification on cloud computing architectures. IEEE Trans. Cybern. 2020, 51, 3588–3601. [Google Scholar] [CrossRef]
  142. Atitallah, S.B.; Driss, M.; Boulila, W.; Ben Ghézala, H. Leveraging Deep Learning and IoT big data analytics to support the smart cities development: Review and future directions. Comput. Sci. Rev. 2020, 38, 100303. [Google Scholar] [CrossRef]
  143. Osco, L.P.; Marcato Junior, J.; Marques Ramos, A.P.; de Castro Jorge, L.A.; Fatholahi, S.N.; de Andrade Silva, J.; Matsubara, E.T.; Pistori, H.; Nunes Gonçalves, W.; Li, J. A review on deep learning in UAV remote sensing. Int. J. Appl. Earth Obs. Geoinf. 2021, 102, 102456. [Google Scholar] [CrossRef]
  144. Rodrigues, E.M.; Hemmer, E. Trends in hyperspectral imaging: From environmental and health sensing to structure-property and nano-bio interaction studies. Anal. Bioanal. Chem. 2022, 414, 4269–4279. [Google Scholar] [CrossRef] [PubMed]
  145. Roberts, J.; Power, A.; Chapman, J.; Chandra, S.; Cozzolino, D. A short update on the advantages, applications and limitations of hyperspectral and chemical imaging in food authentication. Appl. Sci. 2018, 8, 505. [Google Scholar] [CrossRef]
  146. Ali, U.M.E.; Hossain, M.A.; Islam, M.R. Analysis of PCA based feature extraction methods for classification of hyperspectral image. In Proceedings of the 2019 2nd International Conference on Innovation in Engineering and Technology (ICIET), Dhaka, Bangladesh, 23–24 December 2019. [Google Scholar]
  147. Lu, B.; Dao, P.D.; Liu, J.; He, Y.; Shang, J. Recent advances of hyperspectral imaging technology and applications in agriculture. Remote Sens. 2020, 12, 2659. [Google Scholar] [CrossRef]
  148. He, D.; Shi, Q.; Liu, X.; Zhong, Y.; Zhang, X. Deep Subpixel Mapping Based on Semantic Information Modulated Network for Urban Land Use Mapping. IEEE Trans. Geosci. Remote Sens. 2021, 59, 10628–10646. [Google Scholar] [CrossRef]
  149. Botero-Valencia, J.; Valencia-Aguirre, J. Portable low-cost IoT hyperspectral acquisition device for indoor/outdoor applications. HardwareX 2021, 10, e00216. [Google Scholar] [CrossRef] [PubMed]
  150. Jia, W.; van Ruth, S.; Scollan, N.; Koidis, A. Hyperspectral Imaging (HSI) for meat quality evaluation across the supply chain: Current and future trends. Curr. Res. Food Sci. 2022, 5, 1017–1027. [Google Scholar] [CrossRef]
  151. Mangalraj, P.; Cho, B.-K. Recent trends and advances in hyperspectral imaging techniques to estimate solar induced fluorescence for plant phenotyping. Ecol. Indic. 2022, 137, 108721. [Google Scholar] [CrossRef]
Figure 1. Applications of HSI across a smart city.
Smartcities 08 00051 g001
Figure 2. Summary of studies on the use of HSI in air quality monitoring [31,32,33,34,35,36,37,38,39,40].
Smartcities 08 00051 g002
Figure 3. Summary of studies on the use of HSI in water quality monitoring [42,43,44,45,46,47,48,49,50,51].
Smartcities 08 00051 g003
Figure 4. Summary of studies on the use of HSI in waste management [53,54,55,56,57,58,59,60,61,62].
Smartcities 08 00051 g004
Figure 5. Summary of studies on the use of HSI in urban planning and management [63,64,65,66,67,68,69,70,71,72].
Smartcities 08 00051 g005
Figure 6. Hismary of studies on the use of HSI in smart transportation [74,75,76,77,78,79].
Smartcities 08 00051 g006
Figure 7. Summary of studies on the use of HSI in smart energy [81,82,83,84,85,86].
Smartcities 08 00051 g007
Figure 8. Summary of studies on the use of HSI in other fields (agriculture, healthcare, and counterfeit detection) [88,89,90,91,92,93,94,95,96,97].
Smartcities 08 00051 g008
Disclaimer/Publisher’s Note: The statements, opinions and data contained in all publications are solely those of the individual author(s) and contributor(s) and not of MDPI and/or the editor(s). MDPI and/or the editor(s) disclaim responsibility for any injury to people or property resulting from any ideas, methods, instructions or products referred to in the content.

