
Evolutionary Cost Analysis and Computational Intelligence for Energy Efficiency in Internet of Things-Enabled Smart Cities: Multi-Sensor Data Fusion and Resilience to Link and Device Failures
Abstract
Highlights
- Proposed a novel energy-efficient IoT protocol that leverages advanced data fusion grouping, designed to minimize redundant data transmissions and optimize network efficiency.
- Introduced a data fusion sensor head that is selected via a novel MPA fitness function, which is parameterized by key factors such as energy consumption, building occlusions, rotation frequency, proximity to IoT sensors within the data fusion group, and distance to the sink node, while the primary data fusion sensor relay incorporates an innovative relay cost function for enhanced performance.
- Demonstrated superior performance across critical metrics, including network lifespan, energy consumption, throughput, and average delay, surpassing recent approaches in the field.
- Ensured resilience to link and device failures, making the protocol highly suitable for both smart cities and large-scale IoT applications.
Abstract
1. Introduction
1.1. Problem Statement and Motivation
1.2. Research Gaps, Our Methodology, and Contributions
- The introduction of a pioneering adaptive and dynamic DFG division methodology based on a hexagonal structure. The division process dynamically adjusts in response to the presence and distribution of SNs within the network vicinity. This approach ensures optimal coverage, balanced node participation, and efficient scalability, aligning the DFGs framework with the growth and distribution patterns of IoT SNs.
- The proposal of a high-efficiency DFG mechanism that continuously adapts to varying network densities. The groups dynamically evolve in response to real-time network conditions, optimizing resource utilization and balancing workloads. This adaptive framework enhances the responsiveness of the network while maintaining low latency and robust operational efficiency.
- For DFGs, there is an implementation of an innovative method for selecting the optimal PDFH, First Secondary DFH (FSDFH), and Second SDFH (SSDFH) for each DFG utilizing the MPA. This approach incorporates highly effective and complex criteria for DFFF, such as the SNs’ distance from the sink node, their RE, and the average distance between DFGMs, ASBO, and PDFH rotation times, effectively preserving SNs’ energy and prolonging the network’s lifespan.
- The implementation of a novel parameter, namely ASBO, where, to the best of our knowledge, we are the first researchers who have introduced and implemented this factor in-depth in the DFFF and RDFCF. The exact definition of ASBO is demonstrated in Section 5.2.2.
- For relaying, the proposed protocol utilizes innovative RDFCF to select a Primary Data Fusion Relay (PDFR), First Secondary DFR (FSDFR), and Second SDFR (SSDFR) based on the candidate PDFR’s RE, its distance from the sink node, PDFH, and ASBO in order to select optimal PDFRs, particularly those situated at significant distances from the sink node, thereby conserving PDFHs’ energy with demonstrated efficiency.
- The optimization and management of resource utilization and data redundancy reduction by applying data fusion techniques for device/link failures and recovery, data redundancy, and building occlusion. In particular, we analyze the issue of data redundancy among relatively close SNs, and in light of this, we provide an efficient data fusion management approach that guarantees a coherent and efficient protocol. Specialist recovery techniques are also employed to address device and link failures, consolidating the protocol and enhancing its overall performance. We also examine the effects of building occlusions at various elevations and appropriate mitigation strategies.
- The illustration of the PDFH, FSDFH, and SSDFH selection processes employing MPA within the proposed protocol through a detailed and comprehensible example, enhancing readers’ understanding and proficiency in this aspect.
- The comprehensive performance evaluation of the proposed protocol through an extensive series of simulations, considering key network performance evaluation metrics including network lifespan, energy consumption, throughput, and average delay. Comprehensive comparisons with existing protocols demonstrate the effectiveness of the proposed protocol without and with multi-hop routing.
2. Related Works
3. Fundamentals of Marine Predators Algorithm and Its Practical Applications
3.1. The MPA’s Population Initialization
3.2. and Matrices Construction and Fitness Evaluation
3.3. The MPA’s Optimization Process
3.3.1. Phase 1: Exploration Phase
3.3.2. Phase 2: Transition Phase Between the Exploration and Exploitation Phases
3.3.3. Phase 3: Exploitation Phase
3.4. Eddy Formation and Fish Aggregating Devices’ Effect
3.5. Marine’s Memory Saving
4. System Model
4.1. Protocol’s Assumptions
- Every network area size is customized to reflect a particular IoT application.
- There is an abundance of IoT SNs distributed throughout a rectangular geographic area positioned at random, with one the sink node within the IoT network.
- The sink node is positioned outside the physical boundaries of the network and possesses boundless energy. Furthermore, by broadcasting, the sink node can distribute messages to every SN in the network sensory area.
- Each IoT SN and the sink node have unique IDs and are stationary.
- All SNs have finite energy capacity and are isomorphic. This means that they have the same amount of beginning energy and the same processing capacity.
- Every SN is equipped with GPS and knows not only the coordinates of the sink node but also those of other SNs.
- SNs die when their energy runs out completely.
- SNs may regulate their power at which they transmit data according to how close they are to the receiver.
- SNs are allotted specific transmission slots for data fusion purposes, and within these TSs, SNs always have data to communicate, since our protocol is data-driven (i.e., having continuous data to send), not event-driven.
- The distance between the source and the receiver can be estimated based on the received signal strength.
4.2. Energy Consumption Model
4.3. Network Model
5. The Proposed Protocol
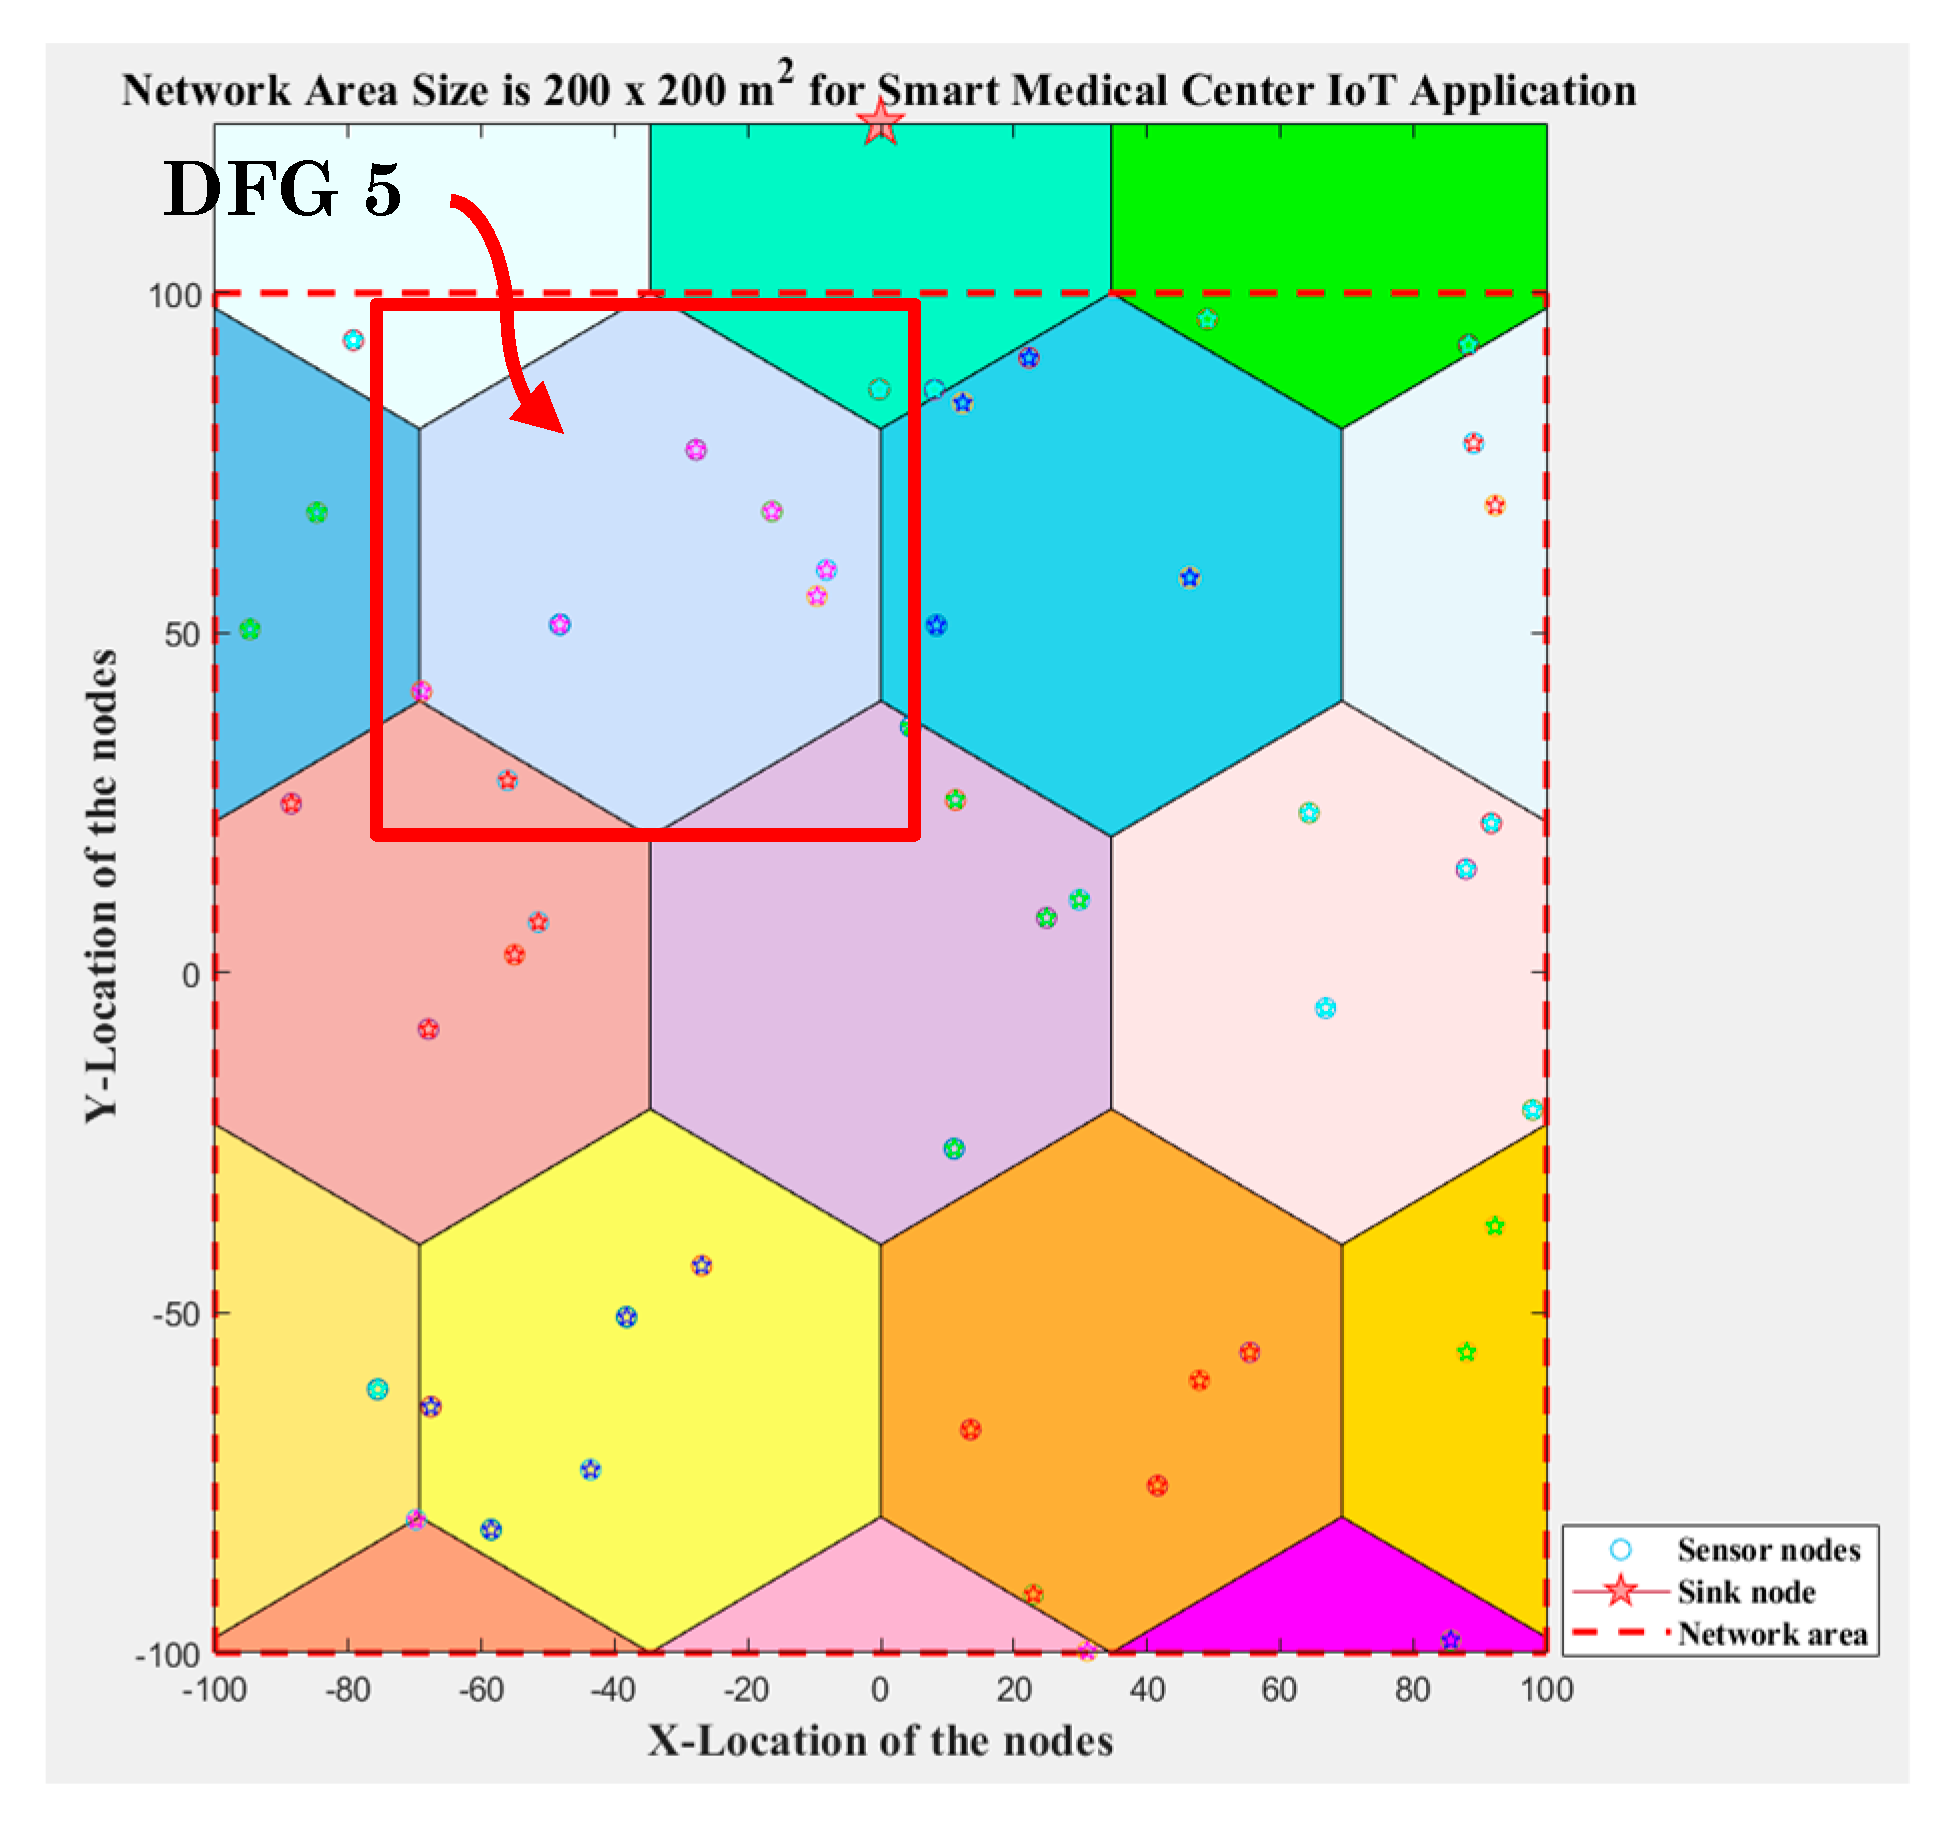
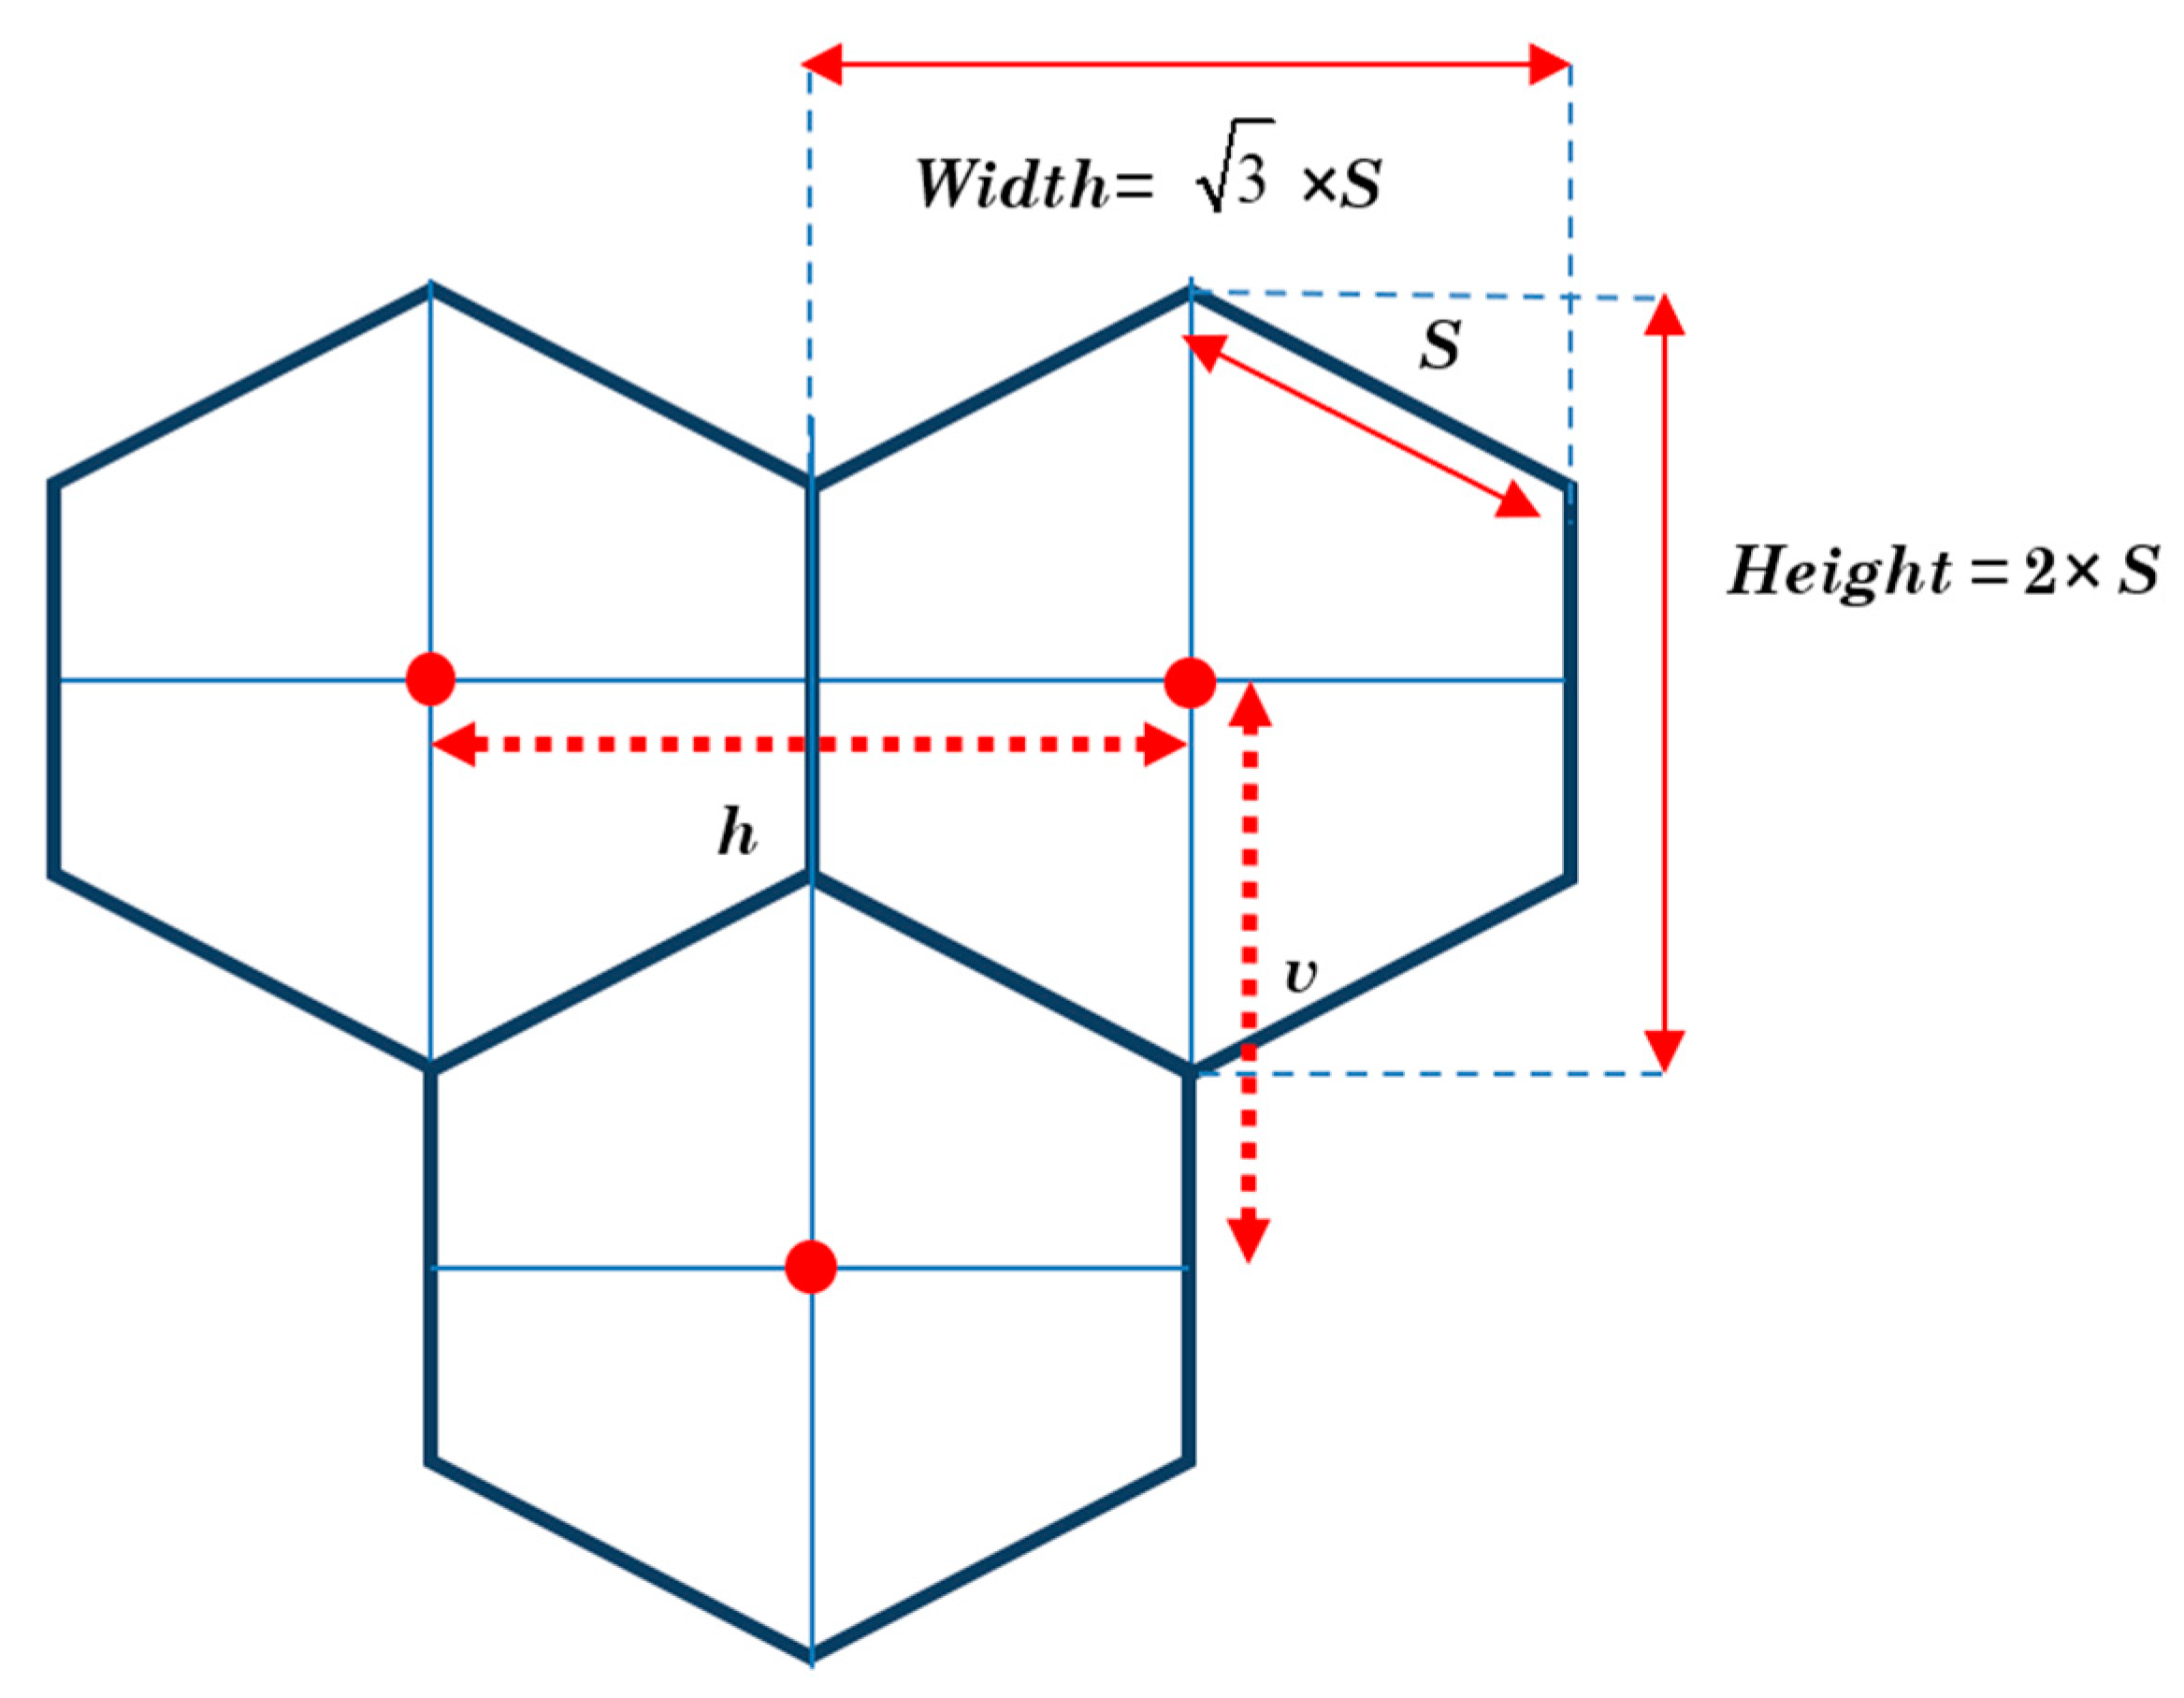
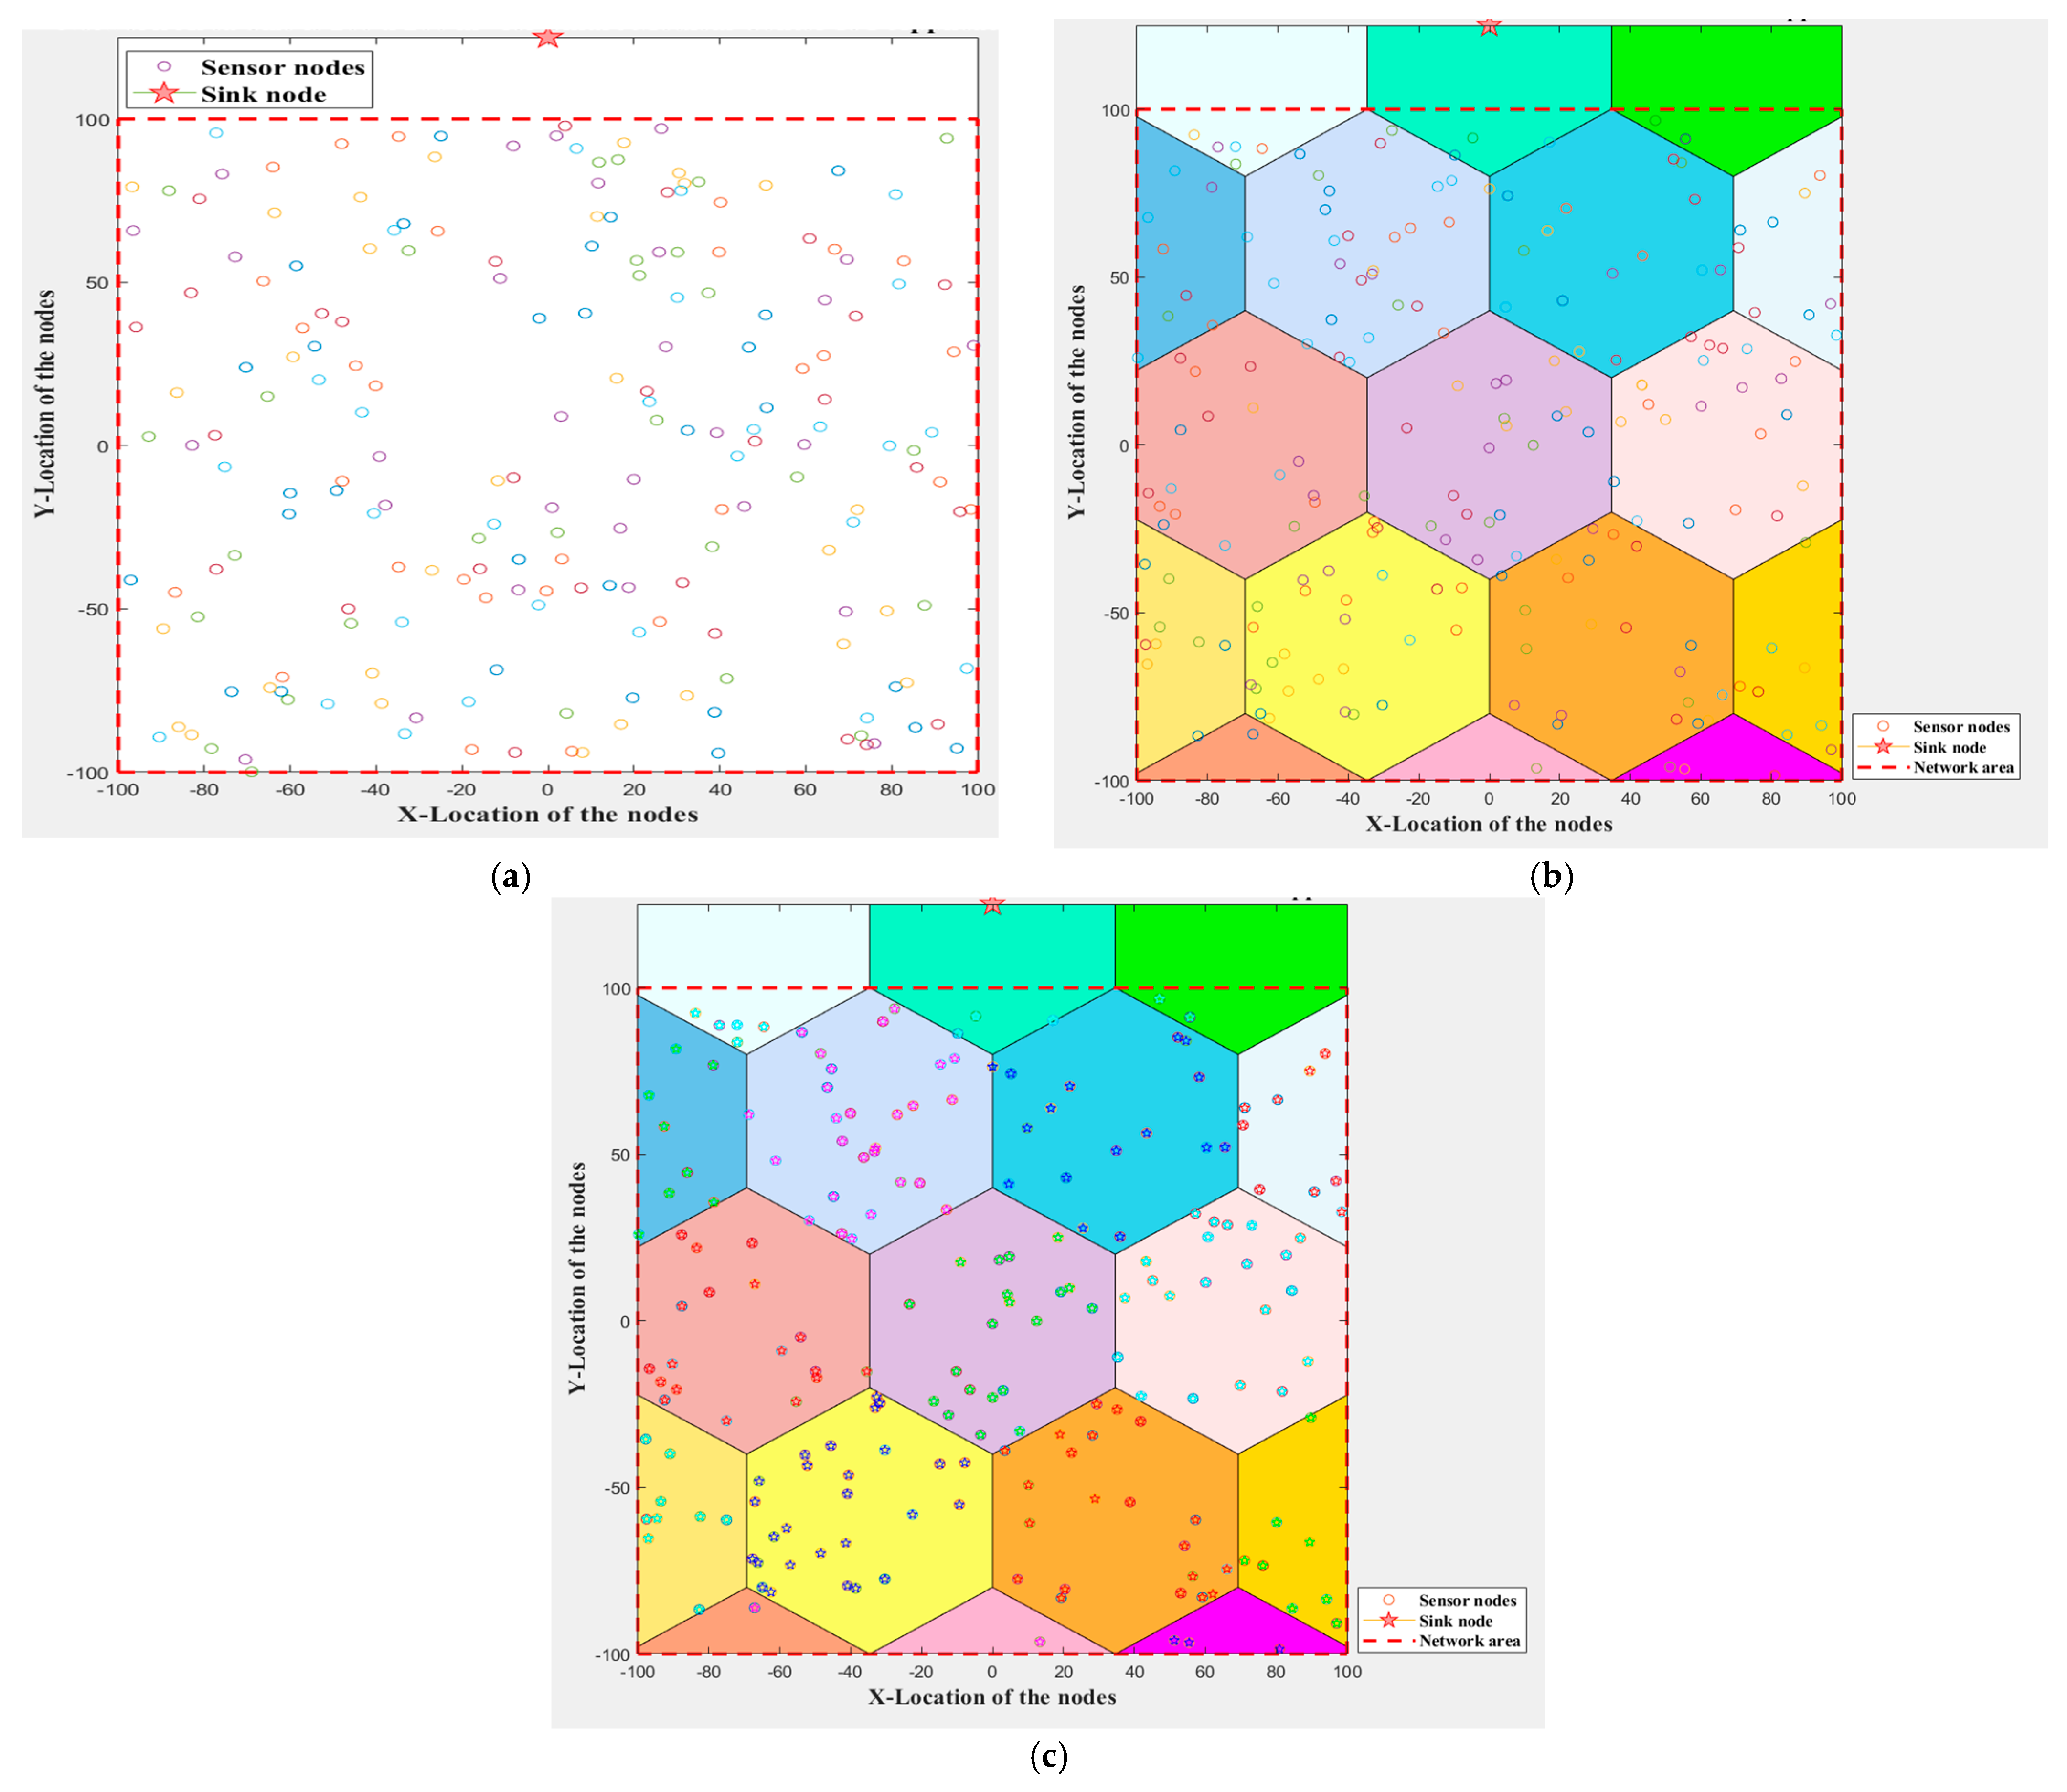
5.1. Network Area Division (DFGs Division)
| Algorithm 1. DFGs formation (setup phase) for the proposed protocol. |
 |
5.2. PDFH and SDFH Selection Utilizing the MPA
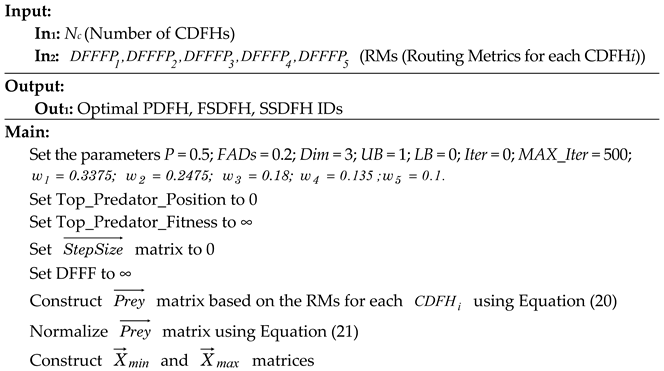
5.2.1. The Initialization Phase
- (a)
- Number of search agents (SAs): This parameter represents the number of DFGMS within a certain DFG eligible to participate in the DFH selection process (Nc).
- (b)
- Dimension (Dim): This parameter defines the number of RMs utilized in our research; its specific value is set at 5.
- (c)
- Maximum number of iterations (Max_Iter): This parameter involves iteratively running the algorithm to determine the most appropriate DFH node. In our proposed protocol, Max_Iter is defined as 500.
- (d)
- Lower and upper and bounds (LB and UB): The LB and UB are set to 0 and 1, respectively. Specifically, our proposed protocol utilizes a normalization technique to define these boundaries at 0 and 1. This choice arises from the lack of precise information regarding the UB and LB of the three RMs employed in our study. To ensure equal treatment and establish uniformity among these metrics, we opted for normalization. As a result, all values are confined within the standardized range of [0, 1].
- (e)
- Positions: This parameter comprises an array of IDs corresponding to the DFGMs located within a DFG, utilized to identify the optimal DFH’s ID.
- (f)
- Main parameters of MPA: The authors in [43] have defined these parameters (i.e., FADs and P), which have the values of 0.2 and 0.5, respectively. Interestingly, these values are retained and unchanged in our study. The following are the initial values that will be subject to updates in subsequent phases.
- (g)
- matrix generation: This matrix is the initial solution for the MPA. A DFG is thought to have a list of DFGMs, each of which is expected to be a Candidate DFH (CDFH) and it is identified as CDFH = [CDFH1, CDFH2, …, CDFHNc], where Nc represents the number of rows in matrix. On the other hand, each DFGM has five RMs, which indicate the number of columns for the matrix and can be written as RM = [RM1, RM2, RM3, RM4, RM5], where RM1 refers to the distance between a CDFHi and the sink (), RM2 denotes for the ratio of the initial energy to the current RE of a CDFHi , RM3 is the average distance between DFGMs (), RM4 stands for the ratio of the average number of times (either rounds or batches) that all IoT SNs have become DFHs (i.e., assigned the DFH role) to the number of times (either rounds or batches) CDFHi played this role , and RM5 represents . The exact definitions of these RMs will be thoroughly discussed later, as shown in Equation (20).
5.2.2. The Iterative Phase
- DFFF parameters definitions
- (1)
- The ratio of CDFHj’s initial energy (Eo) to its current RE () : This metric represents the amount of energy left in the DFGMs after they have been in operation. When choosing a DFH, this is the most important parameter to take into account. Due to its collection, aggregation, and transmission of DFGMs data to the sink node, DFH uses a disproportionate amount of energy as compared to other SNs. The DFFF Parameter () is a representation of this parameter, and it should be minimized. Also, as a result of the normalizing procedure, its value falls between 0 and 1, as shown in Equation (22). This parameter guarantees that a CDFHj with more RE is selected to be a DFH.
- (2)
- Distance of the CDFHj to the sink node (): This parameter is symbolized by and it needs to be reduced to shorten the transmission’s overall distance. Equation (21) illustrates how the normalization process triggers its value to be from 0 to 1.
- (3)
- Average distance between DFGMs (): This parameter is the measure of how centered a CDFHj is in relation to all of its neighbors (DFGMs). This is an essential first step towards reducing intra-DFG communication costs. DFGMs use less energy to transfer data to DFHs if DFHs have lower values. Therefore, is denoted by . Moreover, this function should be minimized. Additionally, the distance between CDFHj and its neighbor CDFHj is determined using Euclidean distance, as demonstrated in Equation (25).
- (4)
- : This parameter refers to the ratio of the number of times (either rounds or batches) that the current CDFHj played the DFH role to the average number of times (either rounds or batches) that all DFGMs have become DFHs (i.e., assigned the DFH role). Therefore, , which also known as can be expressed as follows:where refers to the number of times (either rounds or batches) that a CDFH k is assigned the DFH role.
- (5)
- Average scale for buildings occlusions (): ASBO refers to an estimation that represents the extent to which buildings obstruct visibility or line-of-sight in a given area. This scale can be used to assess factors like sunlight exposure, view obstruction, and even the impact on wireless signal propagation. ASBO is typically calculated by analyzing how much of a particular area or viewpoint is blocked by surrounding buildings. This parameter exemplifies a CDFHj position (height) to the height of buildings around a PDFH as shown in Table 4 and Figure 8. As a result, , which also stands for , can be defined as follows:where signifies the scale for building occlusions for each CDFHj, and Nb is assigned to the number of buildings that may occlude CDFHj within the coverage area. To elaborate more on this, Table 5, Table 6 and Table 7 represent the interpretations for the scale. In essence, the scale preference indicates that lower is better.
- DFFF estimation:
| Algorithm 2. PDFH, FSDFH, and SSDFH selection using the MPA in the proposed protocol. |
  |
5.2.3. Optimizing Data Fusion Regrouping (PDFH Reselection) Procedure
| Algorithm 3. PDFH selection and reselection procedures for the proposed protocol. |
  |
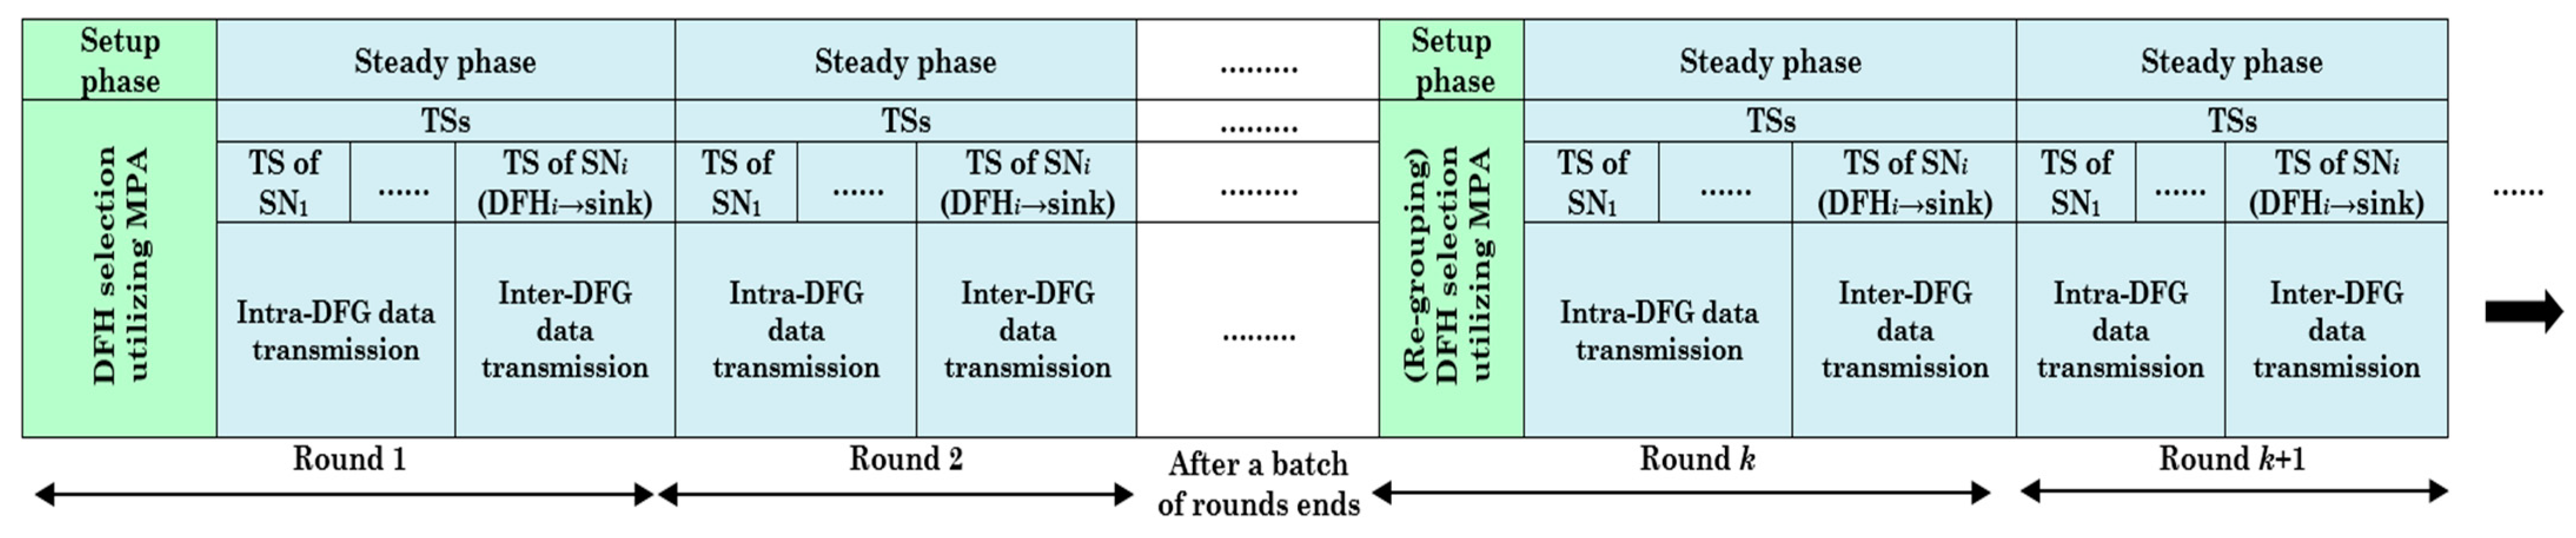
5.3. Mastering Data Fusion Communications: Efficient Scheduling and Transmission over Intra- and Inter-DFG
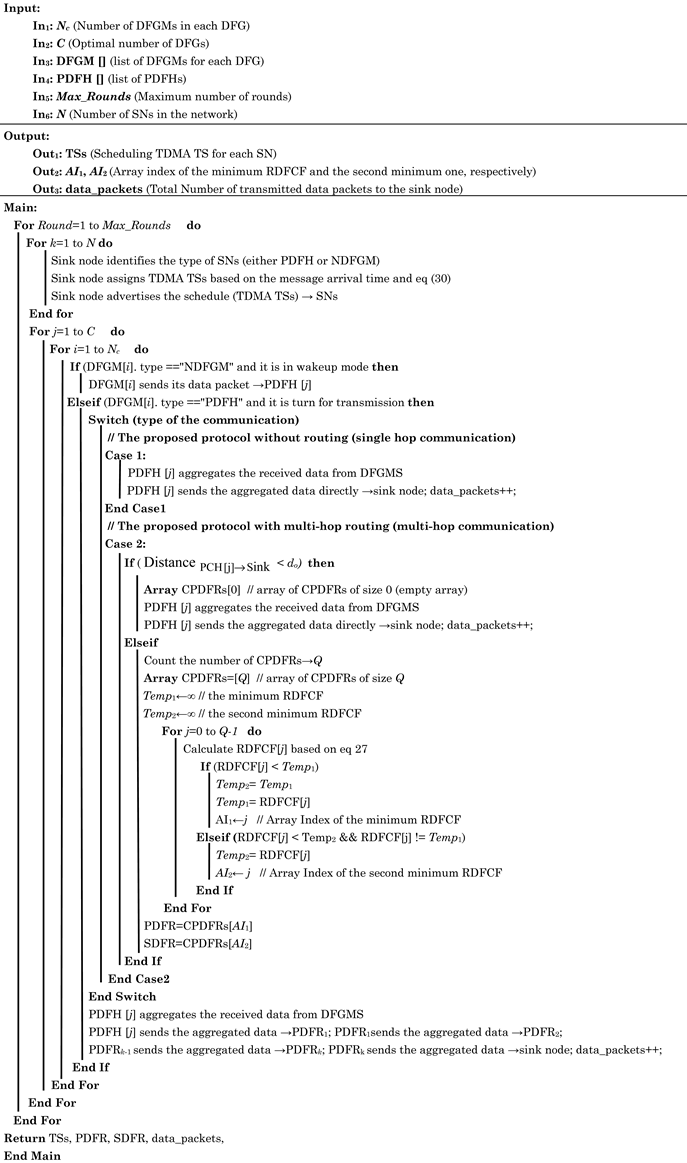
5.4. Transmission Through Multiple Hops Using an Innovative Relay Data Fusion Cost Function for Improving Routing Technique
| Algorithm 4. Scheduling and data transmission for the proposed protocol. |
 |
5.5. Communication Overhead of the Proposed Protocol
- The first round, which involves both setup and steady-state phases, proceeds as follows:
- ✓
- Setup phase:
- 1.
- The sink node sends a request information message to each SN. Thus, the energy dissipated by each SN to receive the request information message is as follows:where represents the length of control message.
- 2.
- The energy dissipated by each SN in order to send their information message to the sink node.
- 3.
- The energy dissipated by each SN to receive the sink table message.
- ✓
- Steady-state phase:
- 1.
- The energy dissipated by SNs, within a DFG, to send their data to a PDFH.where represents the length of data message.
- 2.
- The energy dissipated by a PDFH to receive the data from DFGMs, aggregate all the data, including PDFH, and then send them back to the sink node.
- 3.
- In the subsequent rounds, if the energy of a PDFH is higher than the energy of its DFG, only the steady-state phase is in effect. However, if the energy of a PDFH falls below a DFG’s average energy, regrouping is initiated. During regrouping, the sink node retains information about the SNs’ locations but lacks real-time data on their current energy levels. The sources of energy dissipation in this scenario include the following:
- i.
- The energy dissipated by all PDFHs to send disjoin messages to the sink node.
- ii.
- The energy dissipated by a PDFH to send disjoin messages to SNs.
- iii.
- The energy dissipated by SNs to receive disjoin messages from a PDFH.
5.6. Dealing with Data Fusion Impairments: More Optimized Data Fusion Techniques Including Building Occlusion Management, Devices/Links Failures and Recovery, Device Deployment Redundancy, Redundant Coverage, and Data Redundancy
5.6.1. Data Fusion Management in Building Occlusion Impairment
5.6.2. Optimized Data Fusion in Devices/Links Failures and Recovery
- For a NDFGM: According to our proposed approach, DFGMs communicate with their PDFHs, FSDFHs, and SSDFHs on a regular basis regarding their health check messages. When a DFGM fails to transmit a data message during TS, or when PDFH receives information about abnormal parameters from DFGM via the health status information added to its data message, PDFH will provide a new, updated TDMA schedule that will undoubtedly omit the failing DFGM.
- For a PDFH: The proposed protocol requires that a PDFH includes its health status information in its data message, which it then delivers to both its FSDFH, SSDFH, and the sink node. As was previously indicated, both FSDFH and SSDFH stay in active mode and keep an eye on the data messages that PDFH sends to the sink node. When at least (1.15 × RT) of the anticipated time to receive data from PDFH passes without any transmission, or when abnormal parameters, particularly internal transmit/receive circuits, are detected by FSDFH in the PDFH health status information, then FSDFH assumes the role of PDFH, aggregates the received data, and transmits it to the sink node. On the other hand, SSDFH does the same tasks if FSDFH fails. Specifically, if (1.3 × RT) of the anticipated time to receive data from PDFH or FSDFH passes without any transmission from PDFH or FSDFH, SSDFH takes the role of PDFH. The reasons behind this are attributed to the elimination of the use of global repair.
- For an FSDFH or SSDFH: According to our proposed protocol, FSDFH and SSDFH regularly transmit their health status information to the sink node separately while appending it to their data message, which is subsequently transmitted to their PDFH. FSDFH or SSDFH will be deleted from the sink node table message and will not be used for any further network operations if the sink node finds aberrant parameters in this message. However, regrouping will still occur in the next batch, so this is not an urgent scenario.
- If the sink node does not obtain any data from PDFH, FSDFH, SSDFH, and PDFRs after 45% of the anticipated time to receive data messages (i.e., 1.45 × RT). In other words, we assign a 15% delay for each role.
- If the sink node receives health status messages from PDFH, FSDFH, and SSDFH and finds anomalous parameters within these messages.
5.6.3. Device Deployment Redundancy and Redundant Coverage Optimizations
5.6.4. Data Redundancy and Data Fusion Optimization
- Redundant data aggregation: This proposed protocol uses redundant data aggregation, which aggregates and processes multiple copies of data from different SNs inside a DFG to improve reliability of data and alleviate network congestion. This method means gathering redundant data from DFGMs at PDFH, FSDFH, or SSDFH, aggregating it to remove duplicates, and then sending it to the sink node after extracting valuable information. By doing the above, we guarantee that the integrity and completeness of the data are maintained, even in the event that any data packets are lost or distorted in transmission. Through the reduction in the sent data amount, this technique maximizes bandwidth utilization while simultaneously enhancing fault tolerance and data reliability. Moreover, it lowers the network’s energy consumption since fewer data packets must be sent across lengthy distances. It is important to note that this method is applied to every IoT application listed in Table 3, which makes it more equipped to manage the difficulties of dynamic and resource-constrained IoT circumstances.
- Energy-adaptive and selective redundancy methods: The following lines provide more details on these methods:
- i.
- Energy adaptive redundancy levels: In the proposed protocol, adaptive redundancy levels refer to dynamically modifying the quantity and distribution of redundant data and operations in response to SN’s energy levels and real-time network circumstances to assess the health of the network and determine the appropriate amount of redundancy in real time. For example, if network stability is threatened, the proposed protocol can boost redundancy to provide reliable data transfer and fault tolerance, as long as SN energy levels are higher than the energy-critical threshold. On the other hand, it can decrease redundancy to save bandwidth and energy in steady circumstances. Because of its flexibility, the network can minimize needless overhead while maintaining excellent performance and resiliency. By adjusting redundancy based on variables including SN energy levels, network traffic, and data criticality, this method maximizes the trade-off between reliability and resource utilization.
- ii.
- Selective redundancy: In the proposed protocol, selective redundancy is a strategy that aims to improve network resilience and reliability by purposefully replicating critical data and functions only at particular network points/parts. The proposed protocol applies redundancy selectively according to the significance of the data and the application’s criticality. For example, critical data may need more redundancy in IoT healthcare applications, such as health monitoring information. As shown in Table 3, we have a variety of IoT applications in our proposed protocol, which we categorize into non-medical and medical applications. Medical applications have prioritized redundant data by identifying critical SNs, such as PDFHs, FSDFHs, and SSDFHs, and making sure they keep duplicate copies of crucial activities and data since they deal with urgent and high-importance data. By doing this, the total resource consumption of the network remains relatively low while enabling swift recovery from node failures or communication interruptions. In order to establish secondary channels for data transmission in the event that the primary route fails, selective redundancy is also incorporated into multipath routing. The trade-off between fault tolerance and resource utilization is lessened with the aid of this adapted redundancy. The proposed protocol guarantees that vital services continue to function by concentrating redundancy efforts on the most important parts, improving the network’s overall performance and stability.
6. Simulation Results and Discussions
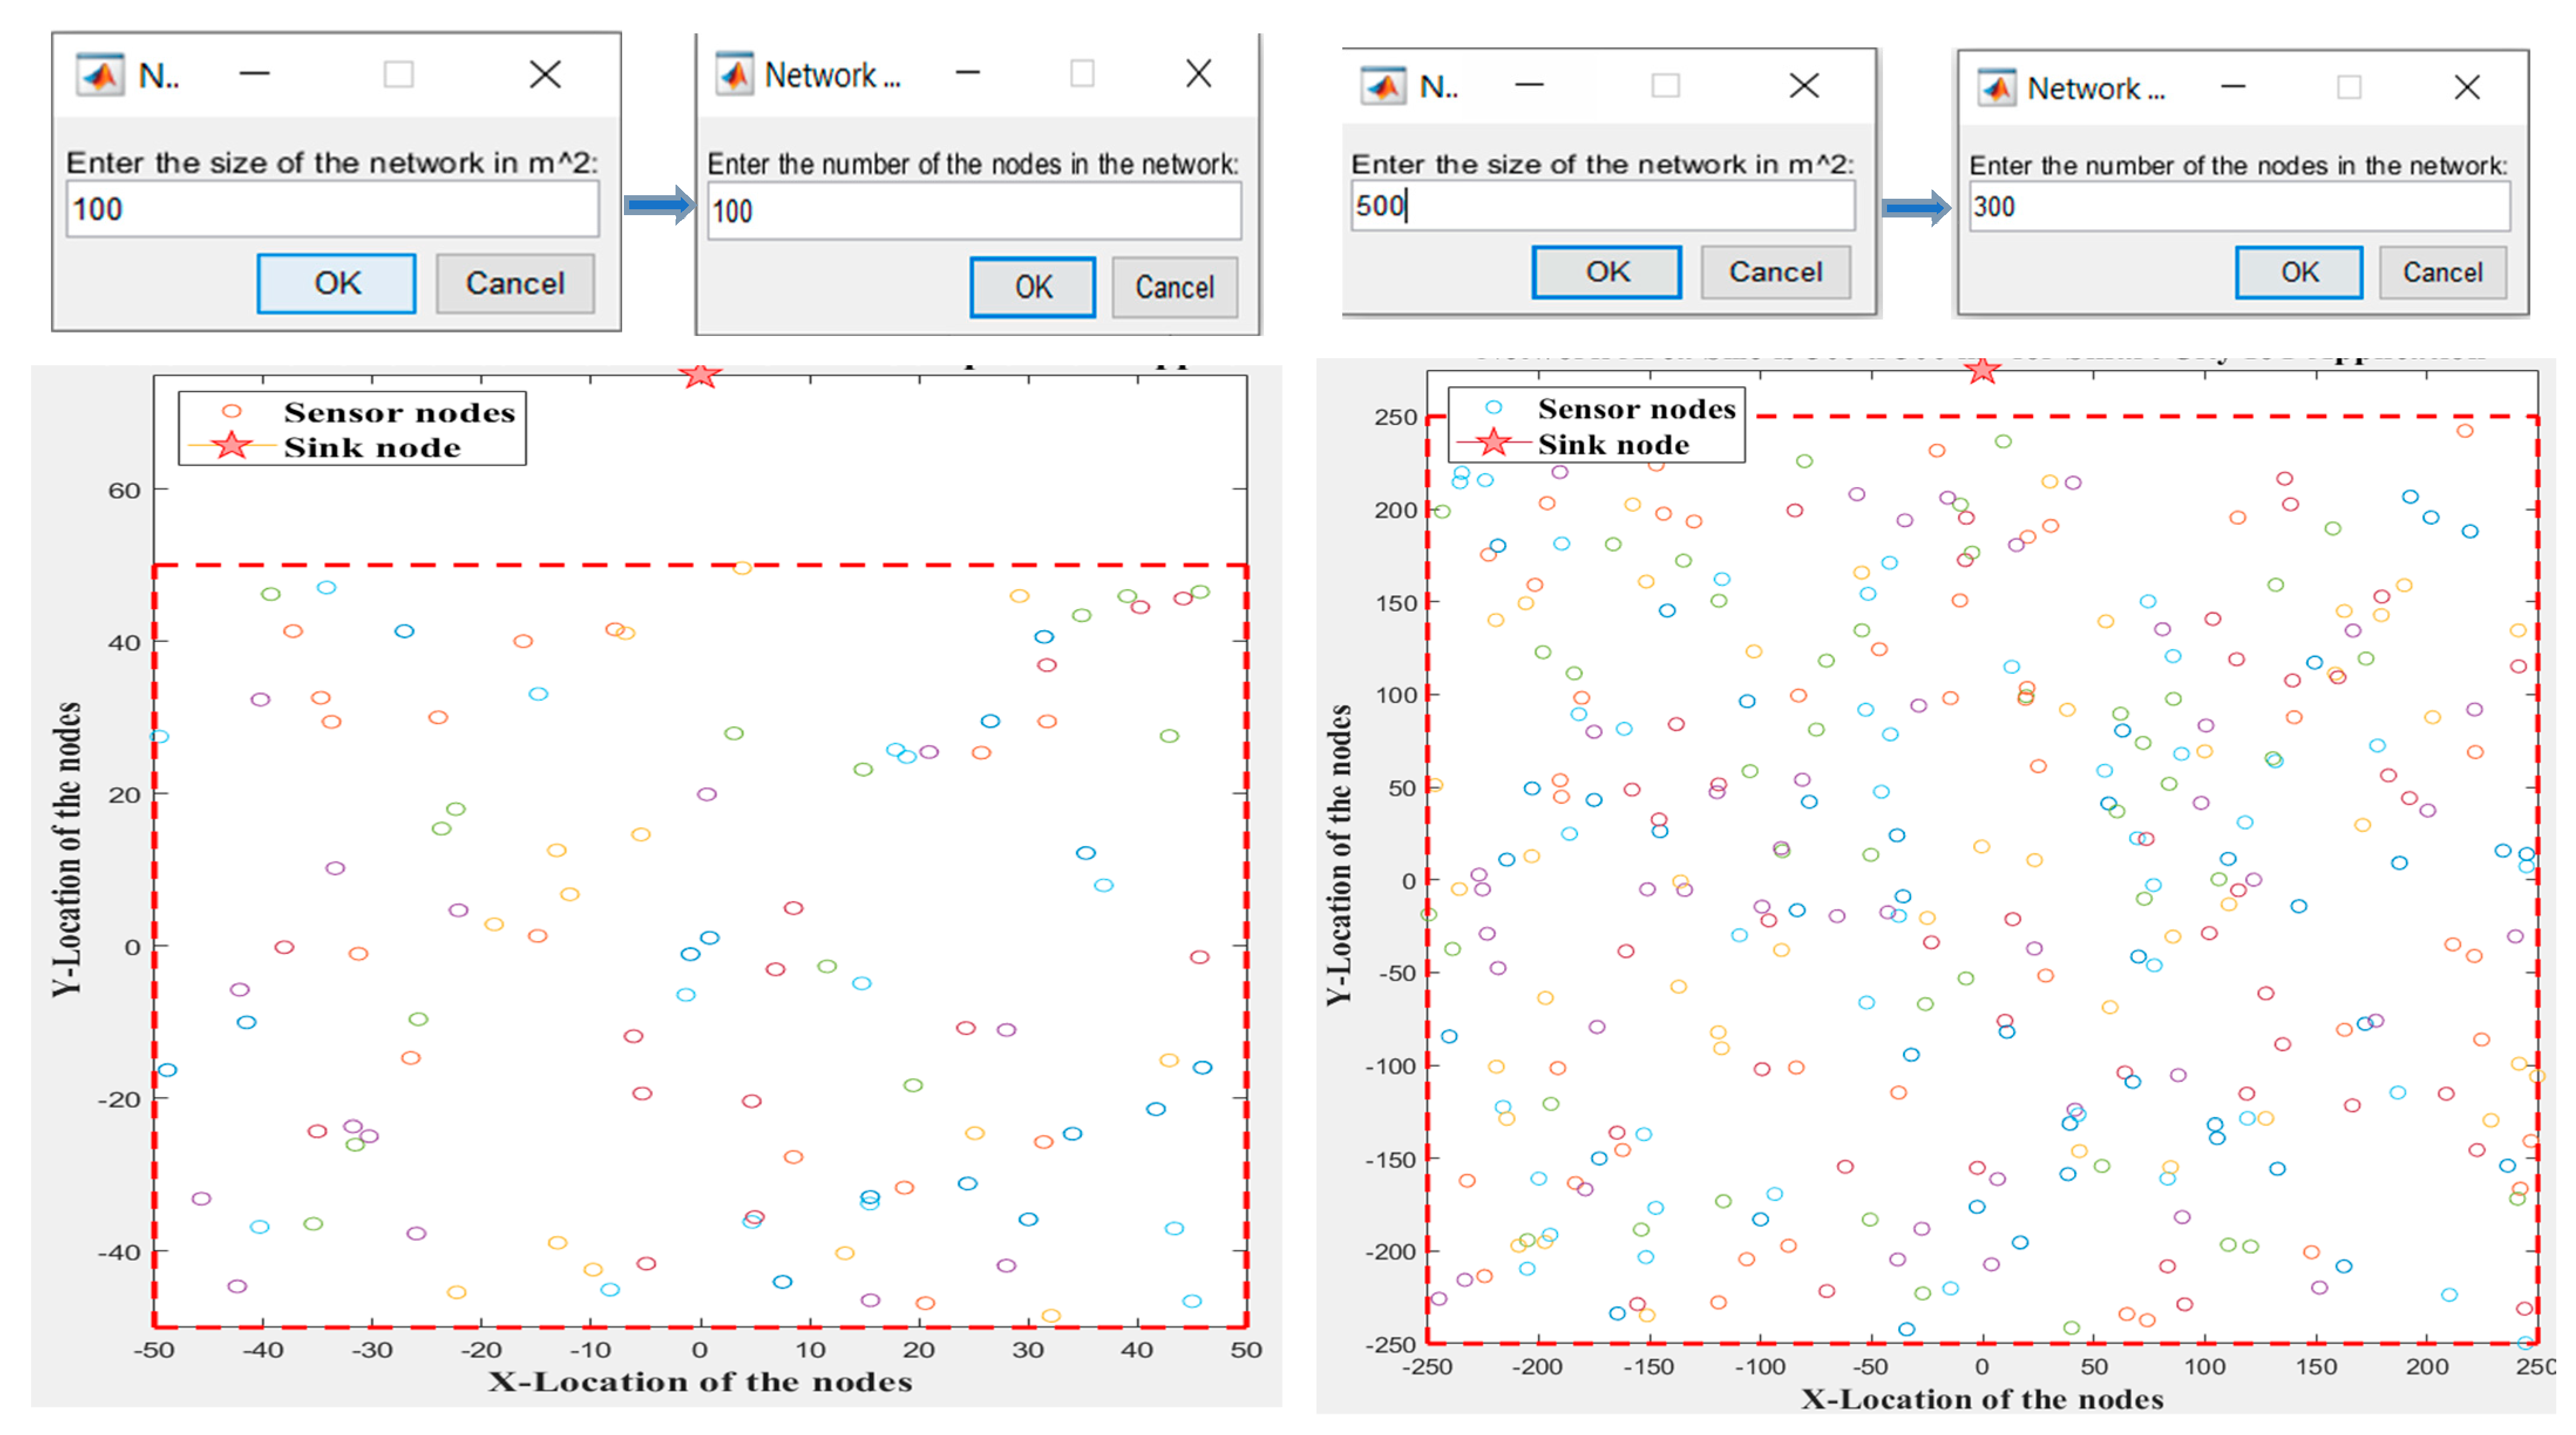
6.1. Simulation Environment and Setting Parameters
6.2. Performance Metrics
- i.
- Network Lifetime: The number of rounds until the last SN runs out of energy and ceases to operate is what defines it. Two criteria were used to evaluate network lifespan: Half Node to Die (HND), which is a measure that calculates how many rounds pass from the IoT network’s initial deployment to the point at which 50% of SNs run out of energy and stop working. The term Last Node to Die (LND) refers to the total number of rounds needed for all SNs in the network to run out of energy and eventually die. The count of living and dead SNs is used to measure it.
- ii.
- Total Energy Consumption: This determines how much SNs consume energy after each round. The unit of measurement is Joules.
- iii.
- Throughput: This measures the efficiency of the network by counting the total number of data packets, in bits, that are successfully delivered to the sink node when reaching LND. Expressed in bits per second (bps), throughput indicates the network’s capacity to handle data traffic effectively, with higher throughput values reflecting more efficient data transmission.
- iv.
- Average Delay: This metric captures the journey time each data packet endures on its way to the sink node, measured in milliseconds (ms). It represents the typical wait time per packet as it navigates the network, reflecting the efficiency of the data flow. By calculating this delay over multiple rounds and averaging the results, we gain insight into the mean time it takes for a packet to successfully reach its destination.
6.3. Simulation Scenarios and Results
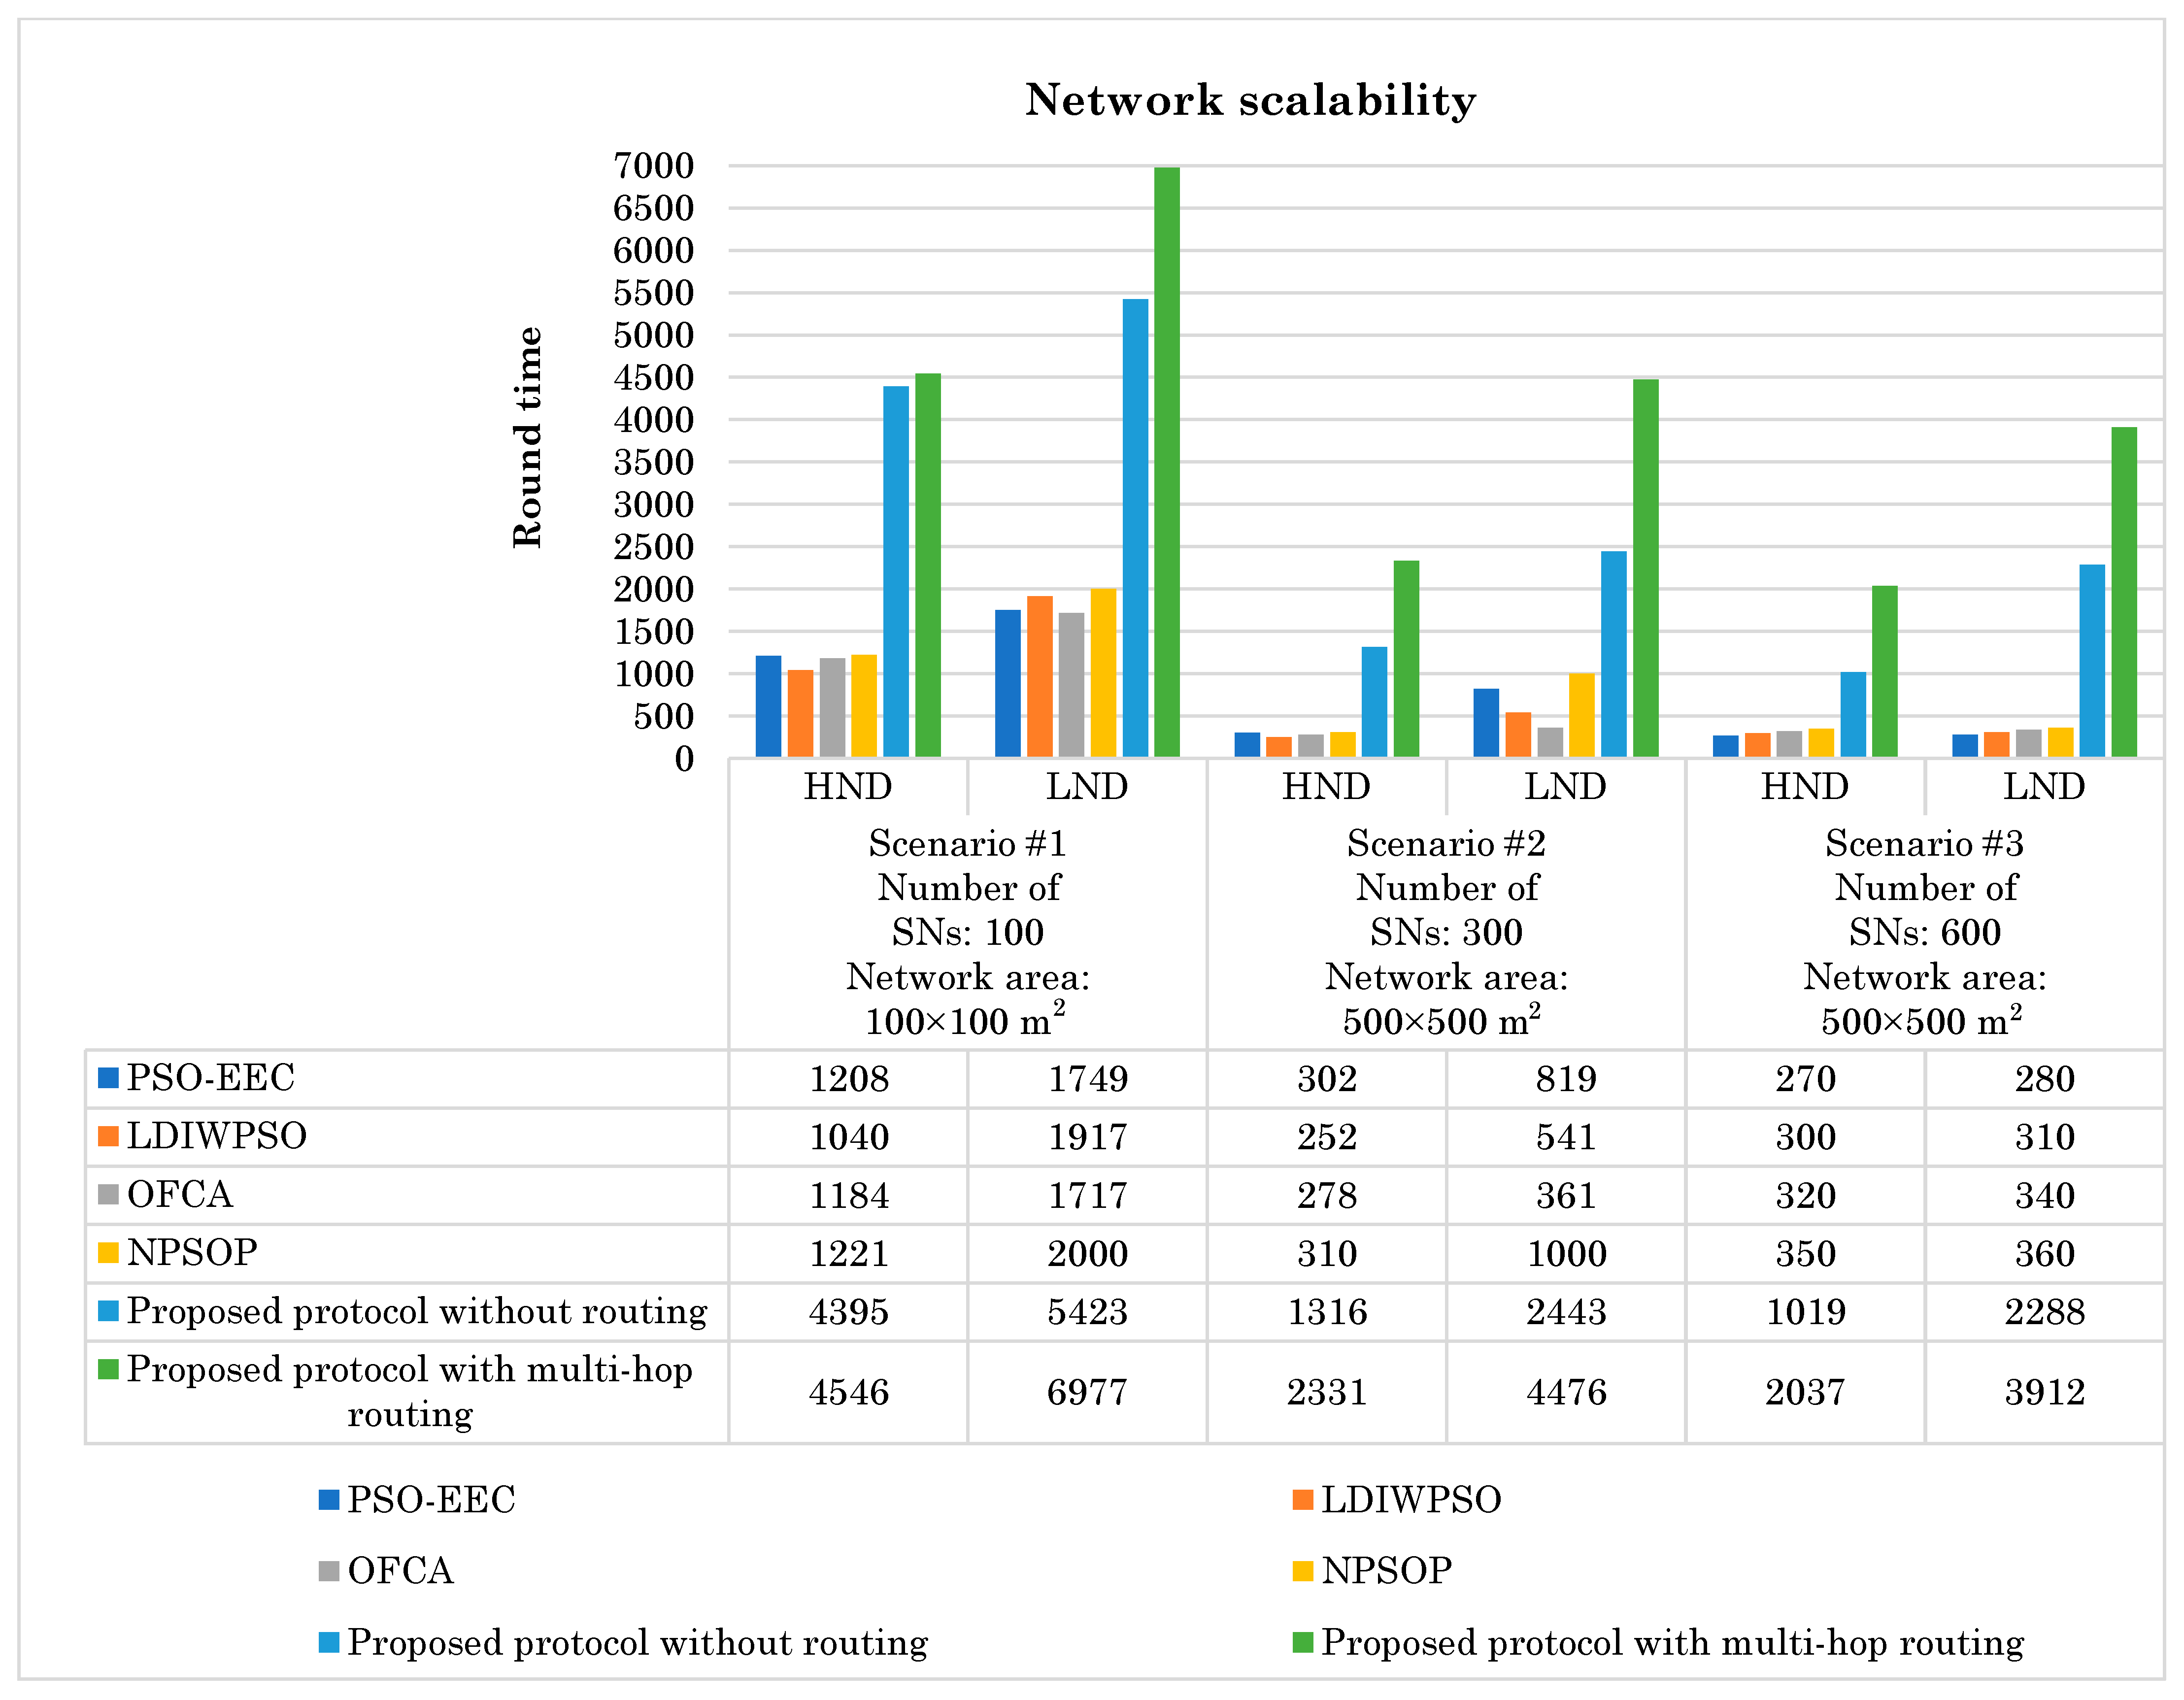
6.3.1. Simulation Scenario 1: Alive Nodes Versus Diversity of Network Sizes (Network Scalability) Evaluation
6.3.2. Simulation Scenario 2: Alive Nodes Evaluation
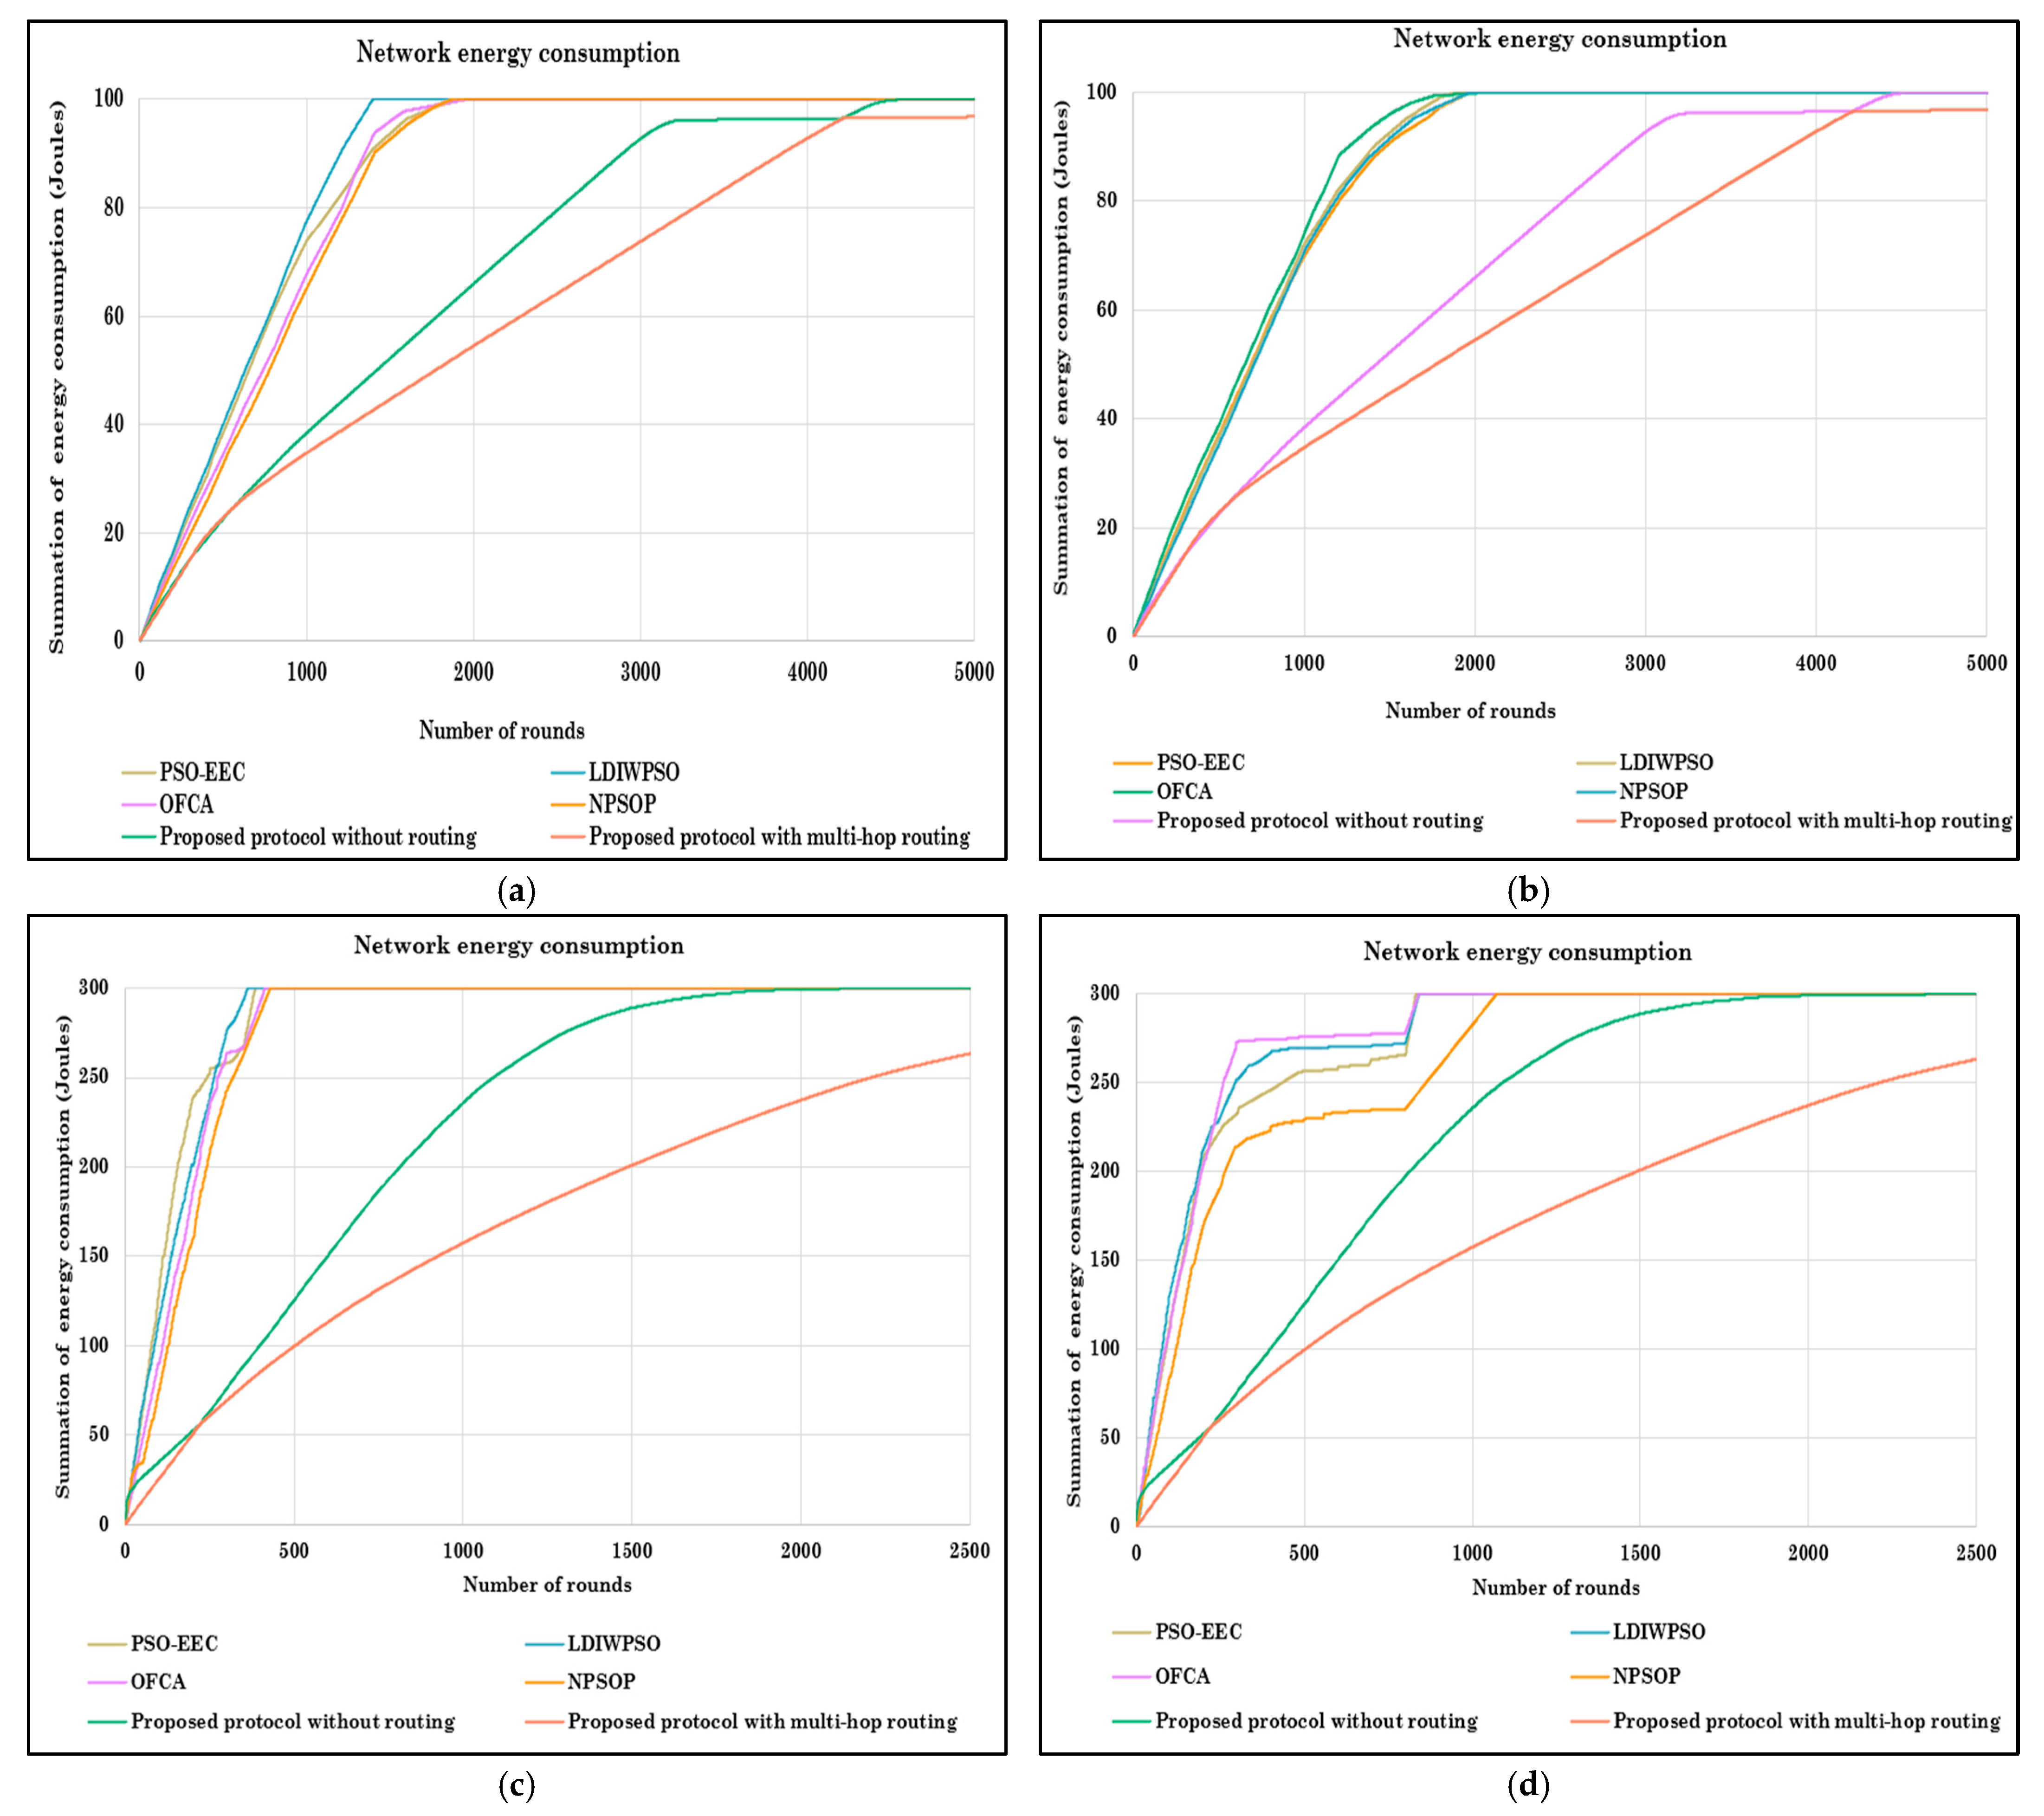
6.3.3. Simulation Scenario 3: Energy Consumption Evaluation
6.3.4. Simulation Scenario 4: Throughput Evaluation
6.3.5. Simulation Scenario 5: Average Delay Evaluation
6.4. Analysis of Underlying Causes and Correlations of Results
- Network lifespan and energy consumption: There is an inverse correlation between energy consumption and network lifespan. Protocols that minimize energy usage extend the operational time of SNs, thereby prolonging the overall network lifespan. The proposed protocol achieves this by optimizing routing and PDFH selection, reducing unnecessary energy expenditure.
- Network lifespan and throughput: A longer network lifespan directly contributes to higher throughput, as the network remains functional for a more extended period of time, allowing more data packets to be transmitted to the sink node. This correlation is evident in the proposed protocol, where efficient energy management ensures sustained data transmission over time.
- Energy consumption and average delay: Lower energy consumption correlates with reduced average delay. Efficient energy usage ensures that SNs and PDFHs remain operational and responsive, minimizing the time required for data transmission. The proposed protocol’s optimized scheduling and routing strategies contribute to this correlation by enhancing both energy efficiency and transmission speed.
- Throughput and average delay: While high throughput generally indicates efficient data transmission, it can sometimes lead to increased network congestion and higher delays. However, the proposed protocol balances this by employing multi-hop routing and adaptive scheduling, which maintain high throughput without significantly increasing delay.
7. Conclusions, Home Recommendations, and Future Directions
Author Contributions
Funding
Data Availability Statement
Acknowledgments
Conflicts of Interest
Appendix A. A Comprehensive Example of PDFH, FSDFH, and SSDFH Selection Utilizing the MPA

| SN ID | X-Location | Y-Location | Type | Eo (J) | (m) | X | ASBO | DFG ID |
|---|---|---|---|---|---|---|---|---|
| 1 | −8.15 | 59.23 | DFGM | 1 | 66.25 | 0 | 0.4 | 5 |
| 4 | −68.99 | 41.39 | DFGM | 1 | 108.40 | 0 | 0.5 | 5 |
| 20 | −27.74 | 76.92 | DFGM | 1 | 55.50 | 0 | 0.3 | 5 |
| 33 | −9.57 | 55.39 | DFGM | 1 | 70.26 | 0 | 0.7 | 5 |
| 38 | −48.20 | 51.22 | DFGM | 1 | 88.12 | 0 | 0.1 | 5 |
| 49 | −16.33 | 67.88 | DFGM | 1 | 59.41 | 0 | 0.7 | 5 |
- (1)
- The first iteration :
| SN ID | SA | Fitness | Top Predator Fitness | Top Predator Position | Best Position |
|---|---|---|---|---|---|
| 1 | 1 | 0.1244 | 0.1244 | [0.1875 0.0208 0.0886 0 0.4000] | 1 |
| 4 | 2 | 0.2326 | 0.1244 | [0.1875 0.0208 0.0886 0 0.4000] | 1 |
| 20 | 3 | 0.6449 | 0.1244 | [0.1875 0.0208 0.0886 0 0.4000] | 1 |
| 33 | 4 | 0.2809 | 0.1244 | [0.1875 0.0208 0.0886 0 0.4000] | 1 |
| 38 | 5 | 0.1709 | 0.1244 | [0.1875 0.0208 0.0886 0 0.4000] | 1 |
| 49 | 6 | 0.0700 | 0.0700 | [ 0 0 0 0 0.7000] | 49 |
| Parameter Definition | Value |
|---|---|
| Number of steps (n) | 6 |
| Number of dimensions (m) | 5 |
| Power law index (β) | 1.5 |
| Numerator of | 0.9400 |
| Denominator of | 1.6169 |
| Standard deviation of x () | 0.6966 |
| Standard deviation of y () | 1 |
| Mean of x and y (,) | 0 |
| (i, j) | R | RB | Elite (i, j) | Prey (i, j) Before Update | Step-Size (i, j) | Prey (i, j) After Update |
|---|---|---|---|---|---|---|
| (1, 1) | 0.6581 | −0.0630 | 0 | 0.1875 | −0.0007 | 0.1872 |
| (1, 2) | 0.9276 | 1.0786 | 0 | 0.0208 | −0.0242 | 0.0096 |
| (1, 3) | 0.3865 | 0.6528 | 0 | 0.0886 | −0.0378 | 0.0813 |
| (1, 4) | 0.7962 | 2.1233 | 0 | 0 | 0 | 0 |
| (1, 5) | 0.4167 | 0.6213 | 0.7000 | 0.4000 | 0.2805 | 0.4584 |
| (2, 1) | 0.7997 | −0.6377 | 0 | 0.0073 | −0.0030 | 0.0061 |
| (2, 2) | 0.4219 | 0.4490 | 0 | 0.0006 | −0.0001 | 0.0006 |
| (2, 3) | 0.0242 | −2.1236 | 0 | 1.000 | −4.5099 | 0.9455 |
| (2, 4) | 0.0816 | 0.0488 | 0 | 0 | 0 | 0 |
| (2, 5) | 0.6054 | 0.2436 | 0 | 0.5000 | 0.1408 | 0.5426 |
| (3, 1) | 0.0736 | 1.3301 | 0 | 1.000 | −1.7692 | 0.9349 |
| (3, 2) | 0.6843 | −1.1289 | 0 | 1.000 | −1.2744 | 0.5640 |
| (3, 3) | 0.5897 | −0.6994 | 0 | 0.1663 | −0.0814 | 0.1423 |
| (3, 4) | 0.5273 | 0.5156 | 0 | 0 | 0 | 0 |
| (3, 5) | 0.2631 | −0.2499 | 0.7000 | 0.3000 | −0.1937 | 0.2745 |
| (4, 1) | 0.1710 | 0.0419 | 0 | 0.4893 | −0.0009 | 0.4892 |
| (4, 2) | 0.6618 | 0.4730 | 0 | 0.1219 | −0.0273 | 0.1129 |
| (4, 3) | 0.5671 | 0.0136 | 0 | 0.0866 | −0.0000 | 0.0866 |
| (4, 4) | 0.6425 | 0.2060 | 0 | 0 | 0 | 0 |
| (4, 5) | 0.3815 | −0.8973 | 0.7000 | 0.7000 | −1.1917 | 0.4727 |
| (5, 1) | 0.9855 | 1.0329 | 0 | 0.2962 | −0.3160 | 0.1405 |
| (5, 2) | 0.4213 | 0.2812 | 0 | 0.0375 | −0.0030 | 0.0369 |
| (5, 3) | 0.2375 | 0.8853 | 0 | 0.2870 | −0.2249 | 0.2603 |
| (5, 4) | 0.3912 | −1.1249 | 0 | 0 | 0 | 0 |
| (5, 5) | 0.4965 | 0.8534 | 0.7000 | 0.1000 | 0.5246 | 0.2302 |
| (6, 1) | 0.1290 | 0.6014 | 0 | 0 | 0 | 0 |
| (6, 2) | 0.2768 | −1.6456 | 0 | 0 | 0 | 0 |
| (6, 3) | 0.9624 | 0.7952 | 0 | 0 | 0 | 0 |
| (6, 4) | 0.2585 | −0.6864 | 0 | 0 | 0 | 0 |
| (6, 5) | 0.3891 | −1.0708 | 0.7000 | 0.7000 | −1.5523 | 0.3980 |
| SN ID | SA | Fitnessold | Fitnessnew | Top Predator Fitness | Top Predator Position | Best Position |
|---|---|---|---|---|---|---|
| 1 | 1 | 0.1244 | 0.1260 | 0.0700 | [0 0 0 0 0.7000] | 49 |
| 4 | 2 | 0.2326 | 0.2267 | 0.0700 | [0 0 0 0 0.7000] | 49 |
| 20 | 3 | 0.6449 | 0.5082 | 0.0700 | [0 0 0 0 0.7000] | 49 |
| 33 | 4 | 0.2809 | 0.2559 | 0.0700 | [0 0 0 0 0.7000] | 49 |
| 38 | 5 | 0.1709 | 0.1264 | 0.0700 | [0 0 0 0 0.7000] | 49 |
| 49 | 6 | 0.0700 | 0.0398 | 0.0398 | [0 0 0 0 0.3980] | 49 |
- (2)
- The second iteration :
| SN ID | SA | Fitness | Top Predator Fitness | Top Predator Position | Best Position |
|---|---|---|---|---|---|
| 1 | 1 | 0.0408 | 0.0700 | [0 0 0 0 0.7000] | 49 |
| 4 | 2 | 0.4080 | 0.0700 | [0 0 0 0 0.7000] | 49 |
| 20 | 3 | 0.5943 | 0.0700 | [0 0 0 0 0.7000] | 49 |
| 33 | 4 | 0.0772 | 0.0700 | [0 0 0 0 0.7000] | 49 |
| 38 | 5 | 0.4441 | 0.0700 | [0 0 0 0 0.7000] | 49 |
| 49 | 6 | 0.0728 | 0.0398 | [0 0 0 0 0.0398] | 49 |
| SN ID | SA | Fitnessnew | Fitnessold | Inx | Status |
|---|---|---|---|---|---|
| 1 | 1 | 0.0408 | 0.1260 | 0 | Update with new fitness |
| 4 | 2 | 0.4080 | 0.2267 | 1 | Keep the previous fitness |
| 20 | 3 | 0.5943 | 0.5082 | 1 | Keep the previous fitness |
| 33 | 4 | 0.0772 | 0.2559 | 0 | Update with new fitness |
| 38 | 5 | 0.4441 | 0.1264 | 1 | Keep the previous fitness |
| 49 | 6 | 0.0728 | 0.0398 | 1 | Keep the previous fitness |
| (i, j) | R | RB | Elite (i, j) | Prey (i, j) Before Update | Step-Size (i, j) | Prey (i, j) After Update |
|---|---|---|---|---|---|---|
| (1, 1) | 0.5073 | −1.1131 | 0 | 0 | 0 | 0 |
| (1, 2) | 0.5589 | 0.1674 | 0 | 0 | 0 | 0 |
| (1, 3) | 0.4042 | 1.1836 | 0 | 0.0073 | −0.0102 | 0.0052 |
| (1, 4) | 0.9744 | −1.8613 | 0 | 0 | 0 | 0 |
| (1, 5) | 0.1238 | −0.7175 | 0.3980 | 0.3946 | −0.4887 | 0.3643 |
| (2, 1) | 0.2848 | 0.1998 | 0 | 0.0061 | −0.0002 | 0.0061 |
| (2, 2) | 0.0733 | −0.3666 | 0 | 0.0006 | −0.0001 | 0.0006 |
| (2, 3) | 0.1059 | 0.0636 | 0 | 0.9455 | −0.0038 | 0.9453 |
| (2, 4) | 0.8770 | −0.9790 | 0 | 0 | 0 | 0 |
| (2, 5) | 0.9316 | −3.4346 | 0 | 0.5426 | −7.7682 | −3.0757 |
| (3, 1) | 0.1643 | 0.0450 | 0 | 0.9349 | −0.0019 | 0.9347 |
| (3, 2) | 0.8485 | 2.1763 | 0 | 0.5640 | −2.6709 | −0.5692 |
| (3, 3) | 0.6513 | 0.7288 | 0 | 0.1423 | −0.0756 | 0.1177 |
| (3, 4) | 0.5739 | −2.2373 | 0 | 0 | 0 | 0 |
| (3, 5) | 0.0064 | 0.5227 | 0.3980 | 0.2745 | 0.1330 | 0.2750 |
| (4, 1) | 0.8659 | −1.3118 | 0 | 0 | 0 | 0 |
| (4, 2) | 0.2993 | 0.7794 | 0 | 0 | 0 | 0 |
| (4, 3) | 0.6771 | 0.2594 | 0 | 0.1874 | −0.0126 | 0.1832 |
| (4, 4) | 0.6692 | 1.4843 | 0 | 0 | 0 | 0 |
| (4, 5) | 0.3635 | −0.0751 | 0.3980 | 0.4348 | −0.0323 | 0.4289 |
| (5, 1) | 0.5600 | −0.3726 | 0 | 0.1405 | −0.0195 | 0.1350 |
| (5, 2) | 0.1472 | −1.1371 | 0 | 0.0369 | −0.0477 | 0.0334 |
| (5, 3) | 0.5363 | −0.3020 | 0 | 0.2603 | −0.0237 | 0.2539 |
| (5, 4) | 0.1885 | −0.4157 | 0 | 0 | 0 | 0 |
| (5, 5) | 0.2577 | 0.4437 | 0.3980 | 0.2302 | 0.1313 | 0.2471 |
| (6, 1) | 0.4191 | 0.5113 | 0 | 0 | 0 | 0 |
| (6, 2) | 0.4684 | −1.4291 | 0 | 0 | 0 | 0 |
| (6, 3) | 0.8554 | 0.9560 | 0 | 0 | 0 | 0 |
| (6, 4) | 0.3521 | −0.3061 | 0 | 0 | 0 | 0 |
| (6, 5) | 0.9247 | −0.7265 | 0.3980 | 0.3980 | −0.4992 | 0.1672 |
| SN ID | SA | Fitnessold | Fitnessnew | Top Predator Fitness | Top Predator Position | Best Position |
|---|---|---|---|---|---|---|
| 1 | 1 | 0.0408 | 0.0374 | 0.0374 | [ 0 0 0.0052 0 0.3643] | 1 |
| 4 | 2 | 0.2267 | 0.1724 | 0.0374 | [ 0 0 0.0052 0 0.3643] | 1 |
| 20 | 3 | 0.5082 | 0.3642 | 0.0374 | [ 0 0 0.0052 0 0.3643] | 1 |
| 33 | 4 | 0.0772 | 0.0759 | 0.0374 | [ 0 0 0.0052 0 0.3643] | 1 |
| 38 | 5 | 0.1264 | 0.1242 | 0.0374 | [ 0 0 0.0052 0 0.3643] | 1 |
| 49 | 6 | 0.0398 | 0.0167 | 0.0167 | [ 0 0 0 0 0.1672] | 49 |
| SN ID | SA | Fitness | Fitnessold | Inx | Status |
|---|---|---|---|---|---|
| 1 | 1 | 0.0374 | 0.0408 | 0 | Update with new fitness |
| 4 | 2 | 0.1724 | 0.2267 | 0 | Update with new fitness |
| 20 | 3 | 0.3642 | 0.5082 | 0 | Update with new fitness |
| 33 | 4 | 0.0759 | 0.0772 | 0 | Update with new fitness |
| 38 | 5 | 0.1242 | 0.1264 | 0 | Update with new fitness |
| 49 | 6 | 0.0167 | 0.0398 | 0 | Update with new fitness |
References
- Darabkh, K.A.; Al-Akhras, M.; Khalifeh, A.F.; Jafar, I.F.; Jubair, F. An innovative RPL objective function for broad range of IoT domains utilizing fuzzy logic and multiple metrics. Expert Syst. Appl. 2022, 205, 117593. [Google Scholar] [CrossRef]
- Vishwakarma, A.K.; Chaurasia, S.; Kumar, K.; Singh, Y.N.; Chaurasia, R. Internet of things technology, research, and challenges: A survey. Multimed. Tools Appl. 2024, 1–36. [Google Scholar] [CrossRef]
- Zeng, F.; Pang, C.; Tang, H. Sensors on Internet of Things Systems for the Sustainable Development of Smart Cities: A Systematic Literature Review. Sensors 2024, 24, 2074. [Google Scholar] [CrossRef]
- Zhang, Z.; Zhang, Y.; Tian, H.; Martin, A.; Liu, Z.; Ding, W. A survey of evidential clustering: Definitions, methods, and applications. Inf. Fusion 2025, 115, 102736. [Google Scholar]
- Liu, Z.; Li, J.; Zhang, X.; Wang, X. Multi-level information fusion for missing multi-label learning based on stochastic concept clustering. Inf. Fusion 2024, 115, 102775. [Google Scholar] [CrossRef]
- Yu, B.; Xu, R.; Cai, M.; Ding, W. A clustering method based on multi-positive–negative granularity and attenuation-diffusion pattern. Inf. Fusion 2023, 103, 102137. [Google Scholar] [CrossRef]
- Xie, J.; Jiang, L.; Xia, S.; Xiang, X.; Wang, G. An adaptive density clustering approach with multi-granularity fusion. Inf. Fusion 2024, 106, 102273. [Google Scholar] [CrossRef]
- Darabkh, K.A.; Al-Akhras, M.; Zomot, J.N.; Atiquzzaman, M. RPL Routing Protocol over IoT: A Comprehensive Survey, Recent Advances, Insights, Bibliometric Analysis, Recommendations, and Future Directions. J. Netw. Comput. Appl. 2022, 207, 103476. [Google Scholar]
- Zaman, M.; Puryear, N.; Abdelwahed, S.; Zohrabi, N. A Review of IoT-Based Smart City Development and Management. Smart Cities 2024, 7, 1462–1501. [Google Scholar] [CrossRef]
- Samiayya, D.; Radhika, S.; Chandrasekar, A. An optimal model for enhancing network lifetime and cluster head selection using hybrid snake whale optimization. Peer Peer Netw. Appl. 2023, 16, 1959–1974. [Google Scholar] [CrossRef]
- Hosseinzadeh, M.; Hemmati, A.; Rahmani, A.M. Clustering for smart cities in the internet of things: A review. Clust. Comput. 2022, 25, 4097–4127. [Google Scholar] [CrossRef]
- Wang, Z.; Duan, J.; Xing, P. Multi-Hop Clustering and Routing Protocol Based on Enhanced Snake Optimizer and Golden Jackal Optimization in WSNs. Sensors 2024, 24, 1348. [Google Scholar] [CrossRef] [PubMed]
- Darabkh, K.A.; AlAdwan, H.H.; Al-Akhras, M.; Jubair, F.; Rahamneh, S. A revolutionary RPL-based IoT routing protocol for monitoring building structural health in smart city domain utilizing equilibrium optimizer algorithm. Soft Comput. 2024, 28, 10099–10138. [Google Scholar] [CrossRef]
- Chen, Y.; Liu, X.; Rao, M.; Qin, Y.; Wang, Z.; Ji, Y. Explicit speed-integrated LSTM network for non-stationary gearbox vibration representation and fault detection under varying speed conditions. Reliab. Eng. Syst. Saf. 2024, 254, 110596. [Google Scholar] [CrossRef]
- Darabkh, K.A.; Al-Akhras, M. The Potential of Computational Intelligence to Extend the Lifespan of Internet of Things Power-Limited Sensor Networks. In Proceedings of the 2024 International Conference on Software, Telecommunications and Computer Networks (SoftCOM), Split, Croatia, 26–28 September 2024; pp. 1–6. [Google Scholar]
- Ramalingam, S.; Dhanasekaran, S.; Sinnasamy, S.S.; Salau, A.O.; Alagarsamy, M. Performance enhancement of efficient clustering and routing protocol for wireless sensor networks using improved elephant herd optimization algorithm. Wirel. Netw. 2024, 30, 1773–1789. [Google Scholar] [CrossRef]
- Chai, X.; Lee, B.G.; Hu, C.; Pike, M.; Chieng, D.; Wu, R.; Chung, W.Y. IoT-FAR: A multi-sensor fusion approach for IoT-based firefighting activity recognition. Inf. Fusion 2025, 113, 102650. [Google Scholar]
- Huang, C.; Coskun, S.; Karimi, H.R.; Ding, W. A distributed state and fault estimation scheme for state-saturated systems with quantized measurements over sensor networks. Inf. Fusion 2024, 110, 102452. [Google Scholar] [CrossRef]
- Ji, Y.; Huang, Y.; Zeng, J.; Ren, L.; Chen, Y. A physical–data-driven combined strategy for load identification of tire type rail transit vehicle. Reliab. Eng. Syst. Saf. 2024, 253, 110493. [Google Scholar] [CrossRef]
- Kaleybar, H.J.; Davoodi, M.; Brenna, M.; Zaninelli, D. Applications of Genetic Algorithm and Its Variants in Rail Vehicle Systems: A Bibliometric Analysis and Comprehensive Review. IEEE Access 2023, 11, 68972–68993. [Google Scholar] [CrossRef]
- Kumaravel, V.; Panneerselvam, A. A multi objective Tabu particle swarm optimization for effective cluster head selection in WSN. Clust. Comput. 2019, 22, 12275–12282. [Google Scholar]
- Bharathi, M.; Srinivas, T.A.S. Exploring Ant Colony Optimization for Enhanced Routing in IoT Networks: A Survey. Adv. Image Process. Pattern Recognit. 2024, 7, 68–83. [Google Scholar]
- Płaczek, B. Prediction-based data reduction with dynamic target node selection in IoT sensor networks. Futur. Gener. Comput. Syst. 2023, 152, 225–238. [Google Scholar] [CrossRef]
- Darabkh, K.A.; AlAdwan, H.H.; Al-Akhras, M.; Jubair, F.; Rahamneh, S. A New Routing Protocol for Low-Power and Lossy Networks Utilizing Computational Intelligence over IoT Networks. In Proceedings of the 2023 IEEE Global Conference on Artificial Intelligence and Internet of Things (GCAIoT), Dubai, United Arab Emirates, 10–11 December 2023; pp. 97–102. [Google Scholar]
- Darabkh, K.A.; Asma’a, B.A.; Al-Akhras, M.; Wafa’a, K.K. Improving Network Lifetime in IoT Sensor Network Based on Particle Swarm Optimization, Clustering, and Mobile Sink. In Proceedings of the 2022 4th IEEE Middle East and North Africa COMMunications Conference (MENACOMM), Amman, Jordan, 6–8 December 2022. [Google Scholar]
- Amutha, J.; Sharma, S.; Sharma, S.K. An energy efficient cluster based hybrid optimization algorithm with static sink and mobile sink node for Wireless Sensor Networks. Expert Syst. Appl. 2022, 203, 117334. [Google Scholar]
- Suresh, S.S.; Prabhu, V.; Parthasarathy, V.; Senthilkumar, G.; Gundu, V. Intelligent data routing strategy based on federated deep reinforcement learning for IOT-enabled wireless sensor networks. Meas. Sens. 2024, 31, 101012. [Google Scholar] [CrossRef]
- Priyadarshi, R. Energy-Efficient Routing in Wireless Sensor Networks: A Meta-heuristic and Artificial Intelligence-based Approach: A Comprehensive Review. Arch. Comput. Methods Eng. 2024, 31, 2109–2137. [Google Scholar] [CrossRef]
- Gao, J.; Wang, Z.; Lei, Z.; Wang, R.-L.; Wu, Z.; Gao, S. Feature selection with clustering probabilistic particle swarm optimization. Int. J. Mach. Learn. Cybern. 2024, 15, 3599–3617. [Google Scholar] [CrossRef]
- Ravi, G.; Das, M.S.; Karmakonda, K. Reliable cluster based data aggregation scheme for IoT network using hybrid deep learning techniques. Meas. Sens. 2023, 27, 100744. [Google Scholar] [CrossRef]
- Darabkh, K.A.; Al-Akhras, M. An Improved Routing Protocol for IoT Sensors Utilizing Clustering Techniques and Optimization Methods. In Proceedings of the 6th IEEE International Conference on Advanced Communication Technologies and Networking (IEEE CommNet 2023), Rabat, Morocco, 11–13 December 2023. [Google Scholar]
- Darabkh, K.A.; Zomot, J.N.; Al-qudah, Z. EDB-CHS-BOF: Energy and Distance Based Cluster Head Selection with Balanced Objective Function Protocol. IET Commun. 2019, 13, 3168–3180. [Google Scholar]
- Heidari, E. A novel energy-aware method for clustering and routing in IoT based on whale optimization algorithm & Harris Hawks optimization. Computing 2024, 106, 1013–1045. [Google Scholar] [CrossRef]
- He, S.; Li, Q.; Khishe, M.; Mohammed, A.S.; Mohammadi, H.; Mohammadi, M. The optimization of nodes clustering and multi-hop routing protocol using hierarchical chimp optimization for sustainable energy efficient underwater wireless sensor networks. Wirel. Netw. 2023, 30, 233–252. [Google Scholar] [CrossRef]
- Darabkh, K.A.; Amareen, A.B.; Al-Akhras, M.; Kassab, W.K. An innovative cluster-based power-aware protocol for Internet of Things sensors utilizing mobile sink and particle swarm optimization. Neural Comput. Appl. 2023, 35, 19365–19408. [Google Scholar] [CrossRef]
- Somula, R.; Cho, Y.; Mohanta, B.K. SWARAM: Osprey Optimization Algorithm-Based Energy-Efficient Cluster Head Selection for Wireless Sensor Network-Based Internet of Things. Sensors 2024, 24, 521. [Google Scholar] [CrossRef]
- Bian, Z.; Qu, J.; Zhou, J.; Jiang, Z.; Wang, S. Weighted adaptively ensemble clustering method based on fuzzy Co-association matrix. Inf. Fusion 2023, 103, 102099. [Google Scholar] [CrossRef]
- Zhou, X.; Yang, Q.; Liu, Q.; Liang, W.; Wang, K.; Liu, Z.; Ma, J.; Jin, Q. Spatial–Temporal Federated Transfer Learning with multi-sensor data fusion for cooperative positioning. Inf. Fusion 2023, 105, 102182. [Google Scholar] [CrossRef]
- Rawat, P.; Chauhan, S. Particle swarm optimization-based energy efficient clustering protocol in wireless sensor network. Neural Comput. Appl. 2021, 33, 14147–14165. [Google Scholar] [CrossRef]
- Choudhary, S.; Sugumaran, S.; Belazi, A.; El-Latif, A.A.A. Linearly decreasing inertia weight PSO and improved weight factor-based clustering algorithm for wireless sensor networks. J. Ambient. Intell. Humaniz. Comput. 2023, 14, 6661–6679. [Google Scholar] [CrossRef]
- Giri, A.; Dutta, S.; Neogy, S. An Optimized Fuzzy Clustering Algorithm for Wireless Sensor Networks. Wirel. Pers. Commun. 2022, 126, 2731–2751. [Google Scholar] [CrossRef]
- Huangshui, H.; Xinji, F.; Chuhang, W.; Ke, L.; Yuxin, G. A Novel Particle Swarm Optimization-Based Clustering and Routing Protocol for Wireless Sensor Networks. Wirel. Pers. Commun. 2023, 133, 2175–2202. [Google Scholar] [CrossRef]
- Faramarzi, A.; Heidarinejad, M.; Mirjalili, S.; Gandomi, A.H. Marine Predators Algorithm: A nature-inspired metaheuristic. Expert Syst. Appl. 2020, 152, 113377. [Google Scholar] [CrossRef]
- Al-Betar, M.A.; Awadallah, M.A.; Makhadmeh, S.N.; Alyasseri, Z.A.A.; Al-Naymat, G.; Mirjalili, S. Marine Predators Algorithm: A Review. Arch. Comput. Methods Eng. 2023, 30, 3405–3435. [Google Scholar] [CrossRef]
- Rai, R.; Dhal, K.G.; Das, A.; Ray, S. An Inclusive Survey on Marine Predators Algorithm: Variants and Applications. Arch. Comput. Methods Eng. 2023, 30, 3133–3172. [Google Scholar] [PubMed]
- Mugemanyi, S.; Qu, Z.; Rugema, F.X.; Dong, Y.; Wang, L.; Bananeza, C.; Nshimiyimana, A.; Mutabazi, E. Marine predators algorithm: A comprehensive review. Mach. Learn. Appl. 2023, 12, 100471. [Google Scholar] [CrossRef]
- Darabkh, K.A.; Zomot, J.N.; Al-Qudah, Z.; Khalifeh, A.F. Impairments-aware time slot allocation model for energy-constrained multi-hop clustered IoT nodes considering TDMA and DSSS MAC protocols. J. Ind. Inf. Integr. 2021, 25, 100243. [Google Scholar] [CrossRef]
- Shahzad, M.K.; Islam, S.M.R.; Kwak, K.-S.; Nkenyereye, L. AEF: Adaptive En-Route Filtering to Extend Network Lifetime in Wireless Sensor Networks. Sensors 2019, 19, 4036. [Google Scholar] [CrossRef]
- Darabkh, K.A.; El-Yabroudi, M.Z.; El-Mousa, A.H. BPA-CRP: A balanced power-aware clustering and routing protocol for wireless sensor networks. Ad. Hoc Netw. 2018, 82, 155–171. [Google Scholar] [CrossRef]
- Darabkh, K.A.; Al-Akhras, M. Prolonging IoT Sensor Networks Lifetime for Different Smart City Applications Utilizing a Three-dimension MPA Based Fitness Function. In Proceedings of the 2024 IEEE 15th Annual Information Technology, Electronics and Mobile Communication Conference (IEMCON 2024), Berkeley, CA, USA, 24–26 October 2024. [Google Scholar]
- Darabkh, K.A.; Al-Akhras, M. A Five-dimension MPA Based Fitness Function for Optimizing Energy in IoT Sensor Networks Considering Various Smart City Applications. In Proceedings of the 2024 IEEE 15th Annual Information Technology, Electronics and Mobile Communication Conference (IEMCON 2024), Berkeley, CA, USA, 24–26 October 2024. [Google Scholar]
- Dehkordi, A.B. EDBLSD-IIoT: A comprehensive hybrid architecture for enhanced data security, reduced latency, and optimized energy in industrial IoT networks. J. Supercomput. 2025, 81, 359. [Google Scholar] [CrossRef]
- Rathee, M.; Kumar, S.; Dilip, K.; Dohare, U. Towards energy balancing optimization in wireless sensor networks: A novel quantum inspired genetic algorithm based sinks deployment approach. Ad. Hoc. Netw. 2023, 153, 103350. [Google Scholar] [CrossRef]
- Gad, A.G. Particle Swarm Optimization Algorithm and Its Applications: A Systematic Review. Arch. Comput. Methods Eng. 2022, 29, 2531–2561. [Google Scholar]
- Abdulzahra, A.M.K.; Al-Qurabat, A.K.M.; Abdulzahra, S.A. Optimizing energy consumption in WSN-based IoT using unequal clustering and sleep scheduling methods. Int. Things 2023, 22, 100765. [Google Scholar] [CrossRef]
- Rui, K. Improving energy efficiency in wireless sensor networks (WSNs) using two-level fuzzy clustering and Artificial Bee Colony (ABC) optimization. Int. J. Electron. 2025, 1–26. [Google Scholar] [CrossRef]
- Al-Betar, M.A.; Abu Doush, I.; Makhadmeh, S.N.; Al-Naymat, G.; Alomari, O.A.; Awadallah, M.A. Equilibrium optimizer: A comprehensive survey. Multimed. Tools Appl. 2023, 83, 29617–29666. [Google Scholar] [CrossRef]
- Shen, B.; Khishe, M.; Mirjalili, S. Evolving Marine Predators Algorithm by dynamic foraging strategy for real-world engineering optimization problems. Eng. Appl. Artif. Intell. 2023, 123, 106207. [Google Scholar] [CrossRef]
- Wang, Y.; Henning, I. A Deterministic Distributed TDMA Scheduling Algorithm for Wireless Sensor Networks. In Proceedings of the 2007 International Conference on Wireless Communications, Networking and Mobile Computing, Shanghai, China, 21–25 September 2007; pp. 2759–2762. [Google Scholar]
- Firouz, N.; Masdari, M.; Sangar, A.B.; Majidzadeh, K. A Hybrid Multi objective Algorithm for Imbalanced Controller Placement in Software Defined Networks. J. Netw. Syst. Manag. 2022, 30, 51. [Google Scholar] [CrossRef]


| Protocols | Objectives | PDFH Selection Algorithm | DFFF Parameters | Data Fusion Grouping Schemes | DFGs Number | RDFCF Parameters | Impairments Handling | Novel Examples |
|---|---|---|---|---|---|---|---|---|
| PSO-EEC [39] | Improve network lifespan | PSO | The ratio of SNs’ initial energy and RE, distance between DFGMs and PDFH, and SN degree | Distributed | Predefined | The RE of PDFH, distance between PDFH and the sink | x | x |
| LDIWPSOC [40] | Enhance energy efficiency | PSO | SN’s RE, average distance between PDFH and its DFGMs, and distance of PDFH from the sink | Hybrid * | Predefined | The nearest PDFH | x | x |
| OFCA [41] | Improve network lifespan | Fuzzy | The total RE of selected PDFHs, average distance from PDFHs to the sink, and total concentration of selected PDFHs | Centralized | Predefined | PSO SN’s RE, distance from the sink node, and concentration of PDFH | x | x |
| NPSOP [42] | Prolong the network lifespan | PSO | SN’s RE, average distance between PDFH and its DFGMs, and distance of PDFH from the sink node | Distributed | Predefined | PSO Energy consumption and load balance | x | x |
| Our proposed protocol without routing | Improve network lifespan, minimize energy consumption, and maintain load balancing | MPA | SN’s RE, average distance between DFGMs, distance to the sink node, PDFH rotation times, and ASBO | Hybrid | Dynamic | x | ✓ | ✓ |
| Our proposed protocol with multi-hop routing | Improve network lifespan, minimize energy consumption, and maintain load balancing | MPA | SN’s RE, average distance between DFGMs, distance to the sink node, PDFH rotation times, and ASBO | Hybrid | Dynamic | Distance between PDFH and candidate PDFR, distance between candidate PDFR and the sink node, RE of candidate PDFR, and ASBO | ✓ | ✓ |
| Feature | MPA | GA | PSO | ACO |
|---|---|---|---|---|
| Inspiration | Marine predators’ hunting and foraging behavior | Natural selection and genetics | Social behavior of bird flocks or fish schools | Foraging behavior of ants |
| Parameter dependency | Low, fewer parameters make it easy to tune | High, sensitive to mutation and crossover rates | Moderate, requires tuning of inertia, cognitive, and social factors | High, sensitive to pheromone decay rate and heuristic factors |
| Search mechanism | Lévy flight, Brownian motion, and adaptive hunting strategies | Selection, crossover, mutation | Velocity and position updates based on local/global best solutions | Pheromone trails and heuristic information |
| Complexity | Relatively low, easy to implement with few parameters | Moderate to high, requires complex operations like crossover | Moderate, requires tuning but simple operations | High, with pheromone updates and multiple iterations over paths |
| Exploration | Strong, with adaptive mechanisms for global exploration | Moderate, dependent on mutation rates | Strong, influenced by random velocity components | Moderate, relies on pheromone evaporation |
| Exploitation | Balanced, with adaptive strategies for local exploitation | Moderate, focuses on local exploitation post-crossover | Good, with convergence toward optimal regions | Good, but susceptible to local optima due to pheromone build-up |
| Convergence speed | Generally fast, with dynamic adjustment for convergence | Moderate to slow, often slower due to genetic operations | Fast, especially with appropriate parameter settings | Slow to moderate, depends on pheromone evaporation rate |
| Scalability | High, works well for large-scale optimization problems | Moderate, may struggle with very large-scale problems | High, performs well on various problem sizes | Moderate, can become computationally expensive with large problems |
| Limitations | Relatively new, less extensively tested across diverse applications | Prone to premature convergence and local optima | May stagnate at local optima if poorly tuned | Slow convergence, may become stuck in local optima |
| Network Size (W) | Hexagonal Side Length (S) | SNs Count (N) | IoT Application Type | The Sink Node Location |
|---|---|---|---|---|
| 100 × 100 m2 | 20 m | 25 | Smart logistics park | (0,75) |
| 200 × 200 m2 | 40 m | 100 | Smart medical center | (0,125) |
| 300 × 300 m2 | 60 m | 225 | Smart factories zone | (0,175) |
| 400 × 400 m2 | 80 m | 400 | Smart university | (0,225) |
| 500 × 500 m2 | 100 m | 625 | Smart city | (0,275) |
| Range | Interpretation | |
|---|---|---|
| Extremely close | ||
| Close | ||
| Moderately close | ||
| Moderately far | ||
| Far | ||
| Extremely far | ||
| Scale | Interpretation |
|---|---|
| 0.1 | Extremely close |
| 0.2 | Close |
| 0.3 | Moderately close |
| 0.4 | Moderately far |
| 0.5 | Far |
| 0.6 | Extremely far |
| Scale | Interpretation |
|---|---|
| 0.2 | Extremely close |
| 0.3 | Close |
| 0.4 | Moderately close |
| 0.5 | Moderately far |
| 0.6 | Far |
| 0.7 | Extremely far |
| Scale | Interpretation |
|---|---|
| 0.3 | Extremely close |
| 0.4 | Close |
| 0.5 | Moderately close |
| 0.6 | Moderately far |
| 0.7 | Far |
| 0.8 | Extremely far |
| SN ID | Message Arrival Time (ms) | Type | DFG ID | PDFH ID | Rank | TDMA TS Number |
|---|---|---|---|---|---|---|
| 20 | 10 | “NDFGM” | 6 | 10 | 1 | 1 |
| 16 | 15 | “NDFGM” | 6 | 10 | 2 | 2 |
| 4 | 16 | “NDFGM” | 6 | 10 | 3 | 3 |
| 32 | 20 | “NDFGM” | 6 | 10 | 4 | 4 |
| 10 | 7 | “PDFH” | 6 | 10 | 5 | 5 |
| Classification of Parameters | Parameter Name | Value for the First Scenario | Value for the Second Scenario |
|---|---|---|---|
| Network parameter | Network sensing area (W × W) | 100 × 100 m2 | 500 × 500 m2 |
| Number of SNs (N) | 100 nodes | 300 nodes | |
| The sink node position (x,y) | (0,75) | (0,275) | |
| Number of DFGs (C) | Dynamic | ||
| Type of SNs deployment | Random | ||
| Packet parameters | Data packet length (NLD) | 4000 bits | |
| Control packet length (NLC) | 200 bits | ||
| Number of packets | Variable | ||
| Simulator | MATLAB R2020 | ||
| Energy parameters | SN’s initial energy (EIo) | 1 J | |
| Electronic energy (Eelec) | 50 nJ/bit | ||
| Energy data aggregation (Efusion) | 5 nJ/bit | ||
| Energy consumed by the transmission amplifier () | 10 pJ/bit/ | ||
| Energy consumed by the transmission amplifier () | 0.0013 pJ/bit/ | ||
| The cutoff distance (do) | 87.7 m | ||
| Execution parameters | Number of simulation rounds | Variable | |
| Maximum number of rounds | 60,000 rounds | ||
| Number of simulations runs | 50 runs | ||
| Scenarios | Metric | PSO-EEC | LDIWPSO | OFCA | NPSOP |
|---|---|---|---|---|---|
| Scenario #1: Number of SNs: 100 Network area: 100 × 100 m2 | HND | 264% | 323% | 271% | 260% |
| LND | 210% | 183% | 216% | 171% | |
| Scenario #2: Number of SNs: 300 Network area: 500 × 500 m2 | HND | 336% | 422% | 373% | 325% |
| LND | 198% | 352% | 577% | 144% | |
| Scenario #3: Number of SNs: 600 Network area: 500 × 500 m2 | HND | 277% | 240% | 218% | 191% |
| LND | 717% | 638% | 573% | 536% |
| Scenarios | Metric | PSO-EEC | LDIWPSO | OFCA | NPSOP | Proposed Protocol Without Routing |
|---|---|---|---|---|---|---|
| Scenario #1: Number of SNs: 100 Network area: 100 × 100 m2 | HND | 276% | 337% | 284% | 272% | 3% |
| LND | 299% | 264% | 306% | 249% | 29% | |
| Scenario #2: Number of SNs: 300 Network area: 500 × 500 m2 | HND | 672% | 825% | 738% | 652% | 77% |
| LND | 447% | 727% | 1140% | 348% | 83% | |
| Scenario #3: Number of SNs: 600 Network area: 500 × 500 m2 | HND | 654% | 579% | 537% | 482% | 100% |
| LND | 1297% | 1162% | 1051% | 987% | 71% |
| Items | Protocols Considred in Comparision | HND | Improvement Ratios for the Proposed Protocol Without Routing | Improvement Ratios for the Proposed Protocol with Multi-Hop Routing | LND | Improvement Ratio for the Proposed Protocol Without Routing | Improvement Ratio for the Proposed Protocol with Multi-Hop Routing |
|---|---|---|---|---|---|---|---|
| Scenario #1 Number of SNs: 100 Number of DFHs: 10% Network area: 100 × 100 m2 | PSO-EEC | 1310 | 235% | 314% | 1933 | 135% | 261% |
| LDIWPSO | 1288 | 241% | 321% | 1352 | 236% | 416% | |
| OFCA | 1415 | 211% | 283% | 1776 | 156% | 293% | |
| NPSOP | 1465 | 200% | 270% | 2078 | 119% | 236% | |
| Proposed protocol without routing | 4395 | NA | 23% | 4546 | NA | 53% | |
| Proposed protocol with multi-hop routing | 5423 | NA | NA | 6977 | NA | NA | |
| Scenario #1 Number of SNs: 100 Number of DFHs: 5% Network area: 100 × 100 m2 | PSO-EEC | 1208 | 264% | 349% | 1749 | 160% | 299% |
| LDIWPSO | 1040 | 323% | 421% | 1917 | 137% | 264% | |
| OFCA | 1184 | 271% | 358% | 1717 | 165% | 306% | |
| NPSOP | 1221 | 260% | 344% | 2000 | 127% | 249% | |
| Proposed protocol without routing | 4395 | NA | 23% | 4546 | NA | 53% | |
| Proposed protocol with multi-hop routing | 5423 | NA | NA | 6977 | NA | NA | |
| Scenario #2 Number of SNs: 300 Number of DFHs: 10% Network area: 500 × 500 m2 | PSO-EEC | 256 | 414% | 811% | 396 | 517% | 1030% |
| LDIWPSO | 277 | 375% | 742% | 380 | 543% | 1078% | |
| OFCA | 307 | 329% | 659% | 367 | 566% | 1120% | |
| NPSOP | 318 | 314% | 633% | 397 | 515% | 1027% | |
| Proposed protocol without routing | 1316 | NA | 77% | 2443 | NA | 83% | |
| Proposed protocol with multi-hop routing | 2331 | NA | NA | 4476 | NA | NA | |
| Scenario #2 Number of SNs: 300 Number of DFHs: 5% Network area: 500 × 500 m2 | PSO-EEC | 302 | 336% | 672% | 819 | 198% | 447% |
| LDIWPSO | 252 | 422% | 825% | 541 | 352% | 727% | |
| OFCA | 278 | 373% | 738% | 361 | 577% | 1140% | |
| NPSOP | 310 | 325% | 652% | 1000 | 144% | 348% | |
| Proposed protocol without routing | 1316 | NA | 77% | 2443 | NA | 83% | |
| Proposed protocol with multi-hop routing | 2331 | NA | NA | 4476 | NA | NA |
| Items | Protocols Considred in Comparision | Improvement Ratio for the Proposed Protocol Without Routing | Improvement Ratio for the Proposed Protocol with Multi-Hop Routing |
|---|---|---|---|
| Scenario #1 Number of SNs: 100 Number of CHs: 10% Network area: 100 × 100 m2 | PSO-EEC | 135% | 260% |
| LDIWPSO | 225% | 399% | |
| OFCA | 133% | 258% | |
| NPSOP | 143% | 273% | |
| Proposed protocol without routing | NA | 53% | |
| Proposed protocol with multi-hop routing | NA | NA | |
| Scenario #1 Number of SNs: 100 Number of CHs: 5% Network area: 100 × 100 m2 | PSO-EEC | 131% | 254% |
| LDIWPSO | 137% | 264% | |
| OFCA | 126% | 247% | |
| NPSOP | 130% | 253% | |
| Proposed protocol without routing | NA | 53% | |
| Proposed protocol with multi-hop routing | NA | NA | |
| Scenario #2 Number of SNs: 300 Number of CHs: 5% Network area: 500 × 500 m2 | PSO-EEC | 194% | 438% |
| LDIWPSO | 190% | 432% | |
| OFCA | 190% | 432% | |
| NPSOP | 128% | 317% | |
| Proposed protocol without routing | NA | 83% | |
| Proposed protocol with multi-hop routing | NA | NA | |
| Scenario #2 Number of SNs: 300 Number of CHs: 10% Network area: 500 × 500 m2 | PSO-EEC | 534% | 1063% |
| LDIWPSO | 573% | 1133% | |
| OFCA | 490% | 981% | |
| NPSOP | 468% | 941% | |
| Proposed protocol without routing | NA | 83% | |
| Proposed protocol with multi-hop routing | NA | NA |
| Items | Protocols Considred in Comparision | Throughput (×108) | Improvement Ratio for the Proposed Protocol Without Routing | Improvement Ratio for the Proposed Protocol with Multi-Hop Routing |
|---|---|---|---|---|
| Scenario #1 Number of SNs: 100 Number of DFHs: 10% Network area: 100 × 100 m2 | PSO-EEC | 4.3543 | 51% | 66% |
| LDIWPSO | 4.5695 | 44% | 58% | |
| OFCA | 4.8841 | 35% | 48% | |
| NPSOP | 4.9338 | 33% | 47% | |
| Proposed protocol without routing | 6.5752 | NA | 10% | |
| Proposed protocol with multi-hop routing | 7.2344 | NA | NA | |
| Scenario #1 Number of SNs: 100 Number of DFHs: 5% Network area: 100 × 100 m2 | PSO-EEC | 4.3295 | 52% | 67% |
| LDIWPSO | 4.5530 | 44% | 59% | |
| OFCA | 4.7434 | 39% | 53% | |
| NPSOP | 4.8179 | 36% | 50% | |
| Proposed protocol without routing | 6.5752 | NA | 10% | |
| Proposed protocol with multi-hop routing | 7.2344 | NA | NA | |
| Scenario #2 Number of SNs: 300 Number of DFHs: 10% Network area: 300 × 300 m2 | PSO-EEC | 2.8610 | 89% | 101% |
| LDIWPSO | 3.5661 | 51% | 61% | |
| OFCA | 3.4373 | 57% | 67% | |
| NPSOP | 3.8712 | 40% | 48% | |
| Proposed protocol without routing | 5.4008 | NA | 6% | |
| Proposed protocol with multi-hop routing | 5.7432 | NA | NA | |
| Scenario #2 Number of SNs: 300 Number of DFHs: 5% Network area: 300 × 300 m2 | PSO-EEC | 2.5288 | 114% | 127% |
| LDIWPSO | 3.1322 | 72% | 83% | |
| OFCA | 2.4949 | 116% | 130% | |
| NPSOP | 3.2475 | 66% | 77% | |
| Proposed protocol without routing | 5.4008 | NA | 6% | |
| Proposed protocol with multi-hop routing | 5.7432 | NA | NA |
Disclaimer/Publisher’s Note: The statements, opinions and data contained in all publications are solely those of the individual author(s) and contributor(s) and not of MDPI and/or the editor(s). MDPI and/or the editor(s) disclaim responsibility for any injury to people or property resulting from any ideas, methods, instructions or products referred to in the content. |
© 2025 by the authors. Licensee MDPI, Basel, Switzerland. This article is an open access article distributed under the terms and conditions of the Creative Commons Attribution (CC BY) license (https://creativecommons.org/licenses/by/4.0/).
Share and Cite
Darabkh, K.A.; Al-Akhras, M. Evolutionary Cost Analysis and Computational Intelligence for Energy Efficiency in Internet of Things-Enabled Smart Cities: Multi-Sensor Data Fusion and Resilience to Link and Device Failures. Smart Cities 2025, 8, 64. https://doi.org/10.3390/smartcities8020064
Darabkh KA, Al-Akhras M. Evolutionary Cost Analysis and Computational Intelligence for Energy Efficiency in Internet of Things-Enabled Smart Cities: Multi-Sensor Data Fusion and Resilience to Link and Device Failures. Smart Cities. 2025; 8(2):64. https://doi.org/10.3390/smartcities8020064
Chicago/Turabian StyleDarabkh, Khalid A., and Muna Al-Akhras. 2025. "Evolutionary Cost Analysis and Computational Intelligence for Energy Efficiency in Internet of Things-Enabled Smart Cities: Multi-Sensor Data Fusion and Resilience to Link and Device Failures" Smart Cities 8, no. 2: 64. https://doi.org/10.3390/smartcities8020064
APA StyleDarabkh, K. A., & Al-Akhras, M. (2025). Evolutionary Cost Analysis and Computational Intelligence for Energy Efficiency in Internet of Things-Enabled Smart Cities: Multi-Sensor Data Fusion and Resilience to Link and Device Failures. Smart Cities, 8(2), 64. https://doi.org/10.3390/smartcities8020064