
A Cross-Sectional Study on the Public Perception of Autonomous Demand-Responsive Transits (ADRTs) in Rural Towns: Insights from South-East Queensland


Abstract
Highlights
- Explores the socio-psychological and operational suitability and impacts of ADRTs in rural transport networks through operational scenarios.
- Highlights the heterogeneity among demographics, evaluating the influence of socio-demographic factors on ADRT implementation in rural settings.
- The study’s insights guide the development of practical applications and policy frameworks for ADRT implementation in rural settings, highlighting the necessity for demographic-specific trials and tailored services to meet diverse needs.
Abstract
1. Introduction
2. Materials and Methods
2.1. Variable Selection

| Attributes | Source |
|---|---|
| Suitable vehicle types for ADRTs | [44,59,66,67] |
| Suitable service offerings for ADRTs | [9,11,19,37] |
| Suitable trip purposes for ADRTs | [9,44,45,68,69,70] |
| Suitable demographic groups for ADRTs | [3,9,71] |
| Suitable land use for ADRTs | [71,72,73] |
| Impacts on passenger performance from ADRTs | [9,26,44,47,74] |
| Social impacts from ADRTs | [3,75,76] |
| Environmental impacts from ADRTs | [36,43,77,78] |
2.2. Survey Design
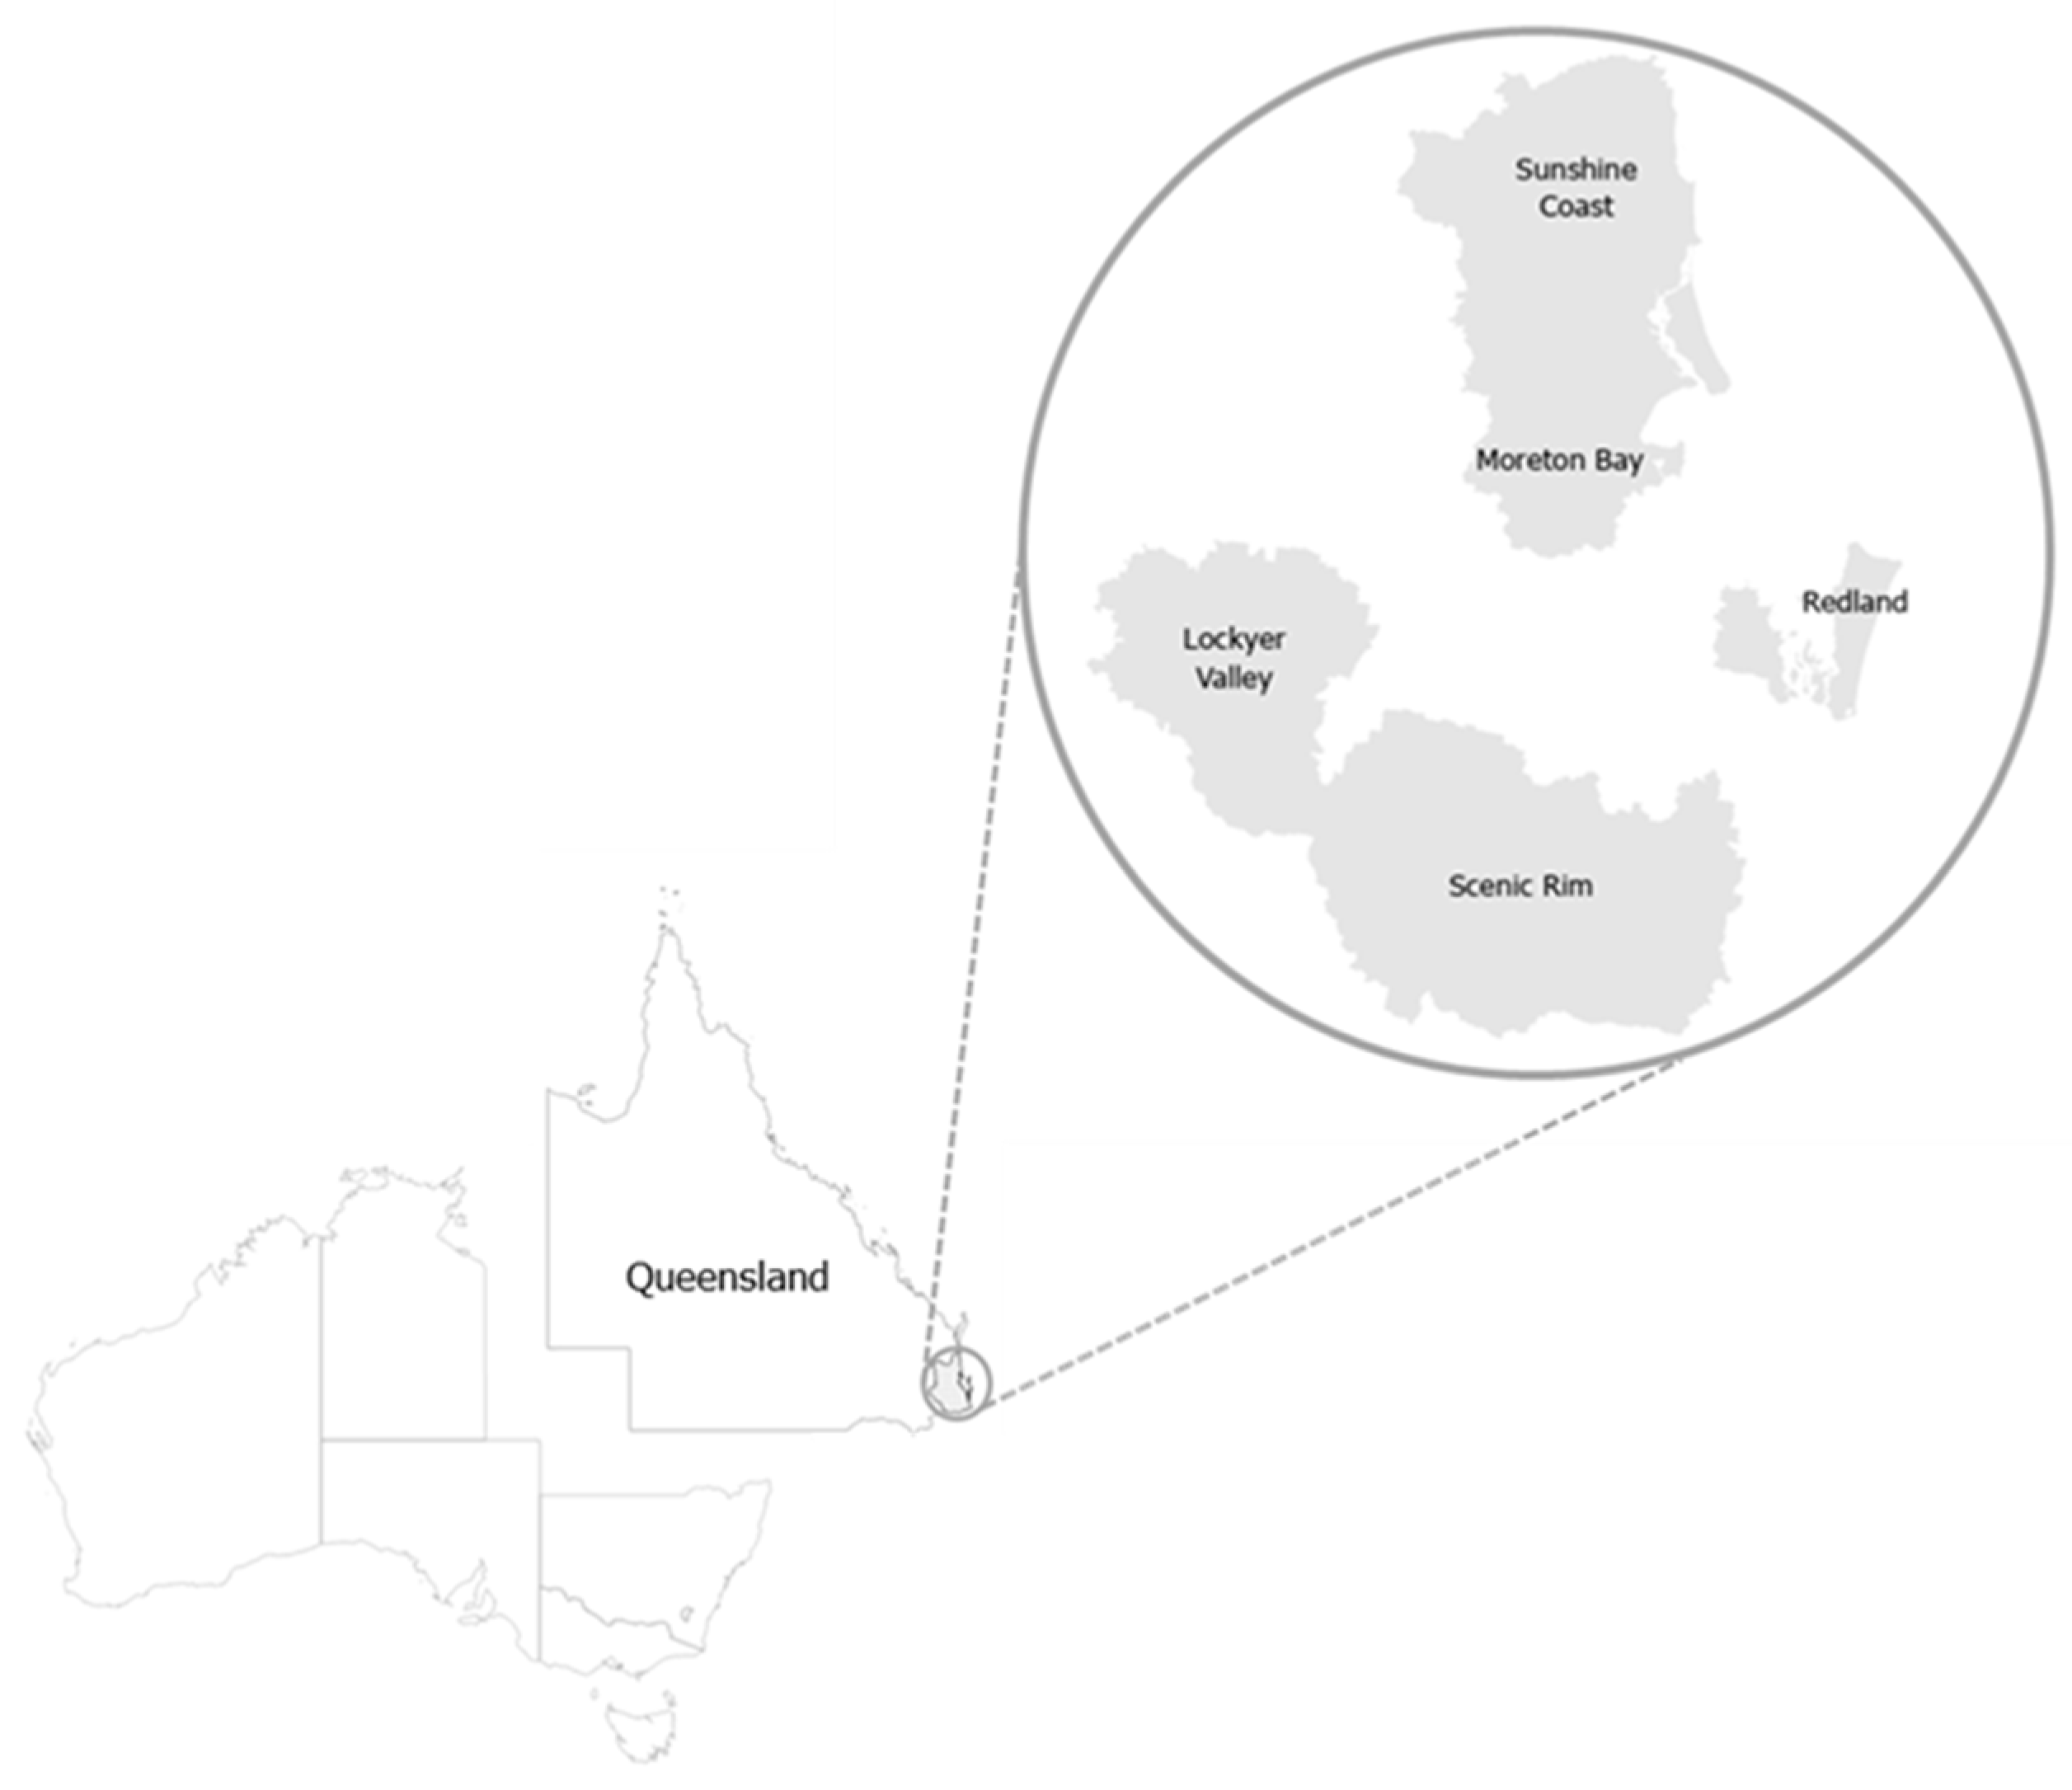
2.3. Study Setting
2.4. Participant Recruitment
2.5. Analytical Approach
3. Results
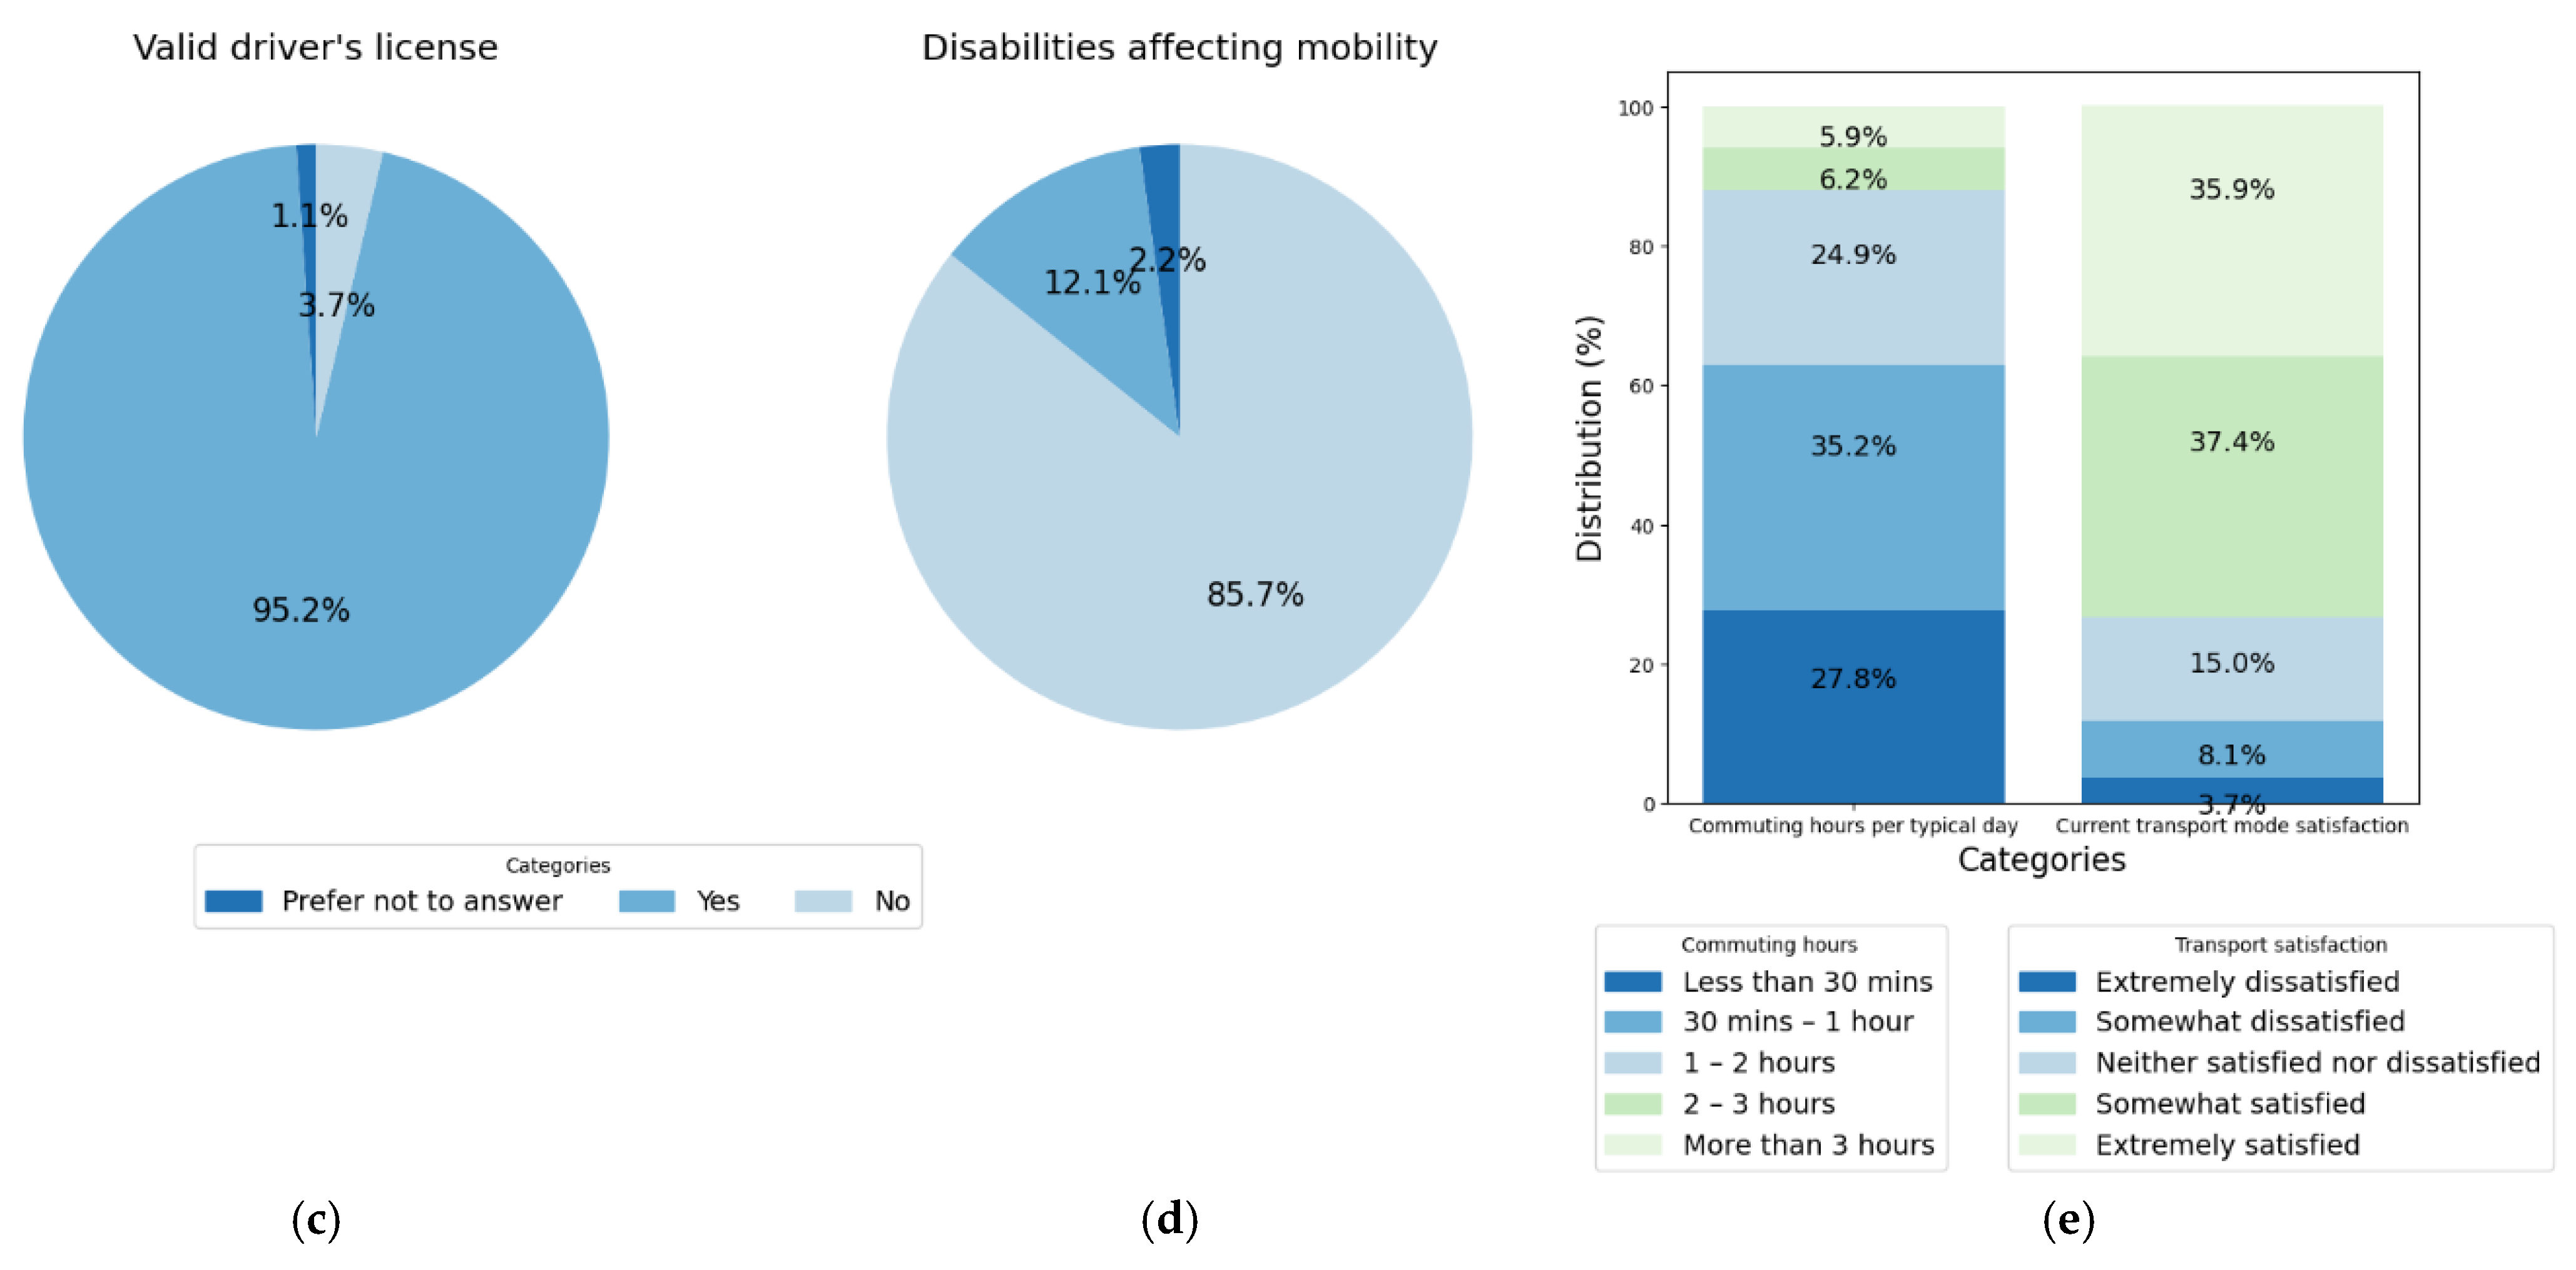
3.1. Socio-Demographic Profile of Respondents
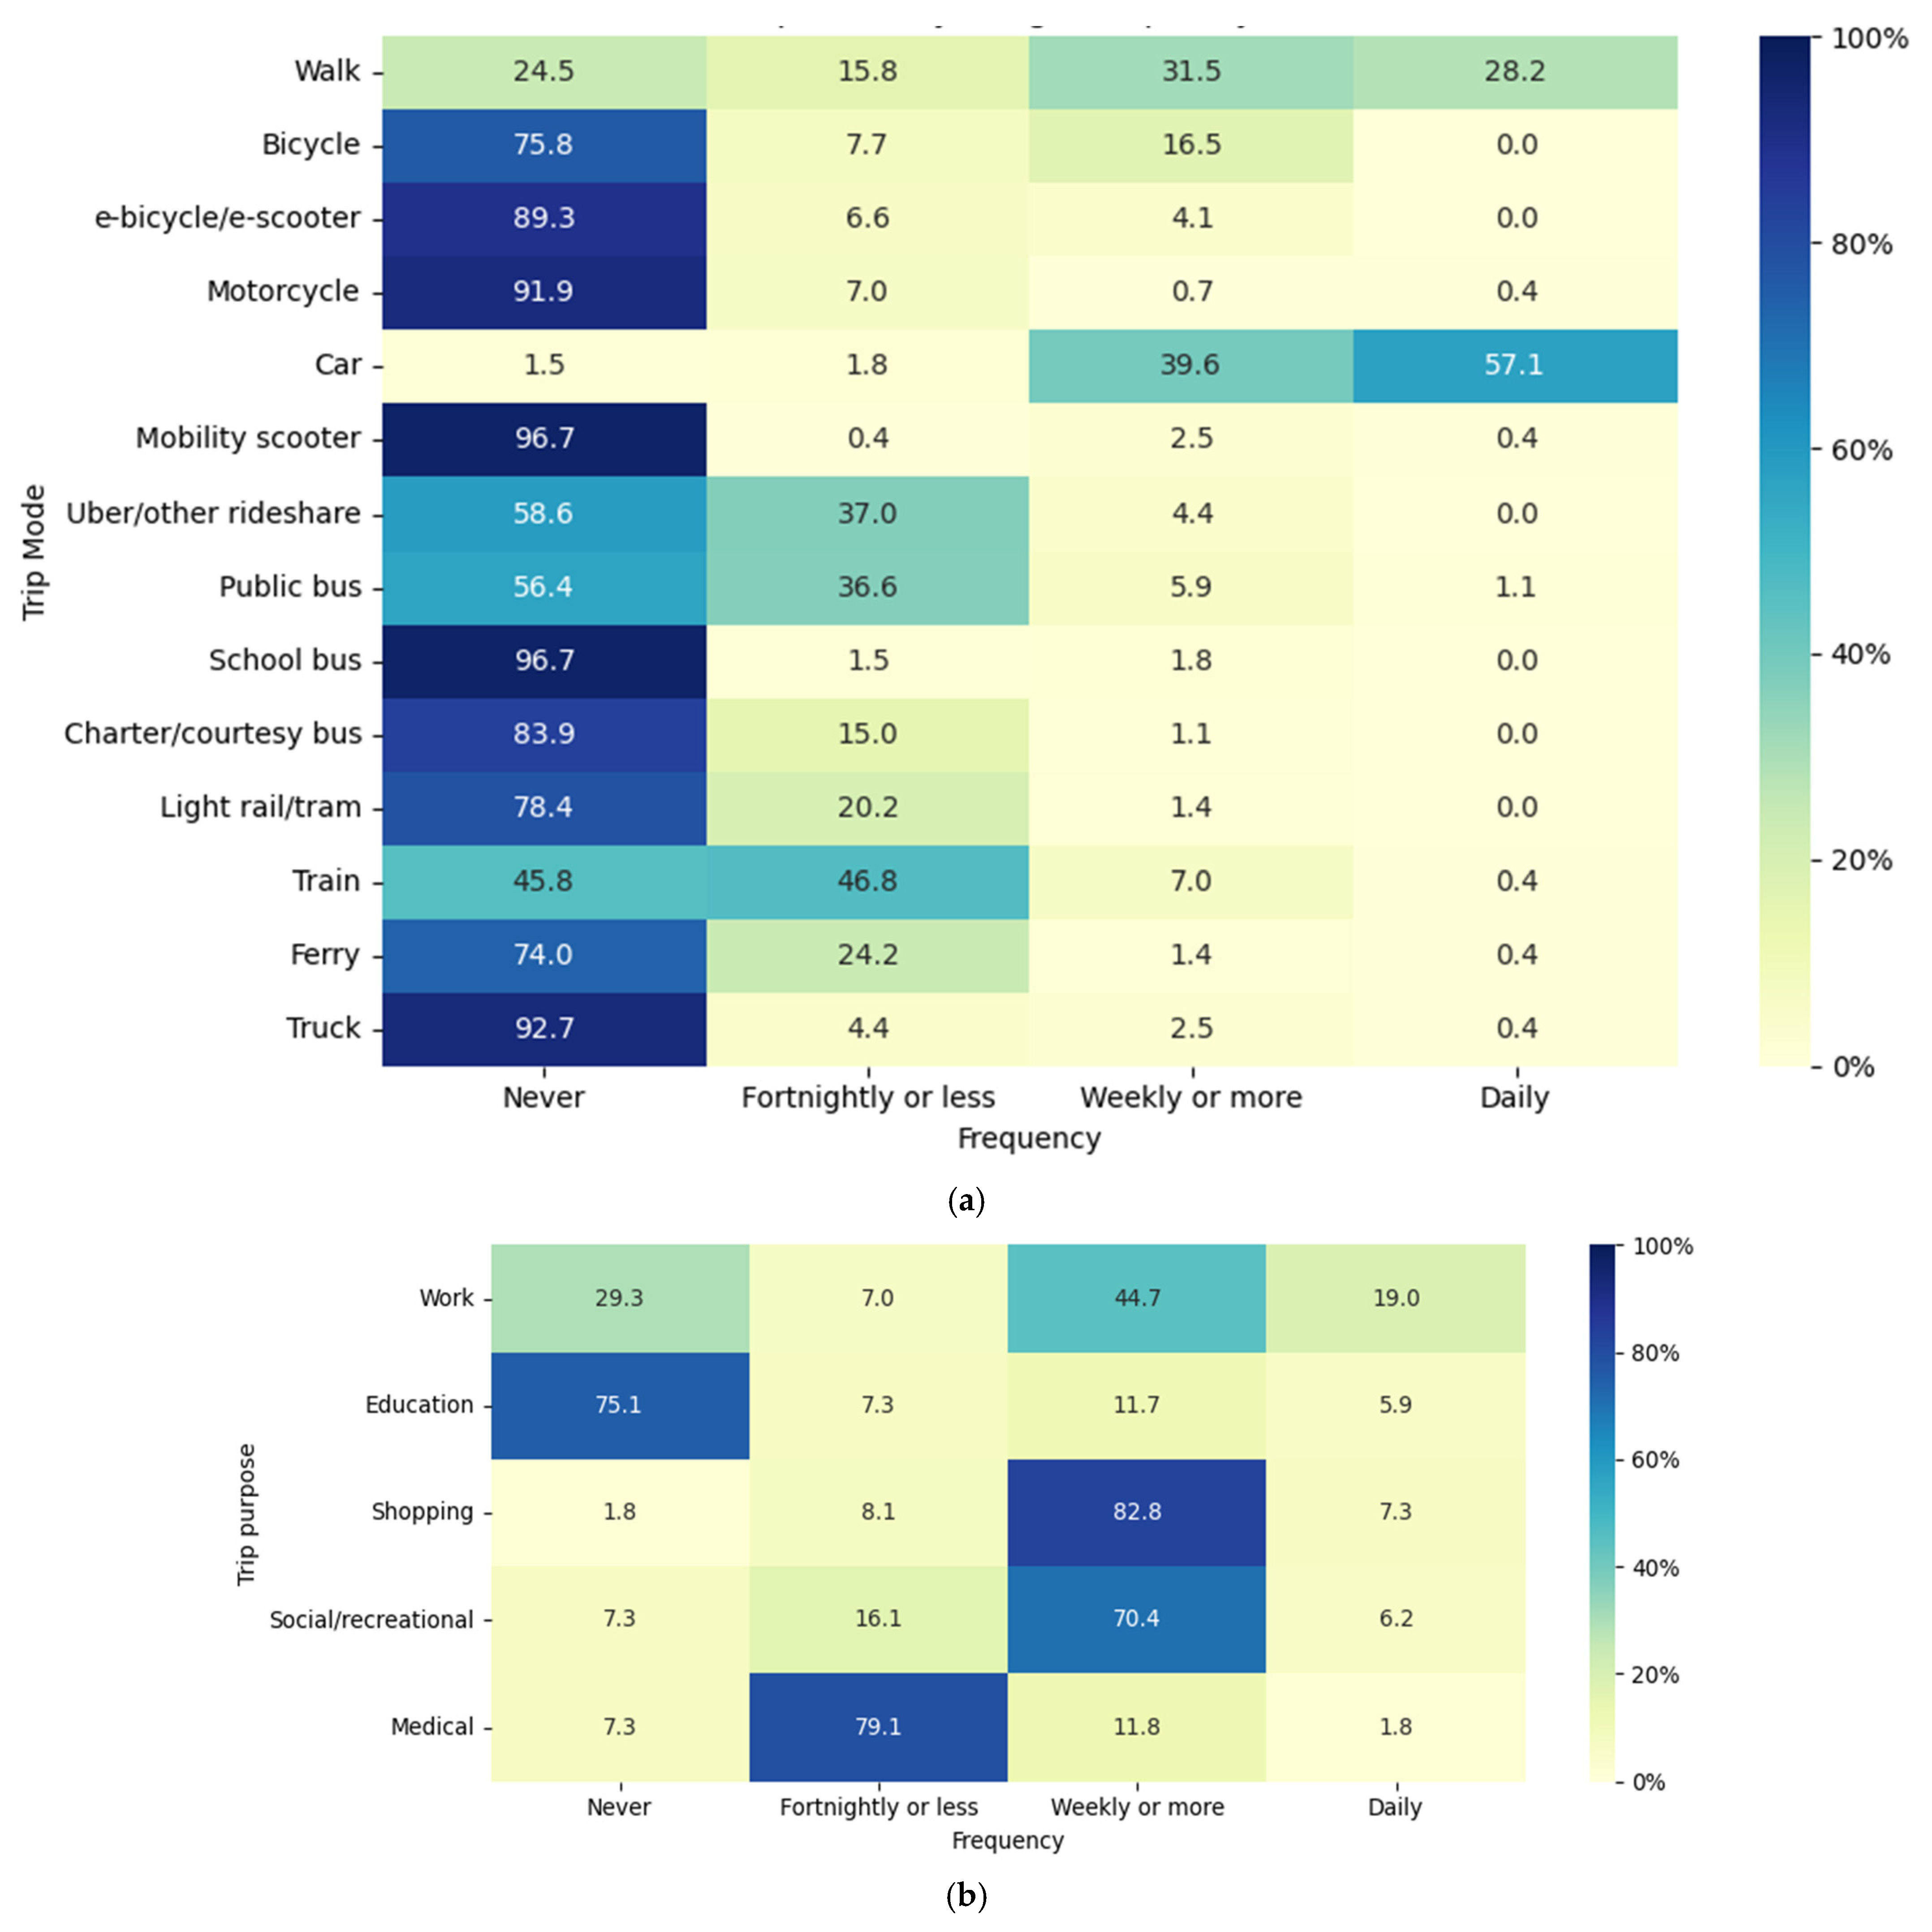
3.2. Current Travel Patterns of Respondents
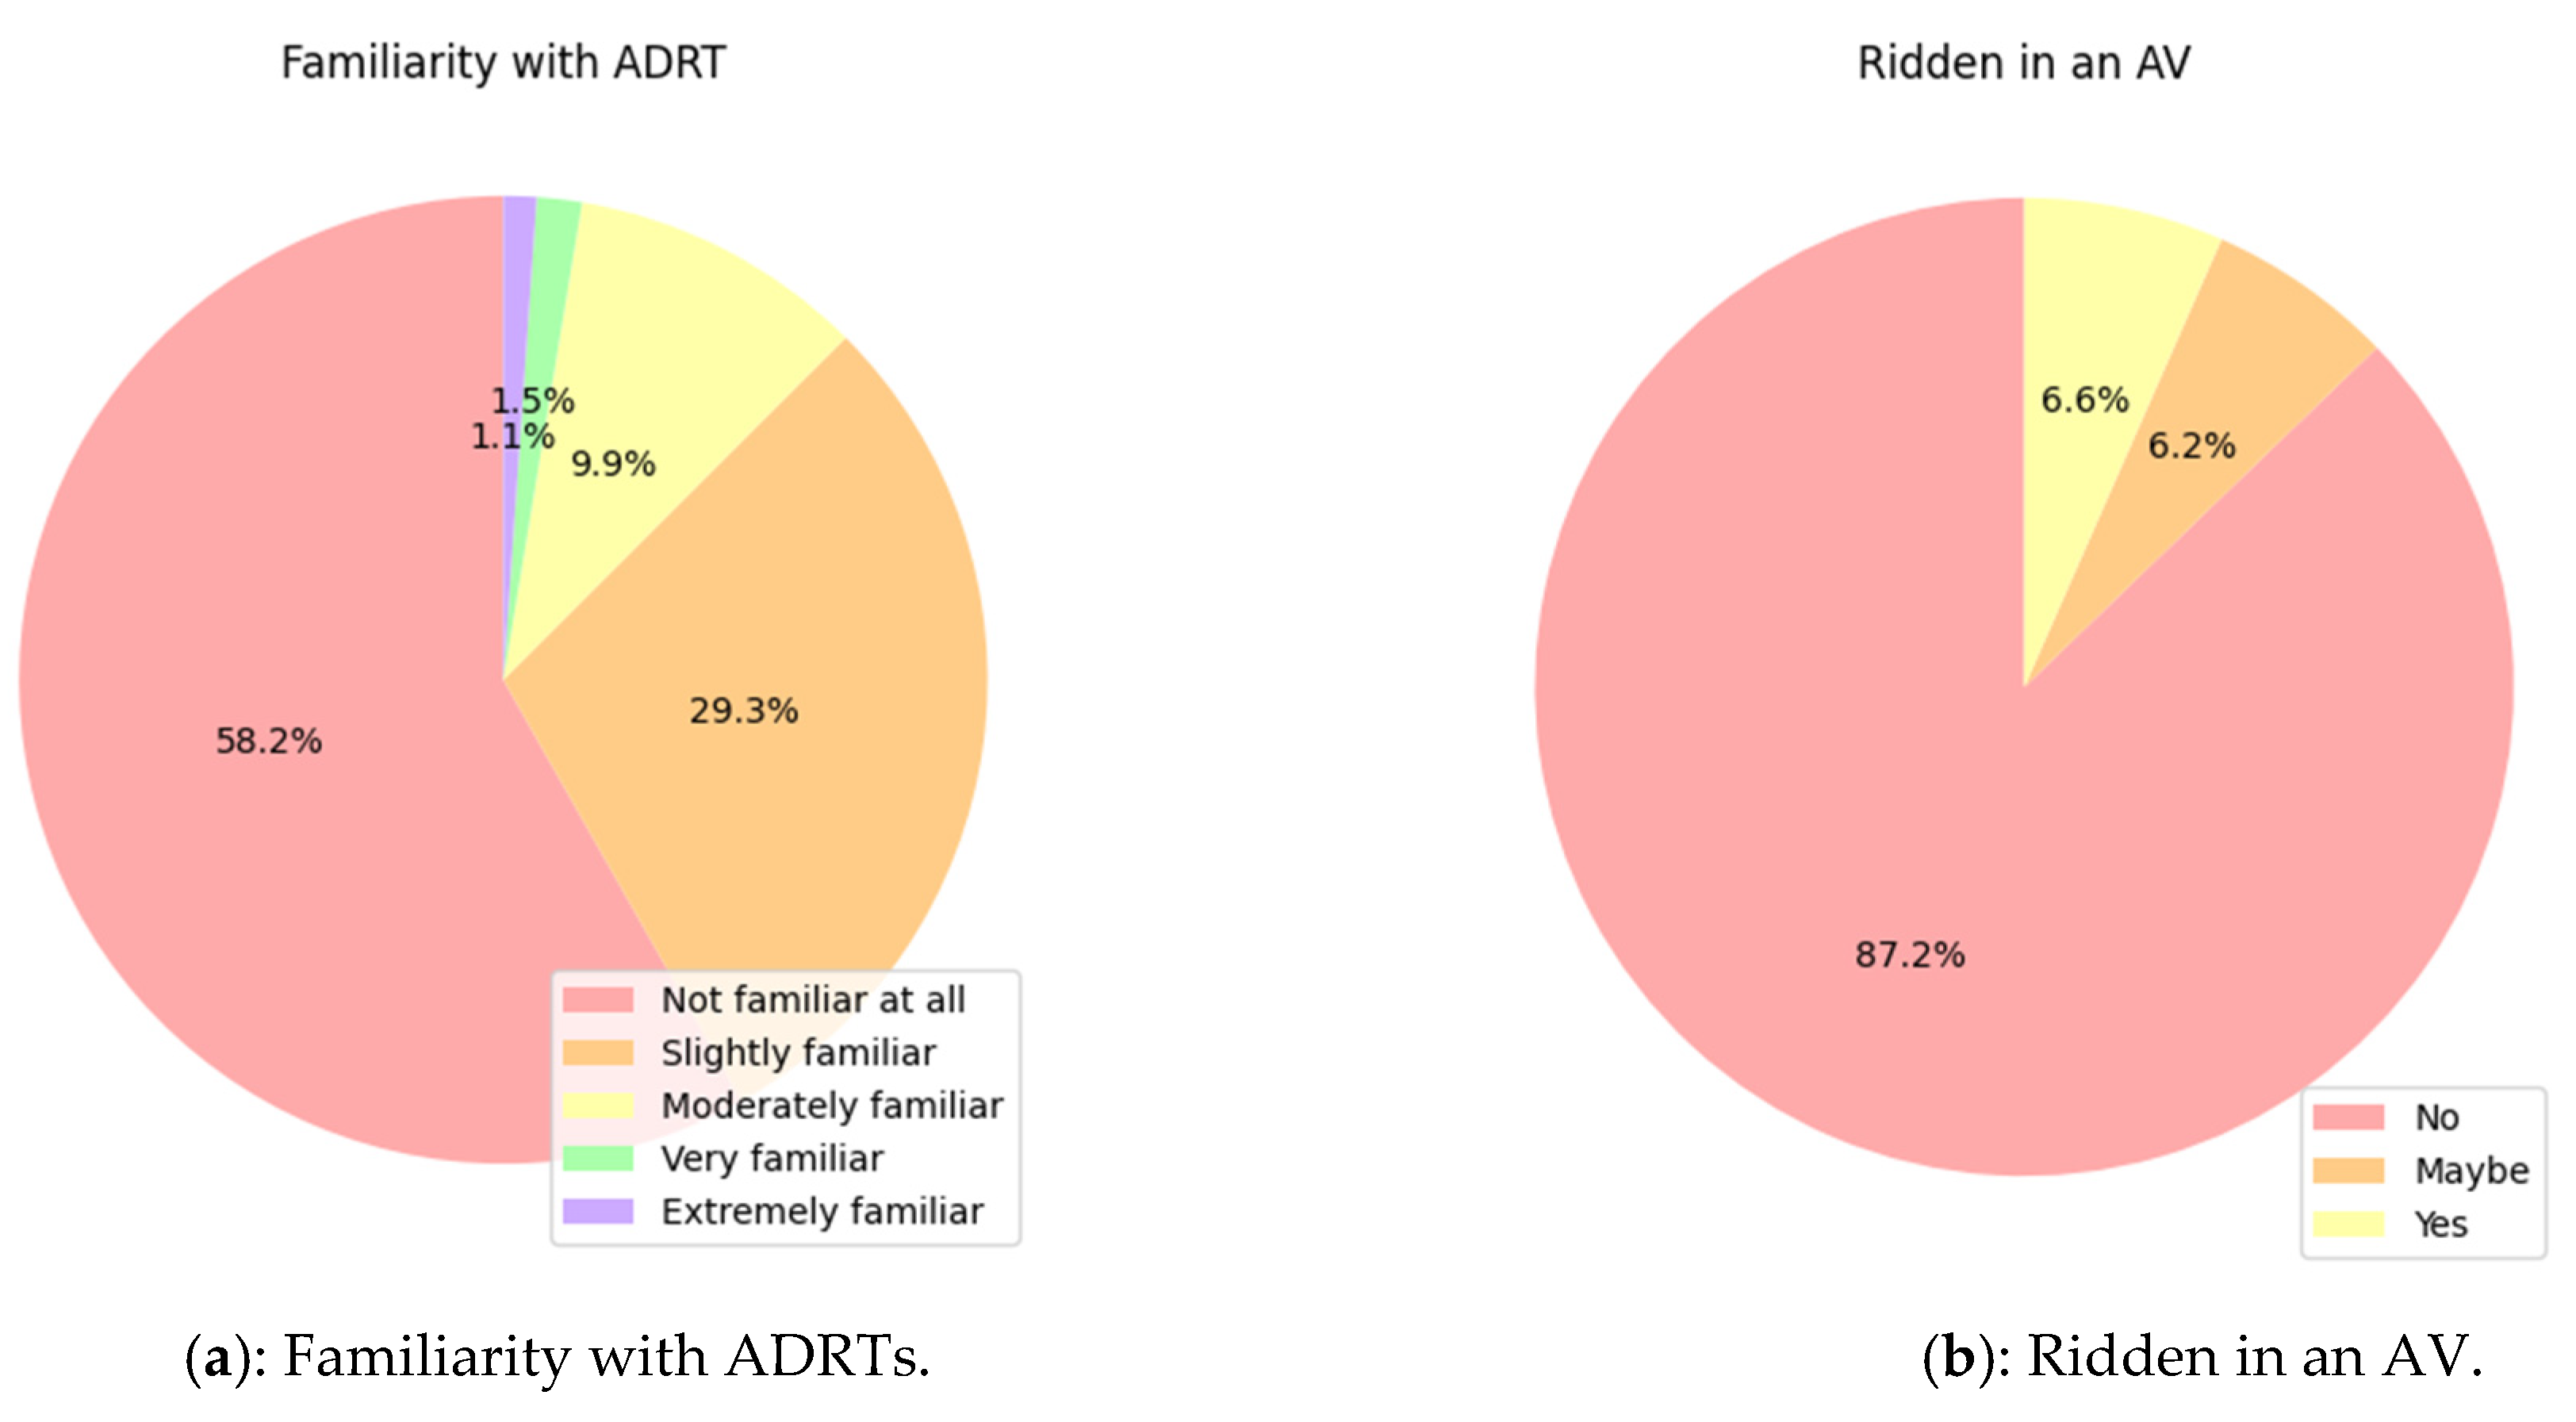
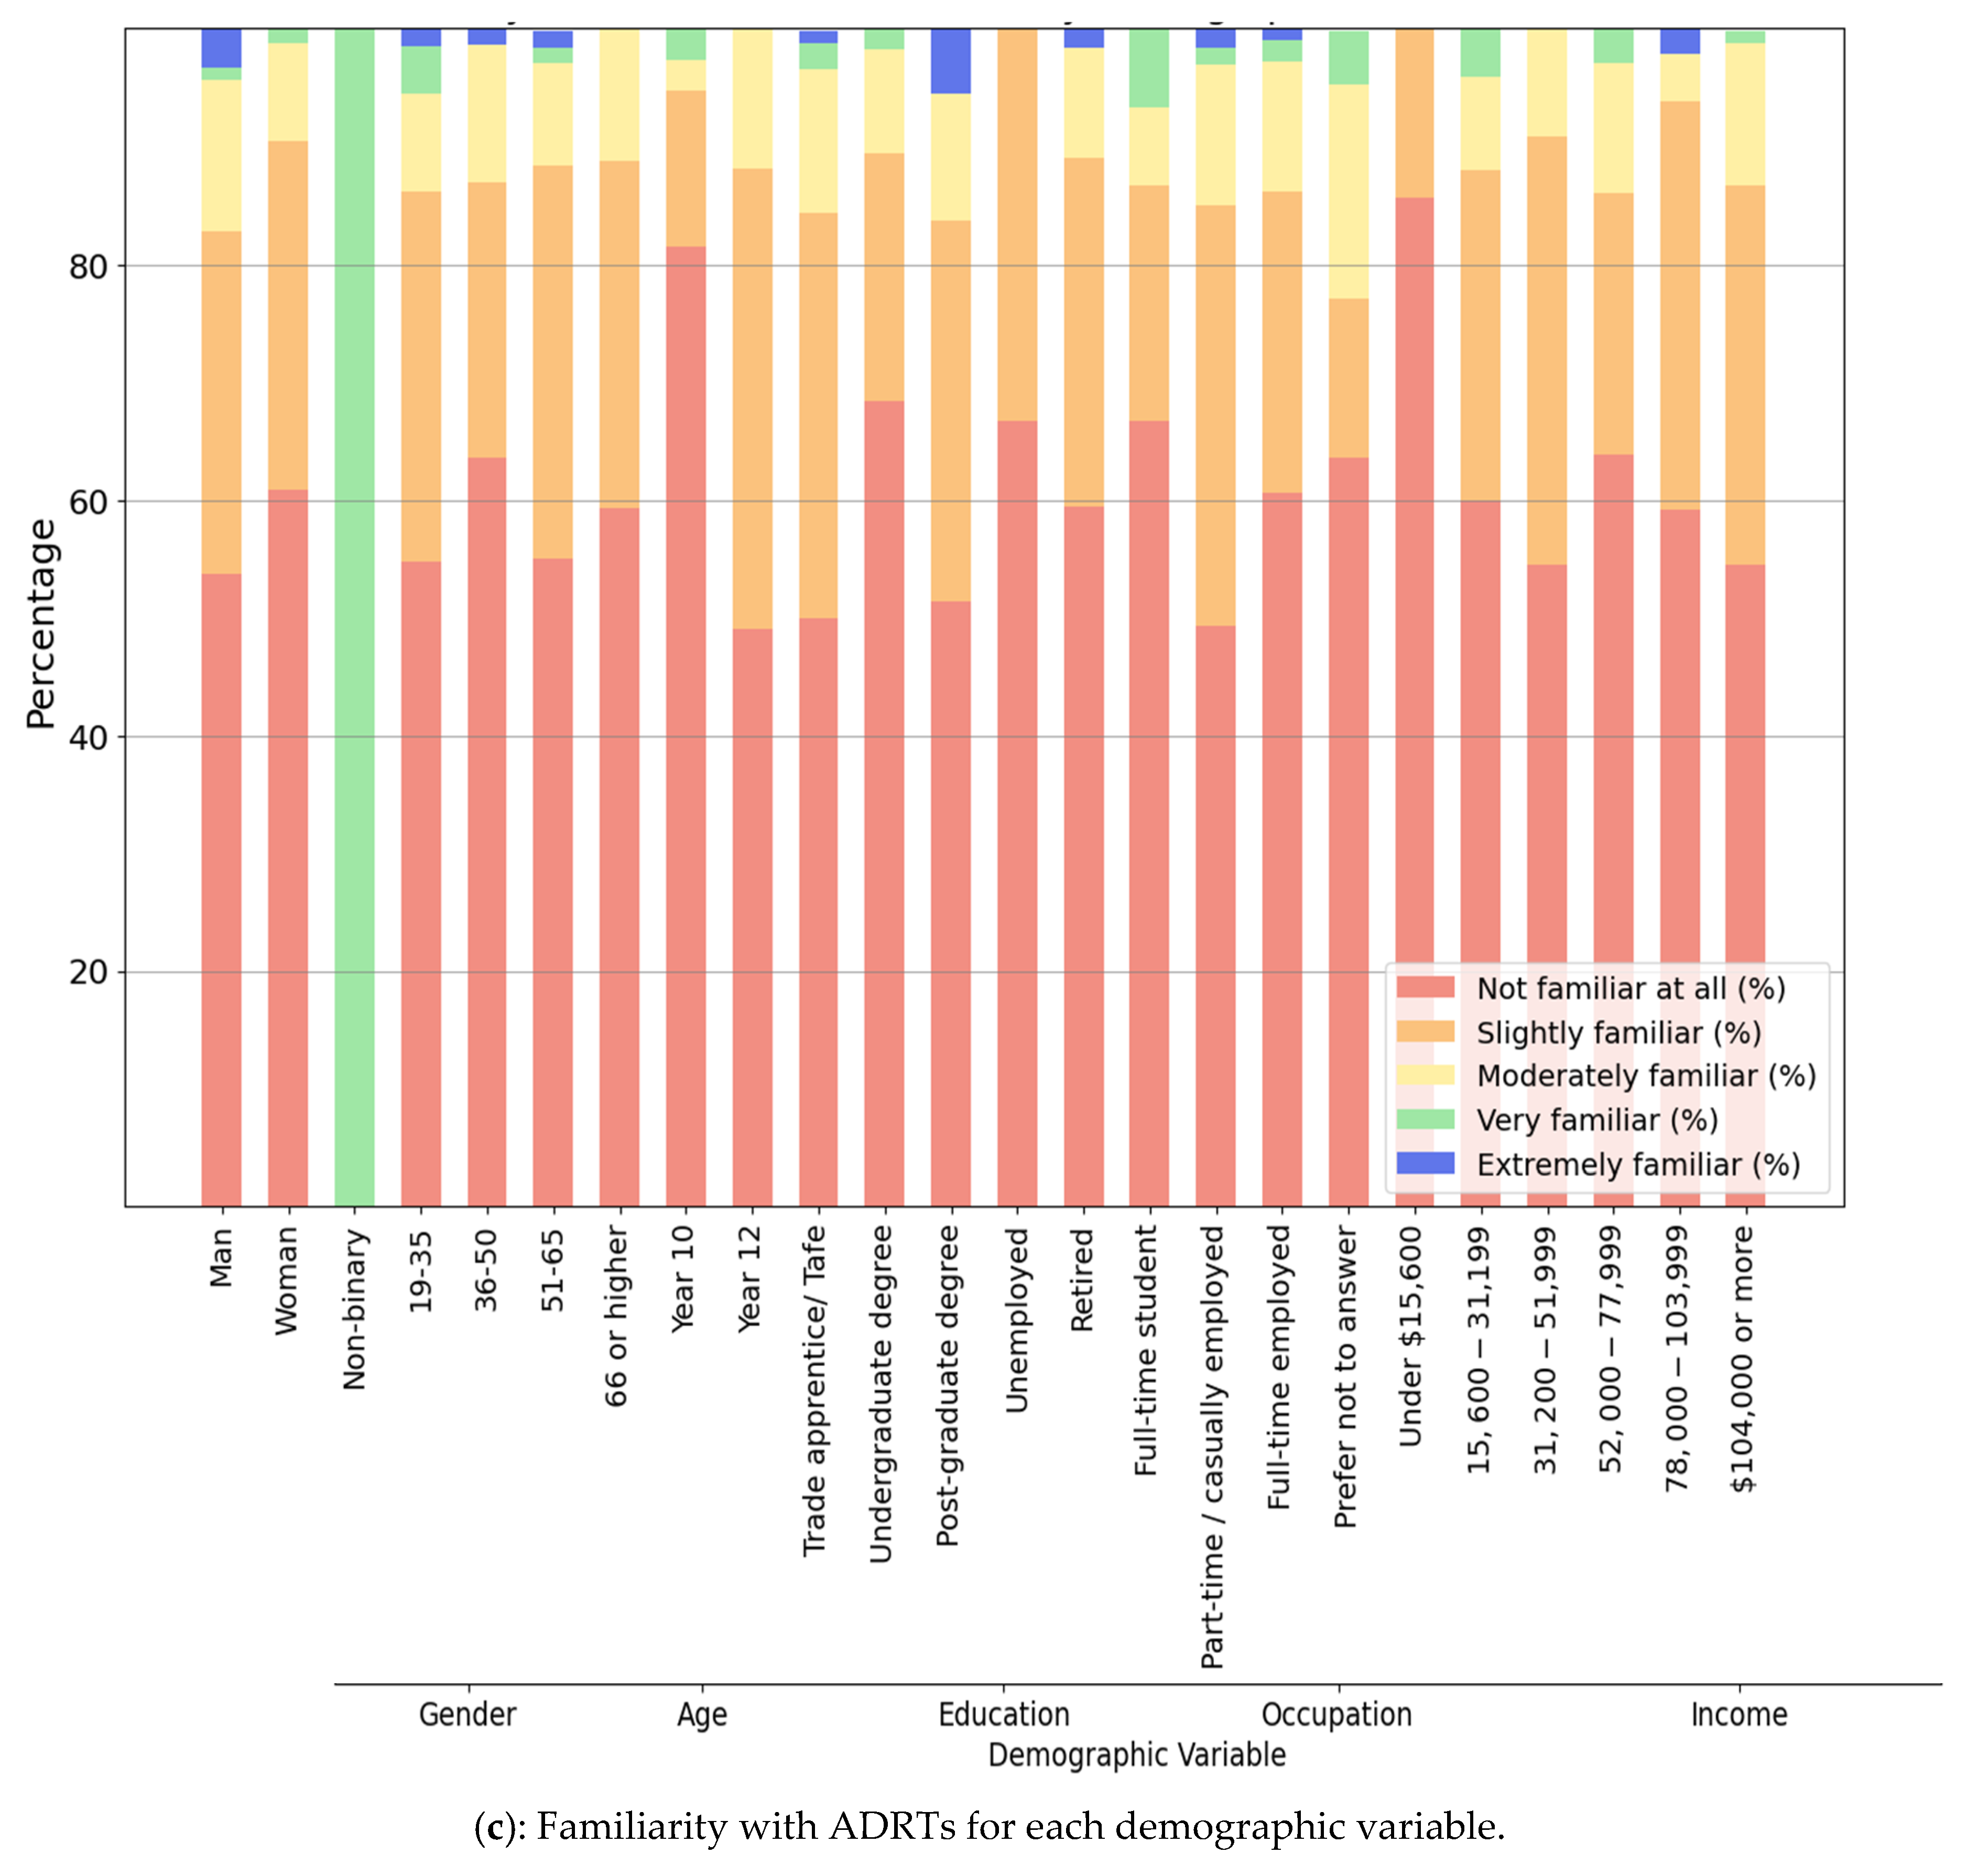
3.3. General Perception of ADRTs
3.4. Perceived Suitability of ADRTs
3.4.1. Vehicle Type
3.4.2. Service Offerings
3.4.3. Trip Purpose
3.4.4. Demographic Groups
3.4.5. Land Use
3.5. Perceived Impacts of ADRTs
3.5.1. Passenger Performance
3.5.2. Social Impacts
3.5.3. Environmental Impacts
3.6. Heterogeneity in Perceptions of Suitability and Impacts of ADRTs
3.7. Effect of Demographics on Perceptions
4. Discussion
5. Practice and Policy Implications
- Provide subsidies to low-income users.
- Encourage ADRT adoption among less educated and unemployed individuals through subsidies, discounted fares, or integration with social welfare programs.
- Enhance knowledge through awareness programs.
- Conduct awareness campaigns for specific demographic groups.
- Promote ADRT usage among students by offering discounted or free access for academic-related travel.
- Form partnerships with employers to attract higher-income users.
- Target professionals and students with app-driven ADRTs.
- Conduct pilot studies to assess gender-specific uptake in rural settings.
- Prioritise women’s safety through cameras and emergency features.
- Develop safety regulations and training programs emphasising gender sensitivity.
- Conduct pilot trials in retirement villages.
- Develop community-based workshops and digital literacy programs for older adults.
- Design user interfaces with accessibility features for age-related limitations.
- Mandate interoperability standards for ADRT integration.
- Mandate universal design standards and subsidise fares for mobility-disadvantaged groups.
- Avoid the complete automation of existing buses.
- Operate ADRT services in concentrated nodes and avoid rural overextension.
- Prioritise operations in high-scoring lands such as rural town centres, university precincts, and tourist destinations.
- Link services in low-demand areas to urban climate goals with renewable energy incentives.
- Establish clear guidelines for ADRT implementation in rural areas.
- Ensure regulations are flexible to accommodate rural challenges.
- Facilitate multi-stakeholder partnerships for co-designing ADRT systems.
6. Conclusions
7. Limitations and Future Research Directions
Author Contributions
Funding
Data Availability Statement
Acknowledgments
Conflicts of Interest
Abbreviations
| ADRT | Autonomous Demand-Responsive Transit |
| AV | Autonomous Vehicle |
| DRT | Demand-Responsive Transit |
| FMLM | First mile/last mile |
| GHG | Greenhouse gas |
| PT | Public transport |
| SAV | Shared Autonomous Vehicle |
| SEQ | South-East Queensland |
| TAFE | Technical and Further Education |
Appendix A. Questionnaire Survey
| Section A—Questions about yourself and your household |
1. What best describes your gender identity?
|
2. Age group—Choose one answer that best describes your current age:
|
3. Occupational status—Choose one answer that best describes your current status:
|
| 4. Please choose your highest level of completed education (if you completed your education outside of Australia, please choose the nearest equivalent option).
|
5. In which of the following ranges does your total annual household income fall?
|
| 6. What is your postcode? |
7. How many people live in your household (including yourself)?
|
8. Do you have any disabilities that affect your mobility?
|
9. Do you have a valid driver’s license?
|
| 10. How many vehicles does your household have? |
| Section B—Questions about your current trip details | |||||||
| 11. How frequently do you use each of the following travel modes for a return trip? (Please check all that apply) | |||||||
| Daily | Several times a week | A couple of times a week | Once a week | Fortnightly | Monthly or less | Never | |
| Walk | |||||||
| Bicycle | |||||||
| e-bicycle/e-scooter | |||||||
| Motorcycle | |||||||
| Car | |||||||
| Mobility scooter | |||||||
| Uber/other rideshare | |||||||
| Public bus | |||||||
| School bus | |||||||
| Charter/courtesy bus | |||||||
| Light rail/tram | |||||||
| Train | |||||||
| Ferry | |||||||
| Truck | |||||||
| 12. How frequently do you make any of the following return trip types? | |||||||
| Daily | Several times a week | Few times a week | Once a week | Once in two weeks | Once a month | Never | |
| Work | |||||||
| Education | |||||||
| Shopping | |||||||
| Social/Recreational | |||||||
| Medical | |||||||
| Other | |||||||
| 13. How many hours do you spend on transport/commuting/trips per typical day? | |||||||
| |||||||
| |||||||
| |||||||
| |||||||
| |||||||
| 14. Overall, how satisfied are you with the transport mode you usually use? | |||||||
| |||||||

| 15. How familiar were you with autonomous (driverless) DRT before participating in this survey? | |||||
| |||||
| 16. Have you ever ridden in an autonomous vehicle of any kind? | |||||
| |||||
| 17. To what extent do you agree or disagree that ADRTs are suitable for different types of people? | |||||
| ADRTs are suitable for school children | |||||
| ADRTs are suitable for university students | |||||
| ADRTs are suitable for working professionals | |||||
| ADRTs are suitable for senior citizens | |||||
| ADRTs are suitable for tourists | |||||
| ADRTs are suitable for leisure travellers | |||||
| ADRTs are suitable for people with physical disabilities (e.g., mobility impairments) | |||||
| ADRTs are suitable for people with sensory disabilities (e.g., visually impaired, hard of hearing) | |||||
| ADRTs are suitable for people with cognitive disabilities (e.g., learning disabilities, intellectual disabilities) | |||||
| ADRTs are suitable for low-income individuals | |||||
| ADRTs are suitable for middle-income individuals | |||||
| ADRTs are suitable for high-income individuals | |||||
| 18. To what extent do you agree or disagree that ADRTs are suitable for different types of areas? | |||||
| Extremely suitable | Very suitable | Moderately suitable | Slightly suitable | Not at all suitable | |
| ADRTs are suitable for residential neighbourhoods | |||||
| ADRTs are suitable for industrial/business parks | |||||
| ADRTs are suitable for university precincts | |||||
| ADRTs are suitable for agricultural land areas | |||||
| ADRTs are suitable for tourist destinations | |||||
| ADRTs are suitable for town centres | |||||
| 19. To what extent do you agree or disagree that ADRTs are suitable for different types of trips? | |||||
| Extremely suitable | Very suitable | Moderately suitable | Slightly suitable | Not at all suitable | |
| ADRTs are suitable for work trips | |||||
| ADRTs are suitable for school trips | |||||
| ADRTs are suitable for university trips | |||||
| ADRTs are suitable for shopping trips | |||||
| ADRTs are suitable for medical trips | |||||
| ADRTs are suitable for leisure trips | |||||
| ADRTs are suitable for emergency trips | |||||
| ADRTs are suitable for special events or gatherings | |||||
| 20. To what extent do you agree or disagree that vehicle types are suitable for ADRTs? | |||||
| Extremely suitable | Very suitable | Moderately suitable | Slightly suitable | Not at all suitable | |
| Minibus shuttles (capable of carrying 8–15 passengers) will be suitable for ADRTs | |||||
| Standard-sized, conventional buses (capable of carrying up to 60 passengers) will be suitable for ADRTs | |||||
| 21. To what extent do you agree or disagree with the following statements in relation to ADRT operations? | |||||
| Strongly agree | Agree | Neither | Disagree | Strongly disagree | |
| ADRT could completely replace conventional buses | |||||
| ADRT could operate as a connector to existing fixed-route bus services | |||||
| ADRT could operate as a connector to longer distance services (e.g., coach, train) | |||||
| ADRT could operate as private taxi services (including uber/didi style operations) | |||||
| ADRT could accommodate as a multipurpose service, with both passenger transport and light freight (parcel) delivery | |||||
| ADRT should be integrated with other transport offerings | |||||
| I would expect ADRT to operate 24/7 | |||||
| I prefer fixed-route bus services over ADRT services | |||||
| 22. To what extent do you agree or disagree with the following statements in relation to passenger performance from ADRTs | |||||
| Strongly agree | Agree | Neither | Disagree | Strongly disagree | |
| ADRTs will improve quality of service for passengers | |||||
| ADRTs will improve user experience | |||||
| ADRTs will improve accessibility | |||||
| ADRTs will improve safety for passengers | |||||
| ADRTs will improve security for passengers | |||||
| 23. To what extent do you agree or disagree with the following statements in relation to social impacts from ADRTs | |||||
| Strongly agree | Agree | Neither | Disagree | Strongly disagree | |
| ADRTs will create new job opportunities | |||||
| ADRTs will improve social inclusion for disadvantaged groups | |||||
| ADRTs will enhance community interaction and social cohesion | |||||
| ADRTs will benefit local businesses and economic activity | |||||
| ADRTs will positively influence urban planning and development | |||||
| ADRTs will improve public health and well-being | |||||
| ADRTs will enhance personal safety and security in public spaces | |||||
| ADRTs will promote social equity in transport access | |||||
| 24. To what extent do you agree or disagree with the following statements in relation to environmental impacts from ADRTs | |||||
| Strongly agree | Agree | Neither | Disagree | Strongly disagree | |
| ADRTs will reduce greenhouse gas emissions | |||||
| ADRTs will reduce noise pollution | |||||
| ADRTs will reduce local air pollution | |||||
| ADRTs will reduce heat in built-up areas | |||||
| ADRTs will improve wildlife habitats | |||||
References
- Lau, S.T.; Susilawati, S. Shared autonomous vehicles implementation for the first and last-mile services. Transp. Res. Interdiscip. Perspect. 2021, 11, 100440. [Google Scholar] [CrossRef]
- Zuo, T.; Wei, H.; Chen, N. Promote transit via hardening first-and-last-mile accessibility: Learned from modeling commuters’ transit use. Transp. Res. Part D Transp. Environ. 2020, 86, 102446. [Google Scholar] [CrossRef]
- Golbabaei, F. Challenges and Opportunities in the Adoption of Autonomous Demand Responsive Transit (ADRT) by Adult Residents of South East Queensland. Ph.D. Thesis, Queensland University of Technology, Brisbane City, QLD, Australia, 2023. [Google Scholar]
- Stocker, A.; Shaheen, S. Shared Automated Vehicles: Review of Business Models. In Cooperative Mobility Systems and Automated Driving; Transportation Sustainability Research Center, University of California: Berkeley, CA, USA, 2017; Contract No.: 2017-09. [Google Scholar]
- Shaheen, S.; Chan, N. Mobility and the sharing economy: Potential to facilitate the first- and last-mile public transit Connections. Built Environ. 2016, 42, 573–588. [Google Scholar] [CrossRef]
- SAE. Taxonomy and Definitions for Terms Related to On-Road Motor Vehicle Automated Driving Systems; SAE: London, UK, 2021. [Google Scholar]
- Watzenig, D.; Horn, M. Automated Driving; Springer: Cham, Switzerland, 2018. [Google Scholar]
- Zubin, I.; Van Oort, N.; Van Binsbergen, A.; Van Arem, B. Deployment Scenarios for First/Last-Mile Operations with Driverless Shuttles Based on Literature Review and Stakeholder Survey. IEEE Open J. Intell. Transp. Syst. 2021, 2, 322–337. [Google Scholar] [CrossRef]
- Dong, Z.; Chen, C.; Ouyang, J.; Yan, X.; Liao, C.; Chen, X.; Lee, D.-H. Understanding commuter preferences for shared autonomous electric vehicles in first-mile-last-mile scenario. Transp. Res. Part D Transp. Environ. 2025, 140, 104621. [Google Scholar] [CrossRef]
- Jayatilleke, S.; Bhaskar, A.; Bunker, J. Autonomous bus adoption in public transport networks: A systematic literature review on potential and prospects. In Proceedings of the Australasian Transport Research Forum, Perth, Australia, 29 November–1 December 2023. [Google Scholar]
- Narayanan, S.; Chaniotakis, E.; Antoniou, C. Shared autonomous vehicle services: A comprehensive review. Transp. Res. Part C Emerg. Technol. 2020, 111, 255–293. [Google Scholar] [CrossRef]
- Ohnemus, M.; Perl, A. Shared autonomous vehicles: Catalyst of new mobility for the last mile? Built. Environ. 2016, 42, 589–602. [Google Scholar] [CrossRef]
- Mo, B.; Cao, Z.; Zhang, H.; Shen, Y.; Zhao, J. Competition between shared autonomous vehicles and public transit: A case study in Singapore. Transp. Res. Part C Emerg. Technol. 2021, 127, 103058. [Google Scholar] [CrossRef]
- Krueger, R.; Rashidi, T.H.; Rose, J.M. Preferences for shared autonomous vehicles. Transp. Res. Part C Emerg. Technol. 2016, 69, 343–355. [Google Scholar] [CrossRef]
- Shen, Y.; Zhang, H.; Zhao, J. Integrating shared autonomous vehicle in public transportation system: A supply-side simulation of the first-mile service in Singapore. Transp. Res. Part A Policy Pract. 2018, 113, 125–136. [Google Scholar] [CrossRef]
- Basu, R.; Araldo, A.; Akkinepally, A.P.; Nahmias Biran, B.H.; Basak, K.; Seshadri, R.; Deshmukh, N.; Kumar, N.; Azevedo, C.L.; Ben-Akiva, M. Automated Mobility-on-Demand vs. Mass Transit: A Multi-Modal Activity-Driven Agent-Based Simulation Approach. Transp. Res. Rec. J. Transp. Res. Board. 2018, 2672, 608–618. [Google Scholar] [CrossRef]
- Militão, A.M.; Tirachini, A. Optimal fleet size for a shared demand-responsive transport system with human-driven vs automated vehicles: A total cost minimization approach. Transp. Res. Part A Policy Pract. 2021, 151, 52–80. [Google Scholar] [CrossRef]
- Cyganski, R.; Heinrichs, M.; von Schmidt, A.; Krajzewicz, D. Simulation of automated transport offers for the city of Brunswick. Procedia Comput. Sci. 2018, 130, 872–879. [Google Scholar] [CrossRef]
- Leich, G.; Bischoff, J. Should autonomous shared taxis replace buses? A simulation study. Transp. Res. Procedia 2019, 41, 450–460. [Google Scholar] [CrossRef]
- Peer, S.; Müller, J.; Naqvi, A.; Straub, M. Introducing shared, electric, autonomous vehicles (SAEVs) in sub-urban zones: Simulating the case of Vienna. Transp. Policy 2024, 147, 232–243. [Google Scholar] [CrossRef]
- Tajitsu, N. Japan Trials Driverless Cars in Bid to Keep Rural Elderly on the Move: Reuters. Available online: https://www.reuters.com/article/us-japan-elderly-selfdriving-idUSKCN1BN0UQ (accessed on 13 April 2025).
- SPACE. Alphaba Smart Bus: UITP. 2017. Available online: https://space.uitp.org/initiatives/alphaba-smart-bus-av-pilot-shenzhen-china (accessed on 13 April 2025).
- Ainsalu, J.; Arffman, V.; Bellone, M.; Ellner, M.; Haapamäki, T.; Haavisto, N.; Josefson, E.; Ismailogullari, A.; Lee, B.; Madland, O.; et al. State of the Art of Automated Buses. Sustainability 2018, 10, 3118. [Google Scholar] [CrossRef]
- Hatzenbühler, J.; Cats, O.; Jenelius, E. Transitioning towards the deployment of line-based autonomous buses: Consequences for service frequency and vehicle capacity. Transp. Res. Part A Policy Pract. 2020, 138, 491–507. [Google Scholar] [CrossRef]
- Mahmoodi Nesheli, M.; Li, L.; Palm, M.; Shalaby, A. Driverless shuttle pilots: Lessons for automated transit technology deployment. Case Stud. Transp. Policy 2021, 9, 723–742. [Google Scholar] [CrossRef]
- Zhang, W.; Jenelius, E.; Badia, H. Efficiency of Connected Semi-Autonomous Platooning Bus Services in High-Demand Transit Corridors. IEEE Open J. Intell. Transp. Syst. 2022, 3, 435–448. [Google Scholar] [CrossRef]
- Ongel, A.; Loewer, E.; Roemer, F.; Sethuraman, G.; Chang, F.; Lienkamp, M. Economic Assessment of Autonomous Electric Microtransit Vehicles. Sustainability 2019, 11, 648. [Google Scholar] [CrossRef]
- Hatzenbühler, J.; Cats, O.; Jenelius, E. Network design for line-based autonomous bus services. Transportation 2021, 49, 467–502. [Google Scholar] [CrossRef]
- Liu, X.; Qu, X.; Ma, X. Improving flex-route transit services with modular autonomous vehicles. Transp. Res. Part E Logist. Transp. Rev. 2021, 149, 102331. [Google Scholar] [CrossRef]
- Oikonomou, M.G.; Orfanou, F.P.; Vlahogianni, E.I.; Yannis, G. Impacts of Autonomous Shuttle Services on Traffic, Safety and Environment for Future Mobility Scenarios. In Proceedings of the 2020 IEEE 23rd International Conference on Intelligent Transportation Systems (ITSC), Rhodes, Greece, 20–23 September 2020. [Google Scholar]
- Rosell, J.; Allen, J. Test-riding the driverless bus: Determinants of satisfaction and reuse intention in eight test-track locations. Transp. Res. Part A Policy Pract. 2020, 140, 166–189. [Google Scholar] [CrossRef]
- Hasan, U.; Whyte, A.; AlJassmi, H. A Microsimulation Modelling Approach to Quantify Environmental Footprint of Autonomous Buses. Sustainability 2022, 14, 15657. [Google Scholar] [CrossRef]
- Moorthy, A.; De Kleine, R.; Keoleian, G.; Good, J.; Lewis, G. Shared Autonomous Vehicles as a Sustainable Solution to the Last Mile Problem: A Case Study of Ann Arbor-Detroit Area. SAE Int. J. Passeng. Cars-Electron. Electr. Syst. 2017, 10, 328–336. [Google Scholar] [CrossRef]
- Zhang, W.; Guhathakurta, S. Parking spaces in the age of shared autonomous vehicles: How much parking will we need and where? Transp. Res. Record. 2017, 2651, 80–91. [Google Scholar] [CrossRef]
- Fagnant, D.J.; Kockelman, K.M.; Bansal, P. Operations of Shared Autonomous Vehicle Fleet for Austin, Texas, Market. Transp. Res. Rec. J. Transp. Res. Board. 2019, 2563, 98–106. [Google Scholar] [CrossRef]
- Fagnant, D.J.; Kockelman, K.M. The travel and environmental implications of shared autonomous vehicles, using agent-based model scenarios. Transp. Res. Part C Emerg. Technol. 2014, 40, 1–13. [Google Scholar] [CrossRef]
- Duan, X.; Si, H.; Xiang, P. Technology into reality: Disentangling the challenges of shared autonomous electric vehicles implementation from stakeholder perspectives. Energy 2025, 316, 134383. [Google Scholar] [CrossRef]
- Azad, M.; Hoseinzadeh, N.; Brakewood, C.; Cherry, C.R.; Han, L.D. Fully Autonomous Buses: A Literature Review and Future Research Directions. J. Adv. Transp. 2019, 2019, 4603548. [Google Scholar] [CrossRef]
- Hasan, U.; Whyte, A.; Al Jassmi, H. A Review of the Transformation of Road Transport Systems: Are We Ready for the Next Step in Artificially Intelligent Sustainable Transport? Appl. Syst. Innov. 2019, 3, 1. [Google Scholar] [CrossRef]
- Golbabaei, F.; Yigitcanlar, T.; Bunker, J. The role of shared autonomous vehicle systems in delivering smart urban mobility: A systematic review of the literature. Int. J. Sustain. Transp. 2020, 15, 731–748. [Google Scholar] [CrossRef]
- Golbabaei, F.; Yigitcanlar, T.; Paz, A.; Bunker, J. Individual Predictors of Autonomous Vehicle Public Acceptance and Intention to Use: A Systematic Review of the Literature. J. Open Innov. Technol. Mark. Complex. 2020, 6, 106. [Google Scholar] [CrossRef]
- Bala, H.; Anowar, S.; Chng, S.; Cheah, L. Review of studies on public acceptability and acceptance of shared autonomous mobility services: Past, present and future. Transp. Rev. 2023, 43, 970–996. [Google Scholar] [CrossRef]
- Golbabaei, F.; Yigitcanlar, T.; Paz, A.; Bunker, J. Perceived Opportunities and Challenges of Autonomous Demand-Responsive Transit Use: What Are the Socio-Demographic Predictors? Sustainability 2023, 15, 11839. [Google Scholar] [CrossRef]
- Greifenstein, M. Factors influencing the user behaviour of shared autonomous vehicles (SAVs): A systematic literature review. Transp. Res. Part F Traffic Psychol. Behav. 2024, 100, 323–345. [Google Scholar] [CrossRef]
- Golbabaei, F.; Paz, A.; Yigitcanlar, T.; Bunker, J. Navigating autonomous demand responsive transport: Stakeholder perspectives on deployment and adoption challenges. Int. J. Digit. Earth 2023, 17, 2297848. [Google Scholar] [CrossRef]
- Rahimi, A.; Azimi, G.; Jin, X. Examining human attitudes toward shared mobility options and autonomous vehicles. Transp. Res. Part F Traffic Psychol. Behav. 2020, 72, 133–154. [Google Scholar] [CrossRef]
- Nordhoff, S.; de Winter, J.; Payre, W.; van Arem, B.; Happee, R. What impressions do users have after a ride in an automated shuttle? An interview study. Transp. Res. Part F Traffic Psychol. Behav. 2019, 63, 252–269. [Google Scholar] [CrossRef]
- Usman, M.; Li, W.; Bian, J.; Chen, A.; Ye, X.; Li, X.; Dadashova, B.; Lee, C.; Lee, K.; Rathinam, S.; et al. Small and rural towns’ perception of autonomous vehicles: Insights from a survey in Texas. Transp. Plan. Technol. 2023, 47, 200–225. [Google Scholar] [CrossRef]
- Imhof, S.; Frölicher, J.; von Arx, W. Shared Autonomous Vehicles in rural public transportation systems. Res. Transp. Econ. 2020, 83, 100925. [Google Scholar] [CrossRef]
- Sieber, L.; Ruch, C.; Hörl, S.; Axhausen, K.; Frazzoli, E. Improved public transportation in rural areas with self-driving cars: A study on the operation of Swiss train lines. Transp. Res. Part A Policy Pract. 2020, 134, 35–51. [Google Scholar] [CrossRef]
- Wang, S.; Jiang, Z.; Noland, R.B.; Mondschein, A.S. Attitudes towards privately-owned and shared autonomous vehicles. Transp. Res. Part F Traffic Psychol. Behav. 2020, 72, 297–306. [Google Scholar] [CrossRef]
- Wang, N.; Tang, H.; Wang, Y.-J.; Huang, G.Q. Antecedents in rural residents’ acceptance of autonomous vehicles. Transp. Res. Part D Transp. Environ. 2024, 132, 104244. [Google Scholar] [CrossRef]
- Cao, W.; Chen, Y.; Wang, K. Revolutionizing commutes: Unraveling the factors shaping Chinese consumers’ acceptance of shared autonomous vehicles (SAVs) with an integrated UTAUT2 model. Res. Transp. Bus. Manag. 2024, 57, 101224. [Google Scholar] [CrossRef]
- Golbabaei, F.; Yigitcanlar, T.; Paz, A.; Bunker, J. Understanding Autonomous Shuttle Adoption Intention: Predictive Power of Pre-Trial Perceptions and Attitudes. Sensors 2022, 22, 9193. [Google Scholar] [CrossRef]
- Debbaghi, F.-Z.; Rombaut, E.; Vanhaverbeke, L. Exploring the influence of a virtual reality experience on user acceptance of shared autonomous vehicles: A quasi-experimental study in Brussels. Transp. Res. Part F Traffic Psychol. Behav. 2024, 107, 674–694. [Google Scholar] [CrossRef]
- Cheng, Y.-H.; Lai, Y.-C. Exploring autonomous bus users’ intention: Evidence from positive and negative effects. Transp. Policy 2024, 146, 91–101. [Google Scholar] [CrossRef]
- Mason, J.; Classen, S. Develop and Validate a Survey to Assess Adult’s Perspectives on Autonomous Ridesharing and Ridehailing Services. Futur. Transp. 2023, 3, 726–738. [Google Scholar] [CrossRef]
- Dolins, S.; Karlsson, M.; Strömberg, H. AVs Have a Sharing Problem: Examining User Acceptance of Shared, Autonomous Public Transport in Sweden. In Proceedings of the 2023 IEEE 26th International Conference on Intelligent Transportation Systems (ITSC), Bilbao, Spain, 24–28 September 2023. [Google Scholar]
- Chng, S.; Anowar, S.; Cheah, L. Understanding Shared Autonomous Vehicle Preferences: A Comparison between Shuttles, Buses, Ridesharing and Taxis. Sustainability 2022, 14, 13656. [Google Scholar] [CrossRef]
- Liu, M.; Wu, J.; Zhu, C.; Hu, K. Factors Influencing the Acceptance of Robo-Taxi Services in China: An Extended Technology Acceptance Model Analysis. J. Adv. Transp. 2022, 2022, 8461212. [Google Scholar] [CrossRef]
- Classen, S.; Mason, J.R.; Hwangbo, S.W.; Sisiopiku, V. Predicting Autonomous Shuttle Acceptance in Older Drivers Based on Technology Readiness/Use/Barriers, Life Space, Driving Habits, and Cognition. Front. Neurol. 2021, 12, 798762. [Google Scholar] [CrossRef] [PubMed]
- Gurumurthy, K.M.; Kockelman, K.M. Analyzing the dynamic ride-sharing potential for shared autonomous vehicle fleets using cellphone data from Orlando, Florida. Comput. Environ. Urban Syst. 2018, 71, 177–185. [Google Scholar] [CrossRef]
- Vicente, A.L. Traffic microsimulation of Autonomous Vehicles Flow in Ronda de Dalt of Barcelona. Bachelor’s Thesis, Universitat Politècnica de Catalunya, Barcelona, Spain, 2022. [Google Scholar]
- Tian, Q.; Wang, D.Z.; Lin, Y.H. Optimal deployment of autonomous buses into a transit service network. Transp. Res. Part E Logist. Transp. Rev. 2022, 165, 102865. [Google Scholar] [CrossRef]
- Jayatilleke, S.; Bhaskar, A.; Bunker, J. Unveiling the Challenges and Opportunities of Autonomous Bus Integration in Rural and Suburban Areas: An Expert Interview Study. 2025; in press. [Google Scholar]
- Wang, Z.; Safdar, M.; Zhong, S.; Liu, J.; Xiao, F. Public Preferences of Shared Autonomous Vehicles in Developing Countries: A Cross-National Study of Pakistan and China. J. Adv. Transp. 2021, 2021, 5141798. [Google Scholar] [CrossRef]
- Foldes, D.; Csiszar, C. Framework for planning the mobility service based on autonomous vehicles. In Proceedings of the 2018 Smart City Symposium Prague (SCSP), Prague, Czech Republic, 24–25 May 2018. [Google Scholar]
- Faroqi, H.; Mesbah, M. Inferring trip purpose by clustering sequences of smart card records. Transp. Res. Part C Emerg. Technol. 2021, 127, 103131. [Google Scholar] [CrossRef]
- Kwak, S.K.; Kim, J.H. Statistical data preparation: Management of missing values and outliers. Korean J. Anesthesiol. 2017, 70, 407–411. [Google Scholar] [CrossRef] [PubMed]
- Aslam, N.S.; Ibrahim, M.R.; Cheng, T.; Chen, H.; Zhang, Y. ActivityNET: Neural networks to predict public transport trip purposes from individual smart card data and POIs. Geo-Spat. Inf. Sci. 2021, 24, 711–721. [Google Scholar] [CrossRef]
- Kim, S.-W.; Gwon, G.-P.; Hur, W.-S.; Hyeon, D.; Kim, D.-Y.; Kim, S.-H.; Kye, D.-K.; Lee, S.-H.; Lee, S.; Shin, M.-O.; et al. Autonomous Campus Mobility Services Using Driverless Taxi. IEEE Trans. Intell. Transp. Syst. 2017, 18, 3513–3526. [Google Scholar] [CrossRef]
- Westerman, H.; Black, J. Preparing for Fully Autonomous Vehicles in Australian Cities: Land-Use Planning—Adapting, Transforming, and Innovating. Sustainability 2024, 16, 5492. [Google Scholar] [CrossRef]
- Miller, J.; How, J.P. Demand estimation and chance-constrained fleet management for ride hailing. In Proceedings of the 2017 IEEE/RSJ International Conference on Intelligent Robots and Systems (IROS), Vancouver, BC, Canada, 24–28 September 2017. [Google Scholar]
- Lai, W.-T.; Chen, C.-F. Behavioral intentions of public transit passengers—The roles of service quality, perceived value, satisfaction and involvement. Transp. Policy 2011, 18, 318–325. [Google Scholar] [CrossRef]
- Transport and Infrastructure Council. T2 Cost Benefit Analysis; Commonwealth Department of Infrastructure and Regional Development: Canberra, Australia, 2018.
- Whitmore, A.; Samaras, C.; Hendrickson, C.T.; Matthews, H.S.; Wong-Parodi, G. Integrating public transportation and shared autonomous mobility for equitable transit coverage: A cost-efficiency analysis. Transp. Res. Interdiscip. Perspect. 2022, 14, 100571. [Google Scholar] [CrossRef]
- Silva, Ó.; Cordera, R.; González-González, E.; Nogués, S. Environmental impacts of autonomous vehicles: A review of the scientific literature. Sci. Total Environ. 2022, 830, 154615. [Google Scholar] [CrossRef] [PubMed]
- Silva, I.; Calabrese, J.M. Emerging opportunities for wildlife conservation with sustainable autonomous transportation. Front. Ecol. Environ. 2024, 22, e2697. [Google Scholar] [CrossRef]
- Labaw, P.J. Advanced Questionnaire Design; Abt Books: Cambridge, MA, USA, 1980. [Google Scholar]
- Mortoja, M.G.; Yigitcanlar, T. Why is determining peri-urban area boundaries critical for sustainable urban development? J. Environ. Plan. Manag. 2021, 66, 67–96. [Google Scholar] [CrossRef]
- Sunshine Coast Council. Public Transport 2024. Available online: https://www.sunshinecoast.qld.gov.au/living-and-community/roads-and-transport/transport-options/public-transport (accessed on 13 April 2025).
- Lockyer Valley Regional Council. Getting Around 2024. Available online: https://www.lockyervalley.qld.gov.au/our-region/about-the-lockyer-valley/getting-around (accessed on 13 April 2025).
- Kline, R. Principles and Practice of Structural Equation Modeling; Guilford Publications: New York, NY, USA, 2016. [Google Scholar]
- Hair, J.F.; Risher, J.J.; Sarstedt, M.; Ringle, C.M. When to use and how to report the results of PLS-SEM. Eur. Bus. Rev. 2019, 31, 2–24. [Google Scholar] [CrossRef]
- Krejcie, R.V.; Morgan, D.W. Determining Sample Size for Research Activities. Educ. Psychol. Meas. 1970, 30, 607–610. [Google Scholar] [CrossRef]
- Likert, R. A technique for the measurement of attitudes. Arch. Psychol. 1932, 22, 5–55. Available online: https://legacy.voteview.com/pdf/Likert_1932.pdf (accessed on 13 April 2025).
- Collins, L.M. Research Design and Methods. In Encyclopedia of Gerontology, 2nd ed.; Birren, J.E., Ed.; Elsevier: New York, NY, USA, 2007; pp. 433–442. [Google Scholar]
- McCrum-Gardner, E. Which is the correct statistical test to use? Br. J. Oral Maxillofac. Surg. 2008, 46, 38–41. [Google Scholar] [CrossRef]
- Kothari, C. Research Methodology: Methods and Techniques; New Age International: Manchester, UK, 2004. [Google Scholar]
- Gupta, A.; Gupta, N. Research Methodology; SBPD Publications: Boston, MA, USA, 2022. [Google Scholar]
- Pandey, P.; Pandey, M.M. Research Methodology: Tools and Techniques; New Age International: Manchester, UK, 2015. [Google Scholar]
- Kadkhodaei, M.; Shad, R.; Ziaee, S.A. Affecting factors of double parking violations on urban trips. Transp. Policy 2022, 120, 80–88. [Google Scholar] [CrossRef]
- Khan, S.K.; Shiwakoti, N.; Stasinopoulos, P.; Chen, Y.; Warren, M. The impact of perceived cyber-risks on automated vehicle acceptance: Insights from a survey of participants from the United States, the United Kingdom, New Zealand, and Australia. Transp. Policy 2024, 152, 87–101. [Google Scholar] [CrossRef]
- Cohen, J. Statistical Power Analysis for the Behavioral Sciences, 2nd ed.; Routledge: London, UK, 1988. [Google Scholar]
- Wu, X.; Cao, J.; Douma, F. The impacts of vehicle automation on transport-disadvantaged people. Transp. Res. Interdiscip. Perspect. 2021, 11, 100447. [Google Scholar] [CrossRef]
- Kittelson & Assoc, Inc.; Parsons Brinckerhoff, Inc.; KFH Group; Inc Texas A&M Transportation Institute; Arup. Transit Capacity and Quality of Service Manual; Report No.: 978-0-309-28344-1; The National Academies Press: Washington, DC, USA, 2013. [Google Scholar]
- Gurumurthy, K.M.; Kockelman, K.M.; Zuniga-Garcia, N. First-Mile-Last-Mile Collector-Distributor System using Shared Autonomous Mobility. Transp. Res. Rec. J. Transp. Res. Board 2020, 2674, 638–647. [Google Scholar] [CrossRef]
- Wen, J.; Chen, Y.X.; Nassir, N.; Zhao, J. Transit-oriented autonomous vehicle operation with integrated demand-supply interaction. Transp. Res. Part C Emerg. Technol. 2018, 97, 216–234. [Google Scholar] [CrossRef]
- Scheltes, A.; Correia, G.H.d.A. Exploring the use of automated vehicles as last mile connection of train trips through an agent-based simulation model: An application to Delft, Netherlands. Int. J. Transp. Sci. Technol. 2017, 6, 28–41. [Google Scholar] [CrossRef]
- Salazar, M.; Lanzetti, N.; Rossi, F.; Schiffer, M.; Pavone, M. Intermodal Autonomous Mobility-on-Demand. IEEE Trans. Intell. Transp. Syst. 2020, 21, 3946–3960. [Google Scholar] [CrossRef]
- Fielbaum, A.; Pudāne, B. Are shared automated vehicles good for public- or private-transport-oriented cities (or neither)? Transp. Res. Part D Transp. Environ. 2024, 136, 104373. [Google Scholar] [CrossRef]
- Milford, M.; Anthony, S.; Scheirer, W. Self-Driving Vehicles: Key Technical Challenges and Progress Off the Road. IEEE Potentials 2019, 39, 37–45. [Google Scholar] [CrossRef]
- Lazányi, K. Perceived Risks of Autonomous Vehicles. Risks 2023, 11, 26. [Google Scholar] [CrossRef]
- Islam, R.; Abdel-Aty, M.; Lee, J.; Wu, Y.; Yue, L.; Cai, Q. Perception of people from educational institution regarding autonomous vehicles. Transp. Res. Interdiscip. Perspect. 2022, 14, 100620. [Google Scholar] [CrossRef]
- Günthner, T.; Proff, H. On the way to autonomous driving: How age influences the acceptance of driver assistance systems. Transp. Res. Part F Traffic Psychol. Behav. 2021, 81, 586–607. [Google Scholar] [CrossRef]
- Thomas, E.; McCrudden, C.; Wharton, Z.; Behera, A. Perception of autonomous vehicles by the modern society: A survey. IET Intell. Transp. Syst. 2020, 14, 1228–1239. [Google Scholar] [CrossRef]
- Srour Zreik, R.; Harvey, M.; Brewster, S.A. (Eds.) Age Matters: Investigating Older Drivers’ Perception of Level 3 Autonomous Cars as a Heterogeneous Age Group. In Adjunct Proceedings of the 15th International Conference on Automotive User Interfaces and Interactive Vehicular Applications; Association for Computing Machinery: New York, NY, USA, 2023. [Google Scholar]
- Hassan, H.M.; Ferguson, M.R.; Vrkljan, B.; Newbold, B.; Razavi, S. Older adults and their willingness to use semi and fully autonomous vehicles: A structural equation analysis. J. Transp. Geogr. 2021, 95, 103133. [Google Scholar] [CrossRef]
- Golbabaei, F.; Dwyer, J.; Gomez, R.; Peterson, A.; Cocks, K.; Bubke, A.; Paz, A. Enabling mobility and inclusion: Designing accessible autonomous vehicles for people with disabilities. Cities 2024, 154, 105333. [Google Scholar] [CrossRef]
- Nourinejad, M.; Bahrami, S.; Roorda, M.J. Designing parking facilities for autonomous vehicles. Transp. Res. Part B Methodol. 2018, 109, 110–127. [Google Scholar] [CrossRef]
- Kumakoshi, Y.; Hanabusa, H.; Oguchi, T. Impacts of shared autonomous vehicles: Tradeoff between parking demand reduction and congestion increase. Transp. Res. Interdiscip. Perspect. 2021, 12, 100482. [Google Scholar] [CrossRef]
- Patel, R.K.; Etminani-Ghasrodashti, R.; Kermanshachi, S.; Rosenberger, J.M.; Pamidimukkala, A.; Foss, A. Identifying individuals’ perceptions, attitudes, preferences, and concerns of shared autonomous vehicles: During- and post-implementation evidence. Transp. Res. Interdiscip. Perspect. 2023, 18, 100785. [Google Scholar] [CrossRef]
- Lavieri, P.S.; Garikapati, V.M.; Bhat, C.R.; Pendyala, R.M.; Astroza, S.; Dias, F.F. Modeling individual preferences for ownership and sharing of autonomous vehicle technologies. Transp. Res. Rec. J. Transp. Res. Board 2017, 2665, 1–10. [Google Scholar] [CrossRef]
- Nazari, F.; Noruzoliaee, M.; Mohammadian, A.K. Shared versus private mobility: Modeling public interest in autonomous vehicles accounting for latent attitudes. Transp. Res. Part C Emerg. Technol. 2018, 97, 456–477. [Google Scholar] [CrossRef]
- Schuß, M.; Wintersberger, P.; Riener, A. Security Issues in Shared Automated Mobility Systems: A Feminist HCI Perspective. Multimodal Technol. Interact. 2021, 5, 43. [Google Scholar] [CrossRef]
- Eby, D.W.; Molnar, L.J.; Zakrajsek, J.S.; Ryan, L.H.; Zanier, N.; Louis, R.M.S.; Stanciu, S.C.; LeBlanc, D.; Kostyniuk, L.P.; Smith, J.; et al. Prevalence, attitudes, and knowledge of in-vehicle technologies and vehicle adaptations among older drivers. Accid. Anal. Prev. 2018, 113, 54–62. [Google Scholar] [CrossRef] [PubMed]
- Lee, C.; Seppelt, B.; Reimer, B.; Mehler, B.; Coughlin, J.F. (Eds.) Acceptance of vehicle automation: Effects of demographic traits, technology experience and media exposure. In Proceedings of the Human Factors and Ergonomics Society Annual Meeting, Seattle, DC, USA, 28 October–1 November 2019; SAGE Publications Sage CA: Los Angeles, CA, USA, 2019. [Google Scholar]
- Greenwood, P.M.; Lenneman, J.K.; Baldwin, C.L. Advanced driver assistance systems (ADAS): Demographics, preferred sources of information, and accuracy of ADAS knowledge. Transp. Res. Part F Traffic Psychol. Behav. 2022, 86, 131–150. [Google Scholar] [CrossRef]
- Kim, M.; Schonfeld, P. Integrating bus services with mixed fleets. Transp. Res. Part B Methodol. 2013, 55, 227–244. [Google Scholar] [CrossRef]
- Krishnan, V.; Solieman, H.; Moslem, S.; Pilla, F. Inclusive sustainable transportation planning: A qualitative analysis involving diverse stakeholders perspectives. Case Stud. Transp. Policy 2025, 19, 101393. [Google Scholar] [CrossRef]
- Currie, G.; Fournier, N. Why most DRT/Micro-Transits fail—What the survivors tell us about progress. Res. Transp. Econ. 2020, 83, 100895. [Google Scholar] [CrossRef]
- Tengilimoglu, O.; Carsten, O.; Wadud, Z. Implications of automated vehicles for physical road environment: A comprehensive review. Transp. Res. Part E Logist. Transp. Rev. 2023, 169, 102989. [Google Scholar] [CrossRef]
| Predictor Variable | Category | N = 273 n (%) |
|---|---|---|
| Gender | Man | 93 (34.1) |
| Woman | 179 (65.5) | |
| Non-binary | 1 (0.4) | |
| Age | 19–35 | 73 (26.7) |
| 36–50 | 77 (28.2) | |
| 51–65 | 69 (25.3) | |
| 66 or higher | 54 (19.8) | |
| Education level | Year 10 | 38 (13.9) |
| Year 12 | 51 (18.7) | |
| Trade apprentice/TAFE | 90 (32.9) | |
| Undergraduate degree | 57 (20.9) | |
| Post-graduate degree | 37 (13.6) | |
| Employment status | Unemployed/Homemaker | 18 (6.6) |
| Retired | 64 (23.4) | |
| Full-time/Part-time student | 15 (5.5) | |
| Part-time/casually employed | 67 (24.5) | |
| Full-time employed | 109 (40.0) | |
| Annual Household income | Prefer not to answer | 22 (8.1) |
| Under AUD 15,600 | 7 (2.6) | |
| AUD 15,600–31,199 | 25 (9.2) | |
| AUD 31,200–51,999 | 33 (12.1) | |
| AUD 52,000–77,999 | 36 (13.2) | |
| AUD 78,000–103,999 | 49 (17.9) | |
| AUD 104,000 or more | 101 (36.9) |
| Variable | Gender | Age | Occupational Level | Education Level | Household Income | Disability Status | Driver’s License Status |
|---|---|---|---|---|---|---|---|
| X2 and Significance | |||||||
| Familiarity with ADRTs | 75.101 p < 0.001 | 8.880 p = 0.713 | 10.515 p = 0.838 | 26.693 p = 0.045 | 17.291 p = 0.836 | 8.175 p = 0.417 | 8.974 p = 0.345 |
| Ridden in an AV | 19.211 p < 0.001 | 2.544 p = 0.864 | 16.505 p = 0.036 | 9.429 p = 0.307 | 13.583 p = 0.328 | 11.310 p =0.023 | 7.994 p = 0.092 |
| Response Variable | Mean | Std. Dev. | Strongly Agree | Somewhat Agree | Neutral | Somewhat Disagree | Strongly Disagree | Cronbach’s Alpha If Item Deleted |
|---|---|---|---|---|---|---|---|---|
| Vehicle Type | ||||||||
| Small shuttle | 3.56 | 1.136 | 56 | 104 | 75 | 14 | 24 | 0.816 |
| Minibus shuttle | 3.45 | 1.203 | 55 | 93 | 73 | 24 | 28 | 0.705 |
| Standard-sized conventional bus | 2.90 | 1.304 | 40 | 48 | 81 | 53 | 51 | 0.870 |
| Service offering | ||||||||
| Completely replace conventional buses | 2.65 | 1.303 | 24 | 59 | 57 | 64 | 69 | 0.922 |
| Operate as a connector to existing fixed-route bus services | 3.51 | 1.170 | 51 | 111 | 64 | 20 | 27 | 0.904 |
| Connector to longer distance services | 3.40 | 1.205 | 53 | 86 | 78 | 28 | 28 | 0.902 |
| Operate as private taxi services | 3.30 | 1.236 | 51 | 77 | 79 | 35 | 31 | 0.905 |
| Accommodate as a multipurpose service | 3.34 | 1.199 | 50 | 80 | 82 | 34 | 27 | 0.905 |
| Integrated with other transport offerings | 3.51 | 1.164 | 59 | 89 | 80 | 22 | 23 | 0.901 |
| Operate 24/7 | 3.62 | 1.238 | 79 | 81 | 68 | 19 | 26 | 0.916 |
| Trip Purpose | ||||||||
| Work | 3.38 | 1.145 | 43 | 96 | 83 | 25 | 26 | 0.906 |
| School | 2.87 | 1.249 | 26 | 71 | 66 | 62 | 48 | 0.915 |
| University | 3.41 | 1.201 | 52 | 93 | 71 | 30 | 27 | 0.901 |
| Shopping | 3.40 | 1.149 | 43 | 101 | 75 | 29 | 25 | 0.905 |
| Medical | 3.22 | 1.238 | 46 | 75 | 77 | 43 | 32 | 0.907 |
| Leisure | 3.40 | 1.162 | 47 | 91 | 85 | 23 | 27 | 0.904 |
| Emergency | 2.50 | 1.237 | 20 | 39 | 73 | 66 | 75 | 0.934 |
| Special events or gatherings | 3.45 | 1.153 | 48 | 99 | 81 | 18 | 27 | 0.904 |
| Demographic Group | ||||||||
| School children | 2.72 | 1.279 | 21 | 67 | 64 | 56 | 65 | 0.953 |
| University students | 3.45 | 1.172 | 48 | 104 | 72 | 21 | 28 | 0.949 |
| Working professionals | 3.56 | 1.130 | 55 | 105 | 74 | 16 | 23 | 0.949 |
| Senior citizens | 3.21 | 1.284 | 48 | 76 | 71 | 40 | 38 | 0.900 |
| Tourists | 3.48 | 1.173 | 49 | 108 | 68 | 20 | 28 | 0.984 |
| Leisure travellers | 3.50 | 1.141 | 49 | 106 | 76 | 16 | 26 | 0.984 |
| People with physical disabilities | 2.92 | 1.308 | 34 | 65 | 73 | 46 | 55 | 0.984 |
| People with sensory disabilities | 2.91 | 1.304 | 35 | 61 | 75 | 48 | 54 | 0.984 |
| People with cognitive disabilities | 2.77 | 1.250 | 24 | 57 | 82 | 51 | 59 | 0.984 |
| Low-income individuals | 3.39 | 1.126 | 47 | 80 | 105 | 15 | 26 | 0.984 |
| Middle-income individuals | 3.47 | 1.091 | 47 | 93 | 96 | 15 | 22 | 0.984 |
| High-income individuals | 3.39 | 1.155 | 49 | 83 | 93 | 22 | 26 | 0.984 |
| Land Use | ||||||||
| Residential neighbours | 3.31 | 1.204 | 41 | 100 | 65 | 37 | 30 | 0.910 |
| Industrial/ business parks | 3.47 | 1.160 | 52 | 98 | 74 | 25 | 24 | 0.903 |
| University precincts | 3.74 | 1.171 | 77 | 106 | 55 | 11 | 24 | 0.901 |
| Agricultural land areas | 2.97 | 1.212 | 33 | 60 | 83 | 60 | 37 | 0.942 |
| Tourist destinations | 3.52 | 1.176 | 57 | 99 | 70 | 22 | 25 | 0.904 |
| Town centres | 3.52 | 1.234 | 65 | 93 | 63 | 24 | 28 | 0.905 |
| Response Variable | Mean | Std. Dev. | Strongly Agree | Somewhat Agree | Neutral | Somewhat Disagree | Strongly Disagree | Cronbach’s Alpha If Item Deleted |
|---|---|---|---|---|---|---|---|---|
| Impact on Passenger Performance | ||||||||
| Improve quality of service | 3.22 | 1.127 | 28 | 93 | 97 | 22 | 33 | 0.884 |
| Improve user experience | 3.21 | 1.097 | 30 | 82 | 102 | 33 | 26 | 0.882 |
| Improve accessibility | 3.48 | 1.108 | 48 | 102 | 76 | 28 | 19 | 0.901 |
| Improve safety | 2.77 | 1.158 | 22 | 43 | 107 | 52 | 49 | 0.891 |
| Improve security | 2.70 | 1.136 | 19 | 43 | 96 | 68 | 47 | 0.899 |
| Social Impacts | ||||||||
| Create new job opportunities | 2.70 | 1.211 | 20 | 58 | 69 | 73 | 53 | 0.944 |
| Improve social inclusion for disadvantaged groups | 3.18 | 1.184 | 36 | 77 | 93 | 33 | 34 | 0.928 |
| Enhance community interaction and social cohesion | 3.06 | 1.097 | 24 | 68 | 113 | 36 | 32 | 0.925 |
| Benefit local businesses and economic activity | 3.22 | 1.112 | 28 | 91 | 95 | 30 | 29 | 0.929 |
| Influence urban planning and development | 3.36 | 1.112 | 36 | 100 | 88 | 23 | 26 | 0.930 |
| Improve public health and well-being | 3.01 | 1.096 | 26 | 56 | 117 | 43 | 31 | 0.928 |
| Enhance personal safety and security in public spaces | 2.81 | 1.185 | 28 | 76 | 118 | 21 | 30 | 0.932 |
| Promote social equity in transport access | 3.19 | 1.084 | 39 | 102 | 85 | 19 | 28 | 0.928 |
| Environmental Impacts | 3.41 | 1.201 | 52 | 93 | 71 | 30 | 27 | 0.901 |
| Reduce GHG emissions | 3.38 | 1.132 | 39 | 102 | 85 | 19 | 28 | 0.911 |
| Reduce noise pollution | 3.53 | 1.088 | 50 | 102 | 86 | 14 | 21 | 0.910 |
| Reduce local air pollution | 3.51 | 1.095 | 47 | 106 | 82 | 16 | 22 | 0.904 |
| Reduce heat in built-up areas | 3.22 | 1.078 | 34 | 69 | 115 | 32 | 23 | 0.912 |
| Improve wildlife habitats | 2.86 | 1.105 | 20 | 47 | 125 | 38 | 43 | 0.942 |
| Variable | Gender | Age | Occupational Level | Education Level | Household Income | Disability Status | Driver’s License Status |
|---|---|---|---|---|---|---|---|
| Significance | |||||||
| Suitable vehicle types for ADRTs | |||||||
| Small shuttle | ns | ns | ns | ns | * | ns | ns |
| Minibus shuttle | ns | ns | ns | ns | ns | ns | ns |
| Standard-sized conventional bus | ns | ns | ns | ns | * | ns | ns |
| Suitable service offerings for ADRTs | |||||||
| Completely replace conventional buses | * | ns | ns | ns | ns | ns | ns |
| Operate as a connector to existing fixed-route bus services | ns | ns | ns | ns | ns | ns | ns |
| Connector to longer distance services | ns | ns | ns | ns | ns | ns | ns |
| Operate as private taxi services | ns | ns | ns | ns | ns | ns | ns |
| Accommodate as a multipurpose service | ns | ns | ns | ns | ns | ns | ns |
| Integrated with other transport offerings | ns | ns | ns | ns | ns | ns | ns |
| Operate 24/7 | ns | ns | ns | ns | ns | ns | ns |
| Suitable trip purposes for ADRTs | |||||||
| Work | ns | ns | ns | ns | ns | ns | ns |
| School | ns | ns | ns | ns | ns | ns | ns |
| University | ns | ns | ns | ns | ns | ns | ns |
| Shopping | ns | ns | ns | ns | ns | ns | ns |
| Medical | ns | ns | ns | ns | ns | ns | ns |
| Leisure | ns | * | ns | ns | ns | ns | ns |
| Emergency | ns | ns | ns | ns | ns | ns | ns |
| Special events or gatherings | ns | ns | ns | ns | ns | ns | ns |
| Suitable demographic groups for ADRTs | |||||||
| School children | ns | ns | ns | ns | ns | ns | ns |
| University students | ns | ns | ns | * | ns | * | ns |
| Working professionals | ns | ns | ns | ns | ns | * | ns |
| Senior citizens | ns | ns | ns | ns | ns | ns | ns |
| Tourists | ns | ns | ns | ns | ns | ns | ns |
| Leisure travellers | ns | ns | ns | ns | ns | ns | ns |
| People with physical disabilities | ns | ns | ns | ns | ns | ns | ns |
| People with sensory disabilities | * | ns | ns | ns | ns | ns | ns |
| People with cognitive disabilities | ns | ns | ns | ns | ns | ns | ns |
| Low-income individuals | ns | ns | ns | ns | ns | ns | ns |
| Middle-income individuals | ns | ns | ns | ns | ns | ns | ns |
| High-income individuals | ns | ns | ns | ns | ns | * | ns |
| Suitable land use for ADRTs | |||||||
| Residential neighbours | ns | ns | ns | ns | ns | ns | ns |
| Industrial/ business parks | ns | ns | ns | ns | ns | ns | ns |
| University precincts | ns | ns | ns | ns | ns | * | ns |
| Agricultural land areas | ns | ns | ns | ns | ns | ns | ns |
| Tourist destinations | ns | ns | ns | ns | ns | ns | ns |
| Town centres | ns | ns | ns | ns | ns | ns | ns |
| Impacts on passenger performance from ADRTs | |||||||
| Improve quality of service | * | ns | ns | ns | ns | ns | ns |
| Improve user experience | * | ns | ns | ns | ns | ns | ns |
| Improve accessibility | ns | ns | ns | ns | ns | ns | ns |
| Improve safety | ** | ns | ns | ns | ns | ns | ns |
| Improve security | ** | * | * | ns | ns | ns | ns |
| Social impacts from ADRTs | |||||||
| Create new job opportunities | ** | ns | ns | ns | ns | ns | ns |
| Improve social inclusion for disadvantaged groups | ns | ns | ns | ns | ns | ns | ns |
| Enhance community interaction and social cohesion | ns | * | ns | ns | ns | ns | ns |
| Benefit local businesses and economic activity | ns | ns | ns | ns | ns | ns | ns |
| Influence urban planning and development | ns | ns | ns | * | ns | * | ns |
| Improve public health and well-being | ns | * | ns | * | ns | ns | ns |
| Enhance personal safety and security in public spaces | ** | * | ns | * | ns | ns | ns |
| Promote social equity in transport access | ns | * | ns | * | ns | ns | ns |
| Environmental impacts from ADRTs | |||||||
| Reduce GHG emissions | ns | ns | ns | ns | ns | * | ns |
| Reduce noise pollution | ns | ns | ns | ns | ns | ns | ns |
| Reduce local air pollution | ns | ns | ns | ns | ns | ns | ns |
| Reduce heat in built-up areas | ns | ns | ns | ns | ns | ns | ns |
| Improve wildlife habitats | * | * | ns | ns | ns | ns | ns |
| Response Variable | Model Sig. | Predictor Variable | Std. Error | Wald | Wald Sig. | 95% CI | |
|---|---|---|---|---|---|---|---|
| Lower Bound | Upper Bound | ||||||
| Suitability of ADRTs (University students) | 0.012 | Age (19–35) | 0.546 | 3.815 | 0.050 | −0.004 | 2.137 |
| Age (36–50) | 0.547 | 7.204 | 0.007 | 0.396 | 2.538 | ||
| Age (51–65) | 0.475 | 5.444 | 0.020 | 0.1777 | 2.041 | ||
| Occupation (Retired) | 0.462 | 5.639 | 0.018 | 0.192 | 2.004 | ||
| Education level (Year 10) | 0.457 | 5.913 | 0.015 | −2.006 | −0.216 | ||
| Education level (Trade apprentice/TAFE) | 0.387 | 10.014 | 0.002 | −1.981 | −0.466 | ||
| Disability (Yes) | 0.376 | 5.091 | 0.024 | 0.112 | 1.587 | ||
| Impacts of ADRTs (Positive influence on urban planning and development) | 0.017 | Age (36–50) | 0.545 | 4.663 | 0.031 | 0.109 | 2.243 |
| Education level (Year 10) | 0.459 | 8.421 | 0.004 | −2.230 | −0.432 | ||
| Education level (Trade apprentice/ TAFE) | 0.384 | 5.468 | 0.019 | −1.653 | −0.145 | ||
| Disability (Yes) | 0.381 | 8.640 | 0.003 | 0.373 | 1.865 | ||
| Impacts of ADRTs (Improve public health and well-being) | 0.009 | Age (19–35) | 0.549 | 4.913 | 0.027 | 0.141 | 2.292 |
| Age (36–50) | 0.548 | 7.253 | 0.007 | 0.402 | 2.548 | ||
| Education level (Year 10) | 0.456 | 5.520 | 0.019 | −1.964 | −0.178 | ||
| Education level (Trade apprentice/TAFE) | 0.384 | 8.500 | 0.004 | −1.872 | −0.367 | ||
| Impacts of ADRTs (Enhance personal safety and security in public space) | 0.002 | Gender (Man) | 0.263 | 3686.049 | <0.001 | 15.433 | 16.642 |
| Education level (Trade apprentice/TAFE) | 0.374 | 4.166 | 0.041 | −1.497 | −0.030 | ||
| Impacts of ADRTs (Promote social equity in transport access) | 0.026 | Education level (Year 10) | 0.461 | 8.447 | 0.004 | −2.246 | −0.437 |
| Impacts of ADRTs (Improve wildlife habitats) | 0.019 | Gender (Man) | 0.267 | 3613.159 | <0.001 | 15.526 | 16.572 |
| Age (19–35) | 0.554 | 5.872 | 0.015 | 0.257 | 2.430 | ||
| Age (36–50) | 0.556 | 11.383 | <0.001 | 0.787 | 2.968 | ||
| Age (51–65) | 0.478 | 3.852 | 0.050 | 0.001 | 1.874 | ||
| Education level (Trade apprentice/TAFE) | 0.386 | 6.634 | 0.010 | −1.750 | −0.238 | ||
Disclaimer/Publisher’s Note: The statements, opinions and data contained in all publications are solely those of the individual author(s) and contributor(s) and not of MDPI and/or the editor(s). MDPI and/or the editor(s) disclaim responsibility for any injury to people or property resulting from any ideas, methods, instructions or products referred to in the content. |
© 2025 by the authors. Licensee MDPI, Basel, Switzerland. This article is an open access article distributed under the terms and conditions of the Creative Commons Attribution (CC BY) license (https://creativecommons.org/licenses/by/4.0/).
Share and Cite
Jayatilleke, S.; Bhaskar, A.; Bunker, J.M. A Cross-Sectional Study on the Public Perception of Autonomous Demand-Responsive Transits (ADRTs) in Rural Towns: Insights from South-East Queensland. Smart Cities 2025, 8, 72. https://doi.org/10.3390/smartcities8030072
Jayatilleke S, Bhaskar A, Bunker JM. A Cross-Sectional Study on the Public Perception of Autonomous Demand-Responsive Transits (ADRTs) in Rural Towns: Insights from South-East Queensland. Smart Cities. 2025; 8(3):72. https://doi.org/10.3390/smartcities8030072
Chicago/Turabian StyleJayatilleke, Shenura, Ashish Bhaskar, and Jonathan M. Bunker. 2025. "A Cross-Sectional Study on the Public Perception of Autonomous Demand-Responsive Transits (ADRTs) in Rural Towns: Insights from South-East Queensland" Smart Cities 8, no. 3: 72. https://doi.org/10.3390/smartcities8030072
APA StyleJayatilleke, S., Bhaskar, A., & Bunker, J. M. (2025). A Cross-Sectional Study on the Public Perception of Autonomous Demand-Responsive Transits (ADRTs) in Rural Towns: Insights from South-East Queensland. Smart Cities, 8(3), 72. https://doi.org/10.3390/smartcities8030072