Near-Infrared Spectroscopy (NIRS) and Optical Sensors for Estimating Protein and Fiber in Dryland Mediterranean Pastures
Abstract
:1. Introduction
2. Material and Methods
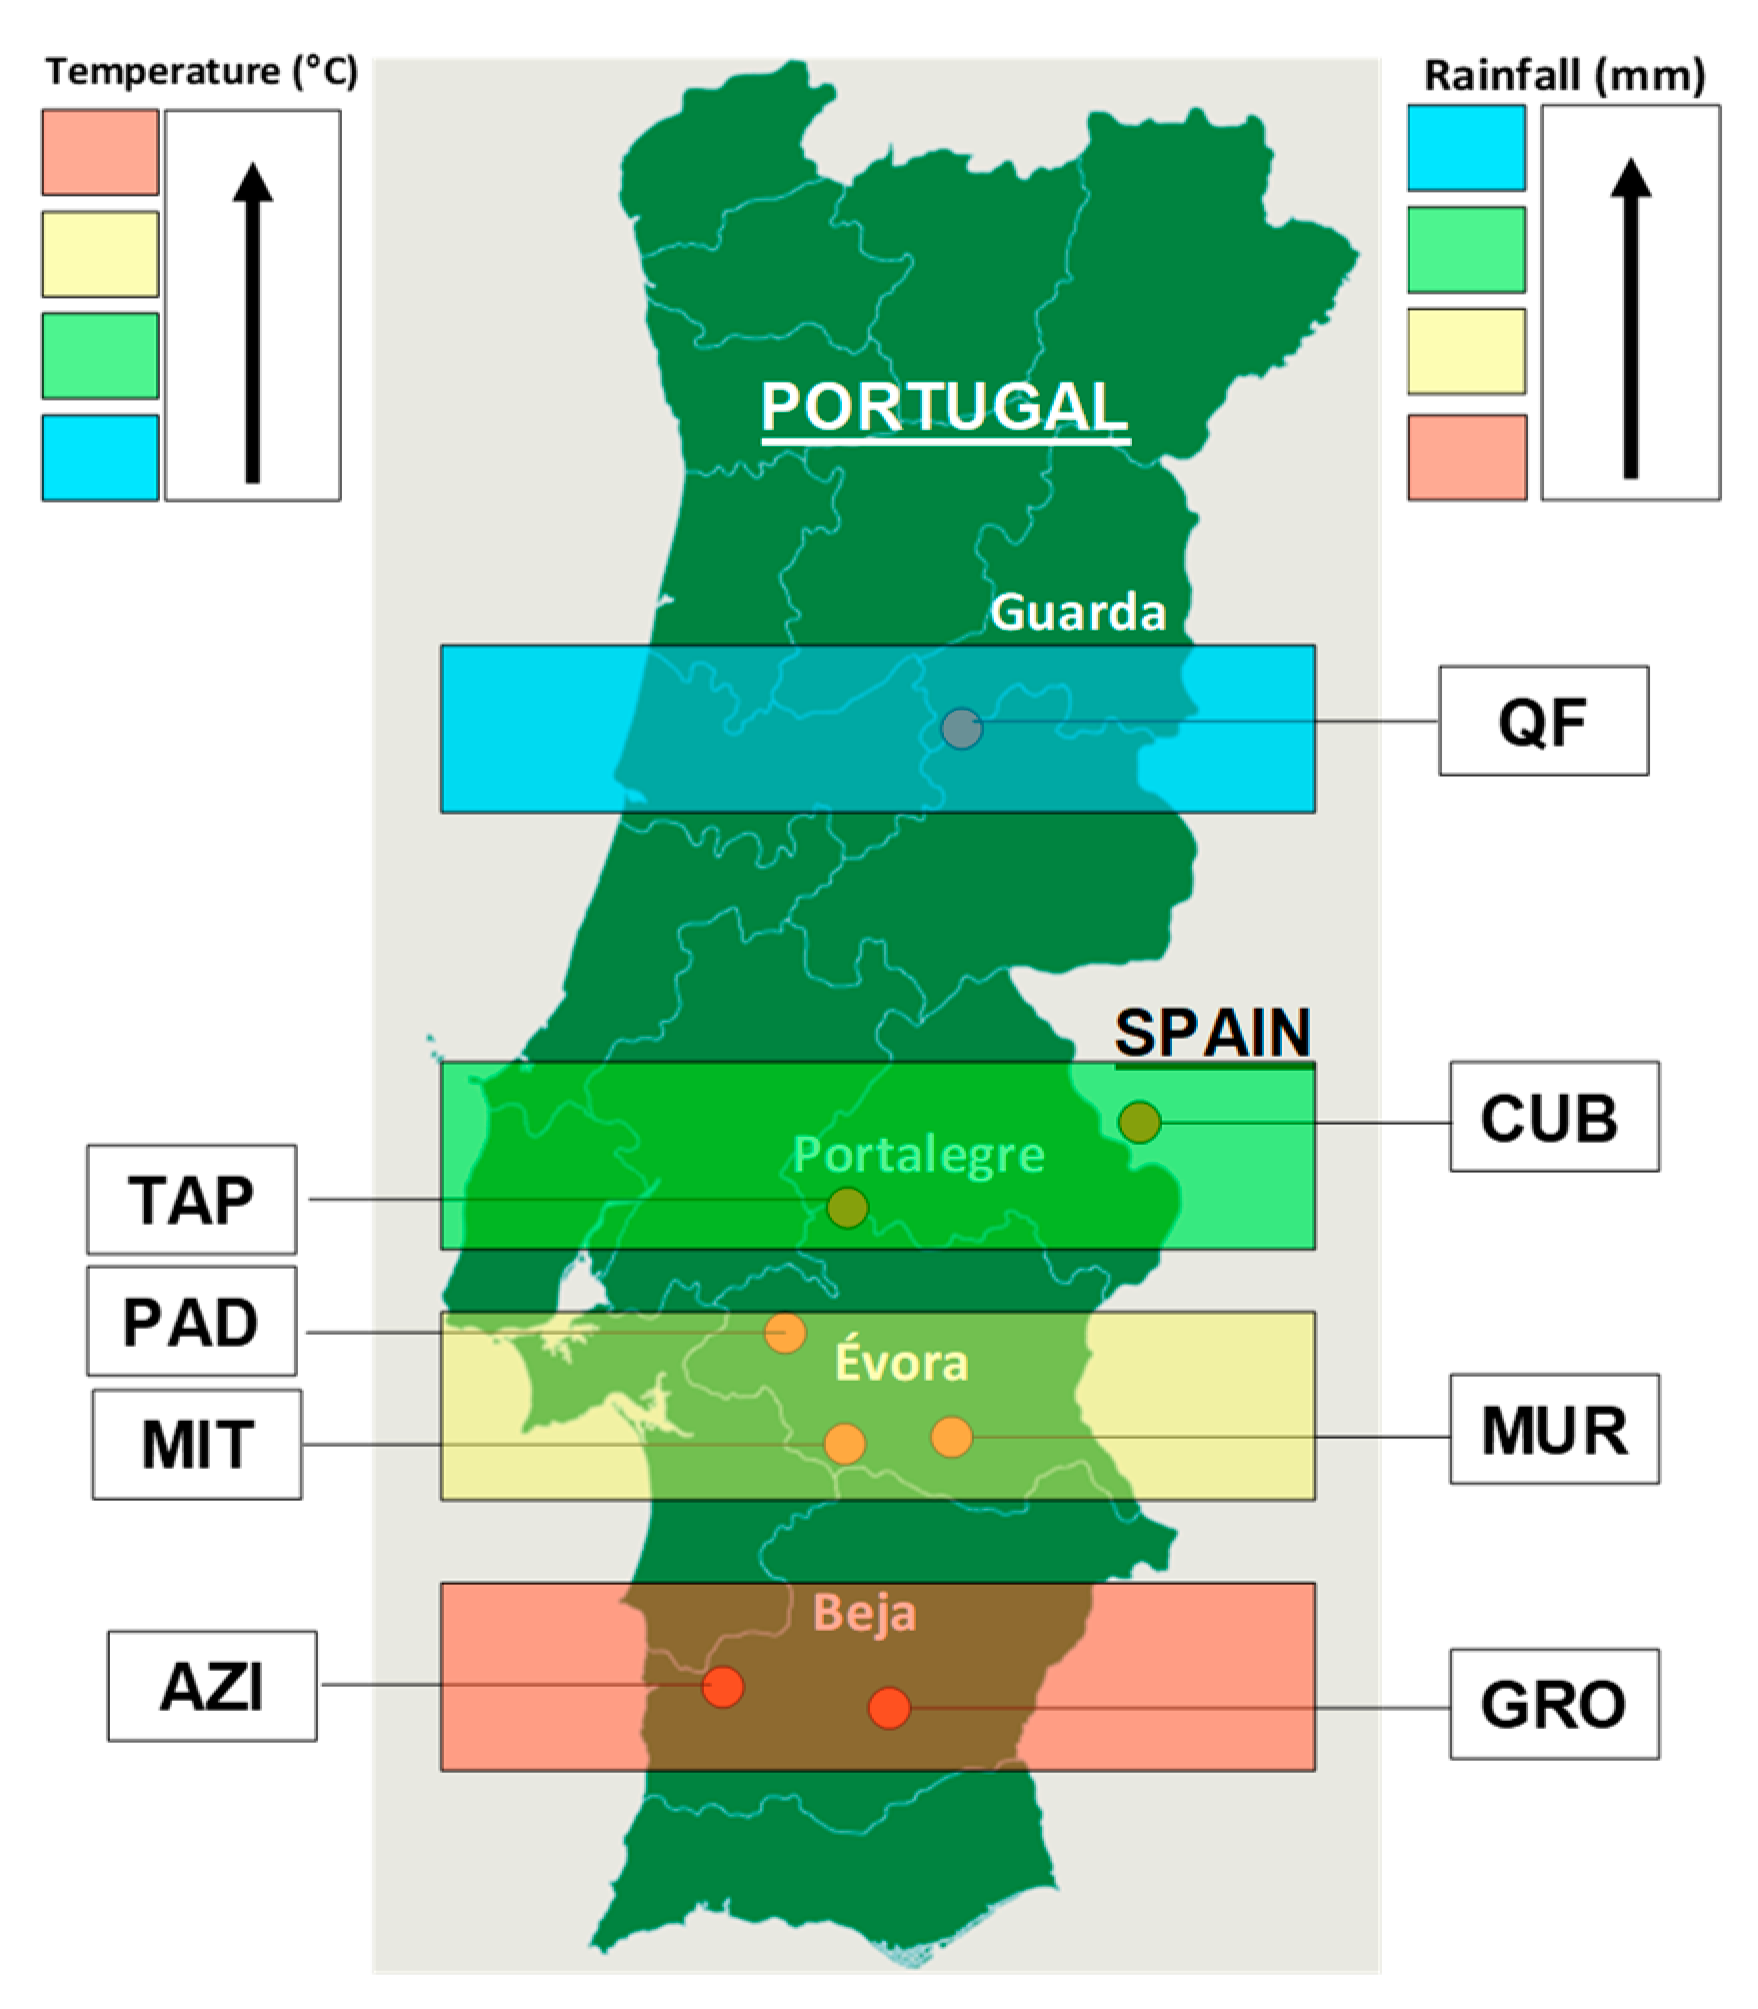
2.1. Characteristics of the Experimental Sites
2.2. Pasture Sampling and Laboratory Processing
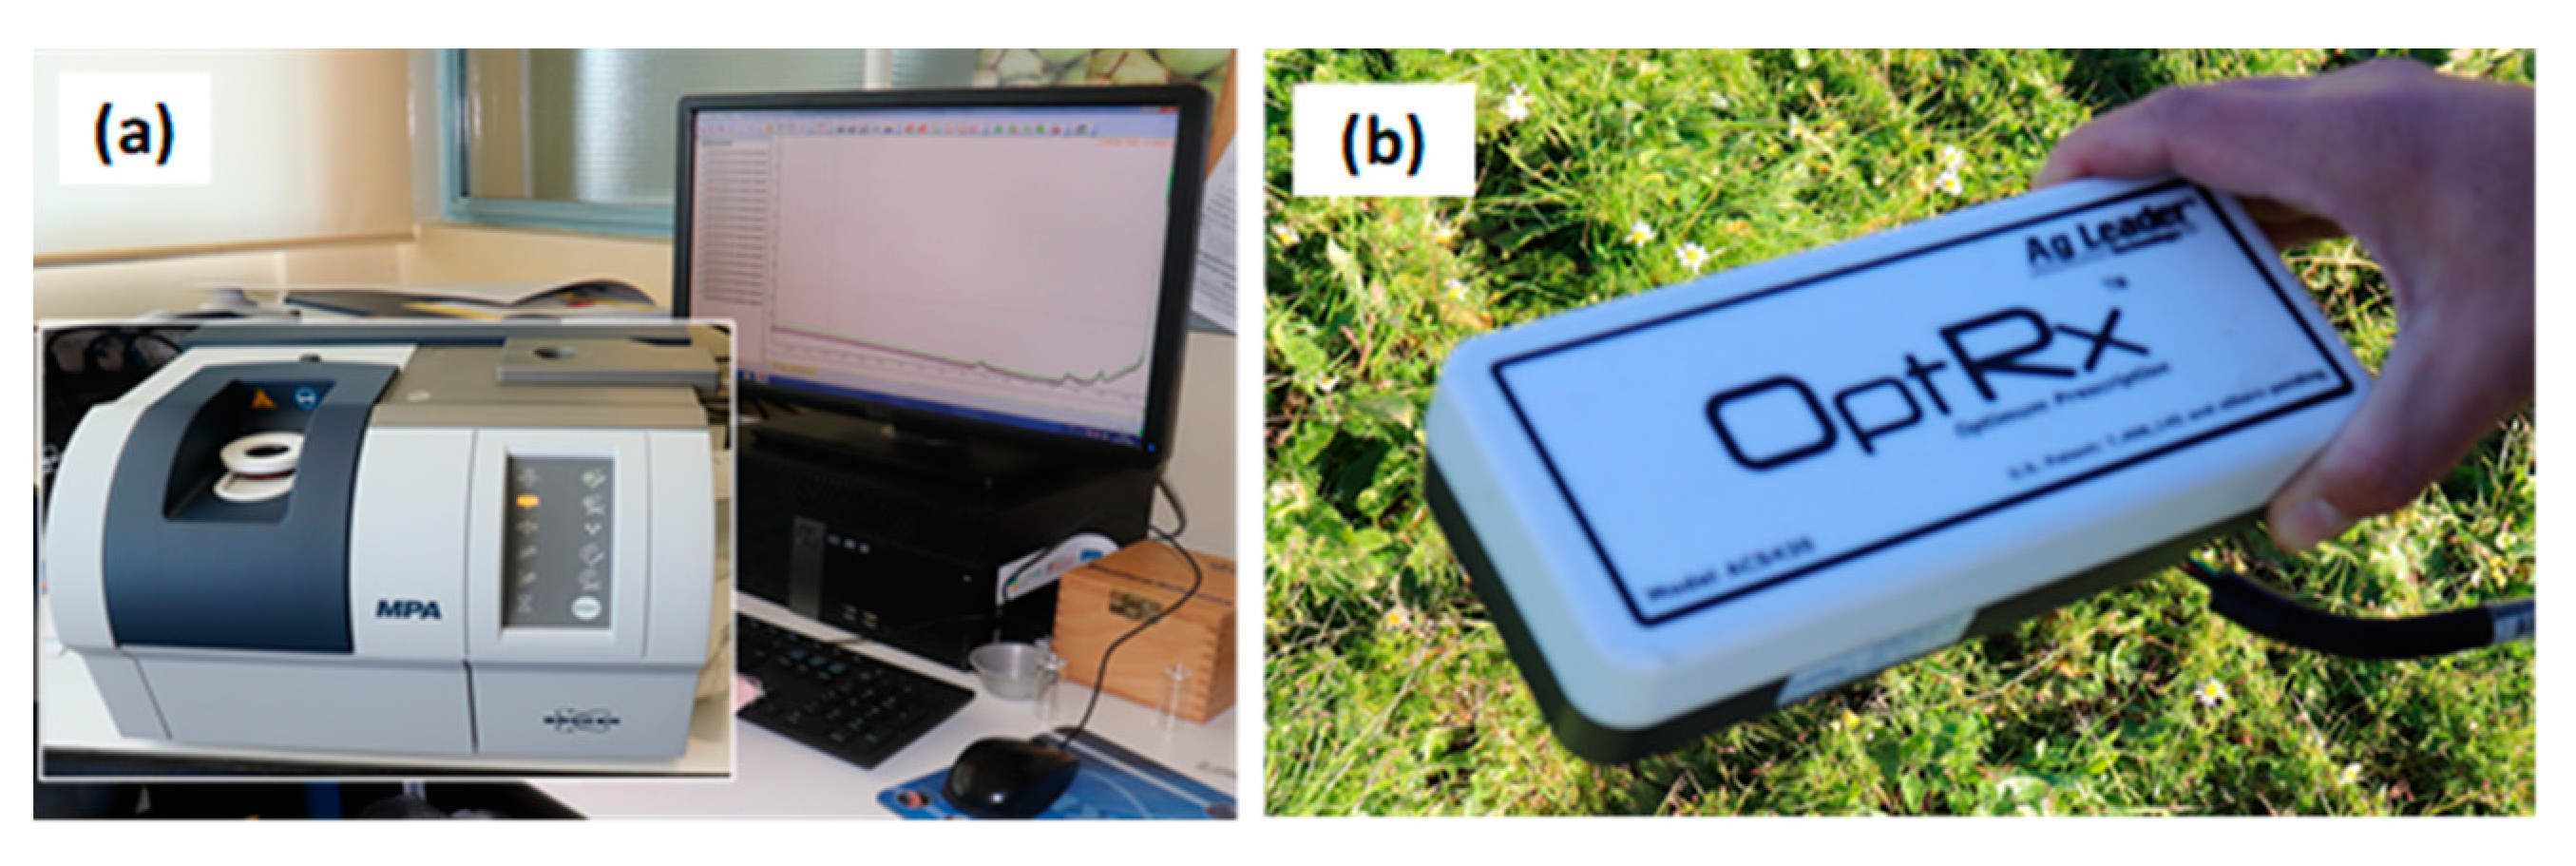
2.3. Laboratory Spectra Acquisition and Processing
2.4. Field Optical Sensor Measurement
2.5. Statistical Analysis
2.5.1. Statistical Analysis of Spectra
2.5.2. Statistical Analysis of Optical Measuring
3. Results and Discussion
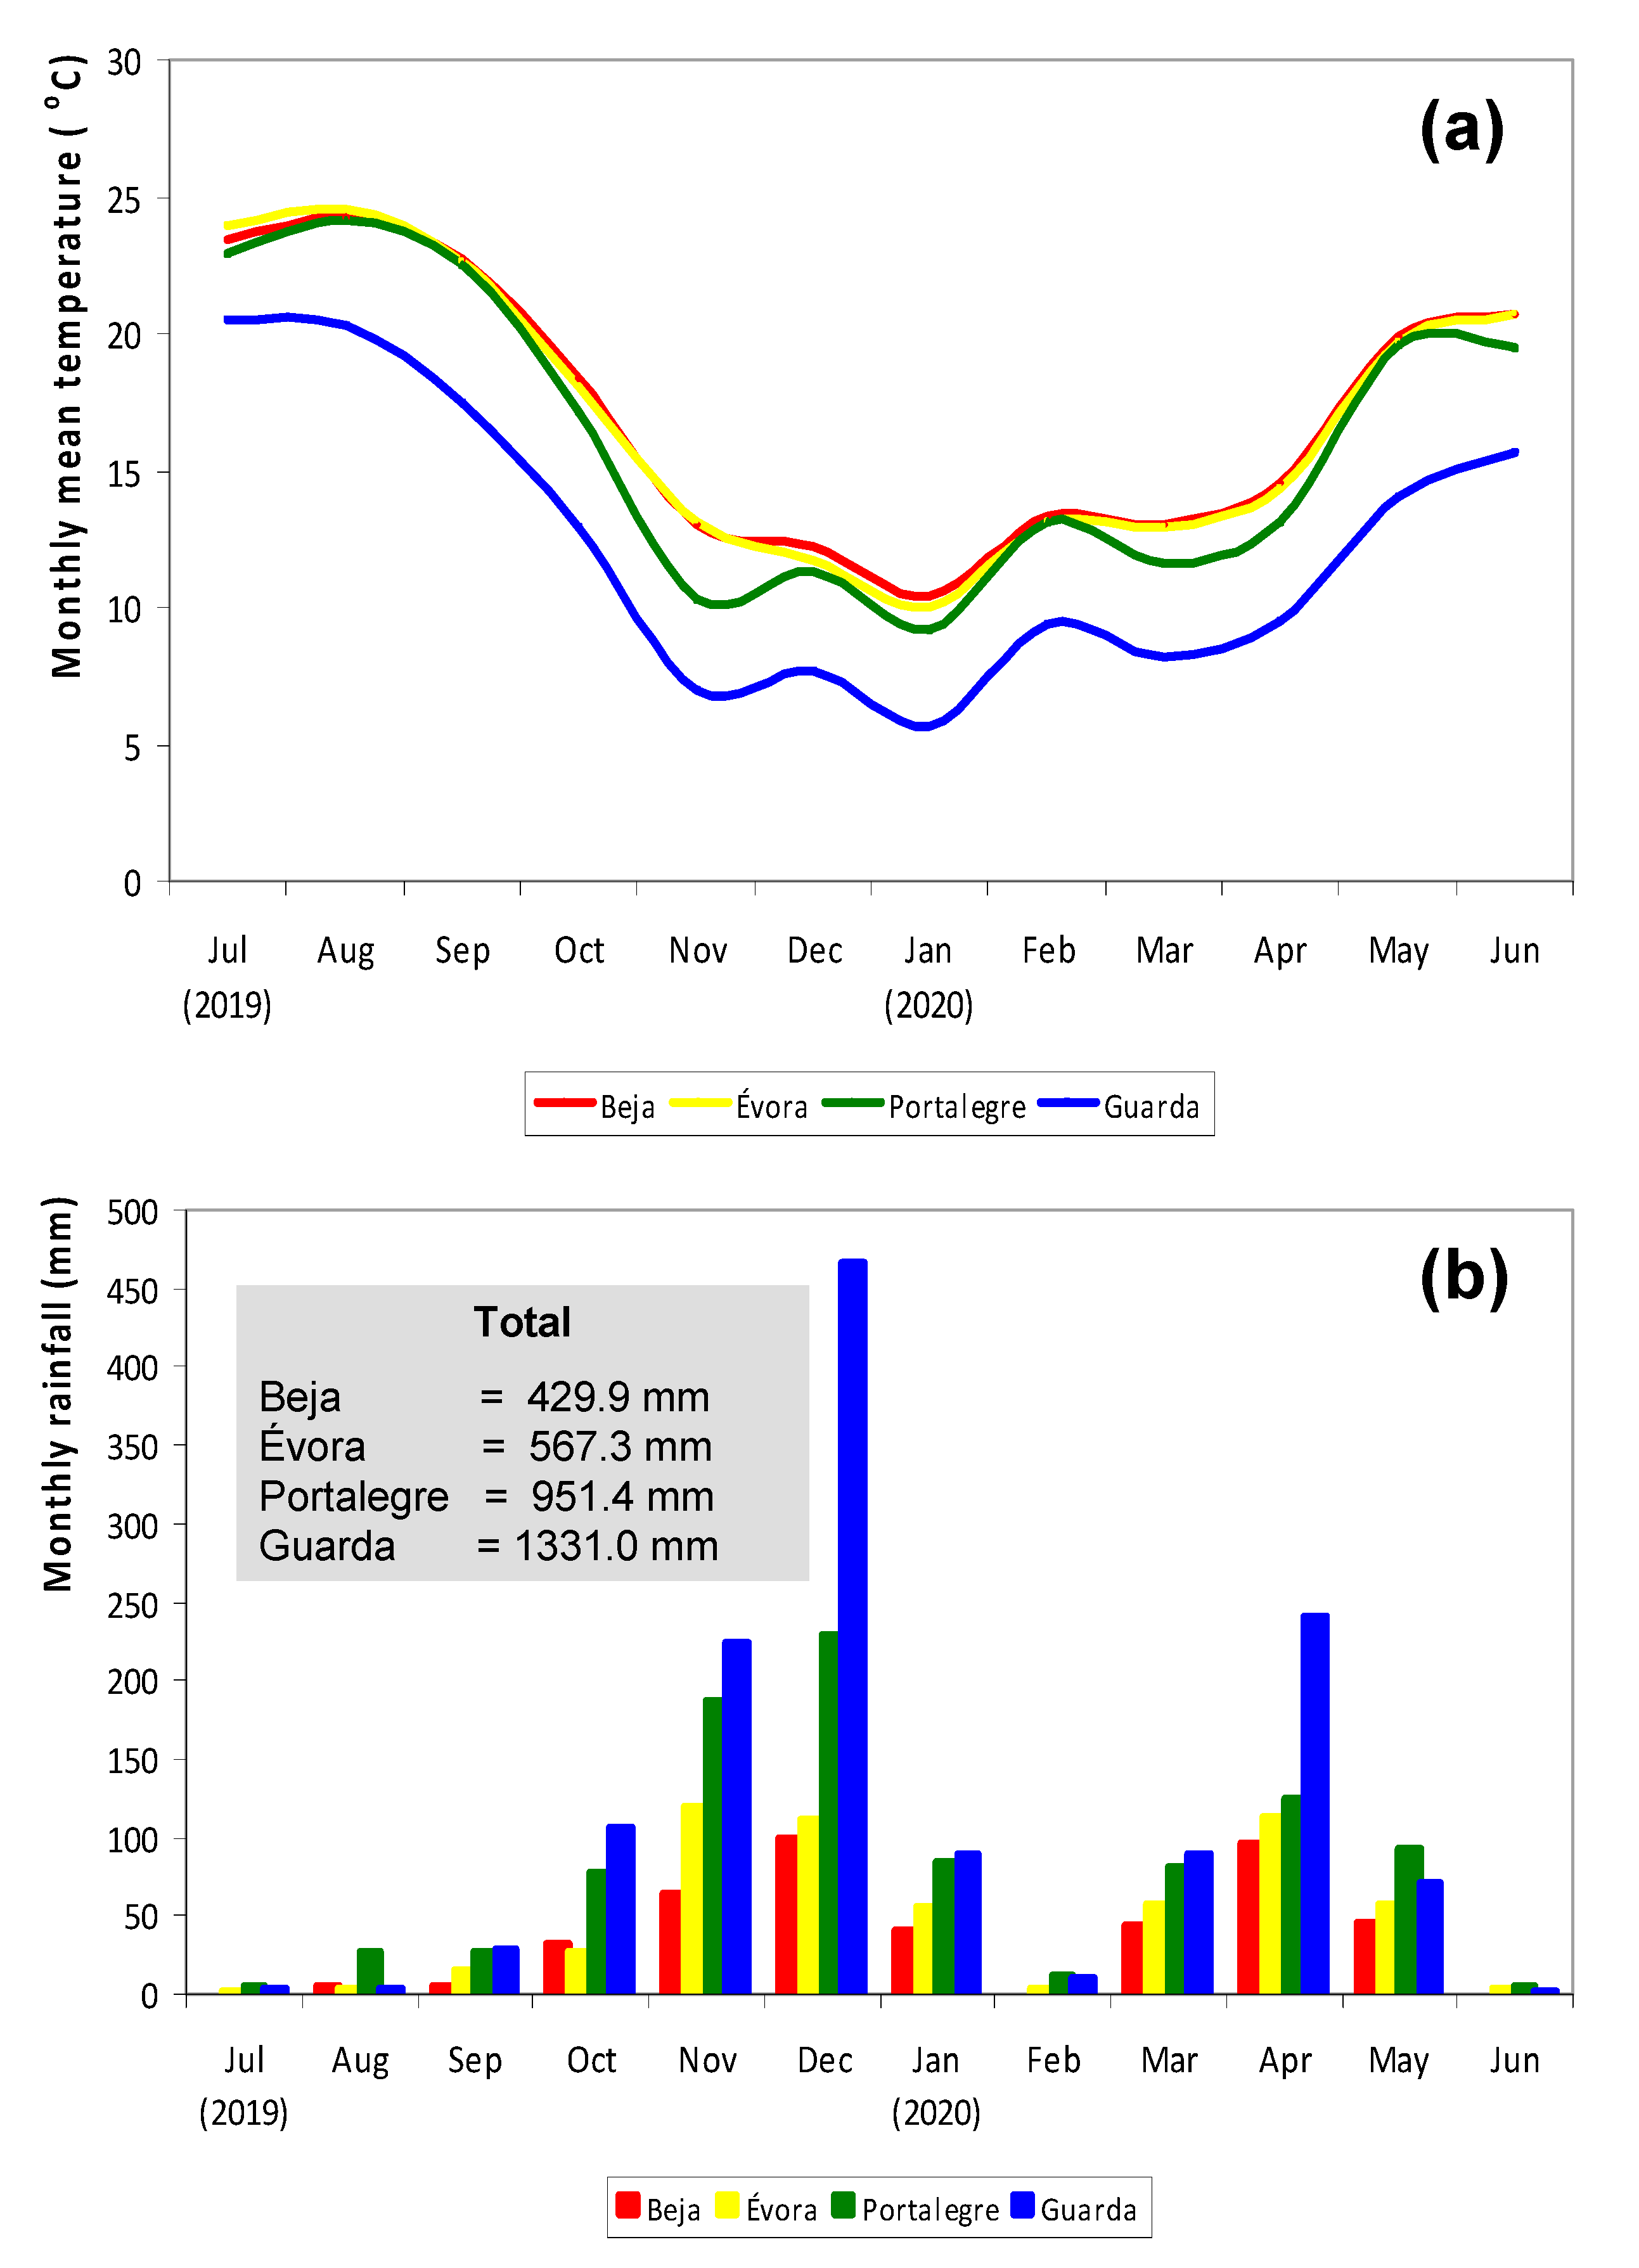
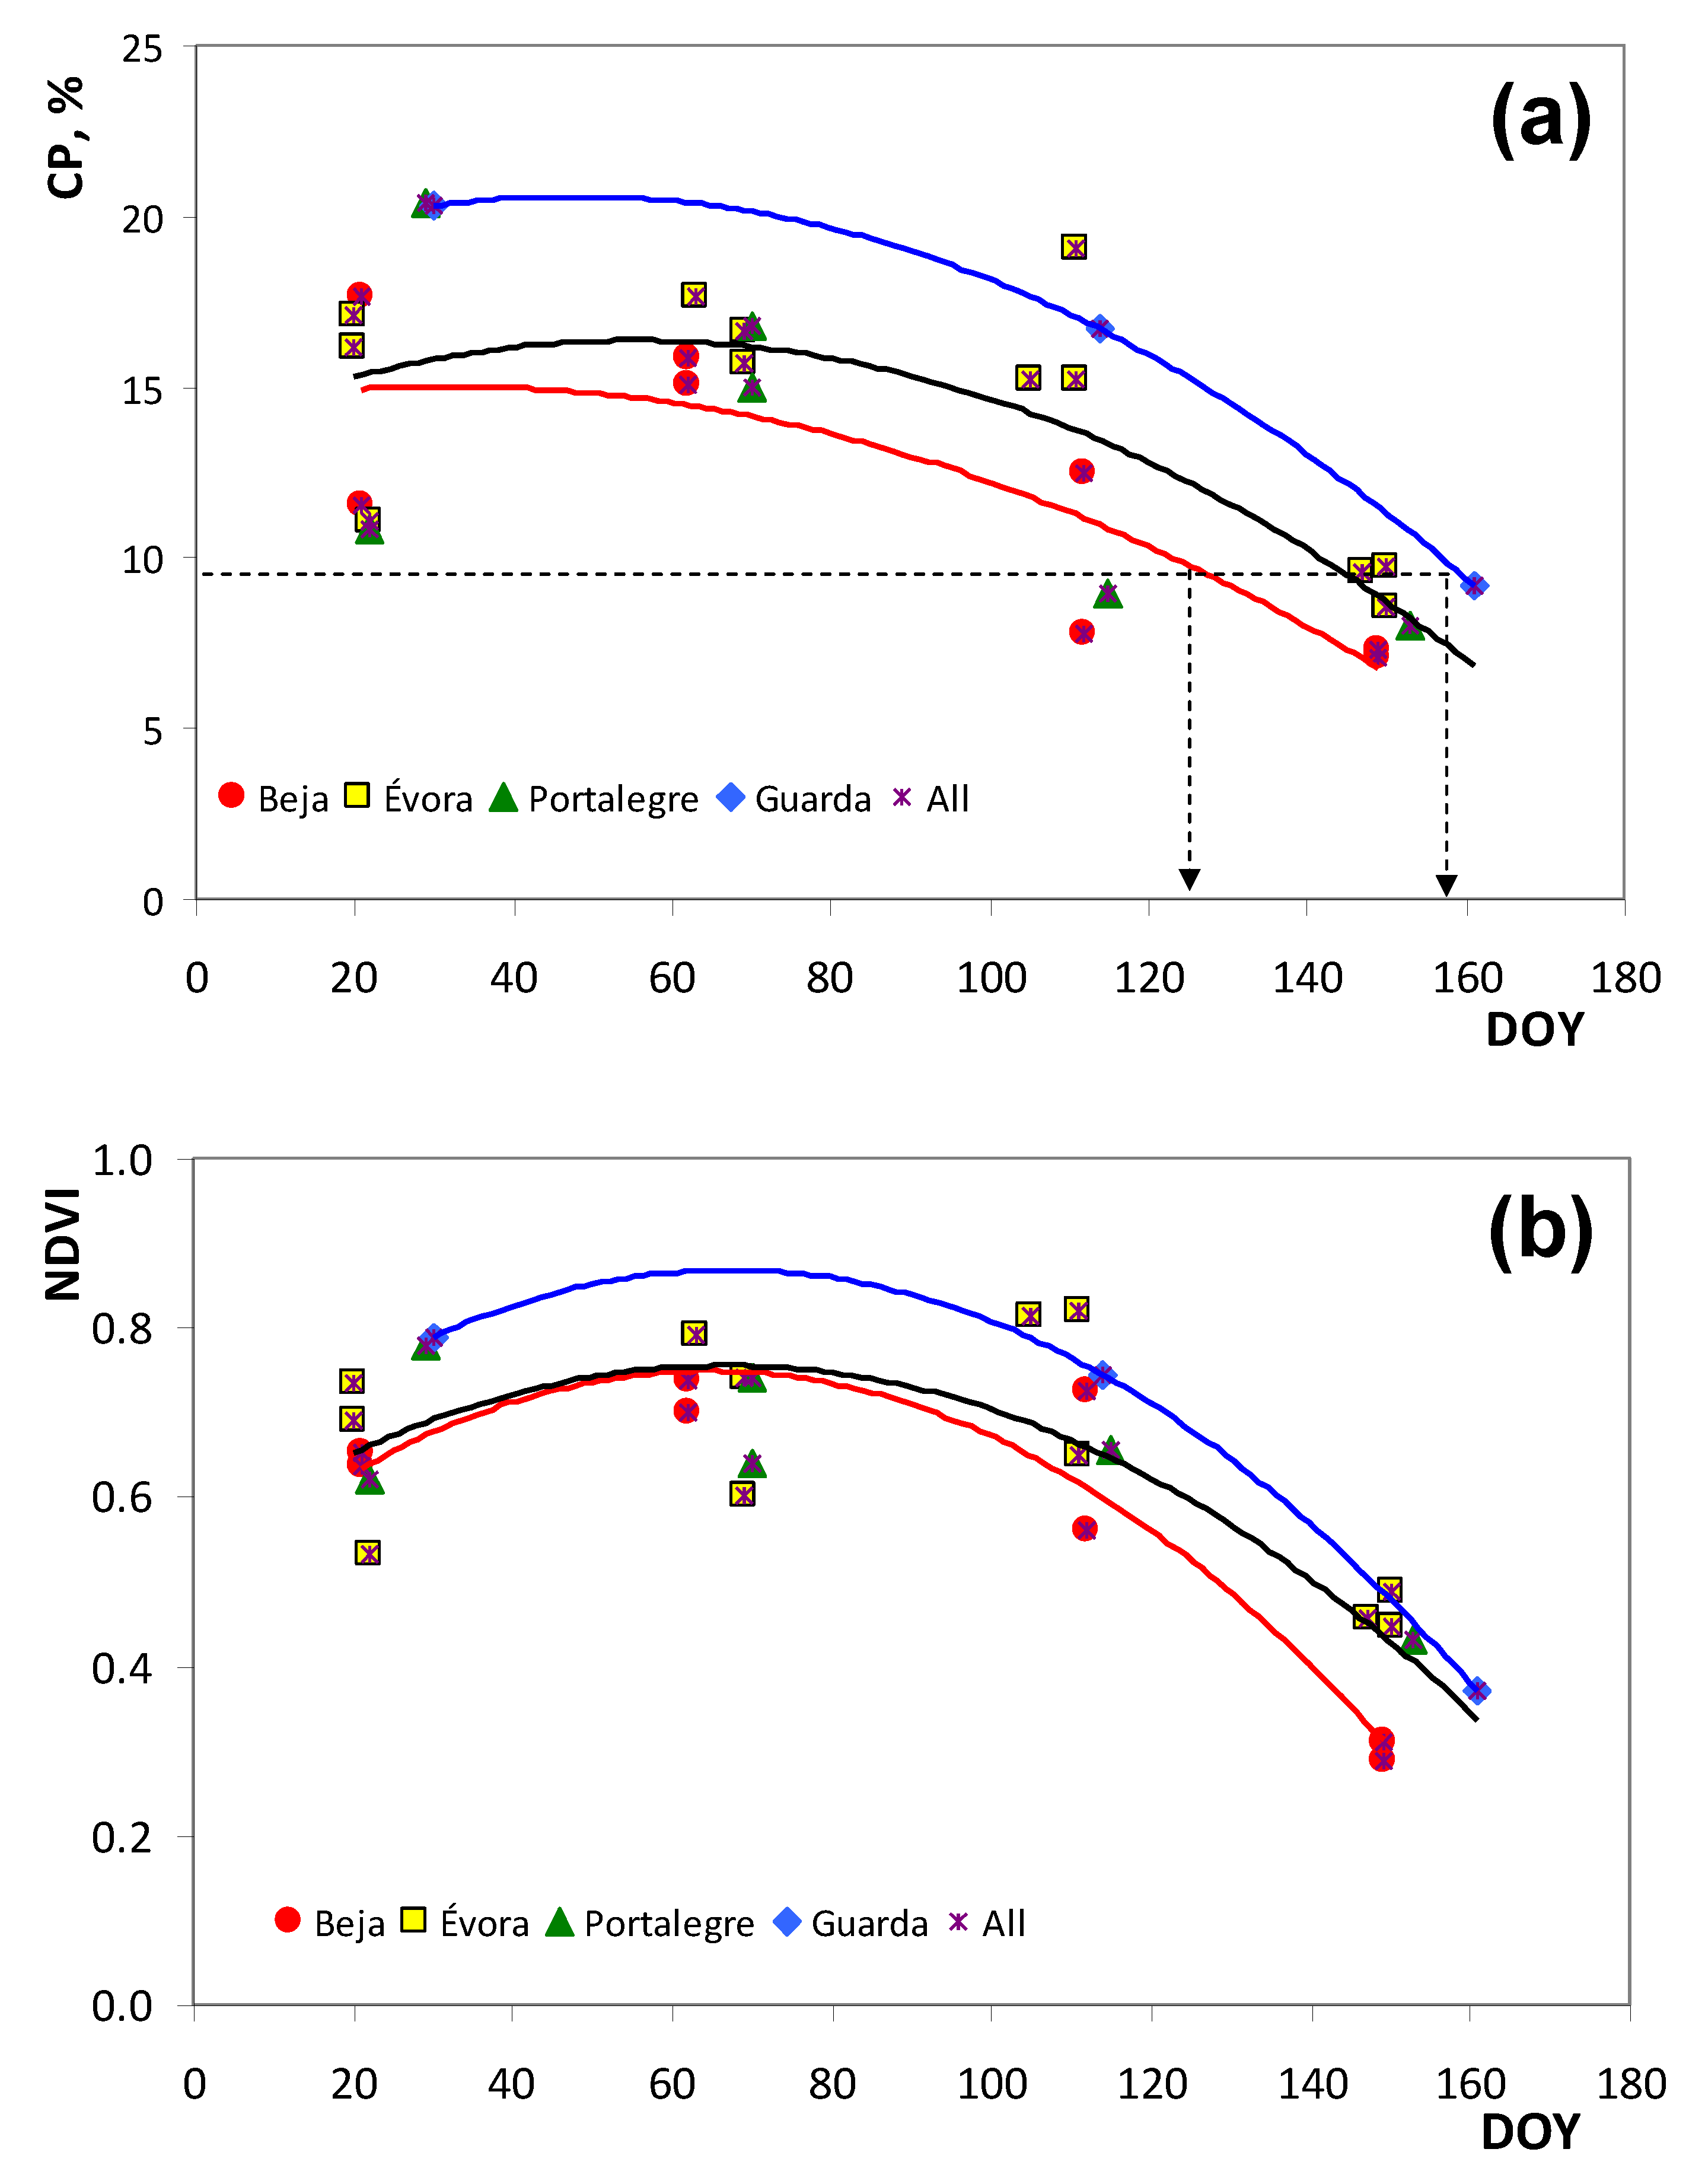
3.1. Spatial and Temporal Variability Pattern of the Measured Parameters
3.2. Evaluation of Near-Infrared Spectroscopy (NIRS)
3.3. Evaluation of Field Optical Sensor
4. Conclusions
Author Contributions
Funding
Acknowledgments
Conflicts of Interest
References
- Efe Serrano, J. Pastures in Alentejo: Technical Basis for Characterization, Grazing and Improvement; Universidade de Évora, ICAM: Évora, Portugal, 2006; pp. 165–178. [Google Scholar]
- Serrano, J.; Shahidian, S.; Marques da Silva, J. Monitoring seasonal pasture quality degradation in the Mediterranean montado ecosystem: Proximal versus remote sensing. Water 2018, 10, 1422. [Google Scholar] [CrossRef] [Green Version]
- Serrano, J.; Shahidian, S.; Marques da Silva, J.; Moral, F.; Carvajal-Ramirez, F.; Carreira, E.; Pereira, A.; Carvalho, M. Evaluation of the effect of dolomitic lime application on pastures—Case study in the Montado Mediterranean ecosystem. Sustainability 2020, 12, 3758. [Google Scholar] [CrossRef]
- Schellberg, J.; Hill, M.J.; Roland, G.; Rothmund, M.; Braun, M. Precision agriculture on grassland: Applications, perspectives and constraints. Eur. J. Agron. 2008, 29, 59–71. [Google Scholar] [CrossRef]
- David, T.S.; Pinto, C.A.; Nadezhdina, N.; Kurz-Besson, C.; Henriques, M.O.; Quilhó, T.; Cermak, J.; Chaves, M.M.; Pereira, J.S.; David, J.S. Root functioning, tree water use and hydraulic redistribution in Quercus suber trees: A modeling approach based on root sap flow. For. Ecol. Manag. 2013, 307, 136–146. [Google Scholar] [CrossRef] [Green Version]
- Bell, M.J.; Mereu, L.; Davis, J. The use of mobile near-infrared spectroscopy for real-time pasture management. Front. Sustain. Food Syst. 2018, 2, 1–10. [Google Scholar] [CrossRef] [Green Version]
- McEntee, P.J.; Bennett, S.J.; Belford, R.K. Mapping the spatial and temporal stability of production in mixed farming systems: An index that integrates crop and pasture productivity to assist in the management of variability. Precis. Agric. 2020, 21, 77–106. [Google Scholar] [CrossRef]
- Swart, E.; Brand, T.S.; Engelbrecht, J. The use of near infrared spectroscopy (NIRS) to predict the chemical composition of feed samples used in ostrich total mixed rations. S. Afr. J. Anim. Sci. 2012, 5, 42. [Google Scholar] [CrossRef] [Green Version]
- Ling, B.; Gooding, D.G.; Raynor, E.J.; Joern, A. Hyperspectral analysis of leaf pigments and nutritional elements in tallgrass prairie vegetation. Front. Plant Sci. 2019, 10, 142. [Google Scholar] [CrossRef] [Green Version]
- Mutanga, O.; Skidmore, A.K.; Prins, H.H.T. Predicting in situ pasture quality in the Kruger National Park, South Africa, using continuum-removed absorption features. Remote Sens. Environ. 2004, 89, 393–408. [Google Scholar] [CrossRef]
- Gaffney, R.; Porensky, L.M.; Gao, F.; Irisarri, J.G.; Durante, M.; Derner, J.D.; Augustine, D.J. Using APAR to predict aboveground plant productivity in semi-arid rangelands: Spatial and temporal relationships differ. Remote Sens. 2018, 10, 1474. [Google Scholar] [CrossRef] [Green Version]
- Lugassi, R.; Chudnovsky, A.; Zaady, E.; Dvash, L.; Goldshleger, N. Spectral slope as an indicator of pasture quality. Remote Sens. 2015, 7, 256–274. [Google Scholar] [CrossRef] [Green Version]
- Goering, H.K.; Van Soest, P.J. Forage fibre analysis (apparatus reagents, procedures and some applications). In Agriculture Handbook; USDA-ARS: Albany, NY, USA, 1970. [Google Scholar]
- Lumbierres, M.; Méndez, P.F.; Bustamante, J.; Soriguer, R.; Santamaria, L. Modeling biomass production in seasonal wetlands using Modis NDVI land surface phenology. Remote Sens. 2017, 9, 392. [Google Scholar] [CrossRef] [Green Version]
- Serrano, J.; Shahidian, S.; Marques da Silva, J.; Paixão, L.; Carreira, E.; Carmona-Cabezas, R.; Nogales-Bueno, J.; Rato, A.E. Evaluation of near infrared spectroscopy (NIRS) and remote sensing (RS) for estimating pasture quality in Mediterranean Montado ecosystem. Appl. Sci. 2020, 10, 4463. [Google Scholar] [CrossRef]
- Parrini, S.; Acciaioli, A.; Franci, O.; Pugliese, C.; Bozzi, R. Near infrared spectroscopy technology for prediction of chemical composition of natural fresh pastures. J. Appl. Anim. Res. 2019, 47, 514–520. [Google Scholar] [CrossRef]
- Danieli, P.P.; Carlini, P.; Bernabucci, U.; Ronchi, B. Quality evaluation of regional forage resources by means of near infrared reflectance spectroscopy. Ital. J. Anim. Sci. 2004, 3, 363–376. [Google Scholar] [CrossRef]
- Campo, L.; Monteagudo, A.B.; Salleres, B.; Castro, P.; Moreno-Gonzalez, J. NIRS Determination of non-structural carbohydrates, water soluble carbohydrates and other nutritive quality traits in whole plant maize with wide range variability. Span. J. Agric. Res. 2013, 11, 463–471. [Google Scholar] [CrossRef] [Green Version]
- Souza, M.; Kuhnen, S.; Kazama, D.C.S.; Kurtz, C.; Trapp, T.; Júnior, V.M.; Comina, J.J. Prediction of contents of phenolic compounds and flavonoids in Aerial part of Secale cereale L., Avena strigosa L. and Raphanus sativus L. with Near infrared spectroscopy (NIR). Quim. Nova 2017, 40, 1074–1081. [Google Scholar]
- Alomar, D.; Fuchlocher, R.; Pablo, M. Effect of Preparation Method on Composition and NIR Spectra of Forage Samples. Anim. Feed Sci. Technol. 2003, 107, 191–200. [Google Scholar] [CrossRef]
- Chao, Z.; Liu, N.; Zhang, P.; Ying, T.; Song, K. Estimation methods developing with remote sensing information for energy crop biomass: A comparative review. Biomass Bioenergy 2019, 122, 414–425. [Google Scholar] [CrossRef]
- Rio-Mena, T.; Willemen, L.; Tesfamariama, G.T.; Beukes, O.; Nelson, A. Remote sensing for mapping ecosystem services to support evaluation of ecological restoration interventions in an arid landscape. Ecol. Indic. 2020, 113, 106182. [Google Scholar] [CrossRef]
- Serrano, J.; Shahidian, S.; Moral, F.; Carvajal-Ramirez, F.; Marques da Silva, J. Estimation of productivity in Dryland Mediterranean pastures: Long-term field tests to calibration and validation of the grassmaster II probe. AgriEngineering 2020, 2, 240–255. [Google Scholar] [CrossRef]
- Nawar, S.; Corstanje, R.; Halcro, G.; Mulla, D.; Mouazen, A.M. Delineation of soil management zones for variable-rate fertilization: A review. Adv. Agron. 2017, 143, 175–245. [Google Scholar]
- Handcock, R.N.; Gobbett, D.L.; González, L.A.; Bishop-Hurley, G.J.; McGavin, S.L. A pilot project combining multispectral proximal sensors and digital cameras for monitoring tropical pastures. Biogeosciences 2016, 13, 4673–4695. [Google Scholar] [CrossRef] [Green Version]
- Aiken, G.E.; Bransby, D.I. Observer variability for disk meter measurements of forage mass. Agron. J. 1992, 84, 603–605. [Google Scholar] [CrossRef]
- Teye, E.; Amuah, C.L.Y.; McGrath, T.; Elliott, C. Innovative and rapid analysis for rice authenticity using hand-held NIR spectrometry and chemometrics. Spectrochim. Acta A Mol. Biomol. Spectrosc. 2019, 217, 147–154. [Google Scholar] [CrossRef] [PubMed]
- Donis-González, I.R.; Valero, C.; Momin, M.A.; Kaur, A.; Slaughter, D.C. Performance evaluation of two commercially available portable spectrometers to non-invasively determine table grape and peach quality attributes. Agronomy 2020, 10, 148. [Google Scholar] [CrossRef] [Green Version]
- Serrano, J.; Shahidian, S.; Marques da Silva, J. Evaluation of normalized difference water index as a tool for monitoring pasture seasonal and inter-annual variability in a Mediterranean agro-silvo-pastoral system. Water 2019, 11, 62. [Google Scholar] [CrossRef] [Green Version]
- Reddy, A.R.; Chaitanya, K.V.; Vivekanandan, M. Drought-induced responses of photosynthesis and antioxidant metabolism in higher plants. J. Plant. Physiol. 2004, 161, 1189–1202. [Google Scholar] [CrossRef] [PubMed]
- AOAC. Official Method of Analysis of AOAC International, 18th ed.; AOAC International: Arlington, AT, USA, 2005. [Google Scholar]
- Wold, S.; Sjostrom, M.; Eriksson, L. PLS-regression: A basic tool of chemometrics. Chemometr. Intell. Lab. Syst. 2001, 58, 109–130. [Google Scholar] [CrossRef]
- Gholizadeh, A.; Borůvka, L.; Saberioon, M.M.; Kozák, J.; Vašát, R.; Němeček, K. Comparing different data preprocessing methods for monitoring soil heavy metals based on soil spectral features. Soil Water Res. 2015, 10, 218–227. [Google Scholar] [CrossRef] [Green Version]
- Rinnan, A.; Berg, F.; Engelsen, S. Review of the most common pre-processing techniques for near-infrared spectra. Trends Anal. Chem. 2009, 28, 1201–1222. [Google Scholar] [CrossRef]
- National Research Council. Nutrient Requirements of Sheep, 6th ed.; National Academy Press: Washington DC, USA, 1985; Volume 5. [Google Scholar]
- Aleixandre-Tudo, J.L.; Nieuwoudt, H.; Olivieri, A.; Aleixandre, J.L.; Toit, W. Phenolic profiling of grapes, fermenting samples and wines using UV-Visible spectroscopy with chemometrics. Food Control 2018, 85, 11–22. [Google Scholar] [CrossRef]
- Fagan, C.C.; Everard, C.D.; McDonnell, K. Prediction of moisture, calorific value, ash and carbon content of two dedicated bioenergy crops using near-infrared spectroscopy. Bioresour. Technol. 2011, 102, 5200–5206. [Google Scholar] [CrossRef] [PubMed]
- Murray, I. Forage analysis by near infrared spectroscopy. In Sward Measurement Handbook, 2nd ed.; Davies, A., Baker, R.D., Grant, S.A., Laidlaw, A.S., Eds.; The British Grassland Society: Reading, UK, 1993. [Google Scholar]
- Viscarra Rossel, R.A.; Walvoort, D.J.J.; McBratney, A.B.; Janik, L.J.; Skjemstad, J.O. Visible, near infrared, mid infrared or combined diffuse reflectance spectroscopy for simultaneous assessment of various soil properties. Geoderma 2006, 131, 59–75. [Google Scholar] [CrossRef]
- Versari, A.; Laurie, V.F.; Ricci, A.; Laghi, L.; Parpinello, G.P. Progress in authentication, typification and traceability of grapes and wines by chemometric approaches. Food Res. Int. 2014, 60, 2–18. [Google Scholar] [CrossRef]
- Batten, G.D. Plant analysis using near infrared reflectance spectroscopy: The potential and the limitations. Aust. J. Exp. Agric. 1998, 38, 697–706. [Google Scholar] [CrossRef]
- Garcia, J.; Cozzolino, D. Use of near infrared reflectance (NIR) spectroscopy to predict chemical composition of forages in broad-based calibration models. Agric. Tech. 2006, 66, 41–47. [Google Scholar] [CrossRef]
- Jackson, J.; Ash, A.J. Tree-grass relationships in open eucalypt woodlands of northeastern Australia: Influence of trees on pasture productivity, forage quality and species distribution. Agrofor. Syst. 1998, 40, 159–176. [Google Scholar] [CrossRef]
- Gu, Y.; Hunt, E.; Wardlow, B.; Basara, J.B.; Brown, J.F.; Verdin, J.P. Evaluation of MODIS NDVI and NDWI for vegetation drought monitoring using Oklahoma Mesonet soil moisture data. Geophys. Res. Lett. 2008, 35, L22401. [Google Scholar] [CrossRef] [Green Version]



| Field Code | Date | DOY | D/F | PMC, % | CP, %DM | NDF, %DM | NDVI | ||||
|---|---|---|---|---|---|---|---|---|---|---|---|
| (2020) | (2020) | Mean ± SD | Range | Mean ± SD | Range | Mean ± SD | Range | Mean ± SD | Range | ||
| “AZI” | 21-JAN | 21 | D | 72.1 ± 4.7 | 62.5–77.3 | 11.5 ± 1.8 | 9.2–13.8 | 58.7 ± 5.3 | 47.3–62.9 | 0.636 ± 0.055 | 0.529–0.708 |
| 02-MAR | 62 | D/F | 78.2 ± 3.7 | 72.7–83.1 | 15.8 ± 1.1 | 14.4–17.7 | 53.2 ± 3.7 | 48.8–59.9 | 0.698 ± 0.045 | 0.607–0.748 | |
| 21-APR | 112 | D | 83.1 ± 1.9 | 79.8–86.1 | 12.4 ± 1.8 | 8.9–14.4 | 56.5 ± 3.5 | 51.8–63.6 | 0.724 ± 0.035 | 0.660–0.768 | |
| 28-MAY | 149 | D/F | 55.7 ± 6.9 | 46.9–65.8 | 7.3 ± 1.9 | 5.2–11.6 | 62.5 ± 2.3 | 60.0–67.2 | 0.310 ± 0.026 | 0.281–0.358 | |
| “CUB” | 29-JAN | 29 | D | 87.1 ± 1.5 | 84.7–88.4 | 20.4 ± 2.7 | 16.2–25.3 | 43.2 ± 4.3 | 35.0–49.6 | 0.778 ± 0.058 | 0.679–0.833 |
| 10-MAR | 70 | D/F | 80.9 ± 2.0 | 78.0–83.1 | 16.8 ± 1.6 | 15.4–20.3 | 41.4 ± 1.9 | 37.9–44.1 | 0.740 ± 0.032 | 0.702–0.789 | |
| “GRO” | 21-JAN | 21 | D | 75.9 ± 4.6 | 68.3–80.0 | 17.6 ± 2.3 | 15.4–21.7 | 48.9 ± 4.2 | 41.5–55.6 | 0.651 ± 0.072 | 0.543–0.728 |
| 02-MAR | 62 | D/F | 78.2 ± 3.7 | 73.8–84.1 | 15.0 ± 0.6 | 13.8–15.7 | 45.0 ± 3.3 | 40.3–50.4 | 0.738 ± 0.042 | 0.660–0.788 | |
| 21-APR | 112 | D | 72.2 ± 2.9 | 68.1–76.3 | 7.8 ± 0.9 | 6.3–9.0 | 66.2 ± 3.6 | 59.8–70.6 | 0.561 ± 0.051 | 0.453–0.610 | |
| 28-MAY | 149 | D/F | 53.7 ± 6.9 | 41.9–64.2 | 7.0 ± 1.2 | 5.8–9.6 | 65.9 ± 3.1 | 59.8–69.4 | 0.288 ± 0.019 | 0.264–0.329 | |
| “MIT” | 20-JAN | 20 | D | 79.5 ± 5.8 | 68.5–84.7 | 17.1 ± 3.1 | 10.8–21.4 | 43.9 ± 9.1 | 32.9–57.5 | 0.734 ± 0.092 | 0.628–0.831 |
| 03-MAR | 63 | D | 87.6 ± 1.8 | 85.0–90.1 | 17.6 ± 2.4 | 14.8–20.3 | 45.4 ± 3.3 | 41.2–50.4 | 0.793 ± 0.020 | 0.776–0.837 | |
| 14-APR | 105 | D | 87.1 ± 2.2 | 83.6–89.2 | 15.2 ± 3.5 | 10.8–19.2 | 44.7 ± 6.3 | 36.2–52.9 | 0.814 ± 0.046 | 0.731–0.853 | |
| 26-MAY | 147 | D/F | 67.4 ± 7.4 | 58.8–75.5 | 9.5 ± 2.1 | 6.7–11.8 | 59.9 ± 5.7 | 53.2–67.4 | 0.457 ± 0.086 | 0.323–0.557 | |
| “MUR” | 22-JAN | 22 | D | 76.8 ± 3.4 | 73.1–83.6 | 11.0 ± 3.1 | 7.7–17.8 | 63.9 ± 3.2 | 59.0–67.2 | 0.530 ± 0.062 | 0.422–0.617 |
| 09-MAR | 69 | D/F | 79.9 ± 2.8 | 75.8–83.6 | 15.7 ± 5.8 | 8.7–25.8 | 51.3 ± 3.8 | 45.0–56.7 | 0.600 ± 0.046 | 0.521–0.668 | |
| 20-APR | 111 | D | 83.2 ± 1.4 | 81.6–85.8 | 15.2 ± 3.1 | 11.2–21.0 | 54.2 ± 3.7 | 49.1–59.9 | 0.649 ± 0.049 | 0.575–0.713 | |
| 29-MAY | 150 | D/F | 75.1 ± 4.3 | 68.3–79.4 | 8.6 ± 1.2 | 7.0–10.3 | 61.8 ± 3.3 | 57.3–66.0 | 0.446 ± 0.057 | 0.366–0.534 | |
| “PAD” | 20-JAN | 20 | D | 77.7 ± 3.7 | 70.8–82.3 | 16.1 ± 2.0 | 13.3–20.1 | 50.6 ± 3.7 | 45.5–56.5 | 0.690 ± 0.028 | 0.640–0.733 |
| 09-MAR | 69 | D/F | 78.1 ± 2.0 | 74.9–80.8 | 16.6 ± 2.2 | 13.0–19.9 | 45.2 ± 2.5 | 40.4–47.7 | 0.739 ± 0.020 | 0.716–0.764 | |
| 20-APR | 111 | D | 86.8 ± 1.5 | 84.6–89.1 | 19.0 ± 2.6 | 13.9–21.9 | 47.4 ± 1.9 | 44.5–49.8 | 0.820 ± 0.029 | 0.777–0.856 | |
| 29-MAY | 150 | D/F | 67.6 ± 3.1 | 63.8–72.8 | 9.7 ± 1.1 | 7.2–10.9 | 60.6 ± 2.0 | 56.4–62.7 | 0.488 ± 0.042 | 0.432–0.550 | |
| “QF” | 30-JAN | 30 | D | 84.9 ± 2.2 | 82.0–87.7 | 20.3 ± 3.1 | 15.4–26.1 | 50.1 ± 6.1 | 40.4–60.4 | 0.789 ± 0.025 | 0.760–0.837 |
| 23-APR | 114 | D | 80.6 ± 2.2 | 77.0–83.4 | 16.7 ± 1.6 | 15.0–18.9 | 45.1 ± 1.9 | 42.7–47.8 | 0.744 ± 0.065 | 0.662–0.817 | |
| 09-JUN | 161 | D | 63.8 ± 3.8 | 57.9–68.4 | 9.2 ± 1.6 | 6.8–11.7 | 56.4 ± 3.6 | 52.3–61.8 | 0.369 ± 0.032 | 0.328–0.423 | |
| “TAP” | 22-JAN | 22 | D | 74.5 ± 7.5 | 62.4–83.1 | 10.8 ± 4.3 | 6.2–17.8 | 56.2 ± 9.4 | 41.4–66.1 | 0.620 ± 0.058 | 0.552–0.733 |
| 10-MAR | 70 | D/F | 76.1 ± 4.6 | 68.5–81.4 | 15.0 ± 3.3 | 11.8–22.1 | 45.8 ± 4.0 | 41.7–53.1 | 0.640 ± 0.053 | 0.548–0.700 | |
| 24-APR | 115 | D | 79.4 ± 2.2 | 75.7–82.5 | 9.0 ± 1.1 | 7.5–11.2 | 56.7 ± 5.5 | 49.2–63.7 | 0.656 ± 0.055 | 0.594–0.754 | |
| 01-JUN | 153 | D/F | 70.0 ± 6.5 | 55.7–76.3 | 8.0 ± 1.4 | 5.7–10.0 | 58.7 ± 7.0 | 48.4–71.1 | 0.431 ± 0.051 | 0.360–0.504 | |
| Pasture Parameter (Spectral Pre-Processing) | LV | Slope | Intercept | R2 | RMSE | Bias | RPD |
|---|---|---|---|---|---|---|---|
| Calibration Model PMC (SNV + 2nd derivative) | 5 | 0.948 | 3.729 | 0.948 | 1.975 | - | - |
| CP (1st derivative) | 7 | 0.833 | 2.112 | 0.833 | 1.720 | - | - |
| NDF (1st derivative) | 6 | 0.824 | 10.045 | 0.824 | 3.020 | - | - |
| External Validation Model PMC (SNV + 2nd derivative) | 5 | 0.849 | 10.839 | 0.834 | 3.517 | 0.101 | 2.72 |
| CP (1st derivative) | 7 | 0.745 | 3.165 | 0.702 | 2.303 | −0.049 | 1.88 |
| NDF (1st derivative) | 6 | 0.774 | 12.905 | 0.720 | 3.241 | −0.045 | 2.38 |
| Pasture Parameter (Spectral Pre-Processing) | LV | Slope | Intercept | R2 | RMSE | Bias | RPD |
|---|---|---|---|---|---|---|---|
| Calibration Model CP (raw data) | 6 | 0.941 | 0.855 | 0.941 | 1.250 | - | - |
| NDF (1st derivative) | 6 | 0.948 | 2.662 | 0.948 | 2.293 | - | - |
| External Validation Model CP (raw data) | 6 | 0.983 | 0.260 | 0.936 | 1.174 | 0.031 | 4.01 |
| NDF (1st derivative) | 6 | 0.951 | 2.094 | 0.914 | 2.752 | −0.438 | 3.48 |
| Experimental Field/Season | NDVI vs. PMC | NDVI vs. CP | NDVI vs. NDF |
|---|---|---|---|
| Field (n) | |||
| “AZI” (32) | 0.9095 * | 0.7823 * | −0.6672 * |
| “CUB” (16) | 0.5785 * | 0.7460 * | −0.7667 * |
| “GRO” (32) | 0.8887 * | 0.7342 * | −0.7376 * |
| “MIT” (32) | 0.9411 * | 0.8012 * | −0.8662 * |
| “MUR” (32) | 0.6353 * | 0.6406 * | −0.6055 * |
| “PAD” (32) | 0.9444 * | 0.8712 * | −0.8777 * |
| “QF” (24) | 0.9718 * | 0.8534 * | −0.6246 * |
| “TAP” (32) | 0.7090 * | 0.6275 * | −0.6513 * |
| Season (n) | |||
| Winter (120) | 0.6264 * | 0.6072 * | −0.6735 * |
| Spring (112) | 0.9008 * | 0.7830 * | −0.7390 * |
Publisher’s Note: MDPI stays neutral with regard to jurisdictional claims in published maps and institutional affiliations. |
© 2021 by the authors. Licensee MDPI, Basel, Switzerland. This article is an open access article distributed under the terms and conditions of the Creative Commons Attribution (CC BY) license (http://creativecommons.org/licenses/by/4.0/).
Share and Cite
Serrano, J.; Shahidian, S.; Carapau, Â.; Rato, A.E. Near-Infrared Spectroscopy (NIRS) and Optical Sensors for Estimating Protein and Fiber in Dryland Mediterranean Pastures. AgriEngineering 2021, 3, 73-91. https://doi.org/10.3390/agriengineering3010005
Serrano J, Shahidian S, Carapau Â, Rato AE. Near-Infrared Spectroscopy (NIRS) and Optical Sensors for Estimating Protein and Fiber in Dryland Mediterranean Pastures. AgriEngineering. 2021; 3(1):73-91. https://doi.org/10.3390/agriengineering3010005
Chicago/Turabian StyleSerrano, João, Shakib Shahidian, Ângelo Carapau, and Ana Elisa Rato. 2021. "Near-Infrared Spectroscopy (NIRS) and Optical Sensors for Estimating Protein and Fiber in Dryland Mediterranean Pastures" AgriEngineering 3, no. 1: 73-91. https://doi.org/10.3390/agriengineering3010005
APA StyleSerrano, J., Shahidian, S., Carapau, Â., & Rato, A. E. (2021). Near-Infrared Spectroscopy (NIRS) and Optical Sensors for Estimating Protein and Fiber in Dryland Mediterranean Pastures. AgriEngineering, 3(1), 73-91. https://doi.org/10.3390/agriengineering3010005


