Article

Distribution of Airflow and Media Moisture Content across Two Vertical Bed Biofilters

1
Agricultural and Biosystems Engineering Department, South Dakota State University, Brookings, SD 57007, USA
2
Construction and Operations Management Department, South Dakota State University, Brookings, SD 57007, USA
3
Institute of Environmental Sciences and Engineering (IESE), National University of Sciences and Technology (NUST), Islamabad 44000, Pakistan
4
Animal Science Department, South Dakota State University, Brookings, SD 57007, USA
*
Author to whom correspondence should be addressed.
AgriEngineering 2022, 4(1), 179-189; https://doi.org/10.3390/agriengineering4010013
Submission received: 20 December 2021 / Revised: 6 February 2022 / Accepted: 22 February 2022 / Published: 24 February 2022

Abstract

:
For its small square footage, a vertical bed biofilter was developed for odor emission mitigation for livestock facilities with limited area available for biofilter installation. However, a concern about the design is that airflow and moisture may be poorly distributed across the biofilter due to the effects of gravity. Relevant data are sporadic in the literature. To fill the knowledge gap, two vertical bed biofilters were constructed at a university swine facility and monitored for two months. The monitoring was taken at 27 grid points on each biofilter per field visit. Results revealed that both the airflow and medium moisture content were unevenly distributed. The sun-facing side of the biofilters had significantly lower medium moisture content (p < 0.01) due to solar-induced water evaporation. The side directly facing the barn exhaust had the highest airflow. Airflows varied along the height of the biofilters, but no significant difference was noted. The uniformity of airflow and moisture content, characterized by coefficient of variance (CV) and distribution uniformity (DU) respectively, were examined over the monitoring campaign. Possible reasons for uneven distribution were explored and recommendations are made to address the uniformity issue. The findings from the study are expected to further the development and implementation of biofiltration technology for livestock odor control.

1. Introduction

Odor is a top air quality challenge for pork production [1]. Various odorants, such as ammonia, hydrogen sulfide, and indole, have been identified in the air of swine barns [2]. Many of them are produced from the microbial decomposition of pig feces or undigested feed [3]. After being discharged into the atmosphere, those odorants can disperse to neighboring communities, causing odor nuisance. The occurrence of odor nuisance can undermine the public relation efforts of pork producers and, in certain scenarios, result in odor complaints and even lawsuits [4]. In many counties of the U.S., rules are becoming increasingly stringent regarding the construction of new or the expansion of existing swine facilities. This is primarily driven by public concerns about odors. To promote the sustainable development of the pork industry, a simple, low-maintenance, cost-effective odor mitigation method is needed.
Biofilters are considered by many as a promising technology for odor mitigation [5,6]. Compared to technologies such as wet scrubbers, activated carbon adsorption, and ozonation, biofilters are less expensive to construct and offer decent odor reduction performance when properly operated [7]. In a biofilter, microorganisms are grown on a filtration medium to form biofilms. When the exhaust air passes through the medium, air contaminants are sorbed into the biofilms and degraded by the microorganisms with the presence of oxygen and water [8]. Biofilters have been extensively used to treat volatile organic compounds (VOCs) emission in the chemical and petroleum industry [9,10]. The use of biofilters for livestock odor control was first reported by Dr. Zeisig in the 1970s [11]. Since then, numerous research efforts have been made to develop cost-effective biofiltration technologies. Cost is a key factor in the success of any farm-related environmental technology. For swine barns, a biofilter can be made from lumbers, poultry wires, and organic packings (e.g., woodchips, straws, and compost), most of which are readily accessible to average farmers.
Based on the layout of filtration media, biofilters can be classified into two types: horizontal and vertical. In a horizontal bed biofilter (also known as a vertical airflow biofilter), the filtration medium is placed into a horizontal layer and the exhaust air goes vertically in the medium. Horizontal bed biofilters have been the most studied in the literature and extensively adopted for field demonstration [6]. However, a downside of horizontal bed biofilters is the large square footage they take. In certain scenarios, the construction is prohibited by the lack of enough area near exhaust fans. To address this limitation, an alternative design named vertical bed biofilters (also known as horizontal airflow biofilters) was proposed [12,13,14]. In a vertical bed biofilter, filtration media are caged or netted into vertical filtration walls. The exhaust air first reaches an inner air plenum (usually at the center of the biofilter) and then passes through the filtration walls horizontally to get treated. Because of its filtration wall design, a vertical bed biofilter takes a considerably smaller area than a horizontal counterpart possessing the same treatment capacity [12].
For vertical bed biofilters, a challenge is how to ensure the uniform distribution of airflow and moisture content over a filtration wall [15]. Along the height of the filtration wall, the gravitational settling of filtration media is expected to result in a decrease in porosity from top to bottom. Thus, air restriction per unit of medium thickness reaches the maximum near the bottom [16]. When the filtration wall is of uniform thickness, the airflow that passes through it is expected to increase from bottom to top. Non-uniform airflows would lead to decreased odor mitigation performance [17]. Moisture is another key parameter for biofilter operation. Optimal moisture levels varied with filtration media. For compost-based media, a recommended moisture range was 50–55% [18]. For a mixture of compost and woodchips, the range was 35–65% [5]. For woodchips, it was 40–60% [19]. For simplicity, a watering system is typically installed at the top of a vertical bed biofilter. However, because of the non-uniformity in medium porosity, airflows, and water flows along the height of the biofilter, it is difficult to predict the distribution of medium moisture contents. A rule of thumb is to make a biofilter as wet as possible but without causing spillover flooding [15].
A potential solution to non-uniform airflows is to use a tapered filtration wall design, with a greater medium thickness at the top and a smaller thickness at the bottom [13]. A taper angle of 9.6° was reported to offer the most uniform airflow distribution [15]. However, the construction of tapered walls is more complicated than non-tapered ones. For pork producers, this means that additional expertise, time, or money is required. Furthermore, no long-term field experiment has been done to examine the distribution of airflows and medium moisture contents in vertical bed filters (with either tapered or non-tapered walls), making it hard to decide between the two designs.
As part of the effort to resolve the above question, two vertical bed biofilters with uniform filtration medium thickness (i.e., non-tapered walls) were built and monitored for 70 days. The overarching goal of this study is to develop biofilter design guidance for pork producers, thereby promoting the implementation of this technology. The research objectives are to (1) measure the air velocities and medium moisture contents at different spots of the biofilters, (2) conduct statistical data analysis to assess the uniformity of airflow or moisture content distribution, and (3) make recommendations for future vertical bed biofilter design and operation.

2. Materials and Methods
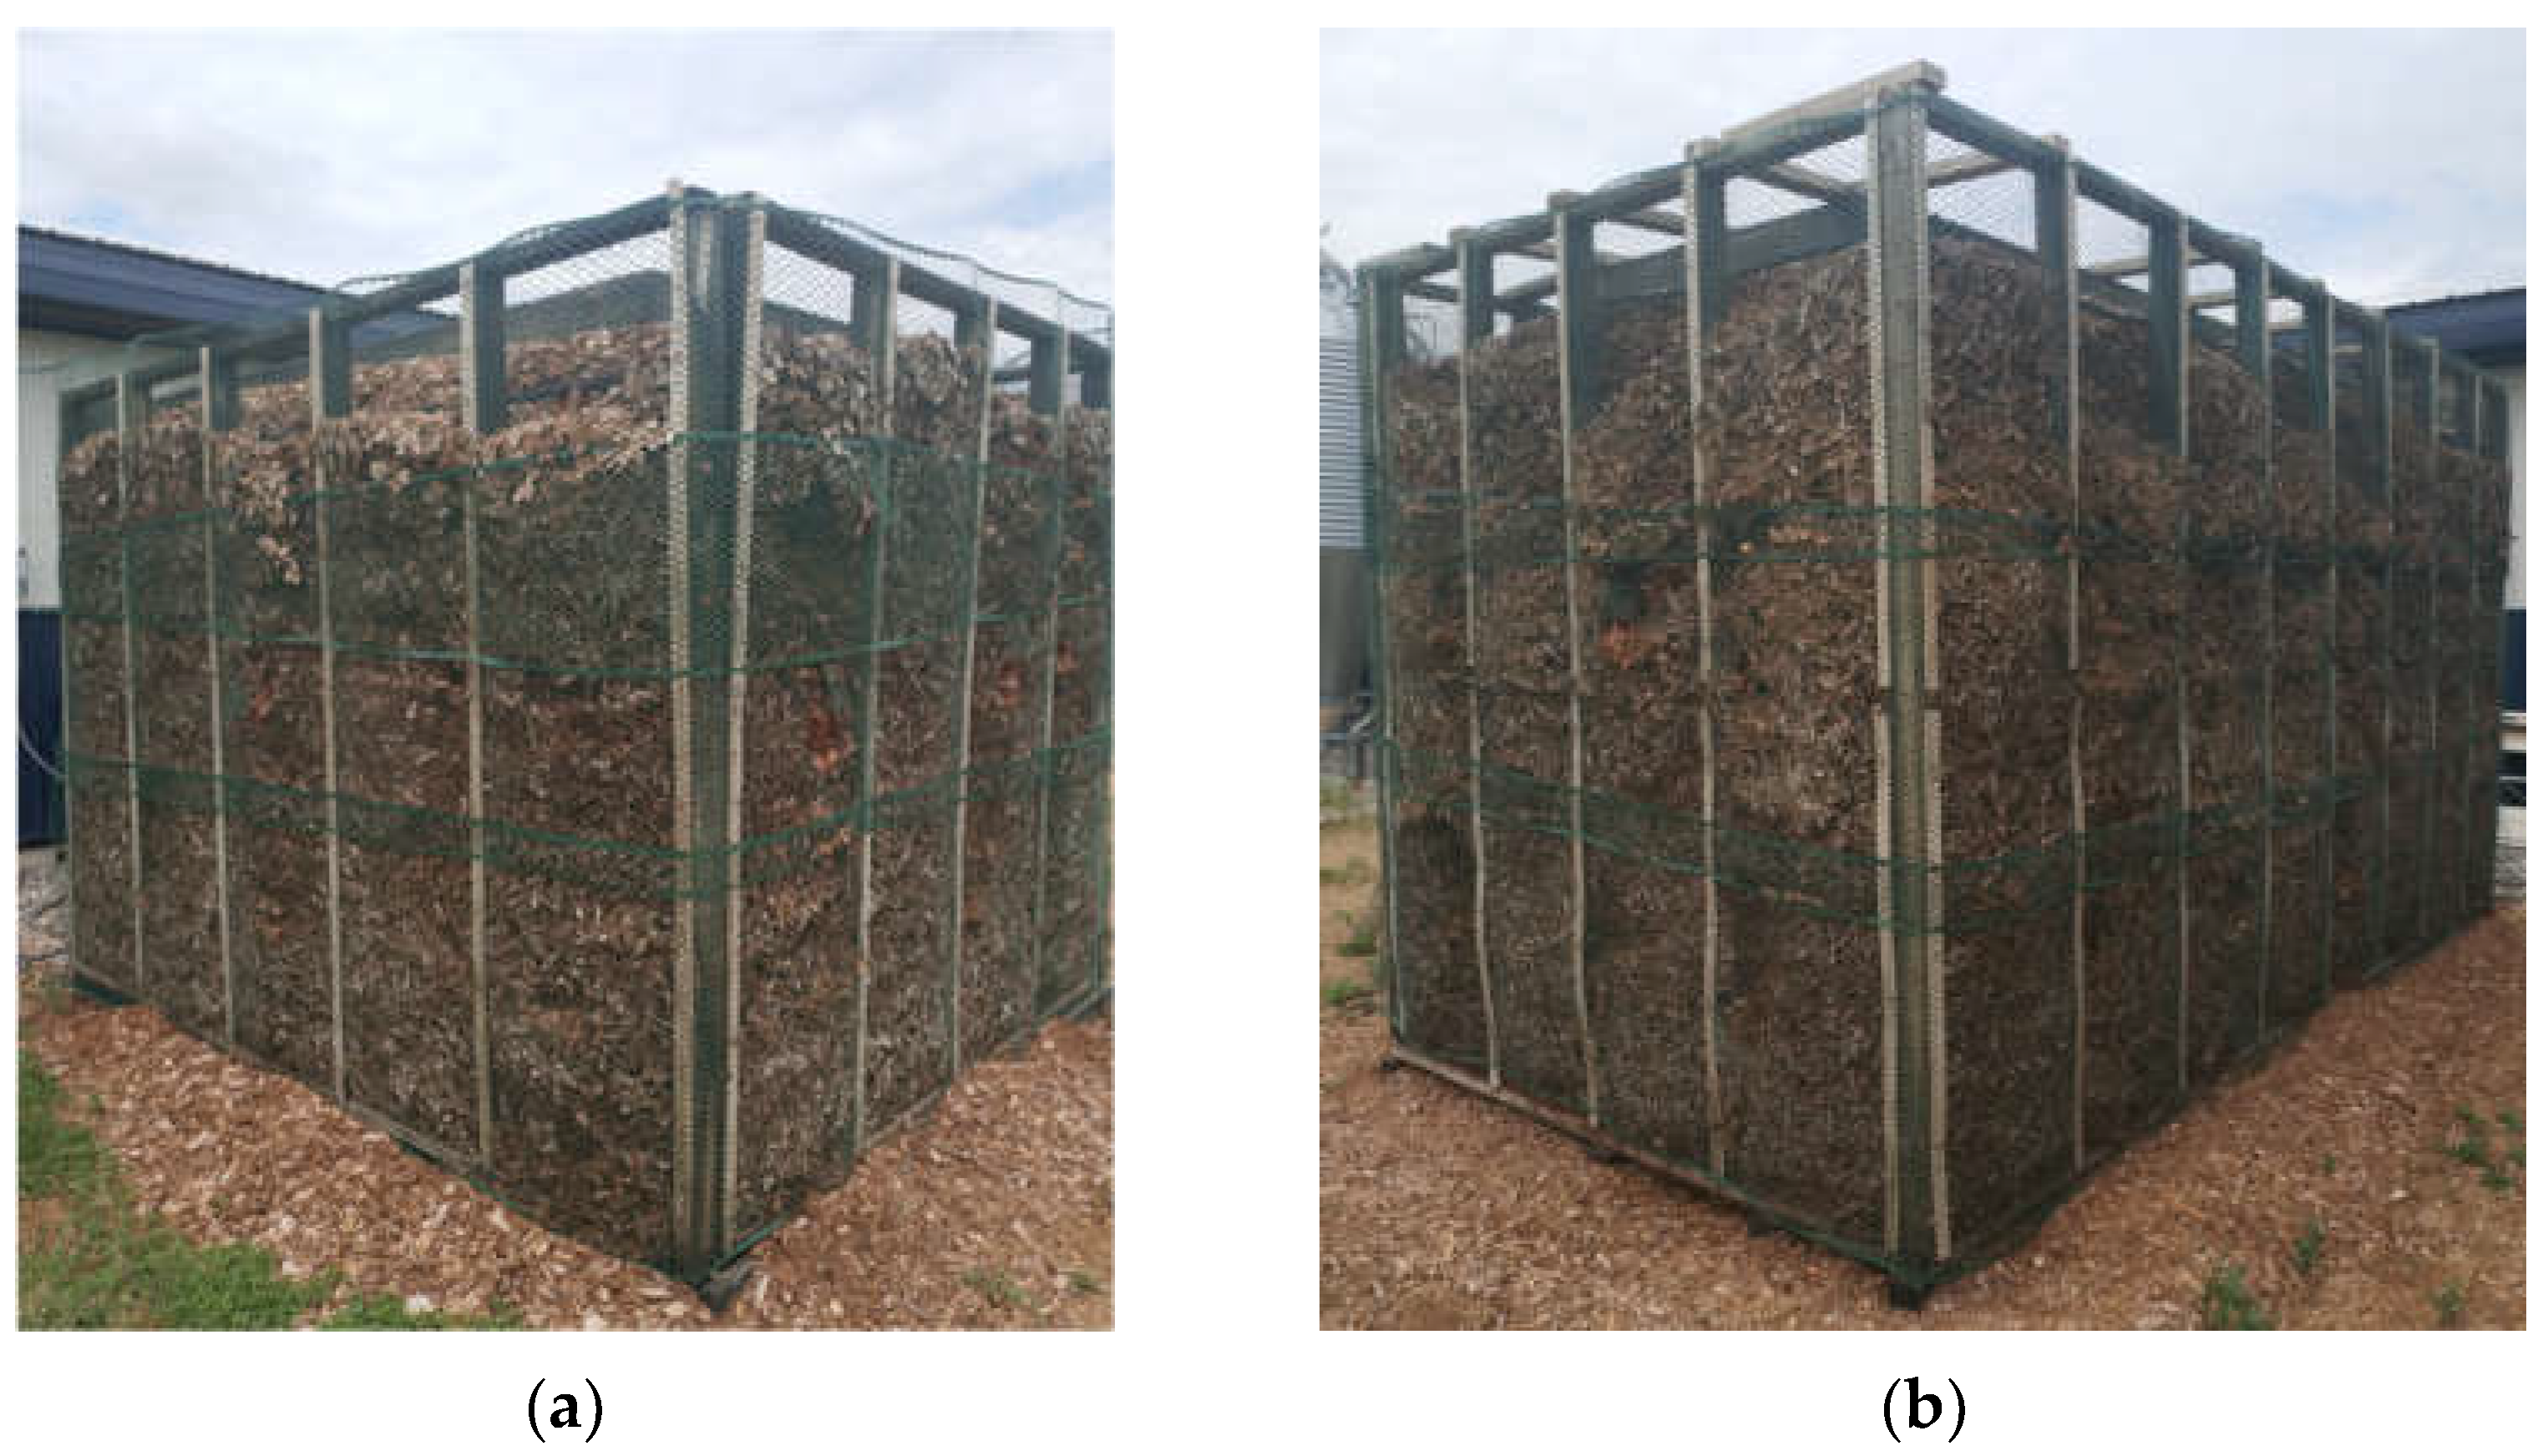
2.1. Biofilters

Two vertical bed biofilters were built at the Swine Education & Research Facility of South Dakota State University (Figure 1). The smaller one (BF#1), with dimensions of 3.66 m (L) × 2.44 m (W) × 2.44 m (H), was installed immediately after a pit fan of the facility’s wean-to-finish barn. The larger one (BF#2), measured at 4.88 m (L) × 2.44 m (W) × 2.44 m (H), was ducted to a pit fan of the facility’s gestation barn. A cubic inner plenum was sized in each biofilter to enable 0.6 m-thick filtration walls. Both biofilters were framed with ground-contact treated wood, netted with vinyl coated poultry wires with 19 mm mesh, and filled with 25–40 mm cedar woodchips as filtration media. Soaker hoses buried ~0.1 m under the top surface of woodchips were used to water the biofilters, and the watering was controlled with a digital watering timer. Each biofilter was watered twice per day, and the watering system was adjusted to ensure (1) a uniform watering rate throughout the top of a biofilter and (2) that the entire biofilter became wet but with no flooded ground (caused by excess water). The adjustment was done before the experiment. No further adjustment was done unless otherwise stated.

2.2. Air Velocity Measurement

With the current design, each biofilter had three gas outlet sides (Figure 2). To study the spatial distribution of effluent airflow, each side was further divided into nine sections. Thus, for each biofilter, a total of 27 sampling points were selected. The air velocity was measured with an ADM-860C AIRDATA multimeter (Shortridge Instruments, Inc., Scottsdale, AZ). The meter consisted of a digital manometer and a pitot-tube probe. To improve the measurement representativeness, a cross-shaped probe with multiple pitot tubes and a fabric duct was used for its capability of measuring the average air velocity of a 0.3 m × 0.3 m area. The meter was also equipped with temperature, humidity, and barometric pressure sensors for air density correction (required for accurate air velocity measurement).

2.3. Moisture Content Measurement

The measurement used the same set of sampling points as aforementioned. Two methods were employed: (1) a handheld probe to measure the air humidity of effluent airflow, and (2) a gravimetric method to determine moisture content in the filtration medium (woodchips). For air humidity measurement, a Kestrel 5500 weather meter (Kestrel Instrument Inc., Boothwyn, PA) was held at the center of each section and three readings were taken to calculate the average humidity level. For woodchip moisture content measurement, a ~50–100 g woodchip sample was collected at the center of each section and kept in a Ziploc bag. To enable woodchip sampling, a 10 cm × 10 cm opening was cut near the center of each section and sealed with zip ties after each sampling. Upon return to the lab, the woodchip sample was transferred to a pre-weighed empty aluminum baking cup, weighed at an analytical balance (for wet weight), and then dried in a lab oven at 110 °C for 24 h. After drying, the cup was weighed again (for dry weight); and the moisture content (on a wet basis) was calculated as:
Moisture   ( % ) = wet   weight   ( g ) dry   weight   ( g ) wet   weight   ( g ) empty   cup   weight ( g )

2.4. Field Monitoring and Data Analysis

The field monitoring was done from 26 September 2019 to 5 December 2019, totaling nine weeks of data collected. Each biofilter was visited once or twice per week when weather and farm conditions permitted. Rainy or snowy days were avoided because of their large influence on moisture content measurement. Extremely windy days were also avoided as they could bias air velocity measurement. A total of fourteen visits were performed. The pressure difference (ΔP) between the barn and the air plenum was also measured during the monitoring campaign using a manometer (Figure 1); however, the data were discarded because of an improper installation of manometer tubings.
The acquired measurement data were summarized over the entire field monitoring period for each biofilter, air outlet side, or section; with average and standard deviation calculated. A Shapiro–Wilk normality test revealed that the data did not follow a normal distribution. Accordingly, non-parametric ANOVA (Kruskal–Wallis followed by Mann–Whitney post-hoc analysis) was conducted to compare air velocity or moisture between different sides or rows (of sections). For each biofilter, the uniformity of moisture content distribution was assessed with distribution uniformity (DU). DU is a measure of the spatial uniformity of watering for irrigation systems [20] and it is defined as:
DU = Avg LQ Avg T
where, AvgT is the moisture content averaged from the 27 outlet sections of a biofilter, and AvgLQ is that averaged from the lowest quartile, in this case, the lowest seven measurements (27/4 ≈ 7). The uniformity of air velocity distribution was assessed with coefficient of variance (CV):
CV = SD Avg
where, Avg is the average air velocity of the 27 biofilter outlet sections, and SD is the standard deviation of air velocity. All the statistical tests were done with PAST, an open-source software program [21]. A significant level of α = 0.05 was used for all the tests.

3. Results and Discussion

3.1. Summary of Field Monitoring Results

The gestation barn was shut down for two weeks in mid-October, during which no measurement was done for BF#2. For BF#1, a malfunction was found with the watering system; for a data quality consideration, only the moisture content measurement results after 24 October 2019 were included in data analysis.
An uneven distribution of airflows was seen for both biofilters along horizontal and vertical directions (Table 1). The average air velocity was 0.141 (±0.067) m/s for BF#1 and 0.143 (±0.058) m/s for BF#2, corresponding to a treated airflow rate of 3.36 m3/s for BF#1 and 4.26 m3/s for BF#2. An empty bed contact time (EBCT) was estimated to be ~3.7 sec for BF#1 and ~3.8 sec for BF#2. In comparison, an EBCT of typically 3–5 sec was recommended for biofilter design [6]. The maximum air velocity was 0.381 m/s for BF#1 and 0.517 m/s for BF#2, suggesting the occurrence of air leak (short airflow). Air leak is undesired for it compromises the odor reduction effectiveness of biofilters.
An uneven distribution of woodchip moisture contents was also seen along both horizontal and vertical directions (Table 2). The average moisture content was 40.3% (±17.4%) for BF#1 and 44.7% (±17.2%) for BF#2. Both were within the optimal moisture range of 40–60% [19] but towards the lower side. Even though the average moisture content was acceptable, certain spots of BF#2 were exceptionally dry (e.g., Section 8 on the south side with 10.5% moisture, far beyond the optimal range). They were problematic from the biofilter operation standpoint. The air humidity and temperature data acquired from the Kestrel 5500 handheld meter correlated strongly with weather conditions. Thus, they were excluded from the discussion.

3.2. Side Differences

The east outlet side that directly faced fan exhaust had an overall higher air velocity than the other two sides (Figure 3a). For BF#1, the average air velocity was 0.133 (±0.063) m/s on the south side, 0.154 (±0.080) m/s on the east side, and 0.137 (±0.056) m/s on the north side. For BF#2, the average air velocity was 0.143 (±0.054) m/s on the south side, 0.148 (±0.061) m/s on the east side, and 0.139 (±0.059) m/s on the north side. The higher air velocity on the east side is understandable because of the initial momentum of the exhaust airstream (Figure 2a). The air velocity difference was relatively minor for BF#2. This is likely because its greater length than BF#1 posed an additional volume and/or friction loss to the air exited through the east side. Therefore, for future vertical bed biofilter design, the inner plenum should be elongated along the incoming air direction to improve the uniformity of airflow distribution.
The north outlet side had significantly higher moisture contents than the east side that, in turn, contained significantly more moisture than the south side. For BF#1, the average woodchip moisture contents were 51.9% (±15.6%), 43.6% (±17.5%), and 38.4% (±15.8%) on the north, east, and south sides, respectively. For BF#2, the moisture contents were 49.6% (±15.1%), 39.5% (±15.7%), and 31.9% (±16.8%), respectively. The average moisture content (31.9%) on the south side of BF#2 was considerably smaller than the lower limit (40%) of the optimal moisture range. A possible reason for the observed side difference is solar radiation. The farm is located in a relatively open area. The south side of the biofilters is believed to have received more sunlight and accordingly lost more water via evaporation than the east and then the north side. The woodchip moisture content is governed by a balance of water gain (e.g., rainfalls and watering) and loss (e.g., evaporation and leaching). With the same watering rate, elevated water evaporation would result in reduced moisture content. A solution to this problem is to increase the watering rate for the sun-facing side of a biofilter by placing a longer or larger soaker hose or increasing the watering time.

3.3. Row Differences

Each biofilter was divided into three rows (top, middle, and bottom) along the vertical direction (Figure 2b). For each row, the average air velocity and the average moisture content were calculated (Figure 4). Although the top row had overall the highest air velocity, no significant difference was seen. This is a bit surprising—since both biofilters used filtration walls of uniform thickness, the bottom rows were expected to carry the smallest airflow because of woodchip settling and decay. The small particles produced from woodchip decay would settle and fill the pores between woodchips, causing the loss of porosity. The reason for the lack of significant vertical variability is uncertain. The biofilter operation started in July 2019 and, thus, the woodchips were relatively new. Furthermore, cedar woodchips used in this study are known to be rot resistant. Only a minor degree of decay was noticed at the end of the monitoring campaign.
Regarding woodchip settling, although in theory it would cause reduced porosity in filtration media and accordingly a low air velocity, no agreement has been reached in the literature. Lefers [15] compared vertical bed biofilters with three tapered angles (0°, 4.8°, and 9.6°) and reported the smallest raw difference in airflow at 9.6°. At 0° (non-tapered), the lowest air velocity occurred near the bottom of a filtration wall. The author ascribed it to the settling of filtration media. However, Garlinski and Mann [22] found that despite substantial woodchip settling, the pressure drop across non-tapered filtration walls was relatively uniform. In this study, after filling the biofilters, the woodchip packings were leveled off and lightly compressed with shovels from the top. It is uncertain whether and to what extent the exerted force could be transferred to the bottom. Furthermore, many factors other than woodchip settling can affect air restriction, e.g., dust buildup and moisture content. Thus, it is difficult to predict vertical airflow distribution in a biofilter. On the positive side, this study suggests that tapered wall design may not be necessary to address the uniformity issue, which simplifies the construction of vertical bed biofilters.
Regarding woodchip moisture contents, the two biofilters exhibited different vertical distribution patterns. For BF#1, the average moisture content increased from top to bottom, suggesting that the biofilter was overwatered; whereas, for BF#2, the average moisture content decreased from top to bottom, indicating the occurrence of under-watering. Again, the watering system of both biofilters was adjusted at the beginning of operation but uneven vertical distribution still occurred. This suggests the necessity of periodically (e.g., monthly or quarterly) adjusting the watering system since factors, such as temperature and rainfalls, could shift the water balance in a biofilter over time. In this study, the watering system of both biofilters shared the same waterline with pig waterers inside the barn, which resulted in fluctuated watering rates at the early stage of operation. To address this issue, the timer was set to water each biofilter twice per day (before sunrise and after sunset).

3.4. Uniformity of Distribution

For BF#1, the uniformity of air velocity distribution increased with time, as indicated by a gradual decrease in CV; while for BF#2, no temporal trend in air velocity distribution was observed (Figure 5a). A significant correlation between outdoor temperature and the CV of air velocity in BF#1 was identified (r = 0.747, p = 0.008). However, it could be a pseudo-correlation because (1) no correlation occurred between outdoor temperature and the CV of air velocity in BF#2; and (2) no scientific evidence supports the effect of outdoor temperature on air velocity distribution. From the biofilter operation standpoint, the measurement data are encouraging, suggesting that a long-term operation may not reduce the uniformity of airflow.
For BF#1, its watering system was fixed and re-adjusted on October 21, 2019. After that, the uniformity of woodchip moisture content distribution continued to decrease. For BF#2, the uniformity of moisture content distribution dropped at the beginning and became stabilized after ~30 days of monitoring. Since the operation of BF#2 started in July 2019, BF#2 may have undergone a quick decrease in moisture content uniformity before the monitoring (day 0). In summary, the monitoring data suggest that the moisture content distribution is relatively uniform immediately after watering system adjustment, but the uniformity drops over time and finally stabilizes at a relatively low level. Thus, periodical adjustment of the watering system is needed.
DU is a prevalent measure for assessing the uniformity of irrigation. A DU of >0.90 (90%) can be achieved with, for example, dripping systems [23]. However, it should be noted that for irrigation systems, DU characterizes the uniformity of 2D horizontal distribution. For vertical distribution, it is hard to achieve the same degree of uniformity because of the gravity flow; and no DU cutoff value for satisfactory watering performance has been established. Based on the experimental data, a tentative cutoff value of DU = 0.7 is recommended. It is achievable once the side and row differences are addressed through watering system optimization.

3.5. Others

No freezing of woodchips was seen during the monitoring campaign. On the coldest day (−6 °C outdoor temperature), the treated air from the biofilters was still relatively warm (minimum of 6 °C for BF#1 and 4 °C for BF#2). However, our later visits in January 2020 (for another purpose) identified a few frozen spots. The watering system was disconnected on December 5, 2019 so the moisture of the frozen spots should have come from the exhaust air and/or precipitations.
A thorough inspection of both biofilters was done in May 2020. Two major issues were found: corrosion and cementing. First, even with vinyl coating, the poultry wires (made of metal) were severely corroded, especially the wires netting the inner air plenum. This can be attributed to the high concentrations of hydrogen sulfide, ammonia, and dust in the untreated air. To solve the issue, heavy-duty plastic poultry wires were used for fixing the biofilters. Secondly, cementing occurred at the innermost layer of woodchips and it was caused by dust in the exhaust air. When mixed with water, the dust particles formed a paste-like mixture and caulked into air passages between woodchips. In reality, the cemented layer was so strong that it held the filtration wall even after the poultry wires corroded out; and chisels and shovels had to be used to breach the layer.

3.6. Reasons for Non-Uniformity and Recommendations

The uneven distribution of air velocity and woodchip moisture content in the two vertical bed biofilters was ascribed to five possible reasons:
  • Solar radiation. Solar-induced water evaporation can reduce the moisture level in a biofilter. For vertical bed biofilters, the amount of solar radiation received varies with side orientation, season, and weather.
  • Poorly controlled and adjusted watering systems. Watering timers can only control the watering duration but not flowrates. The flowrate is affected by water pressure in the pipeline. Thus, a watering system is problematic when sharing the same waterline with other farm apparatus (e.g., waterers). Watering system adjustment in this study was done based on visual inspection of biofilter conditions (e.g., woodchip wetness and ground flooding). This could cause a large uncertainty in watering rates.
  • Cementing. Cementing can substantially restrict airflow. No dust concentration measurement was done in this study. Assuming an average dust concentration of 1 mg/m3 in the pit air [24], monthly dust loading would be 8.7 kg to BF#1 and 11.0 kg to BF#2 (estimated from the treated airflow rate). The inner air plenum in a vertical bed biofilter has a relatively small contact area to the exhaust air. As a result, the cementing issue could be more pronounced for vertical than horizontal biofilters (that usually have the same contact area on the inlet and outlet sides).
  • Freezing. Freezing may initially develop on exceptionally cold days in winter. When it occurs, it restricts warm airflows from the barn exhaust. This in turn worsens the issue of freezing, leading to the further development of frozen spots.
  • Netting attachment. The gravitational setting of woodchips is hindered by nets or meshes. It, along with the decay of woodchips, can result in void spaces and short airflows in a filtration wall after long-term operation. In this study, the issue was observed near the woodchip sampling points. After every sampling, mechanical tools were used to ensure the settling of woodchips.
The following recommendations are made for the future design and operation of vertical bed biofilters:
  • For cubic biofilters, the air plenum should be elongated along the incoming air direction to improve the airflow uniformity. Use the same filtration bed thickness. No tapered filtration wall design is necessary.
  • Use a circular vertical bed biofilter design to improve the uniformity of filtration bed thickness. The thicker filtration medium at the corner of cubic biofilters is unideal from the airflow distribution standpoint.
  • Use a separate waterline for biofilters if possible. Apply a higher watering rate for biofilter sides or sections that receive significant sunshine—the suggestion also applies to horizontal biofilters.
  • Clean the air plenum monthly to remove dust, thereby reducing the chance of cementing. Mechanically agitate the wires or nets monthly to facilitate the medium settling.
  • Use a chisel to break the freezing spot to prevent the further development of freezing if winter operation is desired.

4. Conclusions

Two vertical bed biofilters with non-tapered filtration walls were examined for airflow and medium moisture content distribution over two months. Solar radiation was found to significantly affect the medium moisture content with the lowest value observed on the south side (wall). The initial momentum of exhaust air resulted in a higher air velocity on the east side (wall) that directly faced the exhaust airflow. Despite the careful adjustment of watering systems, one biofilter was overall under-watered and the other was overwatered during the monitoring campaign, and a significant variation in medium moisture content was found along the height of the two biofilters. Comparatively, no significant variation in air velocity was noted along the biofilters’ height. This is different than the finding from a previous study [15] in which medium settling was thought to cause a decreased air velocity at the bottom of a non-tapered filtration wall. The lack of significant variability in air velocity was ascribed to other factors (e.g., dust buildup) that could affect airflow restriction. Temporal changes in the distribution uniformity of airflow and medium moisture content were tracked. The uniformity of airflow distribution remained relatively stable; whereas the uniformity of moisture content decreased after watering system adjustment, suggesting the necessity of periodic adjustment of watering systems. Several recommendations were made for the future design and operation of vertical bed biofilters. Efforts are needed to further study the impact of airflow and medium moisture content distribution on odor mitigation performance.

Author Contributions

Conceptualization, R.T. and R.N.; Methodology, X.Y. and A.O.; Software, B.C. and X.Y.; Validation, B.C., X.Y. and A.O.; Formal Analysis, A.O., B.C., X.Y. and N.H.; Investigation, B.C., A.D., L.P., A.O. and X.Y.; Resources, R.T., R.N. and X.Y.; Data Curation, B.C., A.D., L.P., A.O. and X.Y.; Writing—Original Draft Preparation, A.O., B.C., X.Y. and N.H.; Writing—Review & Editing, A.O., X.Y., N.H., R.T. and R.N.; Visualization, A.O., B.C., X.Y. and N.H.; Supervision, X.Y., R.T. and R.N.; Project Administration, X.Y. and R.T.; Funding Acquisition, R.T. and X.Y. All authors have read and agreed to the published version of the manuscript.

Funding

This research was sponsored by the U.S. Pork Center of Excellence Swine Research & Education Extension program and the USDA NIFA Multistate Hatch project (# SD00R690-20) through the South Dakota Agricultural Experimental Station.

Institutional Review Board Statement

Not applicable.

Informed Consent Statement

Not applicable.

Data Availability Statement

Not applicable.

Acknowledgments

The authors would like to thank the faculty, staff and students in the Animal Science Department for their help with field installation of biofilters.

Conflicts of Interest

The authors declare no conflict of interest.

References

  1. Wing, S.; Horton, R.A.; Marshall, S.W.; Thu, K.; Tajik, M.; Schinasi, L.; Schiffman, S.S. Air pollution and odor in communities near industrial swine operations. Environ. Health Perspect. 2008, 116, 1362–1368. [Google Scholar] [CrossRef] [PubMed]
  2. Ni, J.Q.; Robarge, W.P.; Xiao, C.; Heber, A.J. Volatile organic compounds at swine facilities: A critical review. Chemosphere 2012, 89, 769–788. [Google Scholar] [CrossRef] [PubMed]
  3. Mackie, R.I.; Stroot, P.G.; Varel, V.H. Biochemical identification and biological origin of key odor components in livestock waste. J. Anim. Sci. 1998, 76, 1331–1342. [Google Scholar] [CrossRef] [PubMed]
  4. Huang, H.; Miller, G.Y. Citizen complaints, regulatory violations, and their implications for swine operations in Illinois. Rev. Agric. Econ. 2006, 28, 89–110. [Google Scholar] [CrossRef]
  5. Nicolai, R.E.; Lefers, R.M. Biofilters used to reduce emissions from livestock housing: A literature review. In Workshop on Agricultural Air Quality; North Carolina State University: Raleigh, NC, USA, 2006; pp. 952–960. [Google Scholar]
  6. Chen, L.; Hoff, S.J. Mitigating odors from agricultural facilities: A review of literature concerning biofilters. Appl. Eng. Agric. 2009, 25, 751–766. [Google Scholar] [CrossRef] [Green Version]
  7. Wang, Y.C.; Han, M.F.; Jia, T.P.; Hu, X.R.; Zhu, H.Q.; Tong, Z.; Lin, Y.T.; Wang, C.; Liu, D.Z.; Peng, Y.Z.; et al. Emissions, measurement, and control of odor in livestock farms: A review. Sci. Total Environ. 2021, 776, 145735. [Google Scholar] [CrossRef] [PubMed]
  8. Cooper, C.D.; Alley, F.C. Air Pollution Control: A Design Approach, 4th ed.; Waveland Press: Long Grove, IL, USA, 2010; pp. 455–484. [Google Scholar]
  9. Iranpour, R.; Cox, H.H.; Deshusses, M.A.; Schroeder, E.D. Literature review of air pollution control biofilters and biotrickling filters for odor and volatile organic compound removal. Environ. Prog. 2005, 24, 254–267. [Google Scholar] [CrossRef]
  10. Barbusinski, K.; Kalemba, K.; Kasperczyk, D.; Urbaniec, K.; Kozik, V. Biological methods for odor treatment—A review. J. Clean. Prod. 2017, 152, 223–241. [Google Scholar] [CrossRef]
  11. Noren, O. Design and use of biofilters for livestock buildings. In Odour Prevention and Control of Organic Sludge and Livestock Farming; Nielsen, V.C., Voorburg, J.H., L’Hermite, P., Eds.; Taylor & Francis: Abingon, UK, 1986; pp. 234–237. [Google Scholar]
  12. Mann, D.D.; Garlinski, E.M. Design of a horizontal airflow biofilter. In Proceedings of the AIC 2002 Meeting, Saskatoon, SK, Canada, 14–17 July 2002; Paper No. 02-611. Canadian Society of Agricultural Engineers: Mansonville, QC, Canada, 2002. [Google Scholar]
  13. Nicolai, R.E.; Lefers, R.; Pohl, S.H. Configuration of a vertical biofilter. In Proceedings of the Livestock Environment 7th International Symposium, Beijing, China, 18 May 2005; American Society of Agricultural and Biological Engineers: St. Joseph, MI, USA, 2005; pp. 358–363. [Google Scholar] [CrossRef]
  14. Nicolai, R.E.; Thaler, R. Vertical biofilter construction and performance. In Proceedings of the International Symposium on Air Quality and Waste Management for Agriculture, Broomfield, CO, USA, 16–19 September 2007; American Society of Agricultural and Biological Engineers: St. Joseph, MI, USA, 2007; pp. 35–41. [Google Scholar] [CrossRef]
  15. Lefers, R.M. A Design of Analysis for a Vertical Bed Biofilter and Biofilter Moisture Control System. Master’s Thesis, South Dakota State University, Brookings, SD, USA, 2006. [Google Scholar]
  16. Devinny, J.S.; Deshusses, M.A.; Webster, T.S. Biofiltration for Air Pollution Control; CRC Press: Washington, DC, USA, 2017. [Google Scholar]
  17. Choi, J.H.; Kim, Y.H.; Joo, D.J.; Choi, S.J.; Ha, T.W.; Lee, D.H.; Park, I.H.; Jeong, Y.S. Removal of ammonia by biofilters: A study with flow-modified system and kinetics. J. Air Waste Manag. Assoc. 2003, 53, 92–101. [Google Scholar] [CrossRef] [PubMed] [Green Version]
  18. Goldstein, N. Longer life for biofilters. BioCycle 1999, 40, 62. [Google Scholar]
  19. Chen, L.; Hoff, S.J.; Koziel, J.A.; Cai, L.; Zelle, B.; Sun, G. Performance evaluation of a wood-chip based biofilter using solid-phase microextraction and gas chromatography–mass spectroscopy–olfactometry. Bioresour. Tech. 2008, 99, 7767–7780. [Google Scholar] [CrossRef] [PubMed] [Green Version]
  20. Warrick, A.W. Interrelationships of irrigation uniformity terms. J. Irrig. Drain. Eng. 1983, 109, 317–332. [Google Scholar] [CrossRef]
  21. Hammer, Ø.; Harper, D.A.; Ryan, P.D. PAST: Paleontological statistics software package for education and data analysis. Palaeontol. Electron. 2001, 4, 1–9. [Google Scholar]
  22. Garlinski, E.M.; Mann, D.D. Airflow characteristics through a horizontal-airflow biofilter. In Proceedings of the 2004 ASAE Annual Meeting, Ottawa, ON, Canada, 1–4 August 2004; Paper No. 044055. American Society of Agricultural and Biological Engineers: St. Joseph, MI, USA, 2004. [Google Scholar] [CrossRef]
  23. Ella, V.B.; Keller, J.; Reyes, M.R.; Yoder, R. A low-cost pressure regulator for improving the water distribution uniformity of a microtube-type drip irrigation system. Appl. Eng. Agric. 2013, 29, 343–349. [Google Scholar] [CrossRef]
  24. Yang, X.; Lee, J.; Zhang, Y.; Wang, X.; Yang, L. Concentration, size, and density of total suspended particulates at the air exhaust of concentrated animal feeding operations. J. Air Waste Manag. Assoc. 2015, 65, 903–911. [Google Scholar] [CrossRef] [PubMed] [Green Version]
Figure 1. Photos of (a) the smaller biofilter (BF#1) outside of a wean-to-finish barn; and (b) the larger biofilter (BF#2) outside of a gestation barn.
Agriengineering 04 00013 g001
Figure 2. (a) Cross-section (top view) of each biofilter; and (b) side view of each biofilter. Both biofilters had the same orientation, each with three air outlet sides facing south, east, and north, respectively. Each side was divided into nine sections for measurement.
Agriengineering 04 00013 g002
Figure 3. (a) Average air velocity and (b) average woodchip moisture content on the south, east, and north sides of each biofilter. Non-parametric ANOVA was performed for comparison. The sides annotated with the same letter were not significantly different.
Agriengineering 04 00013 g003
Figure 4. (a) Average air velocity and (b) average woodchip moisture content at the upper, middle, and lower rows of each biofilter. Non-parametric ANOVA was performed for comparison. The rows annotated with the same letter were not significantly different.
Agriengineering 04 00013 g004
Figure 5. Temporal changes in the uniformity of (a) air velocity distribution and (b) woodchip moisture content. Note: A smaller CV value represents a more uniform distribution which a smaller DU value represents a less uniform distribution.
Agriengineering 04 00013 g005
Table 1. Average air velocity (m/s) of each section over the entire monitoring period 1.
BF#1
South SideEast SideNorth Side
0.16 ± 0.11 0.11 ± 0.020.12 ± 0.020.12 ± 0.040.18 ± 0.070.17 ± 0.060.17 ± 0.090.14 ± 0.070.13 ± 0.07
0.10 ± 0.00 0.12 ± 0.040.18 ± 0.110.17 ± 0.140.15 ± 0.060.18 ± 0.100.14 ± 0.050.12 ± 0.040.14 ± 0.04
0.15 ± 0.07 0.13 ± 0.050.13 ± 0.020.14 ± 0.060.13 ± 0.050.16 ± 0.110.11 ± 0.020.15 ± 0.060.13 ± 0.05
BF#2
South SideEast SideNorth Side
0.16 ± 0.06 0.15 ± 0.040.16 ± 0.080.12 ± 0.040.16 ± 0.060.19 ± 0.080.18 ± 0.120.16 ± 0.070.11 ± 0.02
0.11 ± 0.02 0.15 ± 0.040.14 ± 0.080.12 ± 0.040.13 ± 0.080.15 ± 0.050.11 ± 0.020.16 ± 0.060.13 ± 0.04
0.15 ± 0.05 0.12 ± 0.040.15 ± 0.060.13 ± 0.060.17 ± 0.050.16 ± 0.070.10 ± 0.000.13 ± 0.040.16 ± 0.06
1 Data in the table are arranged following the grids in Figure 2b.
Table 2. Average woodchip moisture content (%) of each section over the entire monitoring period 1.
BF#1
South SideEast SideNorth Side
32.2 ± 12.0 30.2 ± 11.345.0 ± 16.843.5 ± 16.338.2 ± 14.337.5 ± 14.041.7 ± 15.649.0 ± 18.354.7 ± 20.5
44.7 ± 16.7 37.8 ± 14.238.0 ± 14.245.2 ± 16.936.8 ± 13.842.3 ± 15.852.2 ± 19.546.8 ± 17.552.3 ± 19.6
41.2 ± 15.4 41.0 ± 15.335.8 ± 13.460.5 ± 22.639.5 ± 14.849.2 ± 18.450.2 ± 18.858.5 ± 21.961.7 ± 23.1
BF#2
South SideEast SideNorth Side
45.0 ± 12.4 38.4 ± 10.532.7 ± 9.047.6 ± 13.146.3 ± 12.737.3 ± 10.344.0 ± 12.162.6 ± 17.260.9 ± 16.7
34.0 ± 9.3 20.9 ± 5.743.8 ± 12.056.3 ± 15.421.8 ± 6.049.3 ± 13.559.8 ± 16.451.5 ± 14.160.7 ± 16.7
21.2 ± 5.8 10.5 ± 2.941.0 ± 11.346.4 ± 12.720.3 ± 5.630.6 ± 8.437.0 ± 10.232.0 ± 8.838.2 ± 10.5
1 Data in the table are arranged following the grids in Figure 2b.
Publisher’s Note: MDPI stays neutral with regard to jurisdictional claims in published maps and institutional affiliations.

