Article

Impacts and Climate Change Adaptation of Agrometeorological Services among the Maize Farmers of West Tamil Nadu

by
Punnoli Dhanya
1,*,
Vellingiri Geethalakshmi
1,*,
Subbiah Ramanathan
1,
Kandasamy Senthilraja
2,
Punnoli Sreeraj
3,
Chinnasamy Pradipa
4,
Kulanthaisamy Bhuvaneshwari
1,
Mahalingam Vengateswari
5,
Ganesan Dheebakaran
1,
Sembanan Kokilavani
1,
Ramasamy Karthikeyan
2 and
Nagaranai Karuppasamy Sathyamoorthy
1
1
Agro Climate Research Centre, Tamil Nadu Agriculture University, Coimbatore 641003, India
2
Directorate of Crop Management, Tamil Nadu Agriculture University, Coimbatore 641003, India
3
Thangal Kunju Musaliar College of Engineering (TKMCE), Kollam 691005, India
4
Krishi Vigyan Kendra, Tamil Nadu Agriculture University, Salem 636203, India
5
Krishi Vigyan Kendra, Tamil Nadu Agriculture University, Ramanathapuram 623536, India
*
Authors to whom correspondence should be addressed.
AgriEngineering 2022, 4(4), 1030-1053; https://doi.org/10.3390/agriengineering4040065
Submission received: 29 June 2022 / Revised: 5 August 2022 / Accepted: 29 August 2022 / Published: 25 October 2022
(This article belongs to the Special Issue Agrometeorology Tools and Applications for Precision Farming)

Abstract

:
Climate change is often linked with record-breaking heavy or poor rainfall events, unprecedented storms, extreme day and night time temperatures, etc. It may have a marked impact on climate-sensitive sectors and associated livelihoods. Block-level weather forecasting is a new-fangled dimension of agrometeorological services (AAS) in the country and is getting popularized as a climate-smart farming strategy. Studies on the economic impact of these microlevel advisories are uncommon. Agromet advisory services (AAS) play a critical role as an early warning service and preparedness among the maize farmers in the Parambikulam–Aliyar Basin, as this area still needs to widen and deepen its AWS network to reach the village level. In this article, the responses of the maize farmers of Parambikulam–Aliyar Basin on AAS were analyzed. AAS were provided to early and late Rabi farmers during the year 2020–2022. An automatic weather station was installed at the farmers’ field to understand the real-time weather. Forecast data from the India Meteorological Department (IMD) were used to provide agromet advisory services. Therefore, the present study deserves special focus. Social media and other ICT tools were used for AAS dissemination purposes. A crop simulation model (CSM), DSSAT4.7cereal maize, was used for assessing maize yield in the present scenario and under the elevated GHGs scenario under climate change. Our findings suggest that the AAS significantly supported the farmers in sustaining production. The AAS were helpful for the farmers during the dry spells in the late samba (2021–2022) to provide critical irrigation and during heavy rainfall events at the events of harvest during early and late Rabi (2021–22). Published research articles on the verification of weather forecasts from South India are scanty. This article also tries to understand the reliability of forecasts. Findings from the verification suggest that rainfall represented a fairly good forecast for the season, though erratic, with an accuracy score or HI score of 0.77 and an HK score of 0.60, and the probability of detection (PoD) of hits was found to be 0.91. Verification shows that the forecasted relative humidity observed showed a fairly good correlation, with an R2 value of 0.52. These findings suggest that enhancing model forecast accuracy can enhance the reliability and utility of AAS as a climate-smart adaptation option. This study recommends that AAS can act as a valuable input to alleviate the impacts of hydrometeorological disasters on maize crop production in the basin. There is a huge demand for quality weather forecasts with respect to accuracy, resolution, and lead time, which is increasing across the country. Externally funded research studies such as ours are an added advantage to bridge the gap in AAS dissemination to a great extent.

1. Introduction

There is a mounting interest in the monitoring of weather aberrations and climate change worldwide due to rising climate-related catastrophes. The Intergovernmental Panel on Climate Change (IPCC) has warned that global warming may increase the intensity and frequency of extreme environmental events such as forest fires, hurricanes, heat waves, floods, droughts, and storms. [1]. More than a billion people currently live in water-scarce regions, and as many as 3.5 billion could experience water scarcity by 2025. At the same time, demand for food is also estimated to grow by 50 percent during the year 2050 concerning the base year 2010 [2]. Not only the sudden shift in rainfall regimes, but any surge in day and night time temperature also has a huge potential to disturb living organisms either directly or indirectly [3,4]. CMIP6-Global Climate Models project a warmer (3–5 °C) and wetter (13–30%) climate for South Asian regions in the 21st century [5]. In fragile situations, where there is high vulnerability and little investment in coping mechanisms and adaptation, the effects of climate change might be felt most keenly [6].
Building local capacities and enhancing resilience are considered the prime focal themes in the Prime Minister of India’s 10-point agenda on disaster risk reduction (DRR). Enhancing smart weather solutions at the farm level is a significant stratagem in dealing with the climate crisis. To address wide variations in weather and its impacts on crops within the district, the panel of experts, including agrometeorologists, agronomists, entomologists, and extension specialists, should prepare crop-specific weather advisories of the respective district/block and disseminate them to farmers. Individual researchers would also help to bring into the limelight a deeper understanding of the location-specific crop management details to the research and capacity-building front.
Since India is a peninsular country, it commonly experiences cyclones from the Arabian Sea, the Bay of Bengal, and the Indian Ocean. Recently, the “Nisarga” cyclone that happened during May 2020, the early pandemic period, posed severe challenges to the small and marginal farming communities of not only coastal regions but interior parts of Tamil Nadu, including the present study area. During the cyclone “Nivar” (23–24 November 2020), the Indian Meteorological Department (IMD) issued a red alert for many blocks of Tamil Nadu and Kerala.
The droughts are also widespread in many pockets across Tamil Nadu with a once-in-three years frequency [7]. Peninsular India may lose approximately 6000 km2 of its arable lands due to climate change-induced sea-level rise [8]. Building social resilience is a crucial step forward in mainstreaming national and state climate change adaptation frameworks [9]. Timely dissemination of weather-related information plays a major role in proactive adaptation frameworks. A great deal of climate research and investment aims to strengthen the credibility of the information that national meteorological services provide [10].
The magnitude of climate change impacts is going to be beyond the capacity of farmers’ autonomous adaptation. In many cases, the occurrence of sudden dry spells, increasing temperature over the years, frequent and severe droughts, and depletion of groundwater levels have restricted farmers in the selection of water-intensive crops, reduced their risk-bearing capabilities, etc. This has led to an increase in rural to urban migration and adoption of nonfarm activities in many places [11]. However, as shown in Figure 1, adopting weather-smart solutions and diversification of agricultural livelihoods through agro-allied sectors such as animal husbandry, forestry, and fisheries have a huge potential for enhanced livelihood opportunities and strengthened resilience [12]. Automatic weather stations are one of the single-window systems for not only understanding the real-time weather scenario from farmers’ fields but also preparedness and recovery. These ICTs benefit in enhancing the benefits of science to reach stakeholders more efficiently.

1.1. Status of AAS Dissemination in India

Weather forecasting is a new-fangled dimension of AAS in the country and aer getting popularized as a climate-smart farming strategy. At present, India is progressing in the field of agromet advisory services with the big expansion of Indian satellites focusing on weather data collection. INSAT 3A, MeghaTropiques INSAT 3D INSAT 3DR, automatic weather stations (AWSs), automatic rain gauges (ARGs), Doppler weather radars (DWRs), lightning sensors, and mobile applications are vague to support agromet advisory systems. In order to connect weather forecasting services to farmers, the Government of India, under the leadership of the Indian Meteorological Department, has set up agromet field units (AMFUs). Agromet advisories are prepared and disseminated by AMFUs and state agriculture universities (SAUs) twice a week (Tuesdays and Fridays), covering 690 districts under the GKMS scheme. Seasonal forecasts and agromet advisories benefit farmers to plan and prepare for disasters, enhance local resilience, and implement risk-aversion strategies. The IMD issues extended-range forecasts and seasonal forecasts for all the districts in the country. This facilitates season-wise crop management and contingency crop planning by the department of agriculture (DoA) and SAUs. Traditional knowledge also plays a pivotal role to understand crop management at various stages. In this research, agromet advisories (AAS) were disseminated to more than 200 maize growers in the Parambikulam–Aliyar Basin (PAP) during the Rabi season (2021–2022). The impact of agrometeorological services on the sustainable production and livelihood of maize farmers is dealt with in this research article. Studies on the economic impact of these microlevel advisories are uncommon. Therefore, the present study was undertaken

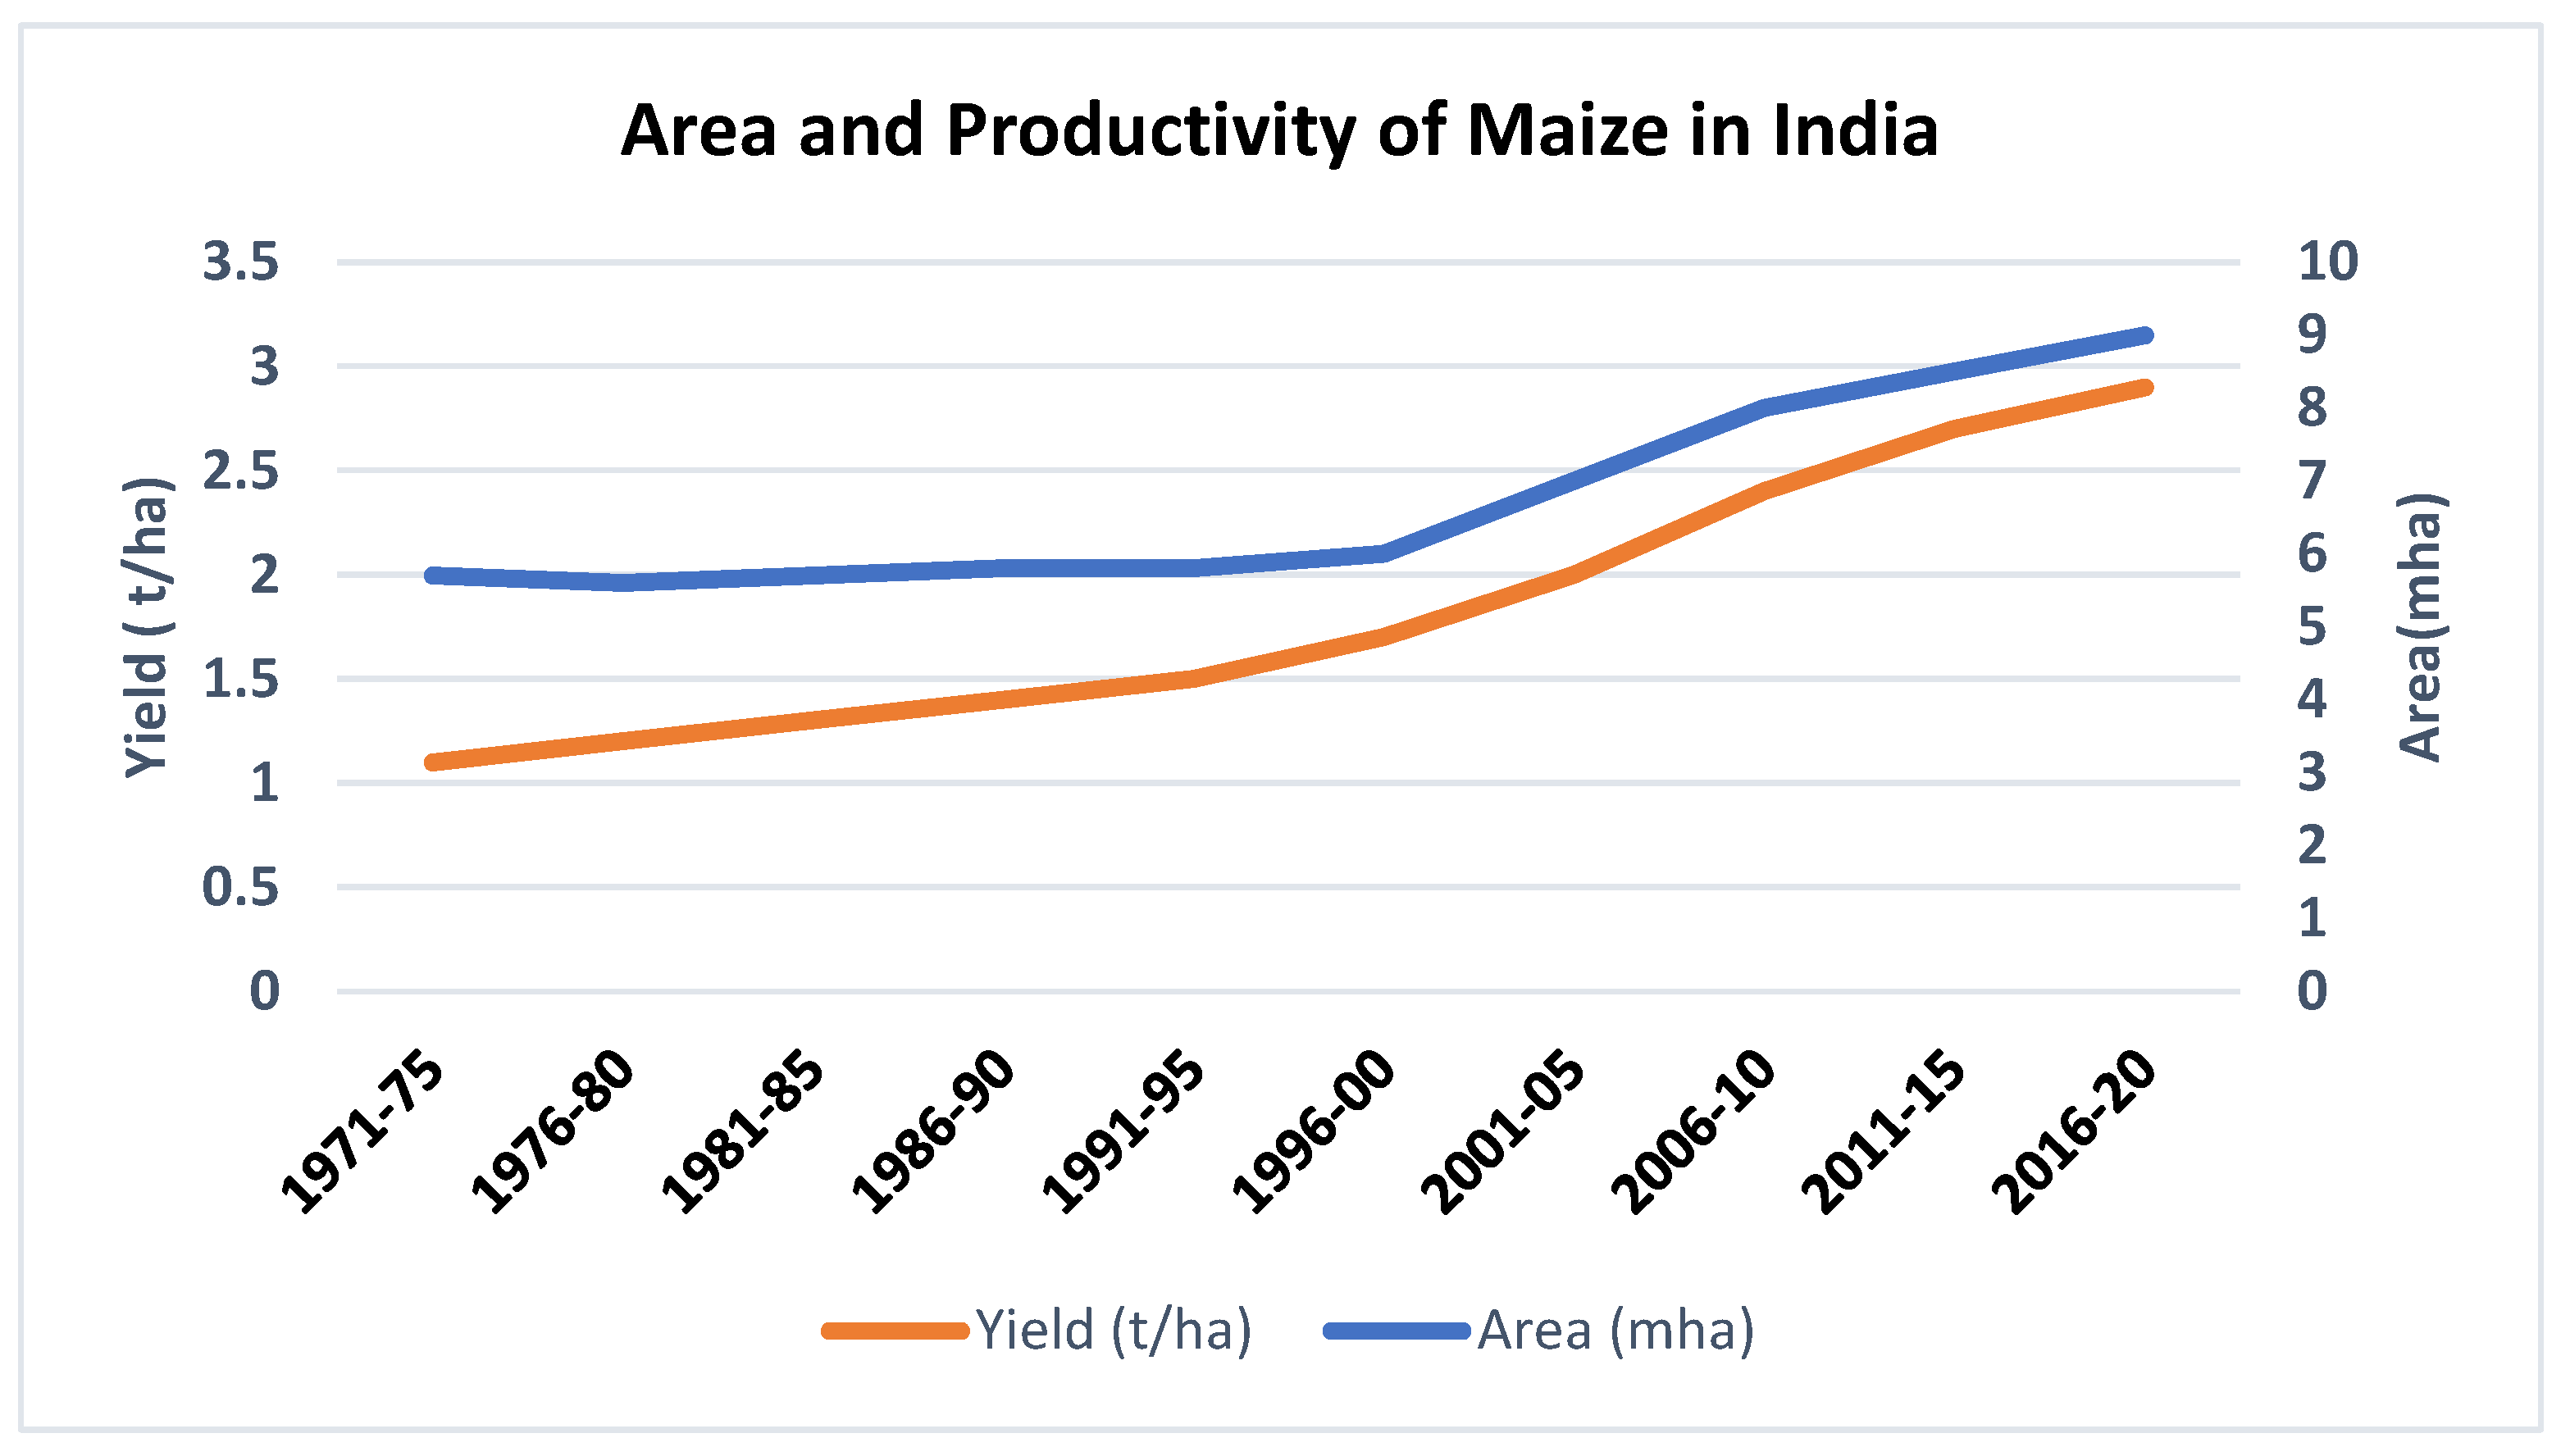
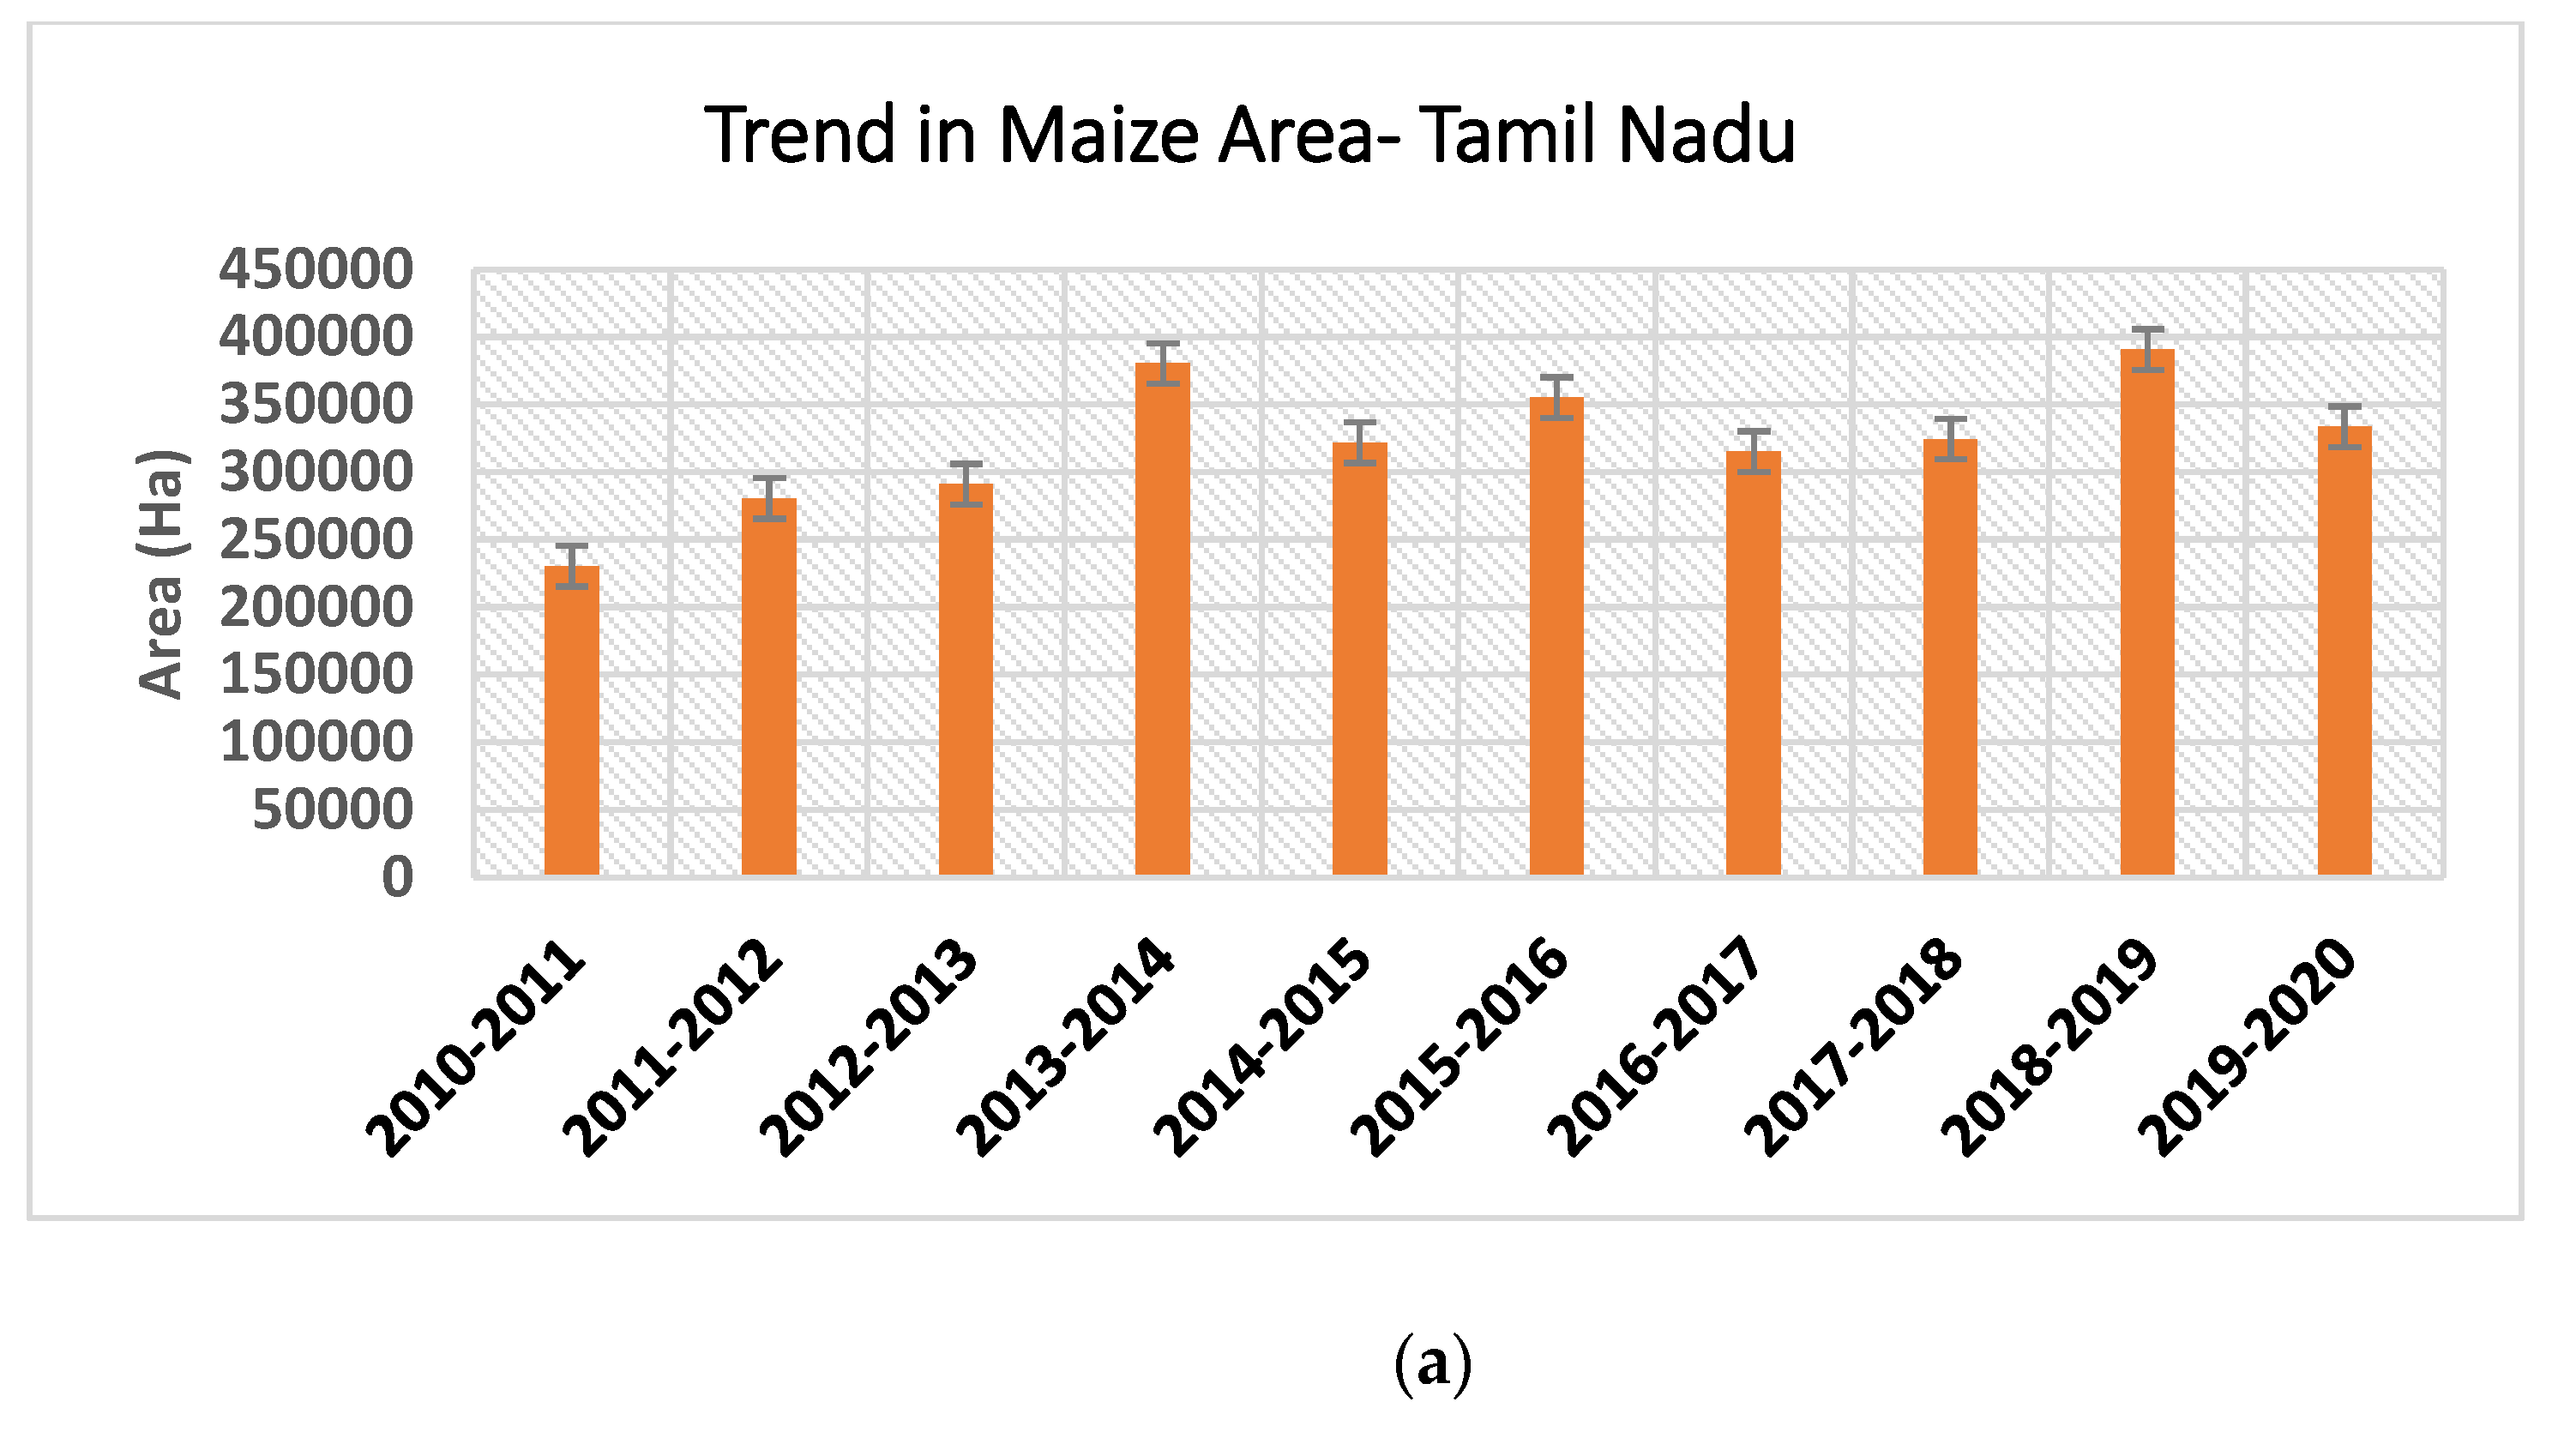
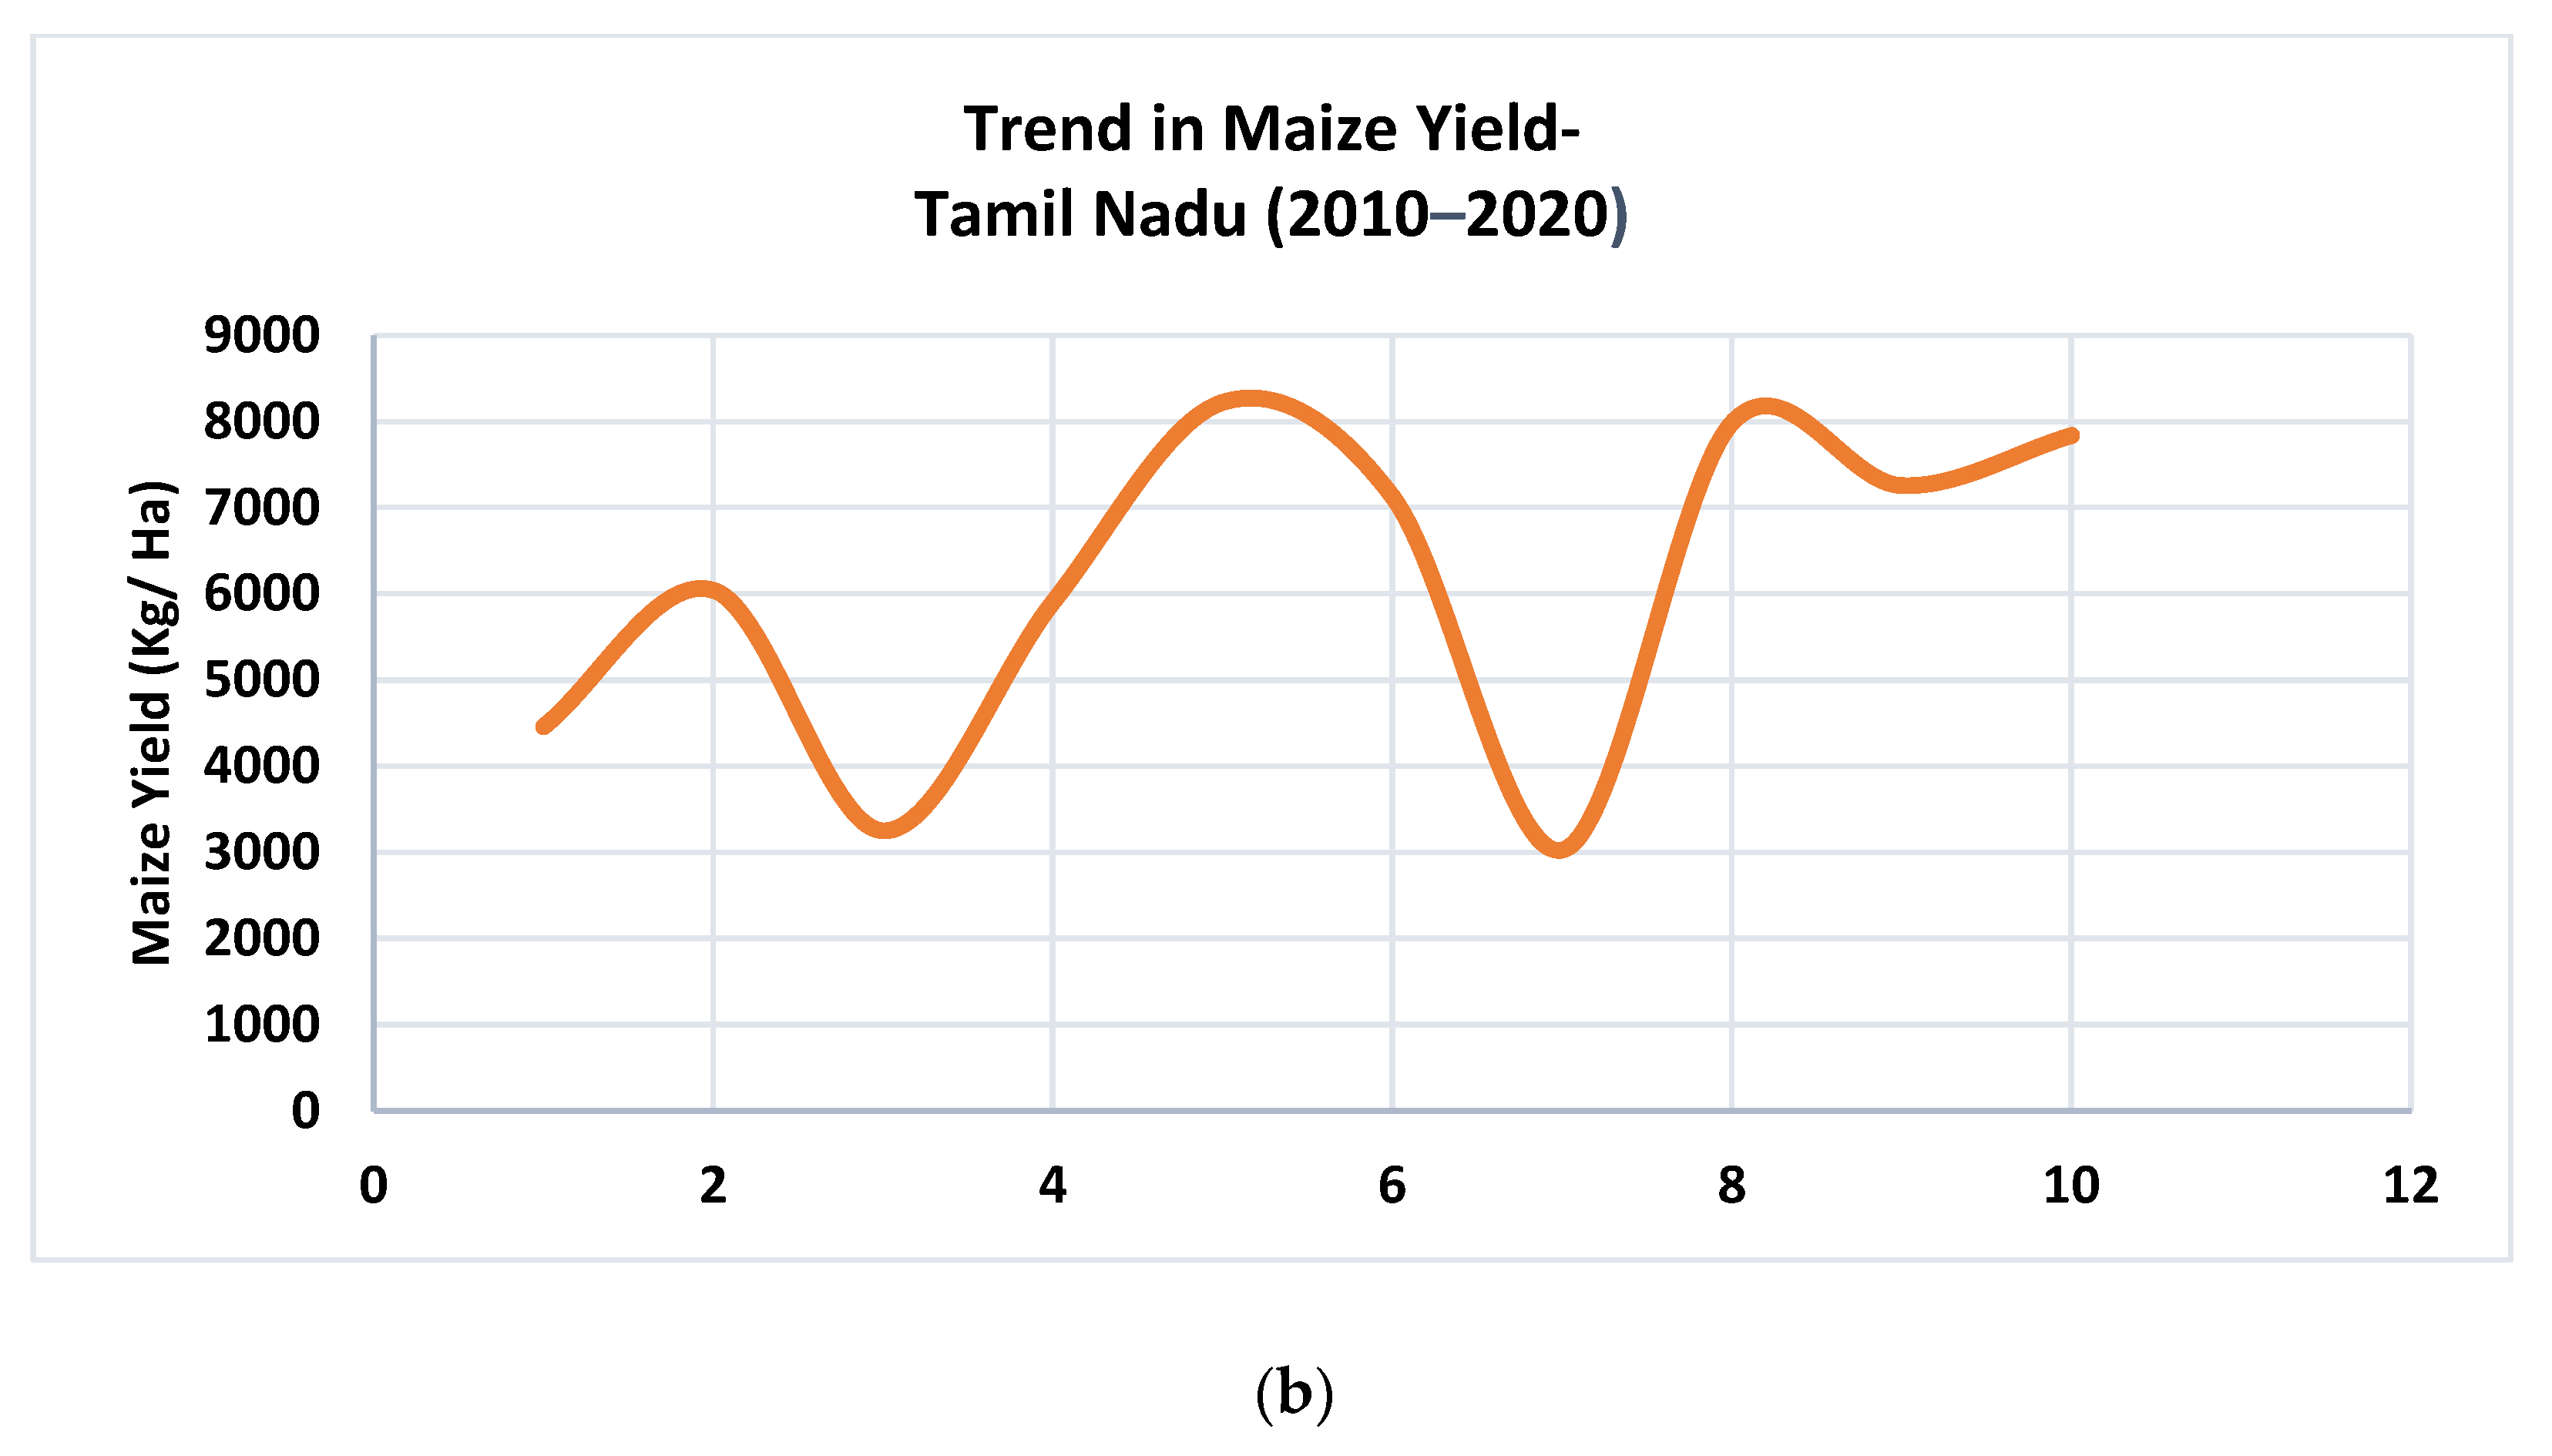
1.2. Maize Production Statistics in India

India ranks 4th in area and 7th in production among the maize-growing countries, representing around 4% of the world’s maize area and 2% of total production. During 2018–2019 in India, the maize area reached 9.2 million ha [13]. During 1950–1951, India used to produce 1.73 million MT of maize, which increased to 27.8 million MT by 2018–2019, recording close to a 16 times increase in production (Figure 2). The average productivity during the period increased by 5.42 times from 547 kg/ha to 2965 kg/ha, while the area increased by nearly 3 times (Figure 3). Maize (“makka cholam” in the local language Tamil) area and yield in Tamil Nadu have also shown a significant increasing trend in the last decade. Among Indian states, Madhya Pradesh and Karnataka have the highest area under maize (15% each), followed by Maharashtra (10%) and Tamil Nadu (4%).

2. Materials and Methods

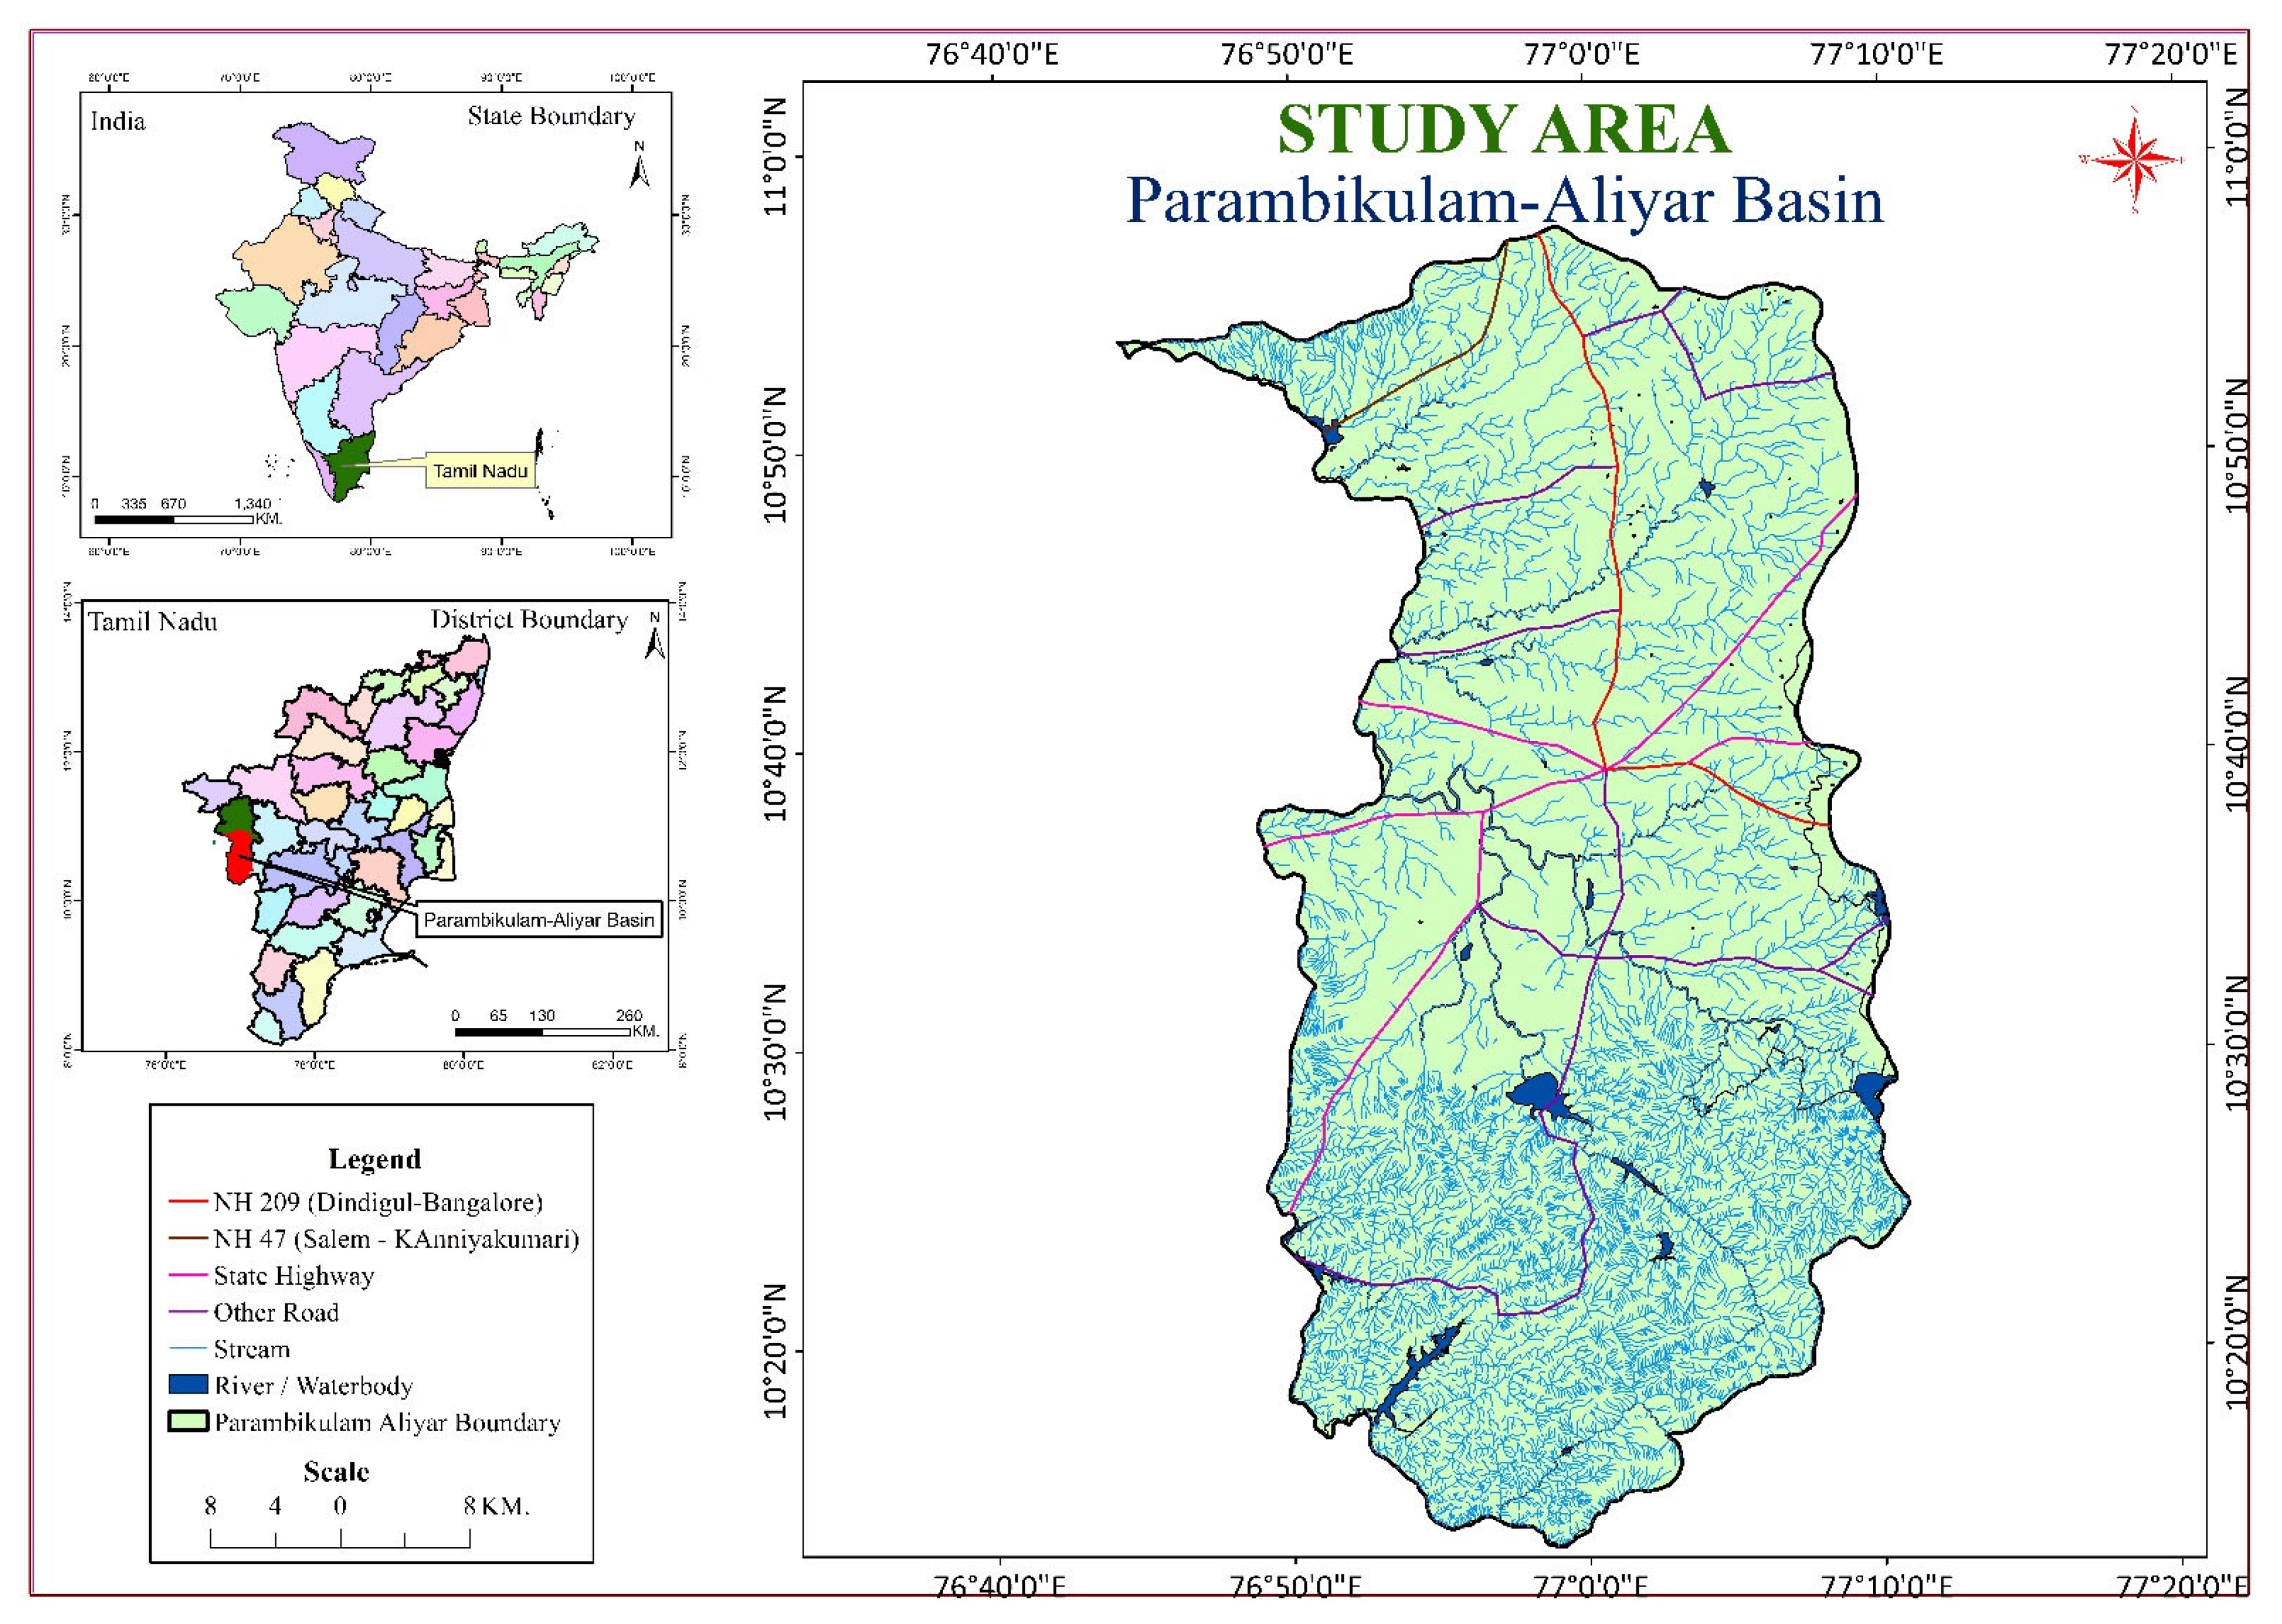
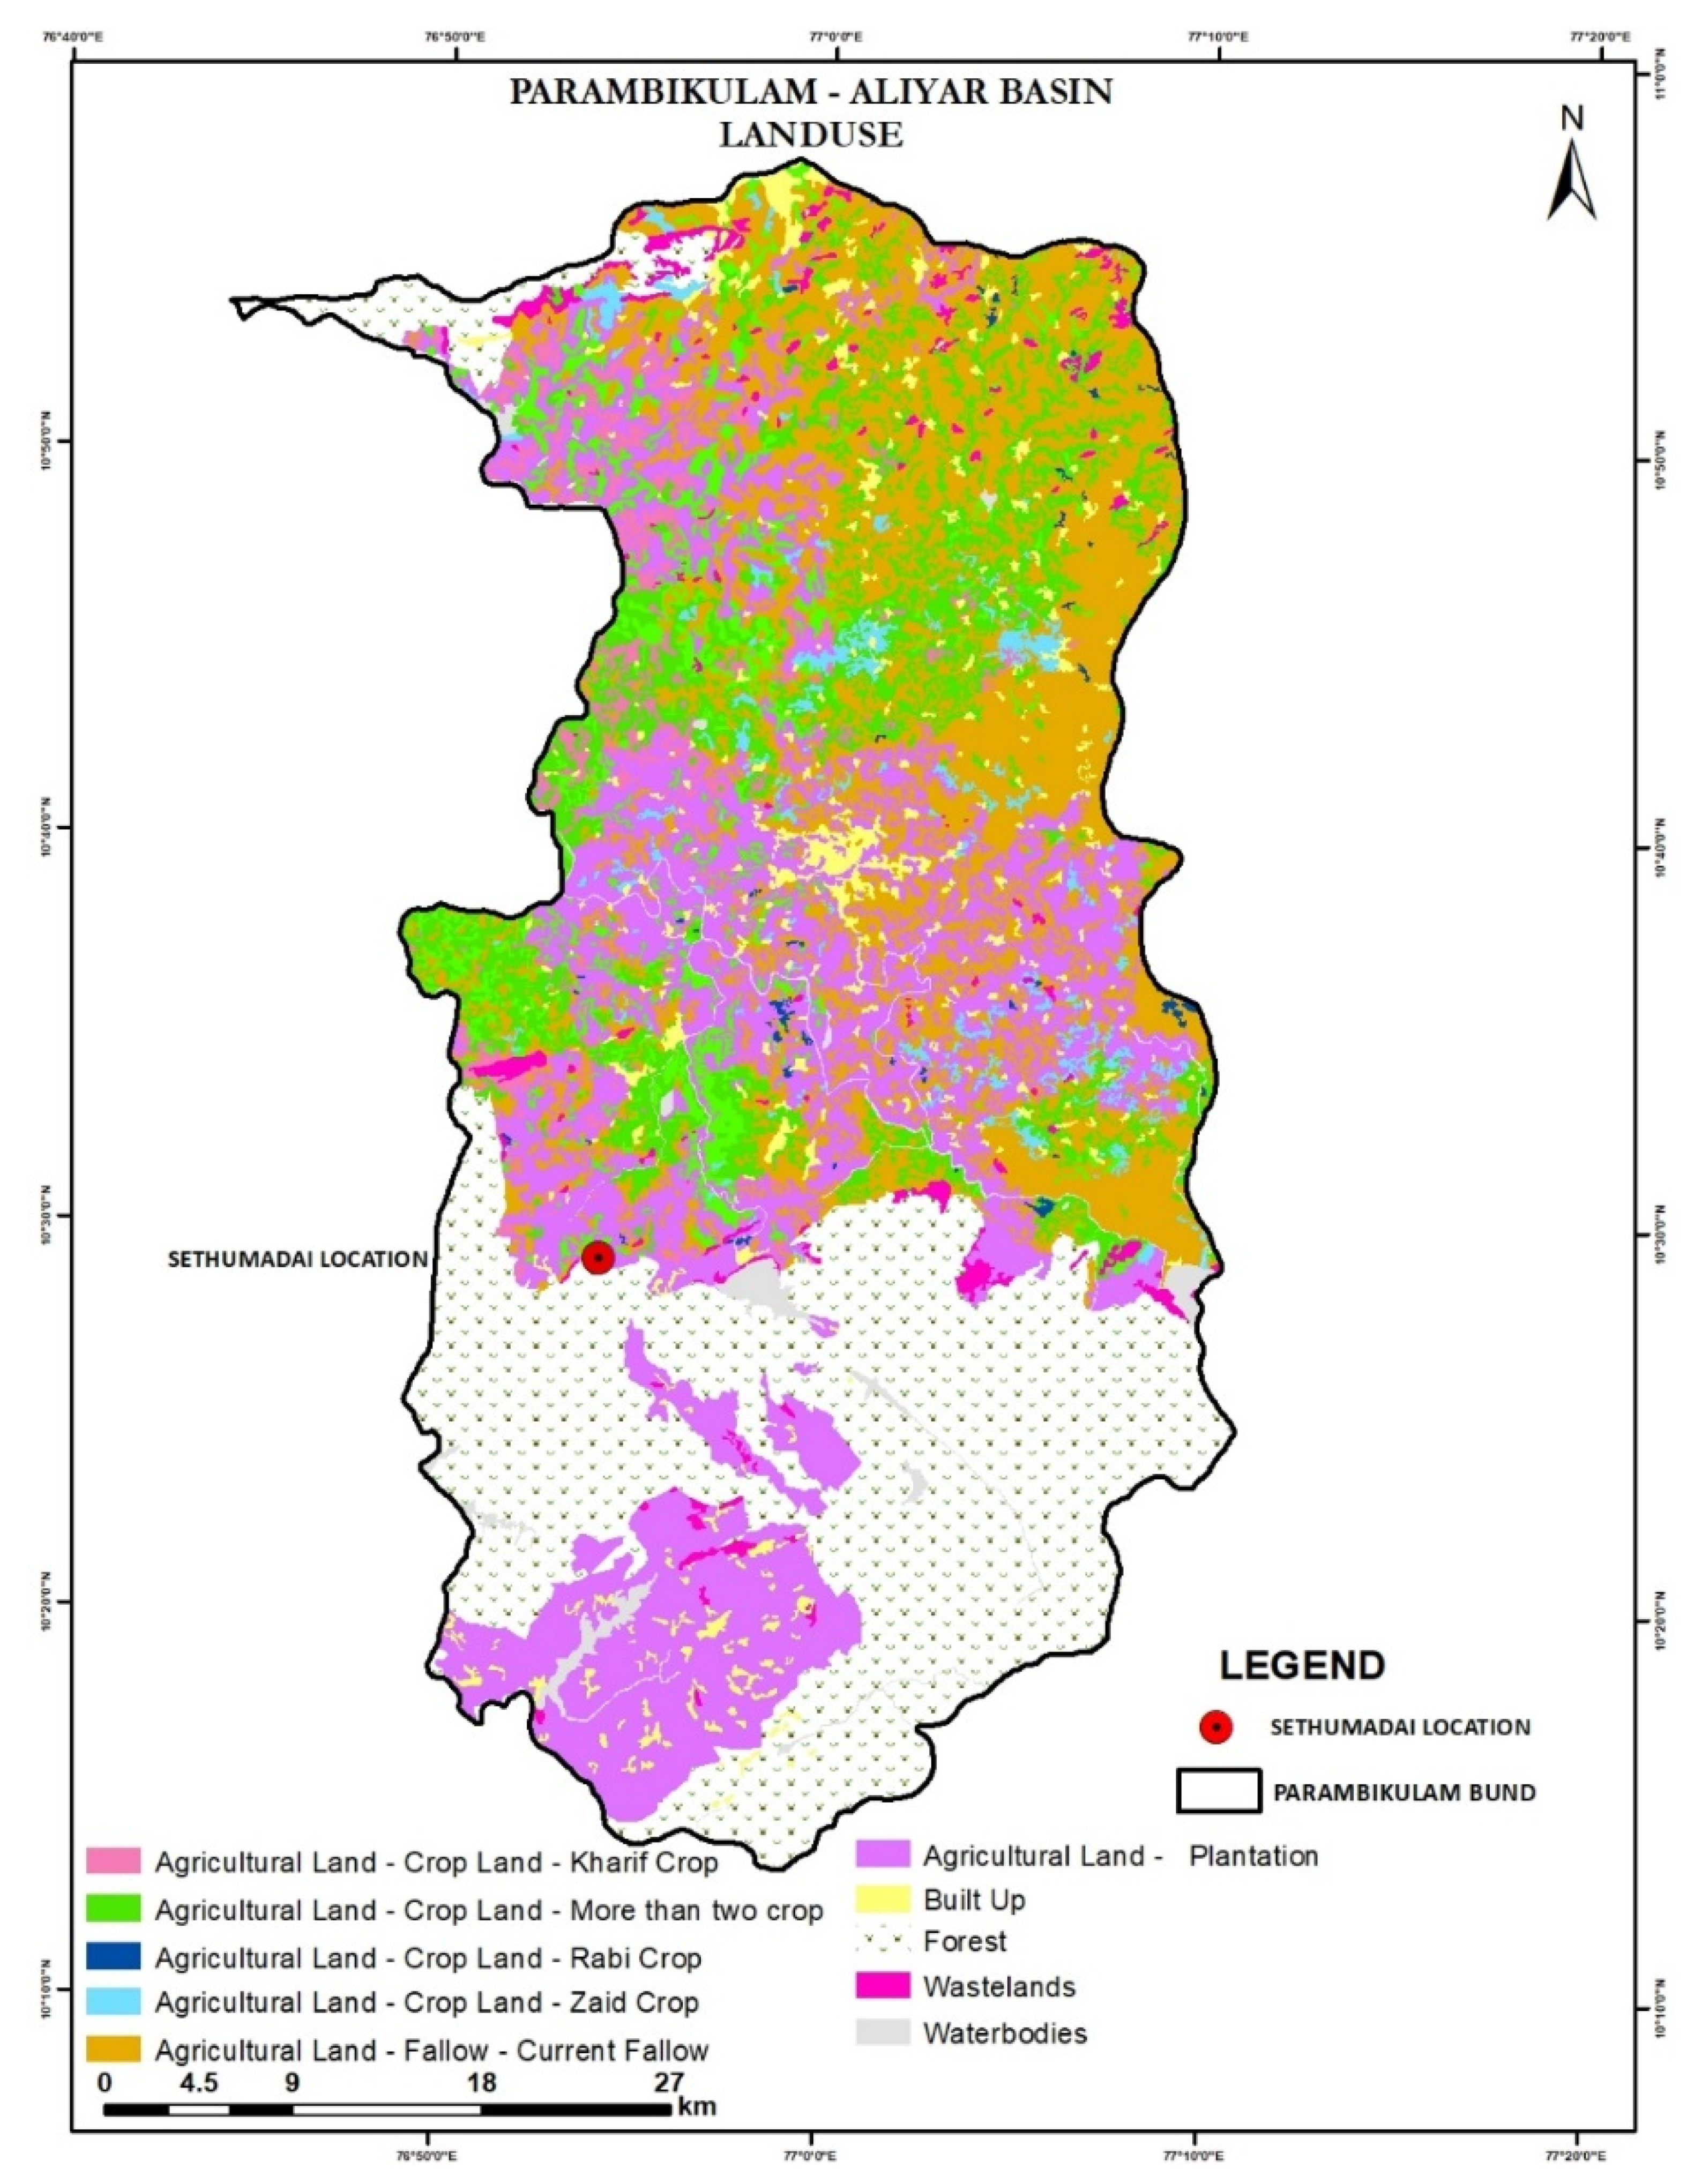
2.1. Study Area: Parambikulam–Aliyar Basin

The Parambikulam–Aliyar Basin (PAP) forms part of the west agroclimatic zone of Tamil Nadu. PAP dams are built as an interstate water distribution project for sharing waters between two south Indian states namely Kerala and Tamil Nadu. This basin is located between the coordinates of 10°10′00″ N to 10°57′20″ N latitude, 76°43′00″ E to 77°12′30″ E longitudes. and covers an area of 2388.72 km2 (Figure 4). The catchment area of this basin is in the Western Ghats. It is a multipurpose project completed in the late 1960s, and its functioning is based on an agreement between the two states (Figure 4). The Parambikulam–Aliyar project diverts the water from the basins of three west-flowing rivers originating from the western ghats along the Kerala–Tamil Nadu border, namely, Periyar, Chalakkudi Puzha, and Bharathapuzha. There is a huge spatial variation in the amount of water received in this basin. The average annual rainfall received in the hilly areas is 1500 mm, 940 mm in the basin, and in the plain areas, it is approximately 600 mm. The maize crop is grown mainly in the command areas of the basin under irrigated conditions, and groundnut and sorghum are grown under rainfed conditions. These rivers are mainly fed by the southwest monsoon and northeast monsoon rainfall. It can be seen from the land-use land cover maps that plantation crops such as coconut, nutmeg, cocoa, etc., are also widely grown in these areas (Figure 5, [14]). The southern end of the basin has the catchment areas of the Aliyar and Palar rivers, filled with thick-forested hills, and in some parts, it is merely rocky outcrops.

2.2. Dissemination of AAS to the Farming Communities

Forecasted block-level weather data from the regional meteorological center (RMC), Chennai, or the IMD, New Delhi, were used for dissemination. Every Tuesdays and Fridays, IMD sends out a medium-range weather forecast at the block level. As a result, registered farmers receive weather information weekly twice. Agromet advisories are prepared biweekly, integrating the real-time weather retrieved from an automatic weather station with the forecasts provided by the IMD and subject-matter expertise. A server was maintained at the Agro Climate Research Center, Tamil Nadu Agriculture University, Coimbatore, for the retrieval of data from the farmers’ field
The maize farmers are provided with block-level agromet advisories biweekly via ICT tools, including social media apps and websites (https://weatheroutlookanamalai.com/ (accessed on: 5 August 2022), in the vernacular language Tamil. Dispersal of AAS was initiated with the land preparation/sowing time and continued till harvest, covering all sensitive crop growth stages in both the early and late samba season. Primary data were generated through a semi-structured sample survey, face-to-face interviews, and meetings. Frequent field visits were conducted during the crop-growing season to understand cropping patterns, production strategies, and different growth stages.
In AAS dissemination, local knowledge and subject expertise are complementary to each other, as both are interconnected to facilitate appropriate decision-making. Primary data were gathered through frequent field visits and individual and group interviews. The website was also created for exclusive dissemination of advisories in both English and the vernacular language. Amazon Web Services (AWS), the world’s most comprehensive and broadly adopted cloud platform, was used to maintain web services.

2.3. Verification of Skill Score of the Forecasts

Weather forecast verification helps improve the model forecast for a particular location [13]. For the verification, the methodology suggested by the IMD is adopted [15]. Kothayal et al. [16] and Rathore and Parvinder [17] also followed a similar approach. Research articles on verification from South India are very few. HI score/accuracy score/ratio score/hit ratio are the same.
Hit Ratio = H + Z H + Z + M + F × 100
(1) Or Correct Forecast/Actual Forecast
HK Score: Hanssen and Kuipers Score or True Skill Score:
HKScore = ( Z × H ) ( M × F ) ( Z + F ) × ( M + H )
Bias Score:
Probability of Detection (POD) Score:
Hit   Rate = P O D = H H + M
Here H = (YY)—observed and predicted; F = (NY)—number of falls alarms, not observed but predicted), M = (YN)—no of misses, observed, but was not forecasted; Z = (NN)—neither observed nor predicted).
FAR = F H + F
RMSE = i = 1 n ( P i O i ) 2 n
Here (Pi is the forecast value; P is the mean forecast; Oi is the observed value, and O is the mean observed value for each day).
The forecasts can be verified in two different ways, namely, qualitative and quantitative. The accuracy assessment helps the modelers to fine-tune the models and give proper weather predictions. The qualitative verification of forecasts with observed real-time weather supports fine-tuning of the model forecast by the authorities for better reliability. ‘R’ software was used to prepare the correlogram of observed and forecasted variables

2.4. Crop Simulation Modeling to Understand the Anticipated Impacts on Maize Yield

The decision support system for agrotechnology transfer (DSSAT4.7), a biophysical, process-based crop simulation model (CSM), was used to carry out the impact assessment [18]. The IMD’s gridded rainfall data at a 0.25 × 0.25 degree grid resolution was used to generate climate details. Maize Hybrid CO-6 is the main cultivar introduced by state agriculture universities in the study region. Hence, this ruling variety is considered for impact assessment (IA). IA of maize crop under observed climate and elevated CO2 concentration in future climate change scenarios was explored using DSSAT4.7. Grain weight under elevated CO2 conditions as per future climatic conditions during the early, mid, and end century period as per the RCP 4.5 scenario was analyzed as per the fifth assessment report of the IPCC. Solar radiation data were derived using DSSAT’s Weather Generator tool, providing inputs such as day and night time temperatures and rainfall [19]. The time period for the baseline climate used for this study was from 1981 to 2017.
The CERES-Maize model is a part of a suite of crop models available in DSSAT under the cereal category. This module was developed by Jones and Kiniry et al. [20], and it continues to be the most widely used maize model globally according to Basso et al. [21]. Farm-level information on cropping patterns and management details are essential prerequisites for regional and local level impact assessments using CSMs. Soil files and crop management files were created for the study area and given as input for the model. In the western zones of Tamil Nadu, maize is cultivated mainly in the Rabi season. Through field visits, it was revealed that maize sowing takes place normally during the second to the third week of September under early samba. The late samba season generally commences in mid-November in the study area. The PAP basin gets water from the Aliyar, Palar, and Thirumurthy irrigation canal systems by the end of the SW monsoon season/Kharif season. In almost all crop-growing villages, maize sowing takes place in mid-September under rainfed and irrigated conditions. Hence, 15 September was chosen as the sowing date for simulations.
Quartile deviation was calculated as:
QD = (Q3 − Q1)/2

3. Results

3.1. Climate-Related Disasters Profile of the Study Area

It is clear from the hydrometeorological data that this basin is significantly hit by climate-related disasters (Table 1). The recent one was the very severe cyclonic storm “Nivar”, a tropical cyclone that brought severe impacts to many parts of Tamil Nadu, including the study area. However, the cyclone “Gulab” that formed during the fourth week of September 2021 has helped in the proper establishment of early samba maize crops. BOB5 and BOB6 cyclonic depressions also created havoc for the maize crop during their harvesting phase in the basin from the second and third weeks of November 2021. Harvest-ready crops were affected by heavy precipitation events. After that, the impacts of cyclone Jawad were beneficial for the establishment of the late Rabi maize crop during the first and second weeks of December.
Severe dry conditions were reported by farmers during the years 2016, 2012, and between 2001 and 2003. These years are remembered as drought years. The years 2015, 2010, and 2005 are remembered as wet or excess rainfall years. Cyclones do not always negatively impact agriculture. Extremely heavy rainfall caused by the cyclone “Tauktae” provided good rainfall during May 2021. Orange and red/flood alerts were issued by the IMD for many parts of the state. The recent cyclone that formed during the second week of May 2022 helped farmers to obtain a good amount of rainfall, hence the land preparation and sowing of groundnut crops were performed successfully in this area.

3.2. Observed Weather during the Maize-Growing Period (2021–2022)

The hourly, daily, monthly, and seasonal weather files derived from the AWS wereprocessed to understand the overall weather conditions in the study area during the early and late Rabi season (Figure 6a–c). The highest average daytime temperature was observed during September (33.93 °C), and after that, the temperature start decreasing in the subsequent months. The highest diurnal temperature range was observed in February and the lowest during November. December is the coolest month in the study area, with the recorded lowest daytime temperature of 24.81 °C. The highest mean nighttime temperature received was also during September (24.11 °C), and the lowest mean was during January (19.38 °C).
The observed rainfall for the Rabi season was above normal during both November and October in the study area, with a total rainfall of 358.5 mm and 273 mm, respectively for each month. The total rainfall received during both the early and late samba Maize-growing seasons is 723 mm in this region. As far as the highest single-day 24 h maximum precipitation is concerned, 17 and 23 November have a recorded rainfall of around 70 mm each and on 1 and 5 October 34 and 36 mm, respectively (Figure 6a). This area received no rainfall at all during the winter months of 2022. It is to be noted that during April, the area received good summer rainfall of 109.5 mm due to the impacts of cyclonic depression (BOB-1) in the Bay of Bengal. The mean RH was maximum during November is 81.8%, followed by October (79.7%), and February is the driest month, with a mean RH of only 63.7% (Figure 6b).
The distribution of kharif rainfall was maximum during the month of July (80 mm), 2021, followed by June (78.5 mm). The total seasonal rainfall received was 252 mm for kharif and 0 mm during winter months, 181 for summer months, and 530 mm for the northeast monsoon season in 2021.

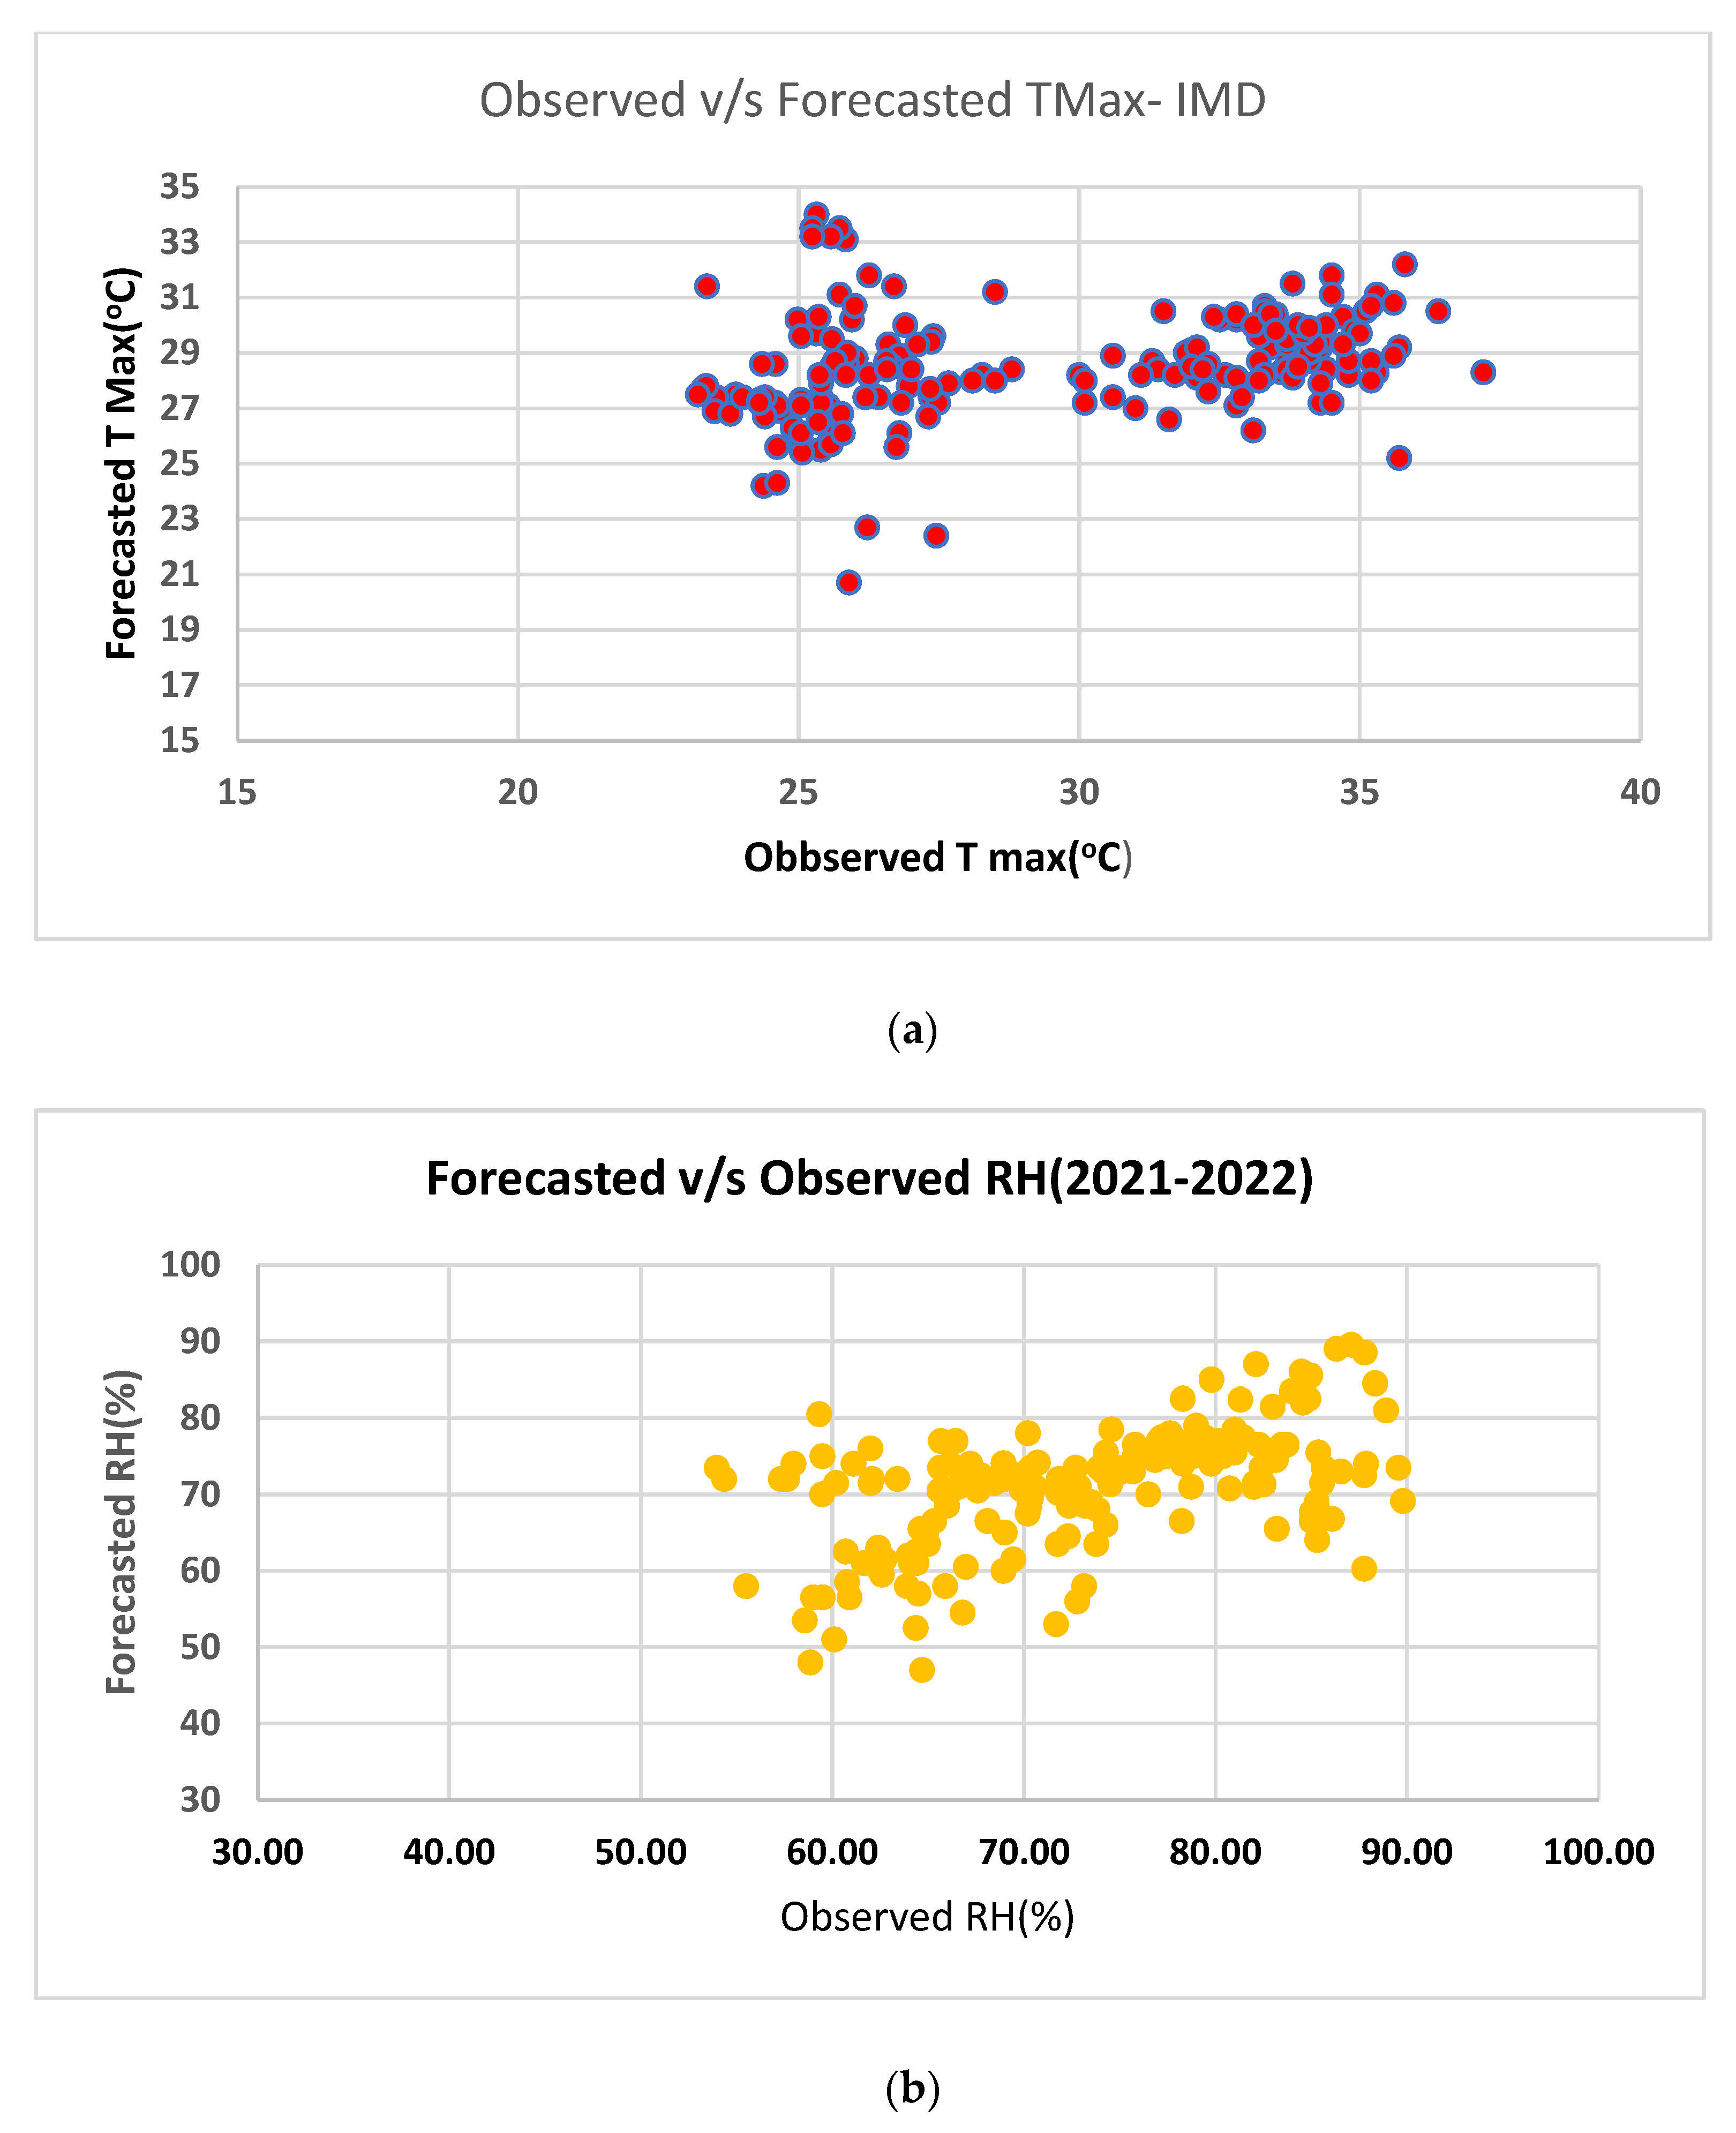
3.3. Qualitative Scores and Skills of the Weather Forecast Verification

Table 2 shows the skill score of verification conducted on the observed rainfall versus IMD vs. forecasted rainfall for the region during the crop-growing period. The rainfall represented a fairly good forecast for the season, though erratic, with an accuracy score or HI score of 0.77 and an HK score of 0.60, and the probability of detection of hits was found to be 0.91 with an RMSE of 10.90 and correlation coefficient (R2) of 0.21 (Table 2). The forecast of daytime temperature has a correlation coefficient of 0.26, and the forecast of nighttime temperature has an R2 value of 0.46. The forecasted relative humidity and observed showed a fairly good correlation, with an R2 value of 0.52 (Figure 6c). The correlogram shows that there is a significant negative correlation existing between observed TMax and RH at the 0.05% level. The climate of the Indian subcontinent is highly complex, as it is surrounded by the Bay of Bengal, the Arabian Sea, and the Indian Ocean on all three sides, as well as great mountain ranges such as the Himalayas in the north; hence, forecasting this complex monsoon-type climate is not easy. However, achieving this accuracy itself is a great move for a developing country such as India.

3.4. Responses/Feedback of the Farmers on AAS Services

Careful evaluation of the effectiveness of AAS at the farm level supports sustainable crop productivity and livelihood security. The field survey in the study area revealed that the AAS and forecast have helped farming communities the most during critical growth stages and harvest, followed by land preparation and sowing. Information and communication technologies and other technological interventions, including mobile phones, videos, social media, pamphlets, etc., were distributed to the farmers during awareness meetings. In addition to this, a website was hoisted to disseminate hourly and daily weather details and agromet advisory services for the benefit of the farmers. The fall armyworm, stem borer, and shoot borer infestation were recorded during visits in the farmers’ fields (Figure 7 and Figure 8). Pheromone traps and agronomic advisories were suggested to the farmers through the AAS to save crops from these attacks. Being on the valley side of the Anamalai hills, human wildlife conflicts are commonly seen in this area. Severe pig menace was reported by farmers of Anamalai during the tasseling and fruiting stages. Only a few of the progressive large farmers were seen with electric fences as control measures to wade away wild boars and peacocks (Table 3).
The effectiveness of weather forecasts and the AAS was assessed at various stages of the project. The field survey was conducted in three phases, early, mid, and end, of the project. In the early phase, during May–June 2020, field visits were conducted, and along with that, the AO offices of Anamalai, Pollachi north and south, and Udumalpet were also visited. Farmers’ cropping patterns, management, and contact details were collected. In the second phase, during September to November 2020, an ideal location at the farmers’ field was chosen to fix the automatic weather station. Field visits were conducted to cover all the major phases of the crop growth stages during the third phase commencing from September 2021. The land preparation and sowing in the field happened during the first week of September; hence, in the weather analysis, September is also added to the early samba season. The same farmers were contacted during the project’s third phase during the early and late samba maize-growing season in both the rainfed and irrigated fields of the basin.
In the initial phase of the project, there were only 33% of the farmers who considered AAS and weather forecasts to be very effective or effective (Table 4 and Table 5) However, at the end phase of the research project, the majority of the registered farmers (77.1%) reported that the AAS received through SMS and WhatsApp messages on crop-specific advisories and current weather forecasts are either effective or very effective (Table 4). The farmers specified that it is very effective to protect their crops from heavy-rain-related damages. It is remarkable to note that the project was successful in creating awareness among the farmers about the effects of the AAS. It can be seen that in the initial phase 45% of the farmers responded that they did not know about the AAS, and in the end phase, this percentage was reduced to 17%. This is a good sign that farmers have started benefiting from the AAS information obtained from Tamil Nadu Agriculture University (TNAU). This facilitated them to take timely and appropriate maize crop management measures based on the advisory bulletin.
From Table 4 and Table 5, it can be noted that more than 30% of the farmers each changed their farm operations based on the time of sowing, harvest, etc., based on the AAS. Implementing proactive agronomic or technological adaptation helped the farmers, as timely advisories reduce the economic losses during risky weather conditions. It is interesting to report that the awareness meeting has influenced the farmers to take up organic amendments in farming and adopt soil and water conservation measures. Similar quotes are received from the farmers of Bangladesh and other parts of the world on the merits of the AAS service in respect of sowing/transplanting, application of irrigation, fertilizers, pesticides, and harvesting of crops [22,23,24]. There is a peculiar trend noted among the farmers on shifting cultivation practices from cereals and pulses to plantation crops such as coconut/cocoa/nutmeg in these areas to save themselves from drudgeries of managing the weather vagaries, timely labor shortages and high maintenance costs. Penetration of weather-based crop insurance was not much popular in these areas. Only very few progressive farmers are paying the premium but complained that they are not receiving any payouts when the individual farms face weather-related loss and damage to crops.

3.5. Maize Crop Simulation Modeling Using DSSAT 4.7

Temporal variations in maize productivity were simulated using the DSSAT4.7 model over the Coimbatore district, where the study area falls for the observed period from 1981 to 2017. From the analysis, it was noticed that there is high temporal erraticism in maize productivity in the district, as it ranged between 4915 kg ha−1 in 1987 and 1424 kg ha−1. In the drought year, the average productivity was found to be 3958 kg ha−1. The box and whiskers plot shows that the observed maize productivity at 1st and 3rd quartiles was 1125 and 6438.5 kg ha−1, respectively, and the same for simulated yield, which was 3228 and 4187 kg ha−1, respectively. The maximum yield recorded under the observed condition was 8347 kg ha−1, and the maximum yield under simulated conditions was 4915 kg ha−1. Hence, it is evident that technological advancements and hybrid seeds have the potential to create almost double the quantity of output than normal. The simulated yield showed a slightly decreasing trend, and the observed yield showed a significant increasing trend for the past decade. Through this comparative analysis, how technological advancements can contribute to positive changes in productivity can be seen. The observed data are negatively skewed, as the yield was very low till the years 2005–2006, prior to the introduction of hybrid seeds
Figure 9a, b shows the simulated maize yield and observed maize yield of the Coimbatore district of Tamil Nadu where the PAP basin falls. This area has an observed mean maize yield of 3057.89 kg/ha for the period from 1987–2016. The DSSAT simulated maize yield for the baseline shows a decreasing trend from 1980 to 2017, with a mean yield of 3677 kg/Ha. However, the observed maize yield for the season shows a rising trend from 2005 to 2006 onwards. This could be attributed to the introduction of hybrid variety seeds such as TNAU CO-6. Under irrigated conditions, it gives an average yield rate of 7400 kg/ha and under rainfed conditions 5000 kg/ha. However, it is noteworthy that the climate and weather play a significant role in crop productivity, as there is a drastic yield decline noted in both the observed and simulated yield during drought 2012–2013. Crop yield was reduced to 1424 kg in 2012 and 3677 kg/ha in the simulated and observed yields, respectively. Yield decline was clearly visible during other drought years such as 2002 to 2004 and 2016 as well (Figure 9b). In Figure 9c, it can be seen how maize grain weight is severely impacted under elevated CO2 conditions. The simulated grain weight was found to be 738 kg/ha under control conditions, and under elevated CO2 concentrations of 650 ppm, the grain weight was reduced to 286 kgs. The physiological maturity was attained at 105 days under control conditions, and under elevated CO2 concentrations, early maturity is noted, as days after planting (DAP) was 91 days in the simulation output. During the farmers’ field meetings, they were informed about the likelihood of declining crop productivity in the future due to global warming, a crucial outcome of CSM-based IA.
The negative impact of increased temperature with the drier condition on the growth and yield of maize was reported by many researchers. [13,25,26]. Gowtham et al. [27] also stated that days taken for anthesis in maize may be reduced by 6 days under a 1.5 °C rise in temperature for the Coimbatore region, and days taken to reach maturity may also be reduced by 11 days. Technological and agronomical interventions such as irrigation management and sowing date adaptation can also contribute significantly to improving maize yield. Various other adaptation strategies such as altering the sowing window, supplementing with an extra dose of nitrogenous fertilizer, supplementing irrigation during the tasseling/flowering stage, etc., can sustain yield returns. Local-specific studies are the need of the hour for this. Crop simulation models are constructive tools for making important decisions for future agricultural operations in the context of changing climatic scenarios. It is also reported that the rate of decrease is expected to be higher in many places under RCP 8.5 for CanESM2 (hot/dry scenarios) and CMCC-CM (hot/wet) compared to the RCP4.5 scenario. Forcing the MIROC5 (cool/wet scenario) model with DSSAT showed a deviation in maize productivity by (−) 22 to (+) 31% at different locations [25]. The rise in day and night time temperatures affects crop growth and development with the allocation of assimilates to the reproductive organs, resulting in decreased pod set and seed growth [28,29].
In the advanced nature of research involving impact assessments, in order to examine the interactions between socioeconomic factors such as global population growth, economic development, technological advancement, and climate change, the Shared Socioeconomic Pathways (SSPs) database is used in conjunction with the Representative Concentration Pathways (RCPs) [30]. Bukovsky et al. [31] studied how the LULU changes might affect climate change in North America using SSP scenarios. The state of the climate at the end of the 21st century with and without two urban and agricultural LUC scenarios that follow SSP3 and SSP5 using the Weather Research and Forecasting (WRF) model was forced by one global climate model, the MPI-ESM, under the RCP8.5 scenario. Integration of updated scenarios recommended by IPCC in impact assessments would yield better outcomes [32]. Fei’ et al. [33] gave an extensive literature survey on precision agriculture using IoT data analytics and machine learning. Furthermore, the applications of these technologies in precision agriculture for apple crops in regions such as Kashmir are highlighted. Remote sensing (RS) combined with vegetation indices (VIs) is a promising alternative to support the traditional crop classification and yield estimation method [34]. There are studies reported on disease predictions using the power and capability of computing techniques, including the internet of things, wireless sensor networks, data analytics, and machine learning in agriculture [35].
Early warning, timely weather updates, and tolerant quality seeds can play a significant role in minimizing yield loss and enhancing productivity in the purview of weather aberrations. Maize crop plays a major role in sustaining the livelihood and food security in this area. In the study area, maize is mainly grown as poultry feed, livestock feed, and for food purposes. The maize crop is gaining more attention in the country as a whole. In India, the bulk of its production, approximately 47%, is used as poultry feed. Of the rest of the produce, 13% is used for livestock feed and food purposes each, 12% for industrial purposes, 14% in the starch industry, 7% as processed food, and 6% for export and other purposes (source: https://iimr.icar.gov.in/india-maze-scenario/, (accessed on 22 February 2021).)
Augmenting the resilience of natural or cultural systems such as agriculture is considered a key component of adaptation. A socioecological system can cope with hazardous events or disturbances, responding or reorganizing in ways that maintain its essential function, identity, and structure while also maintaining the capacity for adaptation, learning, and transformation [36]. The key role of early warning in abating crop loss and saving farmers’ livelihood is mentioned in detail by the Agricultural Model Intercomparison and Improvement Program (AgMIP) under its regional integrated assessment protocols [26]. Automatic weather stations play a major role in this context to obtain local-specific weather information. These systems are cheaper to operate and easier to manage than human observers [37,38].
Farm-level weather observations have to be widely expanded for numerous motives: ease of use of new technologies, improved data transmission features, transition from manual to automatic equipment, and early warning for critical climate risk aversion [39,40]. Diffusion of seasonal forecasts and agromet advisories facilitate preparedness and local resilience, as cited in the Prime Minister’s 10-point agenda on disaster risk reduction (DRR). Chattopadhyay and Chandras [41] pointed out that AAS provide a unique kind of input to farmers as advisories that have huge potential to make a tremendous difference to crop production and livelihood by taking advantage of benevolent weather and minimizing the adverse impact of malevolent weather.
Rainfed, as well as irrigated farming, systems were significantly impacted by all meteorological factors, particularly heavy rain and little rain. AAS was a supportive climate-smart measure for the farming communities in the study area, not only during crop harvest but also during land preparation, sowing, and fertilizer application. The authorities can fine-tune their model forecast for greater dependability by qualitatively verifying forecasts using real-time data [42]. For weather forecasts to be more dependable and widely accepted, it is essential to increase the utility and accuracy of rainfall forecasts.
A warmer world in the future may adversely impact the maize productivity in the Tamil Nadu region, which is already reeling under the severe water crisis. District-specific crop simulation model studies are crucial tools for making vital decisions for scaling-up climate-smart operations in the context of shifting climate. Additionally, by using an interdisciplinary approach, regional planners and policy makers can improve on current adaptation decision-making by clearly identifying vulnerable areas with regard to declining crop yields as a result of this study’s methodical approach. This change can be ameliorated by adapting proper strategies and mitigation measures such as adopting drought- and heat-tolerant species, better irrigation water management, and various agronomic managements such as adjusting sowing and harvest dates, mulching, etc. Government support is highly essential for critical infrastructural development and improving and popularizings cultivars among the farmers that can well adapt to future warming are the needs of the hour.
Dwindling water resources make crop production highly vulnerable in dryland areas in the basin. There are various initiatives undertaken under dry land area development programs and National Mission on Sustainable Agriculture. Each state, including Tamil Nadu, has to implement its adaptation strategies committed under the State Action Plan on Climate Change. Transformative or planned adaptation interventions have to be provided to the farmers to have sustainable agriculture production. National agencies such as ICAR, MoEF, CC DBT, DST, and DoA and international agencies such as the Water Research Foundation (WRF), the United Nations Environment Program (UNEP), and GIZ also support adaptation and mitigation actions in agriculture and other sectors [43]. This research supports the small and marginal maize farmers to sustain their crops and livelihood directly and in realizing the state share of achieving the targets committed under its nationally determined contributions (NDCs) indirectly.

4. Conclusions and Way Forward

Being climate- and weather-sensitive, crop production is confronted with increasing vulnerabilities from weather aberrations and a degraded natural resource base. Under this research project, agromet advisories (AAS) were disseminated to around 240 maize farmers in the rainfed and irrigated areas of the Parambikulam–Aliyar Basin. Farmers’ field meetings and awareness programs were conducted during the cropping season with the help of agriculture officers of the Anamalai and Pollachi regions. The anticipated negative impacts on maize yield, a serious outcome derived through CSM, were also intimated to the farmers during the farmers’ meet. It was also informed to them following the weather forecasts, and adopting prioritized actions based on AAS can help farmers to save crops.
As a larger state in South India, Tamil Nadu’s network of automatic weather stations (AWSs) has to be more dense and efficient in its operation. A detailed survey revealed that the study area is not an exception. Therefore, projects such as these help to bridge the gap in dissemination and cater to the timely needs of farmers. Weather-based agroadvisories have supported farmers in a significant way. Real-time weather data enables modelers to predict the future more efficiently, where a significant spatial difference exists with climatic conditions. In the basin, one part is completely forested hills, which are difficult to access and inhospitable; on the other side, multicrops are cultivated under rainfed and irrigated conditions.
Ultimately, this work suggests that ICTs have helped in enhancing the benefits of scientific findings to reach farmers, the key stakeholders, in a more efficient way. It is the researchers’ and ground-level officers’ duty to provide real-time promotion of risk management practices through agroadvisories for resource-poor farmers in the target basin. In the rural areas of Tamil Nadu, small and marginal farmers are constrained by limited human and social assets, modern machinery, value-added infrastructure, and poor access to markets. The efficacy of AAS mainly depends on the accuracy of forecasts and dissemination capacity. Registered farmers benefited from the AAS starting from the commencement of land preparation till the completion of the harvest. The accuracy of forecasts that were released was reviewed in the current chapter. Improving forecast accuracy and reliability would increase public acceptance of weather predictions. In addition to this, a rise in GHG emissions in the atmosphere and the associated warmer world or extremities in the distribution of rainfall under the changing climate may pose adverse impacts on maize productivity in the west Tamil Nadu region, if suitable adaptation interventions are not in place. There may be 14-day variations in days after planting (DAP) to maturity under future warming scenarios, which may also have serious implications on the nutritional quality of the crop. Real-time promotion of risk management strategies is the prime responsibility of researchers and planners. Adopting strategies or solutions to climate-smart agriculture practices must be encouraged at the grassroots level. This type of research helps policymakers to better understand critical concerns and make informed decisions. For example, the decrease in yield can be ameliorated by adapting proper strategies and mitigation measures such as better irrigation water management, adopting drought- and heat-tolerant species, and various agronomic adaptations. The momentum for improving early warning and its applicability to protect crop and farm income must be accelerated through external financial support apart from regular schemes such as GKMS. Despite the increasing number of AWS deployed under the existing schemes, many remote villages are still not covered by surface weather observations in the state. Not only developing but popularizing cultivars that are well adapted to the future warming among farmers is the need of the hour. Some significant points as the way forward are given below.
I.
Early warning systems must be established at the village level to abate weather-based agrarian risks; for this, a denser network of automatic weather stations must be set up.
II.
Agrometeorological research communities must try to focus on the need to establish stronger links to connect science, policy, and farming communities using ICT tools.
III.
The government must take necessary actions for institutional collaborations and promote farmers’ collectives for holistic development.
IV.
The usability of weather forecasts among stakeholders must be enhanced at the village level with timely dissemination with periodic assessments of data.
V.
External funding (both national and international) must be encouraged to accelerate the adaptation momentum to enhance early warning and its usability to secure crop and farm income sustainably.
VI.
Sustainable cultivation practices must be promoted at the village level in order to achieve global targets and align crop production systems to UN Sustainable Development Goals such as climate action, no poverty, zero hunger, etc.

Author Contributions

Conceptualization, P.D.; methodology, P.D.; validation, P.D. and G.D.; formal analysis, P.D., C.P., M.V.; investigation, P.D.; resources, P.D., P.S., K.B., S.K. and R.K.; data curation, P.D. and S.R.; writing—original draft preparation, P.D.; writing—review and editing, P.D.; visualization, P.D.; supervision, V.G.; project administration, V.G., S.R., K.S., N.K.S.; funding acquisition, P.D. All authors have read and agreed to the published version of the manuscript.

Funding

This research was funded by the Department of Science and Technology, KIRAN–WISE Division of Government of India, under the Women Scientist for Societal Benefit Scheme. https://dst.gov.in/sites/default/files/Result%20AAS%20WOS%20-B%202018-19%20%28101%20proposals%29.pdf (accessed on 3 October 2019).

Institutional Review Board Statement

Not applicable

Informed Consent Statement

Not applicable

Data Availability Statement

Not applicable.

Acknowledgments

This research was funded by the Department of Science and Technology, KIRAN–WISE Division of Government of India, under the Women Scientist for Societal Benefit Scheme The first author would like to thank Chhama Awasthi, Scientist C, Department of Science and Technology, Ministry of Science and Technology, for her constant support throughout the three-year project period. The first author would also like to express sincere thanks to Jagannathan R., vice-chancellor, Periyar University, Salem, Tamil Nadu, for his constant support. Extensive support has been provided by the agriculture officers, DoE, and the maize farmers of PAP who voluntarily participated in this study, as well as Karim Raja, AAOs, an extension officer who introduced me to the farmers, and Dhayalan, an ATMA worker from the Anamalai and Pollachi Agriculture offices, who supported the project with farmers’ details.

Conflicts of Interest

The funders had no role in the design of the study; in the collection, analyses, or interpretation of data; in the writing of the manuscript, or in the decision to publish the results.

References

  1. Pörtner, D.C.; Roberts, M.; Tignor, E.S.; Poloczanska, K.; Mintenbeck, A.; Alegría, M.; Craig, S.; Langsdorf, S.; Löschke, V.; Möller, A. (Eds.) IPCC, 2022: Summary for Policymakers. In Climate Change 2022: Impacts, Adaptation, and Vulnerability; Contribution of Working Group II to the Sixth Assessment Report of the Intergovernmental Panel on Climate Change; Cambridge University Press: Cambridge, UK, 2022; In Press. [Google Scholar]
  2. FAO 2015, How to Feed the World in 2050. Available online: https://www.fao.org/fileadmin/templates/wsfs/docs/expert_paper/How_to_Feed_the_World_in_2050.pdf (accessed on 18 April 2018).
  3. Rahman, M.M.; Rahman, M.M.; Momotaz, M. Environmental quality evaluation in Dhaka City Corporation–using satellite imagery. Proc. Inst. Civil. Eng.-Urban Design Plan. 2019, 172, 13–25. [Google Scholar] [CrossRef]
  4. Raj, S.; Paul, S.K.; Chakraborty, A.; Kuttippurath, J. Anthropogenic forcing exacerbating the urban heat islands in India. J. Environ. Manag. 2020, 257, 110006. [Google Scholar] [CrossRef]
  5. Mishra, V.; Bhatia, U.; Tiwari, A.D. Bias-corrected climate projections for South Asia from Coupled Model Intercomparison Project-6. Sci. Data 2020, 7, 338. [Google Scholar] [CrossRef]
  6. Mishra, V.; Mukherjee, S.; Kumar, R.; Stone, D. Heat wave exposure in India in current, 1.5 °C, and 2.0 °C worlds. Environ. Res. Lett. 2017, 12, 124012. [Google Scholar] [CrossRef]
  7. Nathan, K.K. Assessment of Recent Droughts in Tamil Nadu.Drought Network News520 (1994–2001). Paper 57. 1995. 1995. Available online: http://digitalcommons.unl.edu/droughtnetnews/57 (accessed on 4 April 2021).
  8. Mani Murali, R.; Ankita, M.; Amrita, S.; Vethamony, P. Coastal vulnerability assessment of Puducherry coast, India, using the analytical hierarchical process. Nat. Hazards Earth Syst. Sci. 2013, 13, 3291–3311. [Google Scholar] [CrossRef] [Green Version]
  9. IPCC. Climate Change 2014: Impacts, Adaptation, and Vulnerability. In Contribution of Working Group II to the Fifth Assessment Report of the Intergovernmental Panel on Climate Change; Field, C.; Barros, V.; Mach, K.; Mastrandrea, M. (Eds.) Cambridge University Press: Cambridge, UK; New York, NY, USA, 2014. [Google Scholar]
  10. Bendapudi, R.; Kumbhar, N.; Gaikwad, P.; Lobo, C. Agro-Met Services and Farmer Responsiveness to Advisories: Implications for Climate Smart Agriculture. In Handbook of Climate Change Resilience; Earth and Environmental Science E-Book; Filho, W.L., Ed.; Springer Nature: Berlin, Germany, 2019. [Google Scholar] [CrossRef]
  11. Gill, K.K.; Babuta, R. Reliability analysis of Medium Range Weather Forecasts in Central Plain Region of Punjab. Indian J. 2016, 56, 240–360. [Google Scholar]
  12. Basso, B.; Liu, L.; Ritchie, J.T. A comprehensive review of the CERES-Wheat, -Maize and –Rice Models’ Performances. Adv. Agron. 2016, 136, 27–132. [Google Scholar]
  13. Kumar, N.S.; Singh, A.K.; Aggarwal, P.K.; Rao, V.U.M.; Venkateswaru, B. Climate Change and Indian Agriculture Salient Achievements from ICAR Network Project; Indian Agricultural Research Institute publications: New Delhi, India, 2012. [Google Scholar]
  14. Bhuvan. Available online: https://bhuvan-app1.nrsc.gov.in/thematic/thematic/index.php (accessed on 5 August 2022).
  15. IMD, Standard Operating Procedure (SOP) For Agromet Advisory Services. 2020. Available online: https://mausam.imd.gov.in/imd_latest/contents/pdf/gkms_sop.pdf (accessed on 21 May 2020).
  16. Kothiyal, S.; Singh, R.; Nain, A.; Padalia, H.; Chaturvedi, G. Verification of Medium Range Weather Forecast for Udham Singh Nagar Region in order to Improve Methodology Followed. Int. J. Curr. Microbiol. Appl. Sci. 2017, 6, 1995–2005. [Google Scholar] [CrossRef]
  17. Rathore, L.S.; Parvinder, M. 2008: Economic Impact Assessment of AgroMeteorological Advisory Service of NCMRWF; Report no. NMRF/PR/01/2008; NCMRWF, Ministry of Earth Sciences, Government of India: Noida, India, 2008; 104p. [Google Scholar]
  18. Hoogenboom, G.; Jones, J.W.; Wilkens, P.W.; Porter, C.H.; Boote, K.J.; Hunt, L.A.; Singh, U.; Lizaso, J.L.; White, J.W.; Uryasev, O.; et al. Decision Support System Foragrotechnology Transfer (DSSAT) Version 4.5 [CD-ROM]; University of Hawaii: Honolulu, HI, USA, 2010. [Google Scholar]
  19. Jones, P.G.; Thornton, P.K. The potential impacts of climate change on maize production in Africa and Latin America in 2055. Glob. Environ. Chang. 2003, 13, 51–59. [Google Scholar] [CrossRef]
  20. Jones, C.A.; Kiniry, J.R. CERES-Maize: A Simulation Model of Maize Growth and Development; Texas A&M University Press: College Station, TX, USA, 1986. [Google Scholar]
  21. Bassu, S.; Brisson, N.; Durand, J.-L.; Boote, K.; Lizaso, J.; Jones, J.W.; Rosenzweig, C.; Ruane, A.C.; Adam, M.; Baron, C.; et al. How do various maize crop models vary in their responses to climate change factors? Glob. Chang. Biol. 2014, 20, 2301–2320. [Google Scholar] [CrossRef] [Green Version]
  22. Rahman, N.; Rahman, M.; Baten, M.; Hossain, M.; Hassan, S.; Ahmed, R.; Hossain, A.; Aziz, M.; Haque, M.; Halder, T.; et al. Weather Forecast Based Rice Advisory Services in Bangladesh. Bangladesh Rice J. 2021, 25, 51–74. [Google Scholar] [CrossRef]
  23. Talaviya, T.; Shah, D.; Patel, N.; Yagnik, H.; Shah, M. Implementation of artificial intelligence in agriculture for optimisation of irrigation and application of pesticides and herbicides. Artif. Intell. Agric. 2020, 4, 58–73. [Google Scholar] [CrossRef]
  24. Riahi, K.; Van Vuuren, D.P.; Kriegler, E.; Edmonds, J.; O’neill, B.C.; Fujimori, S.; Bauer, N.; Calvin, K.; Dellink, R.; Fricko, O.; et al. The shared socioeconomic pathways and their energy, land use, and greenhouse gas emissions implications: An overview. Glob. Environ. Chang.: Hum. Policy Dimens. 2017, 42, 153–168. [Google Scholar] [CrossRef] [Green Version]
  25. McDermid, S.; Gowtham, R.; Bhuvaneswari, K.; Vellingiri, G. The impacts of climate change on Tamil Nadu rainfed maize production: A multi-model approach to identify sensitivities and uncertainties. Curr. Sci. 2016, 110, 1257–1271. [Google Scholar]
  26. Rosenzweig, C.; Hillel, D. Handbook of Climate Change and Agroecosystems: The Agricultural Model Intercomparison and Improvement Project (AgMIP) Integrated Crop and Economic Assessments—Joint Publication with American Society of Agronomy, Crop Science Society of America, and Soil Science Society of America; Imperial College Press: London, UK, 2015. [Google Scholar] [CrossRef]
  27. Gowtham, R.; Bhuvaneshwari, K.; Senthil, A.; Dhasarathan, M.; Revi, A.; Bazaz, A. Impact Of Global Warming (1. 5 °C) On The Productivity Of Selected C3 And C4 Crops Across Tamil Nadu. J. Agrometeorol. 2020, 22, 7–17. [Google Scholar]
  28. Hasanuzzaman, M.; Nahar, K.; Fujita, M. Extreme Temperatures, Oxidative Stress and Antioxidant Defense in Plants. In Abiotic Stress ÐPlant Responses and Applications in Agriculture; Vahdati, K., Leslie, C., Eds.; In Tech.: Rijeka, Croatia, 2013; pp. 169–205. [Google Scholar]
  29. Prasad, P.V.V.; Staggenborg, S.A.; Ristic, Z. Impact of drought and heat stress on physiological, growth and yield processes. In Modeling Water Stress Effects on Plant Growth Processes; Ahuja, L.H., Saseendran, S.A., Eds.; ASA—CSSA: Madison, WI, USA. Adv. Agric. Syst. Model. 2009, 1, 301–355. [Google Scholar]
  30. Ren, X.; Weitzel, M.; O’Neill, B.C.; Lawrence, P.; Meiyappan, P.; Levis, S.; Balistreri, E.; Dalton, M. Avoided economic impacts of climate change on agriculture: Integrating a land surface model (CLM) with a global economic model (iPETS). Clim. Chang. 2018, 146, 517–531. [Google Scholar] [CrossRef] [Green Version]
  31. Bukovsky, M.S.; Gao, J.; Mearns, L.O.; O’Neill, B.C. SSP-based land-use change scenarios: A critical uncertainty in future regional climate change projections. Earth’s Future 2021, 9, e2020EF001782. [Google Scholar] [CrossRef]
  32. WMO. 2010. Final report. World Meteorological Organization—Commission For Basic Systems -Opag On Integrated Observing Systems. In Proceedings of the Expert Team on Requirements for Data from Automatic Weather Stations, Sixth Session, Geneva, Switzerland, 22–25 June 2010. [Google Scholar]
  33. Fei, S.; Hassan, M.A.; Xiao, Y.; Su, X.; Chen, Z.; Cheng, Q.; Duan, F.; Chen, R.; Ma, Y. UAV-based multi-sensor data fusion and machine learning algorithm for yield prediction in wheat. Precis. Agric. 2022, 2022, 1–26. [Google Scholar] [CrossRef]
  34. De Oliveira Maia, F.C.; Bufon, V.B.; Leão, T.P. Vegetation indices as a Tool for Mapping Sugarcane Management Zones. Precis. Agric. 2022, 2022, 1–22. [Google Scholar] [CrossRef]
  35. Akhter, R.; Sofi, S.A. Precision agriculture using IoT data analytics and machine learning. J. King Saud Univ.-Comput. Inf. Sci. 2021, 1319–1578. [Google Scholar] [CrossRef]
  36. Shanko, D. Use of Automatic Weather Stations in Ethiopia; National Meteorological Agency (NMA) Report: Addis Ababa, Ethiopia, 2015. [Google Scholar]
  37. Naik, P.S.; Singh, M.; Ranjan, J.K. Impact of Climate Change on Vegetable Production and Adaptation Measures. In Abiotic Stress Management for Resilient Agriculture; Minhas, P., Rane, J., Pasala, R., Eds.; Springer: Singapore, 2017. [Google Scholar] [CrossRef]
  38. Venkateswarlu, B.; Shanker, A.K. Dryland agriculture bringing resilience to crop production under changing climate. In Crop Stress and Its Management: Perspectives and Strategies; Springer: Dordrecht, The Netherlands, 2012; Springer: Dordrecht, The Netherlands, 2012; pp. 19–44. [Google Scholar]
  39. Patel, N.R.; Yadav, K. Monitoring of spatio-temporal pattern of drought stress by use of integrated drought index over Bundelkhand region, India. Nat. Hazard 2015, 77, 663–677. [Google Scholar] [CrossRef]
  40. Seneviratne, S.I.X.; Zhang, M.; Adnan, W.; Badi, C.; Dereczynski, A.; Di Luca, S.; Ghosh, I.; Iskandar, J.; Kossin, S.; Lewis, F.; et al. Weather and Climate Extreme Events in a Changing Climate. In Climate Change 2021: The Physical Science Basis. Contribution of Working Group I to the Sixth Assessment Report of the Intergovernmental Panel on Climate Change; Masson-Delmotte, V.P., Zhai, A., Pirani, S.L., Connors, C., Péan, S., Berger, N., Caud, Y., Chen, L., Goldfarb, M.I., Gomis, M., Eds.; Cambridge University Press: Cambridge, UK; New York, NY, USA, 2021; pp. 1513–1766. [Google Scholar] [CrossRef]
  41. Chattopadhyay, N.; Chandras, S. Agrometeorological advisory services for sustainable development in Indian agriculture. Biodivers. Int. J. 2018, 2, 13–18. [Google Scholar] [CrossRef]
  42. Rathore, L.S.; Singh, K.K.; Gupta, A. National Centre for Medium-Range Weather Forecasting: Activities, current status and plans. In Proceedings of the National Seminar on Agrometeorology in the New Millennium: Prospectives and Challenges, PAU Ludhiana, India, 20–31, October 2003; pp. 141–147. [Google Scholar]
  43. Belle, A. 2019. Bangladeshi farmers reap the benefit of new weather forecasts. A report of the end poverty in south Asia, World Bank. Available online: https://blogs.worldbank.org/endpovertyinsouthAsia/Bangladeshi-farmers-reap-benefits-newweather-forecasts (accessed on 27 July 2020).
Figure 1. Ways to achieve sustainable agriculture production (author formulated).
Agriengineering 04 00065 g001
Figure 2. Maize production statistics in India from 1971 to 2020. (Source: DoES,TN).
Agriengineering 04 00065 g002
Figure 3. (a,b) Trends in the maize area and yield in the study area, respectively.
Agriengineering 04 00065 g003aAgriengineering 04 00065 g003b
Figure 4. Location map of the Parambikulam–Aliyar Basin.
Agriengineering 04 00065 g004
Figure 5. Land-use land cover (LULC) map of the study area (Source: [14]). Red dot represents the location of the automatic weather station fixed at the farmers’ field.
Agriengineering 04 00065 g005
Figure 6. (a) Observed-AWS vs. Forecasted TMax by IMD; (b) Observed RH by AWS vs. Forecasted RH by IMD; (c) correlogram of observed vs. forecasted variables. Correlogram of observed vs. forecasted weather, during Rabi, 2021–2022.
Agriengineering 04 00065 g006aAgriengineering 04 00065 g006b
Figure 7. Photos taken in the pest infestation fields.
Agriengineering 04 00065 g007
Figure 8. (a) Photos of the field survey with farmers (b). Field photos of the automatic weather station, rain gauge, and soil moisture sensor.
Agriengineering 04 00065 g008
Figure 9. (a) Trends in simulated yield; (b) box and whiskers plot of observed vs. simulated maize yield in Coimbatore from 1987 to 2016, respectively (Source: Seasonal Crop Report- DoES, Tamil Nadu); (c) simulated maize grain weight under elevated CO2 concentration for the study area.
Agriengineering 04 00065 g009aAgriengineering 04 00065 g009b
Table 1. Disaster profile of the state that impacted agriculture for the past 20 years.
Year Events
2001Mild Drought
2002Mild Drought
2003Moderate Drought
2004Moderate Drought
2005Excess Rain
2008Cyclone Nisha-Rain
2010Moderately Wet
2011Heavy Rain due to Thane Cyclone
2012Heavy Rain due to Nilam Cyclone
2014Drought
2015Excess Rain
2016Drought/Vardah cyclone
2018Gaja Cyclone Excess Rain
2019Fani and Bulbul Cyclone Excess Rain
2020Amphan and Nisarga
2021Tauktae and Nivar
2022Asani Brought Good Rain
Table 2. Skill score for rainfall for maize-growing season, 2021–2022.
SkillsScores
Accuracy Ratio0.77
Bias Score1.44
Probability Of Detection (Hit Rate)0.91
False Alarm Ratio0.37
Probability Of False Detection (False Alarm Rate)0.30
Threat Score (Critical Success Index)0.59
Heidke Skill Score0.55
Equitable Threat Score (Gilbert Skill Score)0.38
Hanssen and Kuipers Discriminant 0.60
Odds Ratio22.86
RMSE10.90
Correlation Coefficient (R2)0.21
Table 3. Excerpts from the farmers’ survey are given below.
Sl. No. Comments by the FarmersTimeline
1“We came to know through SMS that there won’t be rains hence critical irrigation was given once a week, otherwise the maize crops in the vegetative phase would not have survived during margazhi pattam” January 2022
2In the early samba * season, crops were saved by preponing the harvests of maize crops one week before because the rainfall forecast for the next five days received from the project showed “No Rainfall”. This was repeatedly mentioned by the farmers during the farmers’ meet organized by Agroclimatic Research Center, Tamil Nadu Agriculture University, Coimbatore, during November 2021 at AnamalaiNovember 2021
3“We have undertaken the sowing of maize and sorghum only after receiving the rainfall forecast, otherwise, seed loss might have incurred due to heavy precipitation events during September and November”. September and November 2021
4“This time we are happy that we are receiving weekly weather information/updates at our fingertips; hence, we can plan our farm operations like spraying, fertilization and irrigation properlyOctober and November 2021
5“Almost all the AAS you have disseminated has the correct weather forecast for the Anamalai region and extension officers, officers of ATMA are also visiting us more often after the launch of this project December-January 2021–2022
6“During land preparations and sowing, it was difficult to work in the field for long hours due to severe temperature”September 2021
7It was informed by most of the farmers and extension officers that they received the rainfall forecast well in advance from the Department of Agriculture Extension (DAE), and the forecast was very accurate, and they could use the same ultimately for weather-based farm operation successfully.
6“We are receiving timely Puyal (cyclone) information correctly for the past two years”November 2021
7“We came to know about the crop boosters like TNAU-Maize Maxim through SMS/Multi-purpose traps like pheromone traps for crop protection and growth through AAS.”October and December 2021
* Samba in local language Tamil is Rabi season.
Table 4. Degree of effectiveness of agromet advisories and weather forecast.
Degree of Effectiveness of Agromet Advisories and Weather Forecast
Sl. No.ResponsesEarly Phase of the Project (%)Mid Phase of the Project (%)End Phase of the Project (%)
1Very Effective13.52129
2Effective19.53648
3Not Effective21.9146
4Don’t Know 45.12917
Total 100*100*100*
* N = 82.
Table 5. Adaptation measures adopted by the maize farmers.
Measures Initiated by (No.)
Adaptation OptionsAAS * Farmers (n = 82) Control Farmers (n = 56)
1Changing the timing of sowing 3812
2Shifting to plantation crops such as coconut/cocoa/nutmeg627
3Shifting to short-duration varieties such as cowpea, sesame, red gram, etc.918
4Changing the timing of fertilizer operation 253
5Changing the timing of harvest 313
6Shifting to other jobs coir pith/Kozhi pannai (poultry farm)/livestock farm213
7Organic amendments in farming 3422
8Water harvesting and conservation measures such as pond renovation and mulching1711
* Figures are in percentage to total; AAS, agromet advisory services.
Publisher’s Note: MDPI stays neutral with regard to jurisdictional claims in published maps and institutional affiliations.

