Abstract
In the present study, wheatgrass (Triticum aestivum L.) was chosen since fish effluents could be adequate to support its optimal growth. Wheatgrass was irrigated by water from African catfish (Clarias gariepinus) production under two stocking densities, namely extensive aquaculture unit (EAU) and intensive aquaculture unit (IAU), and tap water mixed with fertilizer (Control) in combination with three horticultural substrates: 100% coconut fibers (C), 70% coconut fibers + 30% perlite (CP), and 50% perlite + 50% vermiculite (PV) in an ebb-and-flow system. Different plant growth parameters, including nutrient contents, were evaluated and discussed. The results showed that regarding irrigation water, shoot dry mass was significantly higher in fish water groups. The root–shoot ratio was significantly higher in Control. The highest SPAD index was discovered in IAU. Regarding substrates, the root–shoot ratio was significantly low in C. Vitamin and mineral production reached mainly the highest concentrations in the combination of fish water with different substrates. In conclusion, irrigation water from IAU and coconut fibers were sufficient for optimal wheatgrass growth; meanwhile, IAU effluents showed a positive influence on vitamin production. Our study demonstrates the potential of aquaponics as a more sustainable way of producing superfoods.
Keywords:
vitamins; plant nutrients; plant growth; coconut fibers; perlite; vermiculite; ebb-and-flow system 1. Introduction
Aquaponics consists of an aquaculture unit and a hydroponics unit. The culture water from the fish-rearing tanks flows to the hydroponics part. Plants in hydroponics utilize the nutrients (>50%) from the waste of feed and fish excretion to sustain their optimal growth [1]. Aquaponics has several advantages; one of them is that beneficial microbes living inside the system have a positive influence on plant growth [2,3]. For example, nitrifying bacteria convert ammonium into nitrate, a more accessible form of nitrogen nutrient for plants. Various bacteria also could produce vitamins that can be absorbed by plants to protect them from diseases and pests [4]. Because of the recycling use of the nutrients in aquaculture effluents instead of discharging them into the environment, aquaponics has less impact on the environment (e.g., increasing nitrogen and phosphorus concentrations in the natural waters) than some traditional aquacultures. Hence, it is a more sustainable way of producing food.
Various plant species have been tested in aquaponics. However, aquaculture effluents cannot guarantee optimal growth for some plants without additional inorganic fertilizer because they have been reported to be deficient in certain nutrients [5]. The production of mineral-originated fertilizers depletes natural resources and increases greenhouse gas emissions. To achieve totally sustainable and organic production in aquaponics, we tested wheatgrass because it is a seedling of wheat and it does not require a high amount of nutrients, which means fish effluents could sustain its optimal growth. Furthermore, some studies demonstrated that plants in aquaponics reached higher amounts of certain nutrients than those in hydroponics [6,7]. In addition, organic fertilizers such as manure and sewage sludge can increase the amount of vitamin B12 in some plants [8]. So, aquaponically produced wheatgrass is assumed to have higher amounts of certain nutrients compared to hydroponically produced wheatgrass. Additionally, substrates are used in aquaponics because they provide space for beneficial microbes to live in and can act as a filter for solid waste from fish effluents. Moreover, they influence plant growth.
Wheat (Triticum aestivum L.) is a member of the Poaceae family, which includes the oldest agricultural crops for human and animal feed, with a history of about 10,000 years [9]. The juice of wheatgrass is an innovative trend in human consumption and was named a “superfood” due to its high amount of chlorophyll, essential minerals, vitamins, enzymes, and amino acids [10]. Fresh wheatgrass has been demonstrated to have medical effects on cancer [11] and other diseases, such as hemoglobin deficiency and some chronic disorders [12]. Improving the quality of wheatgrass can not only benefit the consumers but can also provide vegan and vegetarian consumers with a valuable nutrient source mainly due to its vitamin B12 content. Additionally, in terms of its environmental function, wheatgrass can be utilized as an extractive species to remove nutrients from the fish effluents before they are discharged into natural waters [13]. Light, nutrients in the irrigation water, type of growth media, and fertilization can influence the quality of wheatgrass. Wheatgrass, when irrigated with water composed of different elements can improve plant minerals and macromolecular contents via nutrient biosynthesis caused by environmental growth factors [14]. Wheatgrass was added with various dosages of seaweed fertilizer in hydroponics [15] and cultured in hydroponic liquid fertilizer with additional rock phosphates as a P source [16].
Substrates that have organic or volcanic origins can release nutrients to support plant growth and be beneficial to wheatgrass production [16,17]. Additionally, they not only are the place where different microbes live and grow, but also enable biochemical reactions such as nitrification. Furthermore, organic matter is turned into inorganic nutrients available for plants [18]. However, the challenge is to determine which substrate or medium can improve the plants’ nutrient quality and growth performance. The cultivation of wheatgrass for superfood production in aquaponics is a new field. In contrast, different substrates have been tested for other herbs and fruiting crops in hydroponics and aquaponics [19,20,21,22,23,24,25]. Perlite and cocopeat substrates were appropriate for strawberry (Fragaria × ananassa) cultivation in combination with carps (Cyprinus carpio, Ctenopharyngodon idella, Hypophthalmichthys molitrix) [19]. Zeolite and perlite were found optimal for strawberry growth in hydroponics [20]. Coconut fibers, perlite, and vermiculite were tested with various vegetables inside a vertical wall [22]. Vermiculite was used with lettuce (Lactuca sativa) in an aquaponic system with tilapia and a genetically improved farmed tilapia (GIFT) strain [23]. It has also been tested with different cultivars such as parsley (Petroselinum crispum), lettuce, and minutina (Plantago coronopus) [24]. Cucumber (Cucumis sativus) showed good growth performances with perlite in tilapia (Oreochromis niloticus) aquaponics [25].
African catfish (Clarias gariepinus) is cultured due to its high growth rate, disease resistance, and amenability to high-density culture, related to its air-breathing ability [26,27,28,29,30,31]. Additionally, this fish can be sold at a good price alive on the market in some countries [32]. Many studies on the co-cultivation of African catfish with various cultivars and vegetables have been carried out with satisfactory production yields [33,34,35,36,37].
The objective of the present study was to test, for the first time, the growth performance of wheatgrass (Triticum aestivum L.) in aquaponics with African catfish (Clarias gariepinus) under two different stocking densities. Three different irrigation water and horticultural substrates (coconut fibers 100%, coconut fibers 70% + perlite 30%, and perlite 50% + vermiculite 50%) were used to find the best combination for optimal wheatgrass growth. A wide range of plant parameters, including vitamin content, were evaluated and discussed for wheatgrass growth performance.
2. Materials and Methods
2.1. Experimental Design
This study was conducted from 30 October 2019 to 19 November 2019 (19 days) in the hydroponics cabin 1.04 in the FishGlassHouse (FGH) of the University of Rostock, Aquaculture and Sea-Ranching, Mecklenburg-Western Pomerania (Germany, 54.0924° N, 12.0991° E). Wheatgrass (T. aestivum) was cultivated with aquaculture effluents from African catfish (C. gariepinus) production in a semi-coupled aquaponic system. The three experimental groups were: (i) water from extensive aquaculture unit (EAU), (ii) water from intensive aquaculture unit (IAU), and (iii) tap water with fertilizer (Control). Three different pot substrates were used: (1) coconut fibers (100%) (C), (2) coconut fibers (70%) + perlite (30%) (CP), and (3) perlite (50%) + vermiculite (50%) (PV). Fish effluents from IAU and EAU were pumped to corresponding transfer tanks and then to the nutrient tanks in cabin 1.04. From there, water was pumped to the ebb-and-flow plant tables, and after irrigating the plants, it was collected in the sumps. Water in the sump tanks was finally pumped back to the nutrient tanks (Figure 1).
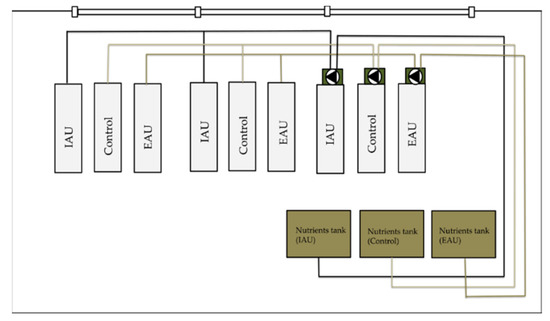
Figure 1.
Scheme of the hydroponic cabin 1.04. Bright grey rectangles represent plant tables, green rectangles represent sump tanks, and brown rectangles represent nutrient tanks. Black triangles represent pumps; “Control”, control groups, “IAU”, groups of intensive aquaculture unit, “EAU”, groups of extensive aquaculture unit.
2.2. Fish Production
African catfish was produced in two recirculation aquaculture systems (RASs) under different stocking densities from 26 October 2019 to 19 November 2019 (25 days) and originated from a local fish hatchery (Fischzucht Abtshagen GmbH & Co. KG, Wittenhagen, Germany). Three fish were randomly selected from each tank to measure their weight and length at the beginning and the end of the experiment. Additionally, fish number and total biomass per tank were measured. In EAU, 35 fish per tank, and in IAU, 140 fish per tank were stocked, each under staggered production. African catfish with three different initial weights and lengths (fish weight class I—small: 589.44 ± 54.2 g, 43.62 ± 1.20 cm; fish weight class II—medium: 887.67 ± 53.15 g, 49.09 ± 0.80 cm; fish weight class III—large: 1057.75 ± 178.38 g, 51.56 ± 3.39 cm) were kept in IAU, and fish with different initial weights and lengths (fish weight class I—small: 656.56 ± 125.01 g, 44.91 ± 1.77 cm; fish weight class II—medium: 1062.00 ± 66.84 g, 52.20 ± 0.64 cm; fish weight class III—large: 1129.89 ± 125.14 g, 54.13 ± 1.32 cm) were stocked in EAU. Fish were fed with commercial pelleted feed (“Alltech Coppens” Special Pro EF 4.5 mm, Helmond, The Netherlands) with 42% crude protein (lipid: 13%, fiber: 1.5%, ash: 7.5%, P: 1.08%, Ca: 1.7%, Na: 0.3%) four times per day, 1.16% feed per day/biomass in the IAU and 1.04% feed per day/biomass in EAU.
2.3. Plant Production
Seeds of winter wheat (T. aestivum) were bought from a local seed supplier (Biolandhof Knauf Warenvertrieb GbR, Bad Rodach, Germany) and germinated on 28 October 2019. After the seeds developed radicles, they were transplanted into the pots on the ebb-and-flood tables on 30 October 2019. The average period of daily illumination is 9 h 27 m 57 s in November in Northern Germany. Each small pot (11 pots in total) (size: 5 × 5 × 6 cm, 0.12 L) contained three germinated seeds, which were used for analyzing plant growth performance indices including total fresh biomass, root and shoot fresh and dry mass, and root and shoot length. The SPAD index was measured by using a portable device (SPAD-502 Plus, Konica Minolta, Tokyo, Japan). The SPAD readings are an indirect measurement of leaf chlorophyll concentrations [38]. The large pots (20 pots in total) (Ø = 13 cm, H: 11.6 cm, 1 L) contained 10–15 evenly spread seeds and were used for laboratory nutrient analyses of parameters such as vitamin and macro- and micronutrient contents. The small pots were positioned on the front table (F), while the large pots were positioned on the rear table (R) (Figure 2).
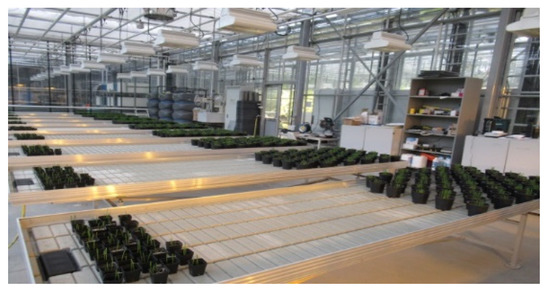
Figure 2.
Hydroponics section of the FishGlassHouse with a view of T. aestivum on ebb-and-flood tables in cabin 1.04 at the beginning of the experiment.
Wheatgrass was cultured in three independent experimental ebb-and-flood systems in triplicates. Each system consisted of three plant tables (3.05 × 1.01 m/table, slope: 1.68 ± 0.89%, OTTE Metallbau GmbH & Co. KG, Barßel, Germany), a nutrient tank (“Rotex Variocistern”, 1000 L, ROTEX Heating Systems GmbH, Guglingen, Germany), and a sump (49 × 79 × 41 cm) (Figure 1 and Figure 2).
On each table, plant pots were divided into three different substrate groups and randomly placed. The nutrient tanks were filled with fish effluents from the intensive and extensive aquaculture units of the African catfish production, while the control tank contained a mixture of commercial fertilizer (Universol Basis, N: 4%, P: 19%, K: 35%, Mg: 4.1%, Fe: 0.12%, ICL, Israel) and local tap water. An automated irrigation system (“BEWAMAT-CA 6”, Ando Technik, Hamburg, Germany) was used to flood the tables with nutrient-enriched water for 4 mins four times daily. At the end of the experiment, roots and shoots of wheatgrass were separately dried in an oven (UF750 plus, Memmert GmbH & Co. KG, Schwabach, Germany) at 60 °C for eight hours per day for three days. The wheatgrass harvested from the large pots was stored in sealed cans, and the analyses of gross nutrients (protein, lipid, fibers, NfE, and ash) and some vitamins (vitamin B6, vitamin B7, vitamin B12, and vitamin E) were conducted by an external laboratory (SGS Germany GmbH, Hamburg, Germany). The analyses of Cu, Fe, Zn, Mn, N, P, K, C, S, Mg, and Ca were undertaken by the laboratory of the University of Rostock, Department of Plant Science. The samples were classified as Control*C, IAU*C, EAU*C, Control*CP, IAU*CP, EAU*CP, Control*PV, IAU*PV, and EAU*PV.
The coconut fibers “Coco-Mix” by Biobizz (Biobizz Worldwide SL, Bizkaia, Spain) with a pH value of 6.2 contained the following initial nutrient contents: nitrogen 126 mg/L, phosphate 18 mg/L, and potassium 324 mg/L. The perlite substrate was pH-neutral and had a grain size of 2–6 mm (Knauf Aquapanel, Iserlohn, Germany). The vermiculite was also pH-neutral and had a 1–2 mm grain size (Stephan’s Kleiner Palmen-Laden, Niederndodeleben, Germany, Figure 3).
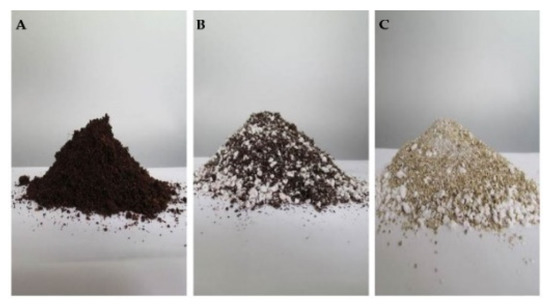
Figure 3.
Substrates: (A) coconut fibers (100%, C); (B) coconut fibers (70%) + perlite (30%) (CP); (C) perlite (50%) + vermiculite (50%) (PV).
2.4. Water Quality and Light Parameters
Physical water parameters, including dissolved oxygen (DO), temperature, pH, conductivity, and redox potential, were measured daily at about 10:00 a.m. by using a multi-parameter probe (“HACH” HQ40d portable meter, Hach Lange GmbH, Düsseldorf, Germany). Automatic pH controllers (Bluelab Corporation Limited, Tauranga, New Zealand) were used to stabilize the pH value to its optimal level of 6.5 for the growth of wheatgrass. Water samples were collected twice a week in the three nutrient tanks. The chemical water parameters such as ammonium (NH4−), nitrite (NO2−), nitrate (NO3−), orthophosphate phosphorus (PO43−), sulfate (SO42−), calcium (Ca2+), iron (Fe2+), potassium (K+), and magnesium (Mg2+) were analyzed using an auto-analyzer (Gallery Automated Photometric Analyzer Thermo Fisher Scientific, Waltham, MA, USA). Light condition parameters such as photosynthetic photon flux density (PPFD) were measured using the quantum light meter (type: 3415FSE, “Spectrum Technologies”, Aurora, IL, USA), and light intensity was measured using a lux meter (type: LM-200, “Eurolite”, Langenau, Germany).
2.5. Mathematical and Statistical Analysis
Fish growth performance was calculated by feed conversion ratio (FCR, 1) and specific growth rate (SGR, 2) as follows:
where: .
Data were presented as means and standard deviation (SD) by using Excel 2010 (Microsoft, Redmond, WA, USA). Normality and homogeneity of means were evaluated by the Shapiro–Wilk test and Levene’s test. For normally distributed and homogeneous data, t-test was used for the difference in the fish growth parameters. For non-normally distributed and inhomogeneous data, Mann–Whitney U test was used. Differences between means were considered significant at α = 0.05. Statistical analyses were performed by using SPSS 25 (IBM, Armonk, NY, USA). The present study included two factors, namely three different irrigation water and three different substrates. The Scheirer–Ray–Hare test was conducted to identify the effect of an individual factor or interaction of both factors by using R programming (R Studio, Boston, MA, USA). For the wheatgrass growth parameters such as total fresh biomass, root length, total length, root and shoot dry mass, root–shoot ratio, SPAD index, and mortality, which had non-interaction of irrigation and substrates, a post hoc Dunn–Bonferroni test was used in SPSS. For the data such as shoot and root fresh mass and shoot length with statistically significant differences, combination effects of both factors were considered. These parameters were checked under the condition of factor 1*factor 2 (e.g., Control*C, IAU*C, EAU*C, Control*CP, IAU*CP, EAU*CP, Control*PV, IAU*PV, and EAU*PV) with Kruskal–Wallis test and pairwise Wilcoxon test in R Studio.
3. Results
3.1. Fish Production
Fish Growth
According to Table 1, both fish units had comparable initial lengths and weights, final lengths and weights, and specific growth rates (SGRs). The feed conversion ratio (FCR) was significantly better in the IAU (0.66 ± 0.06). Significantly higher initial and final biomasses were found in the IAU due to the higher stocking density.

Table 1.
Growth performance of African catfish (C. gariepinus) under different stocking densities (intensive aquaculture unit (IAU) and extensive aquaculture unit (EAU)) in a semi-coupled aquaponic system with wheatgrass (T. aestivum) cultivation (mean ± SD, n = 2).
3.2. Plant Growth
3.2.1. Physical Water Quality Parameters
Physical water quality parameters in the two aquaculture units (IAU and EAU) are given in Table 2. All measured parameters were significantly different.
Table 2.
Physical water quality parameters from intensive aquaculture unit (IAU) and extensive aquaculture unit (EAU) (mean ± SD, n = 2).
Physical water quality parameters in the three nutrient tanks in cabin 1.04 are given in Table 3. None of the measured parameters were significantly different, except the EC level. The highest EC level was observed in the control, followed by IAU and EAU.
Table 3.
Physical water quality parameters of nutrient tanks with water from fertilized tap water (Control) and fish effluents from intensive aquaculture unit (IAU) and extensive aquaculture unit (EAU); light condition parameters were measured in two positions (Pos.): “R”: rear table; “F”: front table (mean ± SD, n = 3).
3.2.2. Chemical Water Quality Parameters
Chemical water quality parameters are given in Table 4. Besides the NO2 concentration, all other parameters showed significant differences. For the elements K, Mg, PO4, and SO4, the concentrations in the control were significantly higher compared with the IAU and EAU. Ca and NO3 had the highest values in the IAU. The concentrations of NO3 were comparable in the control and EAU, and the concentrations of NO3 was approximately 2.2 times higher in the IAU compared with the other two groups.
Table 4.
Chemical water quality parameters of nutrient tanks with water from fertilized tap water (Control) and fish effluents from the intensive aquaculture unit (IAU) and extensive aquaculture unit (EAU) (mean ± SD, n = 3).
3.2.3. Plant Growth Performance (Irrigation Water Groups)
Wheat seeds with developed radicles had an initial weight of 0.079 ± 0.013 g, a length of 0.059 ± 0.060 cm, and a radicle length of 0.067 ± 0.140 cm before transplantation into pots. Total fresh biomass did not differ significantly among the three irrigation water groups. Shoot dry mass was significantly higher in both fish water groups. Root length and root–shoot ratio were significantly higher in the control. Root dry mass showed no significant difference between groups. The SPAD index had the highest values in the IAU, and there was no significant difference between the control and EAU (Table 5).
Table 5.
Wheatgrass growth performance in the three different water irrigation groups without shoot and root fresh mass and shoot length, “Control”—fertilized tap water; “IAU”—fish effluents from intensive aquaculture unit; “EAU”—fish effluents from extensive aquaculture unit (mean ± SD, n = 3).
3.2.4. Plant Growth Performance (Substrate Groups)
As indicated in Table 6, total fresh biomass and shoot dry mass of wheatgrass among the three substrate groups were not significantly different. Root dry mass was significantly higher in PV and not significantly different from CP. Root length had the greatest value in C, followed by CP then PV. The root–shoot ratio had the lowest value in C substrates. The highest SPAD index was obtained in PV and was not significantly different from that obtained in CP. The least plant mortality was in PV as well.
Table 6.
Wheatgrass growth indicators in the three different substrate groups without shoot and root fresh mass and shoot length, “C”—100% coconut fibers; “CP”—70% coconut fibers + 30% perlite; “PV”—50% vermiculite + 50% perlite (mean ± SD, n = 3).
3.2.5. Plant Growth Parameters Influenced by Interaction of Irrigation Water and Substrates
Regarding shoot fresh mass, wheatgrass cultivated in PV and irrigated by EAU water (EAU*PV) had the significantly highest value. The lowest shoot length was obtained in the combination of control and PV (Control*PV) (Table 7).
Table 7.
Shoot fresh mass, shoot length, and root fresh mass of wheatgrass in different experimental groups, “Control”—fertilized tap water; “IAU”—fish effluents from intensive aquaculture unit; “EAU”—fish effluents from extensive aquaculture unit; “C”—100% coconut fibers; “CP”—70% coconut fibers + 30% perlite; “PV”—50% vermiculite + 50% perlite (mean ± SD, n = 3).
According to Table 8 and Table 9, gross nutrient and mineral contents of wheatgrass showed variations in different irrigation water and substrates. The nutrient contents might have been influenced not only by the irrigation water or substrates, but also by an interaction between both. Some nutrients showed a dominating effect exerted by irrigation water; for example, the calcium level in wheatgrass had the same tendency as in the irrigation water. Certain nutrients such as protein (IAU*PV: 3.34%), fiber (EAU*PV: 2.10%), nitrogen (IAU*CP: 5.906%), phosphorus (EAU*C: 18.260 mg/g), carbon (EAU*CP: 34.300%), magnesium (EAU*CP: 5.080 mg/g), zinc (IAU*CP: 0.080 mg/g), and calcium (IAU*CP: 6.590 mg/g) reached the highest amounts in wheatgrass in the fish units. As for substrates, the highest amount of ash (Control*CP:1.69%), nitrogen (IAU*CP: 5.906%), carbon (EAU*CP:34.300%), magnesium (EAU*CP: 5.080 mg/g), zinc (IAU*CP: 0.080 mg/g), and calcium (IAU*CP:6.590 mg/g) were attained in CP. Meanwhile, the highest amounts of potassium (Control*C: 98.510 mg/g), phosphorus (EAU*C: 18.260 mg/g), and sulfur (Control*C: 0.555%) were obtained in coconut fibers.
Table 8.
Wheatgrass gross nutrient contents in different experimental groups (“Control”—fertilized tap water; “IAU”—fish effluents from intensive aquaculture unit; “EAU”—fish effluents from extensive aquaculture unit; “C”—100% coconut fibers; “CP”—70% coconut fibers + 30% perlite; “PV”—50% vermiculite + 50% perlite).
Table 9.
Wheatgrass macro- and micronutrient contents in different experimental groups (“Control”—fertilized tap water; “IAU”—fish effluents from intensive aquaculture unit; “EAU”—fish effluents from extensive aquaculture unit; “C”—100% coconut fibers; “CP”—70% coconut fibers + 30% perlite; “PV”—50% vermiculite + 50% perlite).
As shown in Figure 4, vitamin B6 (0.097 mg/100g, IAU*C) and vitamin B12 (0.147 μg/100g, IAU*C) had the highest value in the IAU with C. The vitamin B7 (biotin) content in the CP with extensive fish water had the maximum amount (5.43 μg/100g, EAU*CP). The highest vitamin E content was found in the PV with intensive fish water (4.80 mg/kg, IAU*PV).
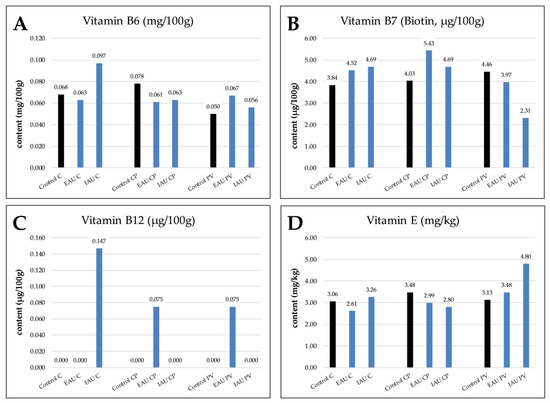
Figure 4.
Wheatgrass contents of (A) vitamin B6, (B) vitamin B7 (biotin), (C) vitamin B12, and (D) vitamin E in different experimental groups (Control, extensive aquaculture unit (EAU), intensive aquaculture unit (IAU)); substrates are illustrated as coconut fibers 100% (C), coconut fibers 70% + perlite 30% (CP), and perlite 50% + vermiculite 50% (PV).
4. Discussion
4.1. Fish Production Parameters
The average FCR and the SGR of C. gariepinus in the present study were better in the IAU compared with the EAU. It was mentioned that higher stocking density had a positive influence on the FCR and SGR of fish weighing 102.1–288.6 g under stocking density in the range from 67 fish/m3 to 533 fish/m3 [30]. Furthermore, increased aggressions have been recorded with decreased stocking densities. It was also reported that the agonistic behavior of African catfish during its growth phase from 10g to 100g showed a tendency to decrease with increasing stocking density [31]. In the present study, a higher mortality was observed in the EAU.
Considering the influence of physico-chemical water quality parameters on fish growth, nitrate was relatively high in the IAU with 847.93 ± 171.20 mg/L and in the EAU with 364.16 ± 72.99 mg/L. It is assumed that ammonium was converted sufficiently by the trickling filter in both fish units. It was demonstrated that nitrate values reached 76.02 ± 12.37 mg/L in an intensive rearing unit with fish weighing 275g and 44.20 ± 8.69 mg/L in an extensive rearing unit with fish weighing 275 g. These fish were distinctly smaller than those in the present study [37]. The SGR of African catfish in their study was better than that in our study. Nitrate levels of more than 100 mg/L may reduce the appetite of C. gariepinus [39]. Moreover, it was suggested that C. gariepinus can tolerate nitrate levels up to 140 mg/L. Feed intake and specific growth rate were nonetheless significantly reduced at the highest nitrate concentration [40]. Ammonia levels lower than 0.34 mg/L were recommended in the production of C. gariepinus with an initial mean weight of 141.0 g [41]. The C. gariepinus with an average initial weight of 480.23 g in the study by Palm et al. [33] reached a better FCR (1.00) and SGR (0.65 %/day) than the African catfish in EAU in the present research. In their experiment, ammonium (0.16 ± 0.13 mg/L) and nitrate levels (40.54 ± 10.97 mg/L) were lower than those in the present study. The mean ammonium in the present study (IAU: 0.78 ± 0.29 mg/L; EAU: 0.37 ± 0.46 mg/L) had possibly negative effects on the fish growth.
Regarding the temperature, it was concluded that a temperature of 30 °C is probably optimal for most physiological processes of African catfish [42]. In our study, the temperature reached 26.51 ± 0.50 °C, which is common in the commercial production of African catfish.
4.2. Plant Production Parameters
4.2.1. Irrigation Water Influence on Wheatgrass
Physical Water Quality Parameters
Oxygen in the irrigation water reached levels of 9.86 ± 0.35 mg/L to 10.03 ± 0.37 mg/L (Table 3), which is ideal for the cultivation of T. aestivum due to air pumps inside the three nutrient tanks. It was reported that the soil with the highest oxygen concentration (7 mL/kg ≈ 9.96 mg/L) had the best wheat seedling growth with the highest fresh weight [43].
The water temperature was 18.53 ± 1.55 °C in the control, 18.34 ± 1.86 °C in IAU, and 19.94 ± 4.13 °C in EAU. The ambient temperature was around 16.8 °C, the lowest temperature was 9.0 °C, and the highest temperature was 29.4 °C during the experiment. Suitable temperatures for most wheat species lie between 28 °C and 30 °C [44]. However, day temperatures at 20 °C and night temperatures at 15 °C have been reported to result in the highest yield of wheatgrass [45].
The pH values in all experimental groups were controlled at 6.5. It was found that wheat seedlings grown in media with pH 7.0 showed a better performance than seedlings grown with pH 4.0 and pH 8.5 [46]. One of the possibilities is that the pH value affects plant growth through its influence on nitrogen utilization efficiency [47]. The efficiency of nitrogen utilization reached its maximum at pH 6.0, followed by pH 7.5 and 9.0 [47]. In conclusion, the pH value in the present study was suitable for wheatgrass growth.
The conductivity level had the highest value in the control (1837.54 ± 170.23 μS/cm) and was significantly higher than that in the IAU (1665.85 ± 85.19 μS/cm) and EAU (961.77 ± 88.97 μS/cm). Despite the control water having higher EC levels, aquaponic solutions of IAU and EAU may contain relatively higher amounts of dissolved organic matter and organic metabolites derived from fish waste or uneaten feed that may also contribute to nutrient availability [48]. These organic compounds are assumed to promote the growth of plants as if the plants are growing in the soil [49].
There was no significant difference in light conditions (min: 430.83 ± 174.25 μmol/m2/s; max: 702.08 ± 395.25 μmol/m2/s) among all experimental tables, indicating that the light had no decisive influence on the growing disparity of wheatgrass. Three different light intensities were studied, and it was concluded that various light intensities had an impact on the nitrogen distribution of wheat [50]. Furthermore, the increment in the shoot biomass under increasing light intensity was determined in wheat seedlings grown in a special solution [51].
Chemical Water Quality Parameters
As shown in Table 4, wheatgrass in the control with a lower nitrogen level (ammonium: 0.74 ± 0.31 mg/L; nitrate: 382.58 ± 67.02 mg/L) inside the irrigation water had the highest root–shoot ratio compared with the fish units (Table 5). This implies that the nitrogen was limited in the control, which might be explained by the optimum partitioning theory (OPT) [52,53]. The OPT describes that when there is a surplus of nitrogen, plants will prefer to grow more shoot mass than the root mass, thus resulting in a lower root–shoot ratio. Similarly, the root–shoot ratio of different kinds of warm-season grasses decreased under high concentrations of nitrogen [54]. It was also observed in potatoes that the root–shoot ratio decreased with increased nitrogen supply [55]. Despite comparable nitrogen levels in the water from the control and EAU (ammonium: 0.37 ± 0.46 mg/L; nitrate: 364.16 ± 72.99 mg/L), the EAU attained a lower root–shoot ratio. This is probably due to the organic form of nitrogen available in the fish effluents. The organic form of nitrogen could be mineralized by certain microbes inside the fish effluents and become the nitrogen forms available to wheatgrass such as nitrate and ammonium [56].
An important part of chlorophyll named the porphyrin ring is composed of a central magnesium atom and four nitrogen atoms [57,58]. Although irrigation water from the control had a significantly higher Mg level, its significantly lower nitrogen level compared to IAU (ammonium: 0.78 ± 0.29 mg/L; nitrate: 847.93 ± 171.20 mg/L) led to a lower SPAD index compared with IAU. The dense and diverse microbial communities inside the fish water, especially the plant-growth-promoting rhizobacteria (PGPRs), may promote plant growth and the uptake of nutrients such as N, P, K, and Mg [59].
The root dry mass had no significant difference among all groups even though the control had a significantly higher concentration of phosphorus (Table 4 and Table 5). It was reported that phosphorus is critical for root morphology [60]. The higher the percentage of P in the soil, the lower the root dry mass developed. When there is a limit of phosphorus, roots will tend to develop more root hairs, which means there will be higher root dry mass. It was mentioned that spinach developed more root hairs under low P concentrations [61]. In our study, similar root dry mass among all groups indicated that the P contents in the fish water were sufficient.
In addition, for root length, there was a tendency of control > EAU > IAU (Table 5). Both nitrogen and potassium influence root development through the elongation of the primary root. Under the circumstance of limited N and K, the primary root growth will be promoted and lateral roots will be delayed [62]. In the present experiment, nitrogen had the highest concentration in IAU. However, there was a significantly higher concentration of K in the control compared with IAU (13.83 times). It is assumed that K levels in IAU and EAU were not limiting for wheatgrass growth. In conclusion, the irrigation water from IAU, followed by EAU, presented a positive profile of nutrient supply for the wheatgrass grown in African catfish aquaponics.
4.2.2. Substrate Influence on Wheatgrass Growth
The lowest root–shoot ratio was observed in the C substrates. Meanwhile, C had a significantly lower root dry mass compared to PV but an insignificantly different root dry mass compared to CP (Table 6). This is probably due to sufficient nutrients such as N and P in the coconut fibers. The significantly highest root length was observed in C substrates, followed by CP and PV. Since there is abundant N and K in the coconut fibers (fertilized with N, P, K) used in the present study, the differences in texture and density of the three substrates may have had a major influence on the root elongations. It was suggested that mechanical impedance or penetration resistance is often a major limitation to root elongation in different soils [63]. One study demonstrated that the root length of forage crops decreased with an increased bulk density of soil [64]. According to the properties of substrates, coconut fibers have the lowest bulk density compared to perlite and vermiculite [65,66]. An opposing result was discovered in strawberries cultivated in coconut fibers (100%), which had a lower root length compared to coconut mixed with perlite (75%:25%) and perlite mixed with vermiculite (50%:50%) [67].
The chlorophyll content was significantly higher in PV than in C, but there was no significant difference between PV and CP. Considering N and Mg levels in these substrates, coconut fibers contained considerably higher N, and vermiculite could release a certain amount of Mg [66]. It is assumed that the properties of substrates such as cation exchange capacity, water retention, and the effect of the combination of various substrates (organic or inorganic) could have led to this result [65]. Higher chlorophyll content of strawberry leaves was reported in a mixed substrate consisting of cocopeat and perlite when compared with a mixture of sand and perlite and a combination of sand, perlite, and cocopeat [67]. As for spinach which was cultured in peat or coir or a mixture of forest residues, husks and peat showed higher chlorophyll content in peat [68]. Lettuces cultivated in cocopeat gained a significantly higher amount of chlorophyll than those cultivated in substrates such as sawdust, rice husks, and a combination of them all (1:1:1) [69]. It was found in one study that there was no difference in the SPAD values of leaves from apple rootstocks cultivated in peat moss, vermiculite, and perlite mixtures with three different proportions (1.1.1; 1:2:3; 3:1:2) [70]. Similarly, leaves of two tomato variants indicated no significant difference in chlorophyll content regardless of cultivation in rockwool or coconut fibers [71]. In conclusion, the substrates containing coconut fibers (100% and 70%) used in the present study had an adequate amount of nutrients for wheatgrass cultivation based on the observation of root performance. The growth and production of plants are affected by the characteristics of various culturing materials [17,65]. It has been recorded in several studies that various substrates had influences on strawberry growth [72,73,74,75,76,77,78]. Coconut fibers together with crushed stones were considered to be the best substrate for lettuce (Lactuca sativa) in aquaponics [23]. However, gravel was considered not to be the ideal medium for lettuce growth [79]. On the contrary, gravel substrate was proven to produce the highest tomato production in aquaponics [21].
4.2.3. Plant Growth Parameters Influenced by Interaction of Irrigation Water and Substrates
Wheatgrass in EAU*PV had the significantly highest value in shoot fresh mass (Table 7), which implied that the interaction of EAU irrigation water and inorganic substrates may have a beneficial influence on the shoot development of wheatgrass. Similarly, it was demonstrated that strawberries cultured in a perlite and cocopeat combination and irrigated by hydroponic solution showed a positive effect on the growth of strawberries [19]. It was also reported that the combination of certain substrates and nutrition solutions increased the vegetative growth of strawberries [73]. Additionally, the influence of different cultivation containers together with various substrates showed diverse growth performance in the root system of strawberries [74].
4.2.4. Vitamin and Mineral Contents
For mineral and vitamin concentration analyses, we had nine samples as combinations of three different irrigation water and three different substrates (3*3: Control*C, IAU*C, EAU*C, Control*CP, IAU*CP, EAU*CP, Control*PV, IAU*PV, and EAU*PV). According to the results, irrigation water was not the dominating influence on the observed differences of certain nutrients such as nitrogen, phosphorus, potassium, and sulfur. For example, the nitrogen content in the irrigation water had the highest value in IAU (NO3: 847.93 ± 171.20 mg/L, NH4: 0.78 ± 0.29 mg/L), followed by control (NO3: 382.58 ± 67.02 mg/L, NH4: 0.74 ± 0.31 mg/L) and EAU (NO3: 364.16 ± 72.99 mg/L, NH4: 0.37 ± 0.46 mg/L). However, with the combination of different substrates, N contents in wheatgrass from the three irrigation water groups showed different tendencies from N levels in the irrigation water. In C substrates, wheatgrass irrigated with control water had the highest nitrogen level (Table 9). Nevertheless, in CP and PV substrates, wheatgrass irrigated by IAU had the highest nitrogen level while wheatgrass irrigated by EAU water had a higher nitrogen level compared with the control. Organic forms of nitrogen such as proteins in EAU water might have contributed to the higher nitrogen level in the wheatgrass because it was suggested that plants can uptake proteins directly as nitrogen sources [80]. Furthermore, since certain microbes in the fish water can break down the proteins from fish waste into an available form of nitrogen for wheatgrass, they might have also contributed to the nitrogen content [56].
Levels of nutrients such as Mg and Ca were assumed to be mainly affected by the irrigation water. The calcium levels in wheatgrass from all substrates were on par with their levels in the irrigation water (Table 4 and Table 9). Magnesium had the highest level in the irrigation water of the control; however, its contents in wheatgrass of EAU from all substrates were the highest. Nutrient antagonism of Mg, K, and Ca was supposed to lead to these results (Mg/K/Ca: EAU, 0.015; IAU, 0.003; control, 0.003) because these nutrients compete for uptake by the plants due to their ions with the same positive charges [81].
As shown in Figure 4, a detectable amount of vitamin B12 was found only in the fish water combinations IAU*C, EAU*CP, and EAU*PV, and the highest amount was discovered in the IAU and coconut fiber combination. Plants cannot synthesize vitamin B12 by themselves. However, they can absorb various vitamins directly from the fish effluents or produced by bacteria [4,8,82,83,84,85,86]. It has been reported that organic fertilizers such as manure and sewage sludge can increase the amount of vitamin B12 in some plants [8]. Furthermore, Bacteroides type A dwelled in the guts of some freshwater cultured fish, and certain Rhizobium species can also produce vitamin B12 [4,82].
Among all substrates and irrigation water combinations, irrigation water from IAU with coconut fibers (IAU*C) had the highest vitamin B6 content; EAU with CP (EAU*CP) had the highest vitamin B7 content, and IAU with PV (IAU*PV) had the highest vitamin E content. However, for vitamin B6 in CP, the control had the highest amount, like vitamin B7 in PV and vitamin E in CP. The de novo pathways of biosynthesis of vitamins B6, B7, and E need precursors such as glutamine, alanine, and tyrosine [87]. These amino acids might have been synthesized by the plants themselves [88]. Plants utilize nitrate and ammonia ions to generate amino acids, and thus the nitrogen level is of importance for the biosynthesis of those precursors. Fish water, especially IAU, contains high levels of nitrogen and non-negligible organic forms of nitrogen. Another factor that influences vitamin production in plants is the vitamin–PGPB interaction [4,89]. The assimilation of synthesized vitamins from microbes by plants has been suggested [4,90]. Specifically, bacteria such as Bacillus subtilis and Pseudomonas fluorescens can synthesize vitamin B6. PGPBs such as Sinorhizobium meliloti can synthesize biotin (vitamin B7). Furthermore, bacteria such as Synechocystis (Cyanobacteria) can synthesize vitamin E [91]. Abundant microbe communities in fish water might have had a positive influence on plant vitamin production. Furthermore, different microbe communities depending on the pH and carbon source of the substrates or fish water could have influenced which vitamins are to be produced [4]. In summary, the fish water with a combination of certain substrates promoted vitamin production in wheatgrass.
5. Conclusions
In the present study, wheatgrass was cultivated with three different irrigation water sources: (i) extensive aquaculture unit (EAU), (ii) intensive aquaculture unit (IAU), and (iii) tap water with fertilizer (Control) and three different horticultural substrates: (1) coconut fibers (100%) (C), (2) coconut fibers (70%) + perlite (30%) (CP), and (3) perlite (50%) + vermiculite (50%) (PV) to determine the best combination for optimal growth. The growth parameters and nutrient contents of plants were measured and analyzed. The main findings of the study are as follows:
- (1)
- Physical water parameters such as oxygen content, temperature, pH value, and light conditions were overall suitable for wheatgrass growth among the three irrigation water groups.
- (2)
- Regarding the influence of irrigation water on wheatgrass growth, we concluded that the fish water groups showed better plant growth performance despite the significantly higher EC level in Control. In addition, the IAU irrigation water showed a positive effect on vitamin production in wheatgrass. Fish effluents from IAU and EAU, especially IAU, may contain relatively large amounts of dissolved organic matter and organic metabolites that contribute to nutrient availability. It is also suggested that the abundant microbes, including beneficial plant-growth-promoting microbes (PGPMs), found in aquaponics systems resulted in higher levels of some nutrients in the fish water groups than in the control groups.
- (3)
- Regarding the effect of substrates on wheatgrass growth, we concluded that coconut fibers contained sufficient nutrients to support wheatgrass growth. In addition, the characteristics of different substrates could have an influence on the growth parameters of plants as well as the nutrient content of wheatgrass.
- (4)
- The interaction of EAU irrigation water and inorganic substrates (PV) may have a positive effect on wheatgrass shoot development.
In this study, we demonstrated the potential of aquaponics as a more sustainable way to produce superfoods now and in the future. Analyses of bacterial populations inhabiting aquaculture effluents and substrates can help us better understand the mechanisms of increment in certain nutrients in aquaponics, and it is recommended that larger sample sizes be used for mineral and vitamin content analysis in the future.
Author Contributions
All authors contributed to several aspects of the study, specifically conceptualization: L.X., U.K., H.W.P. and S.A.; methodology: L.X., C.J.Z. and U.K.; validation: L.X., U.K., C.J.Z., S.A. and H.W.P.; formal analysis: L.X., U.K., S.A. and H.W.P.; investigation: U.K. and H.W.P.; data curation: L.X., U.K., S.A. and H.W.P.; writing—original draft preparation: L.X. and U.K.; writing—review and editing: L.X., U.K., S.A. and H.W.P.; visualization: U.K. and L.X.; supervision: U.K., S.A. and H.W.P.; project administration: H.W.P. and U.K.; funding acquisition: H.W.P. and U.K. All authors have read and agreed to the published version of the manuscript.
Funding
We thank the Ministry of Climate Protection, Agriculture, Rural Areas and the Environment of Mecklenburg-Western Pomerania (Germany), and the European Union for supporting research in aquaponics fish and plant production. This experiment was funded through the project “Performance and process water management in commercial (integrated) aquaculture systems with African catfish (Clarias gariepinus) in Mecklenburg-Western Pomerania” (EMFF: 139030000103-7302, MV-II.1-LM-007-730218000006). We acknowledge financial support from Deutsche Forschungsgemeinschaft and Universität Rostock within the funding program Open Access Publishing.
Data Availability Statement
The data is available on request from corresponding author.
Conflicts of Interest
The authors declare no conflict of interest.
References
- Palm, H.W.; Knaus, U.; Appelbaum, S.; Goddek, S.; Strauch, S.M.; Vermeulen, T.; Jijakli, M.H.; Kotzen, B. Towards commercial aquaponics: A review of systems, designs, scales and nomenclature. Aquac. Int. 2018, 26, 813–842. [Google Scholar] [CrossRef]
- Tokuyama, T.; Mine, A.; Kamiyama, K.; Yabe, R.; Satoh, K.; Matsumoto, H.; Takahashi, R.; Itonaga, K. Nitrosomonas communis strain YNSRA, an ammonia-oxidizing bacterium, isolated from the reed rhizoplane in an aquaponics plant. J. Biosci. Bioeng. 2004, 98, 309–312. [Google Scholar] [CrossRef]
- Delaide, B.; Goddek, S.; Gott, J.; Soyeurt, H.; Jijakli, M.H. Lettuce (Lactuca sativa L. var. Sucrine) growth performance in complemented aquaponic solution outperforms hydroponics. Water 2016, 8, 467. [Google Scholar] [CrossRef]
- Palacios, O.A.; Bashan, Y.; de-Bashan, L.E. Proven and potential involvement of vitamins in interactions of plants with plant growth-promoting bacteria—An overview. Biol. Fertil. Soils 2014, 50, 415–432. [Google Scholar] [CrossRef]
- Bittsanszky, A.; Uzinger, N.; Gyulai, G.; Mathis, A.; Junge, R.; Villarroel, M.; Kotzen, B.; Kőmíves, T. Nutrient supply of plants in aquaponic systems. Ecocycles 2016, 2, 17–20. [Google Scholar] [CrossRef]
- Pantanella, E.; Cardarelli, M.; Colla, G.; Rea, E.; Marcucci, A. Aquaponics vs. Hydroponics: Production and Quality of Lettuce Crop. Acta Hortic. 2012, 927, 887–893. [Google Scholar] [CrossRef]
- Li, N.; Zhang, L.; Li, J.; Yan, K.; Wang, Y.; Wang, B.; Li, S.; Zhou, W.; Wang, K.; Li, W.; et al. Effects of aquaponic system on growth and nutrients content and sustainable production of sprouts in urban area. Aust. J. Crop Sci. 2020, 14, 1794–1799. [Google Scholar] [CrossRef]
- Mozafar, A. Enrichment of some B-vitamins in plants with application of organic fertilizers. Plant Soil 1994, 167, 305–311. [Google Scholar] [CrossRef]
- Bonjean, A.P.; Angus, W.J. The World Wheat Book: A History of Wheat Breeding; Lavoisier Publishing: Paris, France, 2001; p. 113. [Google Scholar]
- Mujoriya, R.; Bodla, R.B. A study on wheat grass and its Nutritional value. Food Sci. Qual. Manag. 2011, 2, 1–8. [Google Scholar]
- Bar-Sela, G.; Cohen, M.; Ben-Arye, E.; Epelbaum, R. The medical use of wheatgrass: Review of the gap between basic and clinical applications. Mini Rev. Med. Chem. 2015, 15, 1002–1010. [Google Scholar] [CrossRef]
- Chauhan, M. A pilot study on wheat grass juice for its phytochemical, nutritional and therapeutic potential on chronic diseases. Int. J. Chem. Stud. 2014, 2, 27–34. [Google Scholar]
- Gamao, V.; Naumann, H.D.; Lambert, B.D. Nitrate concentration of water in hydroponic system impacts nitrogen concentration of wheatgrass roots and shoots differently. Tex. J. Agric. Nat. Resour. 2015, 28, 27–32. [Google Scholar]
- Fortună, M.E.; Vasilache, V.; Ignat, M.; Silion, M.; Vicol, T.; Patraș, X.; Miron, I.; Lobiuc, A. Elemental and macromolecular modifications in Triticum aestivum L. plantlets under different cultivation conditions. PLoS ONE 2018, 13, e0202441. [Google Scholar] [CrossRef] [PubMed]
- Karasahin, M. The Effects of Different Seaweed Doses on Yield and Nutritional Values of Hydroponic Wheatgrass Juice. Turk. J. Agric. Food Sci. Technol. 2017, 5, 226–230. [Google Scholar] [CrossRef][Green Version]
- Ashraf, M.; Rahmatullah Maqsood, M.A.; Kanwal, S.; Tahir, M.A.; Ali, L. Growth Responses of Wheat Cultivars to Rock Phosphate in Hydroponics. Pedosphere 2009, 19, 398–402. [Google Scholar] [CrossRef]
- Verdonck, O.; Vleeschauwer, D.; De Boodt, M. The influence of the substrate to plant growth. Acta Hort. ISHS 1982, 126, 251–258. [Google Scholar] [CrossRef]
- Somerville, C.; Cohen, M.; Pantanella, E.; Stankus, A.; Lovatelli, A. The three zones of media beds—Characteristics and processes. In Small-Scale Aquaponic Food Production; Integrated Fish and Plant Farming, Food and Agriculture Organization of the United Nations: Rome, Italy, 2014; pp. 59–60. ISBN 978-92-5-108532-5. [Google Scholar]
- Afsharipoor, S.; Roosta, H.R. Effect of different planting beds on growth and development of strawberry in hydroponic and aquaponic cultivation systems. Plant Ecop. 2010, 2, 61–66. [Google Scholar]
- Fotouhi Ghavzini, R.; Payvast, G.; Azarian, H. Effect of clinoptilolitic-zeolite and perlite mixtures on the yield and quality of strawberry in soil-less culture. Int. J. Agric. Biol. 2007, 9, 885–888. [Google Scholar]
- Salam, M.A.; Jahan, N.; Hashem, S.; Rana, K.M. Feasibility of tomato production in aquaponic system using different substrates. Progress. Agric. 2014, 25, 54–62. [Google Scholar] [CrossRef]
- Khandaker, M.; Kotzen, B. The potential for combining living wall and vertical farming systems with aquaponics with special emphasis on substrates. Aquac. Res. 2018, 49, 1454–1468. [Google Scholar] [CrossRef]
- Jordan, R.A.; Geisenhoff, L.O.; Oliveira, F.C.; Santos, R.C.; Martins, E.A. Yield of lettuce grown in aquaponic system using different substrates. Rev. Bras. De Eng. Agrícola E Ambient. 2018, 22, 27–31. [Google Scholar] [CrossRef]
- Buzby, K.M.; Waterland, N.L.; Semmens, K.J.; Lin, L.S. Evaluating aquaponic crops in a freshwater flow-through fish culture system. Aquaculture 2016, 460, 15–24. [Google Scholar] [CrossRef]
- Tyson, R.V. Reconciling pH for Ammonia Biofiltration in a Cucumber/Tilapia Aquaponics System using a Perlite Medium. Ph.D. Thesis, University of Florida, Gainesville, FL, USA, 2007. [Google Scholar]
- Huisman, E.A.; Richter, C.J. Reproduction, growth, health control and aquacultural potential of the African catfish (Clarias gariepinus) (Burchell 1822). Aquaculture 1987, 63, 1–4. [Google Scholar] [CrossRef]
- Haylor, G.S. The case for the African catfish (Clarias gariepinus) (Burchell, 1822) Clariidae: A comparison of the relative merits of Tilapiine fishes, especially (Oreochromis niloticus L.) and (Clarias gariepinus) (Burchell) for African aquaculture. Aquac. Res. 1989, 20, 279–285. [Google Scholar] [CrossRef]
- Haylor, G.S. Controlled hatchery production of Clarias gariepinus (Burchell 1822): Growth and survival of fry at high stocking density. Aquac. Res. 1991, 22, 405–422. [Google Scholar] [CrossRef]
- Fagbenro, O.A. Soybean meal replacement by roquette (Eruca sativa Miller) seed meal as protein feedstuff in diets for African Catfish (Clarias gariepinus) (Burchell 1822), fingerlings. Aquac. Res. 2004, 35, 917–923. [Google Scholar] [CrossRef]
- Van de Nieuwegiessen, P.G.; Olwo, J.; Khong, S.; Verreth, J.A.; Schrama, J.W. Effects of age and stocking density on the welfare of African catfish, Clarias gariepinus Burchell. Aquaculture 2009, 288, 69–75. [Google Scholar] [CrossRef]
- Van de Nieuwegiessen, P.G.; Boerlage, A.S.; Verreth, J.A.; Schrama, J.W. Assessing the effects of a chronic stressor, stocking density, on welfare indicators of juvenile African catfish (Clarias gariepinus) (Burchell 1822). Appl. Anim. Behav. Sci. 2008, 115, 233–243. [Google Scholar] [CrossRef]
- Okechi, J.K. Profitability Assessment: A Case Study of African Catfish (Clarias gariepinus) Farming in the Lake Victoria Basin, Kenya. Master’s Thesis, The United Nations University, Tokyo, Japan, 2004. [Google Scholar]
- Palm, H.W.; Bissa, K.; Knaus, U. Significant factors affecting the economic sustainability of closed aquaponic systems. Part II: Fish and plant growth. Aquac. Aquar. Conserv. Legis. 2014, 7, 162–175. [Google Scholar]
- Knaus, U.; Palm, H.W. Effects of fish biology on ebb and flow aquaponical cultured herbs in northern Germany (Mecklenburg Western Pomerania). Aquaculture 2017, 466, 51–63. [Google Scholar] [CrossRef]
- Baßmann, B.; Harbach, H.; Weißbach, S.; Palm, H.W. Effect of plant density in coupled aquaponics on the welfare status of African catfish (Clarias gariepinus). J. World Aquac. Soc. 2020, 51, 183–199. [Google Scholar] [CrossRef]
- Knaus, U.; Palm, H.W. Effects of the fish species choice on vegetables in aquaponics under spring-summer conditions in northern Germany (Mecklenburg Western Pomerania). Aquaculture 2017, 473, 62–73. [Google Scholar] [CrossRef]
- Knaus, U.; Wenzel, L.C.; Appelbaum, S.; Palm, H.W. Aquaponics (sl) Production of Spearmint (Mentha spicata) with African Catfish (Clarias gariepinus) in Northern Germany. Sustainability 2020, 12, 8717. [Google Scholar] [CrossRef]
- Sim, C.C.; Zaharah, A.R.; Tan, M.S.; Goh, K.J. Rapid determination of leaf chlorophyll concentration, photosynthetic activity and NK concentration of Elaies guineensis via correlated SPAD-502 chlorophyll index. Asian J. Agric. Res. 2015, 9, 132–138. [Google Scholar]
- Somerville, C.; Cohen, M.; Pantanella, E.; Stankus, A.; Lovatelli, A. Catfish. In Small-Scale Aquaponic Food Production; Integrated Fish and Plant Farming, Food and Agriculture Organization of the United Nations: Rome, Italy, 2014; p. 113. ISBN 978-92-5-108532-5. [Google Scholar]
- Schram, E.; Roques, J.A.; Abbink, W.; Yokohama, Y.; Spanings, T.; de Vries, P.; Bierman, S.; van de Vis, H.; Flik, G. The impact of elevated water nitrate concentration on physiology, growth and feed intake of African catfish Clarias gariepinus (Burchell 1822). Aquac. Res. 2014, 45, 1499–1511. [Google Scholar] [CrossRef]
- Schram, E.; Roques, J.A.; Abbink, W.; Spanings, T.; De Vries, P.; Bierman, S.; van de Vis, H.; Flik, G. The impact of elevated water ammonia concentration on physiology, growth and feed intake of African catfish (Clarias gariepinus). Aquaculture 2010, 306, 108–115. [Google Scholar] [CrossRef]
- Britz, P.J.; Hecht, T. Temperature preferences and optimum temperature for growth of African sharp tooth catfish (Clarias gariepinus) larvae and postlarvae. Aquaculture 1987, 63, 205–214. [Google Scholar] [CrossRef]
- Karsten, K.S. Root activity and the oxygen requirement in relation to soil fertility. Am. J. Bot. 1939, 26, 855–860. [Google Scholar] [CrossRef]
- Ouyang, J.W.; Zhou, S.M.; Jia, S.E. The response of anther culture to culture temperature in Triticum aestivum. Theor. Appl. Genet. 1983, 66, 101–109. [Google Scholar] [CrossRef]
- Islam, M.Z.; Park, B.J.; Lee, Y.T. Influence of temperature conditions during growth on bioactive compounds and antioxidant potential of wheat and barley grasses. Foods 2021, 10, 2742. [Google Scholar] [CrossRef]
- Bhuyan, M.H.; Hasanuzzaman, M.; Mahmud., J.A.; Hossain., M.; Bhuiyan, T.F.; Fujita, M. Unraveling morphophysiological and biochemical responses of Triticum aestivum L. to extreme pH: Coordinated actions of antioxidant defense and glyoxalase systems. Plants 2019, 8, 24. [Google Scholar] [CrossRef] [PubMed]
- Zou, Y.; Hu, Z.; Zhang, J.; Xie, H.; Guimbaud, C.; Fang, Y. Effects of pH on nitrogen transformations in media-based aquaponics. Bioresour. Technol. 2016, 210, 81–87. [Google Scholar] [CrossRef] [PubMed]
- Rakocy, J.E.; Masser, M.P.; Losordo, T.M. Recirculating Aquaculture Tank Production Systems: Aquaponics—Integrating Fish and Plant Culture; SRAC Publication No. 454; FAO: Stoneville, NC, USA, 2016; p. 2. [Google Scholar]
- Böhme, M.; Lua, H. Influence of mineral and organic treatments in the rhizosphere on the growth of tomato plants. In Proceedings of the International Symposium Growing Media and Plant Nutrition in Horticulture, Naaldwijk, The Netherlands, 2 September 1996; Adams, P., Hidding, A.P., Kipp, J.A., Sonneveld, C., de Kreij, C., Eds.; International Society for Horticultural Science (ISHS): Leuven, Belgium, 1995; Volume 450, pp. 161–168. [Google Scholar]
- Spiertz, J.H. The influence of temperature and light intensity on grain growth in relation to the carbohydrate and nitrogen economy of the wheat plant. NJAS Wagening. J. Life Sci. 1977, 25, 182–197. [Google Scholar] [CrossRef]
- Toldi, D.; Gyugos, M.; Darkó, É.; Szalai, G.; Gulyás, Z.; Gierczik, K.; Székely, A.; Boldizsár, Á.; Galiba, G.; Müller, M.; et al. Light intensity and spectrum affect metabolism of glutathione and amino acids at transcriptional level. PLoS ONE 2019, 14, e0227271. [Google Scholar] [CrossRef]
- Chapin, F.S.; Bloom, A.J.; Field, C.B.; Waring, R.H. Plant responses to multiple environmental factors. Bioscience 1987, 37, 49–57. [Google Scholar] [CrossRef]
- Ågren, G.I.; Franklin, O. Root: Shoot ratios, optimization and nitrogen productivity. Ann. Bot. 2003, 92, 795–800. [Google Scholar] [CrossRef]
- Heggenstaller, A.H.; Moore, K.J.; Liebman, M.; Anex, R.P. Nitrogen influences biomass and nutrient partitioning by perennial, warm-season grasses. Agron. J. 2009, 101, 1363–1371. [Google Scholar] [CrossRef]
- Sattelmacher, B.; Klotz, F.; Marschner, H. Influence of the nitrogen level on root growth and morphology of two potato varieties differing in nitrogen acquisition. Plant Soil 1990, 123, 131–137. [Google Scholar] [CrossRef]
- Shinohara, M.; Aoyama, C.; Fujiwara, K.; Watanabe, A.; Ohmori, H.; Uehara, Y.; Takano, M. Microbial mineralization of organic nitrogen into nitrate to allow the use of organic fertilizer in hydroponics. Soil Sci. Plant Nutr. 2011, 57, 190–203. [Google Scholar] [CrossRef]
- Satish, C.B.; Manju, A.L. Plant Physiology, Development and Metabolism; Springer Nature Singapore Pte Ltd.: Singapore, 2018; p. 60. [Google Scholar]
- Karishma, D.B.; Jagannath, B. Magnesium porphyrins with relevance to chlorophylls. Dalton Trans. 46 2017, 20, 6497–6509. [Google Scholar]
- Glick, B.R. Plant growth-promoting bacteria: Mechanisms and applications. Scientifica 2012, 2012, 963401. [Google Scholar] [CrossRef] [PubMed]
- Anghinoni, I.; Barber, S.A. Phosphorus application rate and distribution in the soil and phosphorus uptake by corn. Soil Sci. Soc. Am. J. 1980, 44, 1041–1044. [Google Scholar] [CrossRef]
- Foehse, D.; Jungk, A. Influence of phosphate and nitrate supply on root hair formation of rape, spinach and tomato plants. Plant Soil 1983, 74, 359–368. [Google Scholar] [CrossRef]
- Lu, J.L. “Zhi Wu Ying Yang Xue” [Plant Nutritional Science]; Lu, J.L., Ed.; Zhongguo Nongye Chubanshe: Beijing, China, 2019; p. 146. [Google Scholar]
- Bengough, A.G.; Mullins, C.E. Mechanical impedance to root growth: A review of experimental techniques and root growth responses. J. Soil Sci. 1990, 41, 341–358. [Google Scholar] [CrossRef]
- Parlak, M.; Parlak, A.Ö. Effect of soil compaction on root growth and nutrient uptake of forage crops. J. Food Agric. Environ. 2011, 9, 275–278. [Google Scholar]
- Fields, J.S.; Fonteno, W.C.; Jackson, B.E.; Heitman, J.L.; Owen, J.S. Hydrophysical properties, moisture retention, and drainage profiles of wood and traditional components for greenhouse substrates. HortScience 2014, 49, 827–832. [Google Scholar] [CrossRef]
- Kremenetskaya, I.; Ivanova, L.; Chislov, M.; Zvereva, I.; Vasilieva, T.; Marchevskaya, V.; Semushin, V.; Slukovskaya, M. Physicochemical transformation of expanded vermiculite after long-term use in hydroponics. Appl. Clay Sci. 2020, 198, 105839. [Google Scholar] [CrossRef]
- Ebrahimi, R.; Ebrahimi, F.; Ahmadizadeh, M. Effect of different substrates on herbaceous pigments and chlorophyll amount of strawberry in hydroponic cultivation system. Am. Eurasian J. Agric. Environ. Sci. 2012, 12, 154–158. [Google Scholar]
- Barcelos, C.; Machado, R.M.; Alves-Pereira, I.; Ferreira, R.; Bryla, D.R. Effects of substrate type on plant growth and nitrogen and nitrate concentration in spinach. Int. J. Plant Biol. 2016, 7, 6325. [Google Scholar] [CrossRef]
- Sarkar, M.D.; Rahman, M.J.; Uddain, J.; Quamruzzaman, M.; Azad, M.O.; Rahman, M.H.; Islam, M.J.; Rahman, M.S.; Choi, K.Y.; Naznin, M.T. Estimation of Yield, Photosynthetic Rate, Biochemical, and Nutritional Content of Red Leaf Lettuce (Lactuca sativa L.) Grown in Organic Substrates. Plants 2021, 10, 1220. [Google Scholar] [CrossRef]
- Kim, J.K.; Shawon, M.R.; An, J.H.; Yun, Y.J.; Park, S.J.; Na, J.K.; Choi, K.Y. Influence of Substrate Composition and Container Size on the Growth of Tissue Culture Propagated Apple Rootstock Plants. Agronomy 2021, 11, 2450. [Google Scholar] [CrossRef]
- Jankauskienė, J.; Brazaitytė, A.; Viškelis, P. Effect of different growing substrates on physiological processes, productivity and quality of tomato in soilless culture. In Soilless Culture. Use of Substrates for the Production of Quality Horticultural Crops; IntechOpen: Rijeka, Croatia, 2015; pp. 99–124. [Google Scholar]
- Raja, W.H.; Kumawat, K.L.; Sharma, O.C.; Sharma, A.; Mir, J.I.; Nabi, S.U.; Qureshi, I.; LAL, S. Effect of different substrates on growth and quality of Strawberry cv. chandler in soilless culture. Pharma Innov. J. 2018, 7, 449–453. [Google Scholar]
- Roosta, H.R.; Afsharipoor, S. Effects of different cultivation media on vegetative growth, ecophysiological traits and nutrients concentration in strawberry under hydroponic and aquaponic cultivation systems. Adv. Environ. Biol. 2012, 6, 543–555. [Google Scholar]
- Godara, A.K.; Sharma, V.K.; Beniwal, V. Effects of substrates and containers on root system of hydroponically grown strawberry (Fragaria × ananassa Duch) under greenhouse. Bangladesh J. Bot. 2016, 45, 1083–1089. [Google Scholar]
- El-Sayed, S.F.; Hassan, H.A.; Abul-Soud, M.; Gad, D.A. Effect of Different Substrates and Nutrient Solutions on Vegetative Growth, Mineral Content, Production and Fruit Quality of Strawberry. Zagazig J. Agric. Res. 2016, 43, 1919–1938. [Google Scholar]
- Tehranifar, A.; Poostchi, M.; Arooei, H.; Nematti, H. Effects of Seven Substrates on Qualitative and Quantitative Characteristics of Three Strawberry Cultivars under Soilless Culture; Prange, R.K., Bishop, S.D., Eds.; ISHS Acta Horticulturae: Leuven, Belgium, 2008; p. 53. [Google Scholar]
- Ameri, A.; Tehranifar, A.; Davarynejad, G.H.; Shoor, M. The effects of substrate and cultivar in quality of strawberry. J. Biol. Environ. Sci. 2012, 6, 181–188. [Google Scholar]
- Ercisli, S.; Sahin, U.; Esitken, A.; Anapali, O. Effects of some growing media on the growth of strawberry cvs. ‘Camarosa’ and ‘Fern’. Acta Agrobot. 2005, 58, 185–191. [Google Scholar] [CrossRef]
- Mader, J. Plant Growth in Aquaponics System through Comparison of Different Plant Media; Senior Honors Project: Lynchburg, VA, USA, 2012; p. 23. [Google Scholar]
- Paungfoo-Lonhienne, C.; Lonhienne, T.G.; Rentsch, D.; Robinson, N.; Christie, M.; Webb, R.I.; Gamage, H.K.; Carroll, B.J.; Schenk, P.M.; Schmidt, S. Plants can use protein as a nitrogen source without assistance from other organisms. Proc. Natl. Acad. Sci. USA 2008, 105, 4524–4529. [Google Scholar] [CrossRef]
- Senbayram, M.; Gransee, A.; Wahle, V.; Thiel, H. Role of magnesium fertilisers in agriculture: Plant–soil continuum. Crop Pasture Sci. 2015, 66, 1219–1229. [Google Scholar] [CrossRef]
- Tsuchiya, C.; Sakata, T.; Sugita, H. Novel ecological niche of Cetobacterium somerae, an anaerobic bacterium in the intestinal tracts of freshwater fish. Lett. Appl. Microbiol. 2008, 46, 43–48. [Google Scholar] [CrossRef]
- Eck, M.; Sare, A.R.; Massart, S.; Schmautz, Z.; Junge, R.; Smits, T.H.; Jijakli, M.H. Exploring bacterial communities in aquaponic systems. Water 2019, 11, 260. [Google Scholar] [CrossRef]
- Dempsey, W.B. Biosynthesis of vitamin B6 by bacteria. J. Bacteriol. 1967, 93, 1179. [Google Scholar] [CrossRef] [PubMed]
- Eck, M. Taxonomic Characterisation of Bacteria Communities from Water of Diversified Aquaponic Systems. Doctoral Dissertation, University of Liège, Liège, Belgium, 2017. [Google Scholar]
- Vacheron, J.; Desbrosses, G.; Bouffaud, M.L.; Touraine, B.; Moënne-Loccoz, Y.; Muller, D.; Legendre, L.; Wisniewski-Dyé, F.; Prigent-Combaret, C. Plant growth-promoting rhizobacteria and root system functioning. Front. Plant Sci. 2013, 4, 356. [Google Scholar] [CrossRef]
- Miret, J.A.; Munné-Bosch, S. Plant amino acid-derived vitamins: Biosynthesis and function. Amino Acids 2014, 46, 809–824. [Google Scholar] [CrossRef] [PubMed]
- Marschner, P.; Rengel, Z. Nutrient availability in soils. In Marschner’s Mineral Nutrition of Higher Plants; Academic Press: Cambridge, MA, USA, 2012; pp. 315–330. [Google Scholar]
- Chennappa, G.; Udaykumar, N.; Vidya, M.; Nagaraja, H.; Amaresh, Y.S.; Sreenivasa, M.Y. Azotobacter—A natural resource for bioremediation of toxic pesticides in soil ecosystems. In New and Future Developments in Microbial Biotechnology and Bioengineering; Elsevier: Amsterdam, The Netherlands, 2019; pp. 267–279. [Google Scholar]
- Baya, A.M.; Boethling, R.S.; Ramos-Cormenzana, A. Vitamin production in relation to phosphate solubilization by soil bacteria. Soil Biol. Biochem. 1981, 13, 527–531. [Google Scholar] [CrossRef]
- Mène-Saffrané, L. Vitamin E biosynthesis and its regulation in plants. Antioxidants 2018, 7, 2. [Google Scholar] [CrossRef] [PubMed]


Publisher’s Note: MDPI stays neutral with regard to jurisdictional claims in published maps and institutional affiliations. |
© 2022 by the authors. Licensee MDPI, Basel, Switzerland. This article is an open access article distributed under the terms and conditions of the Creative Commons Attribution (CC BY) license (https://creativecommons.org/licenses/by/4.0/).