1. Introduction
Microplastics have been detected in soils worldwide, indicating their widespread distribution. In agricultural soils, the primary sources of such contaminants include sewage sludge, coated fertilisers irrigation water, and agrochemicals, whereas secondary sources include the gradual breakdown of larger plastic materials, such as mulching and greenhouse films [
1,
2,
3].
Alterations in soil properties due to microplastic pollution may have cascading effects on nutrient cycling, water retention, plant growth, and soil fertility [
4,
5]. Soil properties, such as texture, organic matter content, and pH, can influence microplastic sorption, transport, and degradation, thereby influencing their potential to affect soil functioning [
6,
7]. Therefore, it is crucial to investigate how the interactions between microplastics and soil properties vary across different soil types. Understanding the interactions between microplastics and soil properties will help us develop effective strategies to mitigate microplastic pollution in terrestrial ecosystems.
Studies have shown that high concentrations of microplastic contaminants in various soil types affect soil quality and fertility by altering its structure, bulk density, and water-holding capacity [
8,
9,
10,
11].
Changes in the properties of the soil can indirectly cause microplastic-induced changes in crop growth. Some changes in soil properties can lead to crop water stress. Hazrati et al. [
12] found that the chlorophyll fluorescence parameters can be used to reflect the changes in photosynthesis under any environmental stress. Under stress conditions, the photosynthetic capacity of plants is weakened, primarily due to the damage of photosystem II (PSII) activity, which is its most sensitive component [
13,
14].
Our previous research in silty loam soil [
15] revealed that all three types of microplastic contamination (HDPE, PVC, and PS) significantly reduced the bulk density measured after the growing period (GP), while HDPE treatment increased hydraulic conductivity and water sorptivity. Statistically significant changes in soil water repellency (SWR) and radish growth in the microplastic treatments were not observed at the end of GP. It is well known that clay minerals can alleviate SWR [
16] and that sandy soil contains much less of them than the silty loam soil used in our previous study. In this study, we wanted to determine how soil water repellency induced by adding microplastics could affect soil properties and radish growth in sandy soil.
The objective of this study was to estimate the effect of the addition of three microplastics (high-density polyethylene (HDPE), polyvinyl chloride (PVC), and polystyrene (PS)) at a concentration of 5% (w/w) to sandy soil on soil water repellency (persistence and severity), selected soil properties (bulk density, water sorptivity, hydraulic conductivity, and persistence and severity of soil water repellency), and crop characteristics (fresh and dry weight, maximum photochemical efficiency of PSII, and nutrient content) of radish (Raphanus sativus L.). We hypothesised hat contamination of sandy soil with microplastics would cause (1) an increase in the persistence and severity of SWR, (2) a decrease in bulk density, (3) water sorptivity, (4) hydraulic conductivity, and (5) radish growth. Microplastic contamination may drive changes in SWR, which subsequently influences water sorptivity and hydraulic conductivity. These changes collectively may contribute to a less favourable growth environment, potentially leading to impaired radish growth.
2. Materials and Methods
The same procedure was used to process three types of plastic: high-density polyethylene (HDPE), polyvinyl chloride (PVC) + CaCO3 composite, and polystyrene (PS). We chose HDPE and PS for our study due to their versatility and everyday usage in various applications. We selected a PVC and CaCO3 composite, which is readily available and has a chance of entering the environment through crushed landfill waste or unlicensed waste management. The specific effect of limestone was not observed in this study, although the role of additives in microplastics, in general, is still a topic of interest.
The plastic materials underwent milling and sieving to achieve a powder with a particle size <400 μm. The detailed characteristics of the plastic material are presented in
Table 1.
The studied soil was sampled from an agricultural field near Borský Mikuláš village in the Borská nížina Lowland (southwestern Slovakia). At the time of sampling, maise was grown in the study field. The region has a warm temperate, fully humid climate with a hot summer (Cfb) [
17], a mean annual temperature of 9 °C, and a mean annual precipitation of 600 mm, mainly during the summer. The soil of the Borský Mikuláš site is classified as Fluvic Umbrisol and has a sandy texture [
18], with sand, silt, and clay contents of 89.8%, 6.7%, and 3.5%, respectively; organic carbon content of 0.99%; and pH (H
2O) of 7.29.
Collected soil was homogenised by a hammer mill, sieved (2.5 mm mesh size), and mixed with each microplastic at a concentration of 5% (weight of microplastics/total weight). This concentration was chosen because previous studies used 2.0–20.0% microplastics [
9,
19,
20,
21,
22,
23]. To account for microplastic content growth over time, we added 5.0% microplastics (
w/
w) to the soil, as reported by Fei et al. [
24] and Ren et al. [
25]. The soil was prepared separately for each pot (200 mm × 150 mm × 150 mm, 3000 mL). Microplastics were separated manually and mixed with the soil for 5 min in a large container to help provide an equal distribution of microplastics throughout the soil. Then, each pot was filled with the same substrate or clean soil volume to reach an equal bulk density within a given treatment. All pots were then equilibrated under laboratory conditions for 14 days, during which three wetting–drying cycles were conducted.
As microplastics may affect soil water availability, radish was chosen as a plant with a low water stress level [
26]. The semiearly variety of radish (
Raphanus sativus L. var. sativus) specific for year-round cultivation is large and spherical with light red skin and has a growing season of 33–37 days.
The laboratory-performed pot experiments were conducted with three different microplastics treatments (PS, HDPE, and PVC) and a control group, with five replicates for each variant. In total, 20 pots were cultivated in a natural-light environment, with a temperature range of 23–25 °C and a humidity level of 50–60%. The pots were watered every other day to reach 20% soil moisture. Plants were grown from 19 October to 2 December 2022. After the growing period, the infiltration experiments were carried out first, followed by radish harvesting and collection of undisturbed soil samples to determine the bulk density and disturbed soil samples for contact angle measurements.
2.1. Measurements of Soil Properties
Measurements of the soil’s volumetric water content (
θ (–)) were obtained using a calibrated ECH
2O Check moisture meter and an ECH
2O EC-5 soil moisture sensor from Decagon [
27].
The soil’s bulk density (
ρd, g cm
−3) was determined using the core method [
28]. It was calculated by dividing the mass of the oven-dried (40 °C) soil in a 100 cm
3 steel cylinder by the volume of the cylinder.
Water infiltration measurements were performed using a Minidisk Infiltrometer (MDI) from Decagon/METER Group (Pullman, USA) at a pressure head of
h0 = −2 cm. To mitigate boundary effects, the pot diameter was 3.5 times larger than the MDI base diameter, as recommended by Bordoloi et al. [
29]. The cumulative infiltration (
I) was computed using the Philip infiltration equation:
where
C1,
C2,
C3, …, and
Cm are coefficients, and
t is time.
The first term of the Philip infiltration equation (
I =
C1t1/2) was used for the estimation of the water sorptivity (
Sw(−2 cm)) during early-time (60–180 s) infiltration of water [
30]:
Capillarity dominates the process during this time, neglecting the other terms of the Philip infiltration equation.
Zhang’s ([
31] 1997) method was used to estimate hydraulic conductivity
k(−2 cm). It involves measuring cumulative infiltration against time and fitting the results with the function
I =
C1t1/2 +
C2t, which comprises the initial two terms of the Philip infiltration Equation (1). The hydraulic conductivity (
k(−2 cm)) is then computed according to the following equation:
where
C2 (m s
−1) represents the slope of the curve obtained by plotting cumulative infiltration against the square root of time, and
A relates to the van Genuchten parameters for a given soil type to the suction rate and radius of the infiltrometer disk.
In this study, hydraulic conductivity (
k(−2 cm)) was estimated using Equation (3), with
A = 1.73 for sand and suction of
h0 = −2 cm as per the recommendation of the Minidisk Infiltrometer User’s Manual [
32].
A WDPT test was used to determine the persistence of soil water repellency in a climate-controlled laboratory. A 50 ± 5 μL water drop was placed on the soil surface directly in the pots using a standard medicine dropper, and the time for complete penetration was recorded. Three measurements were taken in each pot, and the water drops were covered with Petri dishes to prevent evaporation. Additionally, a standardised droplet release height of 10 mm above the soil surface was implemented to reduce the impact on the soil surface [
33,
34]. The WDPT test measures the duration of strong water repellency in the contact zone of a water droplet [
35]. The persistence of soil water repellency can be classified into five categories: wettable or non-water-repellent soil (WDPT < 5 s), slightly water-repellent soil (WDPT = 5–60 s), strongly water-repellent soil (WDPT = 60–600 s), severely water-repellent soil (WDPT = 600–3600 s), and extremely water-repellent soil (WDPT > 3600 s) [
36].
The severity of soil water repellency was assessed by the sessile drop method. In this method, a water drop was placed on the soil surface, and the static contact angle (CA) of the drop was estimated using dpiMAX version 1.51.90.75(DataPhysics Instruments GmbH, Filderstadt, Germany) from the image recordings obtained with an OCA 11 optical goniometer (DataPhysics Instruments GmbH, Filderstadt, Germany). Five disturbed soil samples from the soil surface in the pot (weighing approx. 5 g) were taken for each treatment (i.e., 20 samples in total), and the measurement was repeated thrice, each time on a new sample (tape covered with soil particles) prepared according to the procedure described by Bachmann et al. [
37]. A glass slide was covered with a double-sided adhesive tape. Then, the soil particles were pressed to the tape for several seconds, after which the slide was shaken carefully to remove the unglued soil particles. A drop of deionised water (5 μL) was deposed on the sample surface with a syringe needle with an outer diameter of 0.91 mm. The CA was estimated after 1 s, when mechanical disruption of the surface was complete after drop placement. CA was evaluated by analysing the shape of the drop (ellipsoid approximation) and fitting tangents on both sides of the drop using SCA20 software [
38], with the CA of each drop determined as the average of the CA on the left and right sides of the drop. Papierowska et al. [
39] presented the thresholds of CA classes corresponding to water drop penetration time (WDPT) and RI classes and their descriptive labels.
2.2. Biological and Chemical Analyses
In the growth analysis, the weight of fresh and dry biomass of aboveground parts and bulbs was measured. The plants were harvested, cleaned, and dried in an oven at 60 °C for five days before weighing the dry biomass.
Photosystem II (PSII) is a membrane protein supercomplex that plays a crucial role in the primary reactions of photosynthesis. The maximum quantum yield for stable-charge separation of PSII (
Fv/
Fm) that is frequently utilised to detect stress in plants can be determined from chlorophyll fluorescence measurements [
40] as:
where
F0 is the minimum fluorescence yield in the dark-adapted state, and
Fm is the maximum fluorescence yield in the dark-adapted state.
In this study, the Fv/Fm values were estimated in five plants for each microplastic variant from five repeated measurements by a portable, battery-powered FluorPen FP 110 PAM fluorometer (Photon Systems Instruments, Drásov, Czech Republic). The measurements were taken at the first right leaf located in the middle.
To extract macronutrients and essential elements from plant tissues, 1 g samples were digested on a hot plate (80 °C) by adding ultrapure concentrated HNO
3 and droplets of 30% (
v/
w) H
2O
2 until the digestion solution became white or colourless, indicating the end of the digestion process [
41]. Fe, Cu, Zn, and Mn were determined in an atomic absorption spectrophotometer (Varian–spectra A300 system, Varian Inc., Palo Alto, CA, USA), while P concentration was determined by a Shimadzu UV-1700 spectrophotometer (Shimadzu Corporation, Kyoto, Japan). A microprocessor flame photometer (Electronics India Model 1382, Electronics India Ltd., Mumbai, India) was used to determine K and Na. N concentration was determined using the Kjeldahl distillation–titration method [
42].
2.3. Statistical Analysis
The data were analysed using the omnibus normality test, which combines skewness and kurtosis tests. If the data passed the omnibus normality test, differences between parameters were evaluated using a single-factor ANOVA with Tukey’s honest significant difference (HSD) post hoc test. When the data did not follow a normal distribution, the Kruskal–Wallis test with multiple comparison Kruskal–Wallis Z test was employed. Normality assumption is not necessary for this distribution-free multiple comparison, which is meant for testing the pairs of medians after conducting the Kruskal–Wallis test. The statistical significance of the analysis was defined at
p < 0.05. All statistical analyses were performed using NCSS 12 version 12.0.18 statistical software [
43].
3. Results
3.1. The Impact of Microplastics on Soil Characteristics
The results of volumetric water content, bulk density, contact angle, hydraulic conductivity, and water sorptivity measurements are shown in
Table 2. The volumetric water content (
θ) of air-dried soil was measured one week after the last irrigation. The results showed a small range (0.020–0.024) with a low standard deviation. No statistically significant difference in
θ between the treatments indicated that changes in other soil parameters could not be attributed to soil water content.
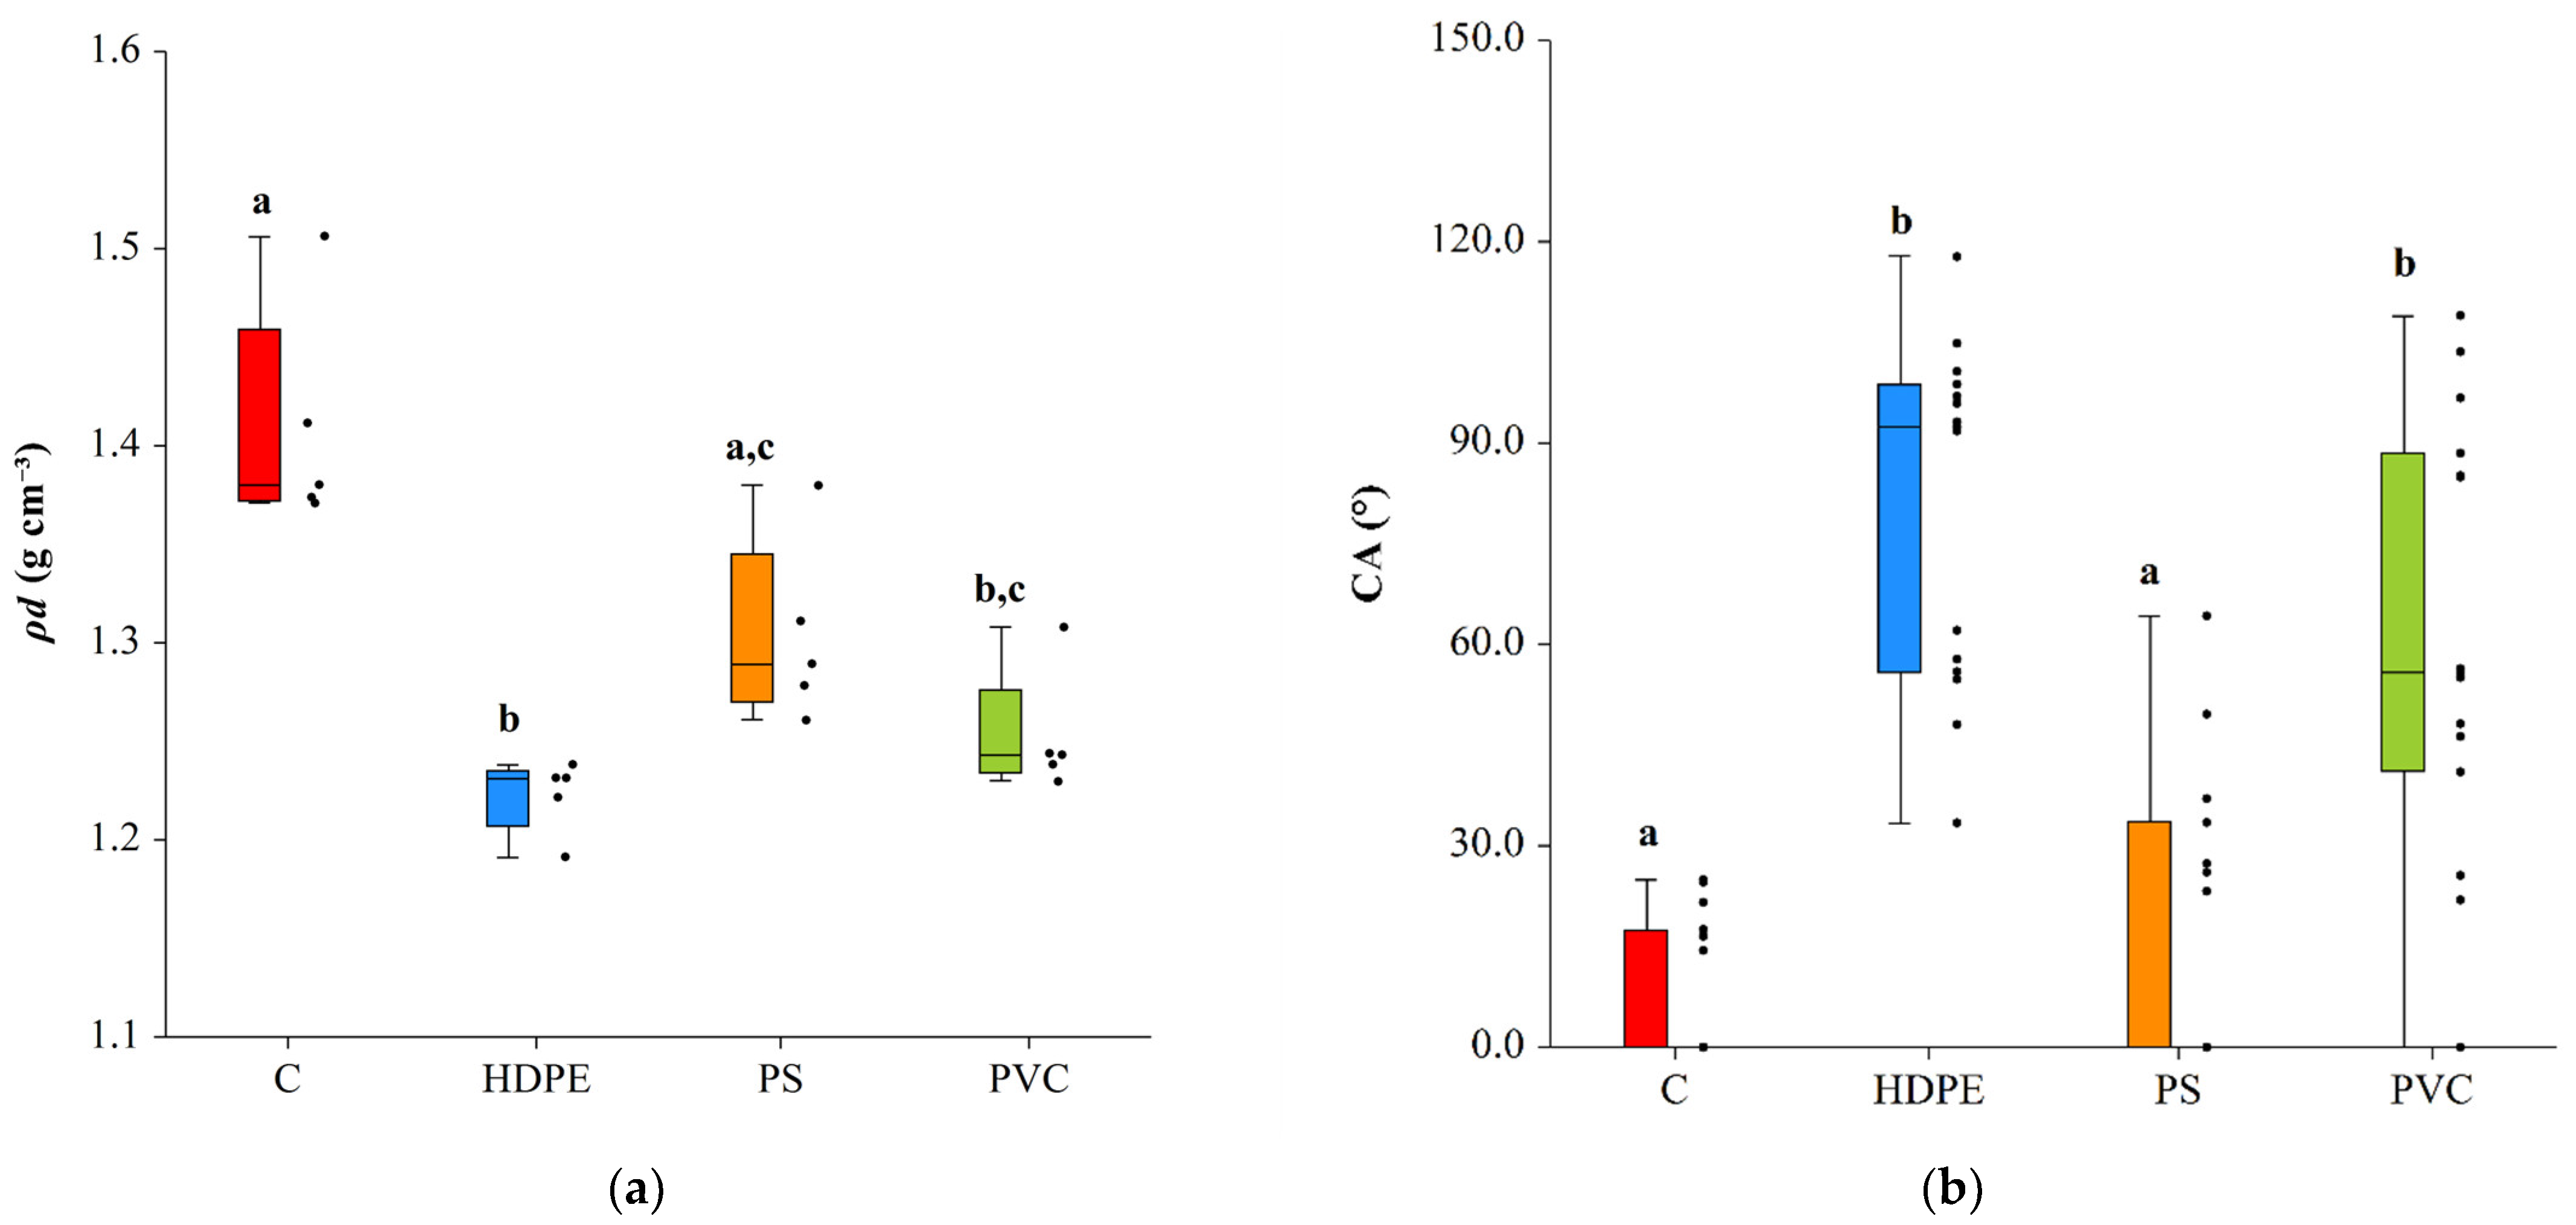
Our findings reveal a significant decrease in bulk density in HDPE and PVC treatments compared to the control, while the decrease in PS treatment was not significant, confirming our second hypothesis (
Figure 1a). Moreover, a clear and statistically significant difference between HDPE and PS treatment must be considered in further analysis.
A statistically significant increase in WDPT was observed in HDPE and PVC treatments compared to the control, whereas WDPT increased insignificantly in the PS treatment, confirming our first hypothesis (
Table 2).
Compared to the control, a statistically significant increase in static contact angle (CA) was found in the HDPE and PVC treatments, and a statistically insignificant increase in CA was observed in the PS treatment, which confirms our first hypothesis (
Table 2,
Figure 1b). According to Papierowska et al. [
39], soil with PS can be classified as wettable, soil with PVC as slightly hydrophobic, and soil with HDPE as moderately hydrophobic.
Compared to the control, a statistically significant decrease in hydraulic conductivity (
k(−2 cm)) was found in the HDPE and PVC treatments, and a statistically insignificant decrease was observed in the PS treatment, which confirms our fourth hypothesis. Smaller values of
k(−2 cm) were observed in the slightly hydrophobic HDPE and PVC treatments (
Figure 2a).
It was confirmed that our third hypothesis was true, as all microplastics treatments showed a statistically significant decrease in water sorptivity (
Sw(−2 cm)), consistent with the
k(−2 cm) results (
Figure 2b).
3.2. The Impact of Microplastics on Crop Characteristics
3.2.1. Effect of Microplastics on Crop Biomass
The fresh and dry weight of the radish biomass from all experimental treatments is presented in
Figure 3. It was found that adding microplastics to soil did not have a statistically significant effect on the biomass of radish plants, which contradicts our fifth hypothesis. Compared to the control, a slight increase in radish plant biomass was observed in the HDPE treatment, with a slight decrease in the PVC treatment.
3.2.2. Effect of Microplastics on the Maximum Photochemical Efficiency of PSII
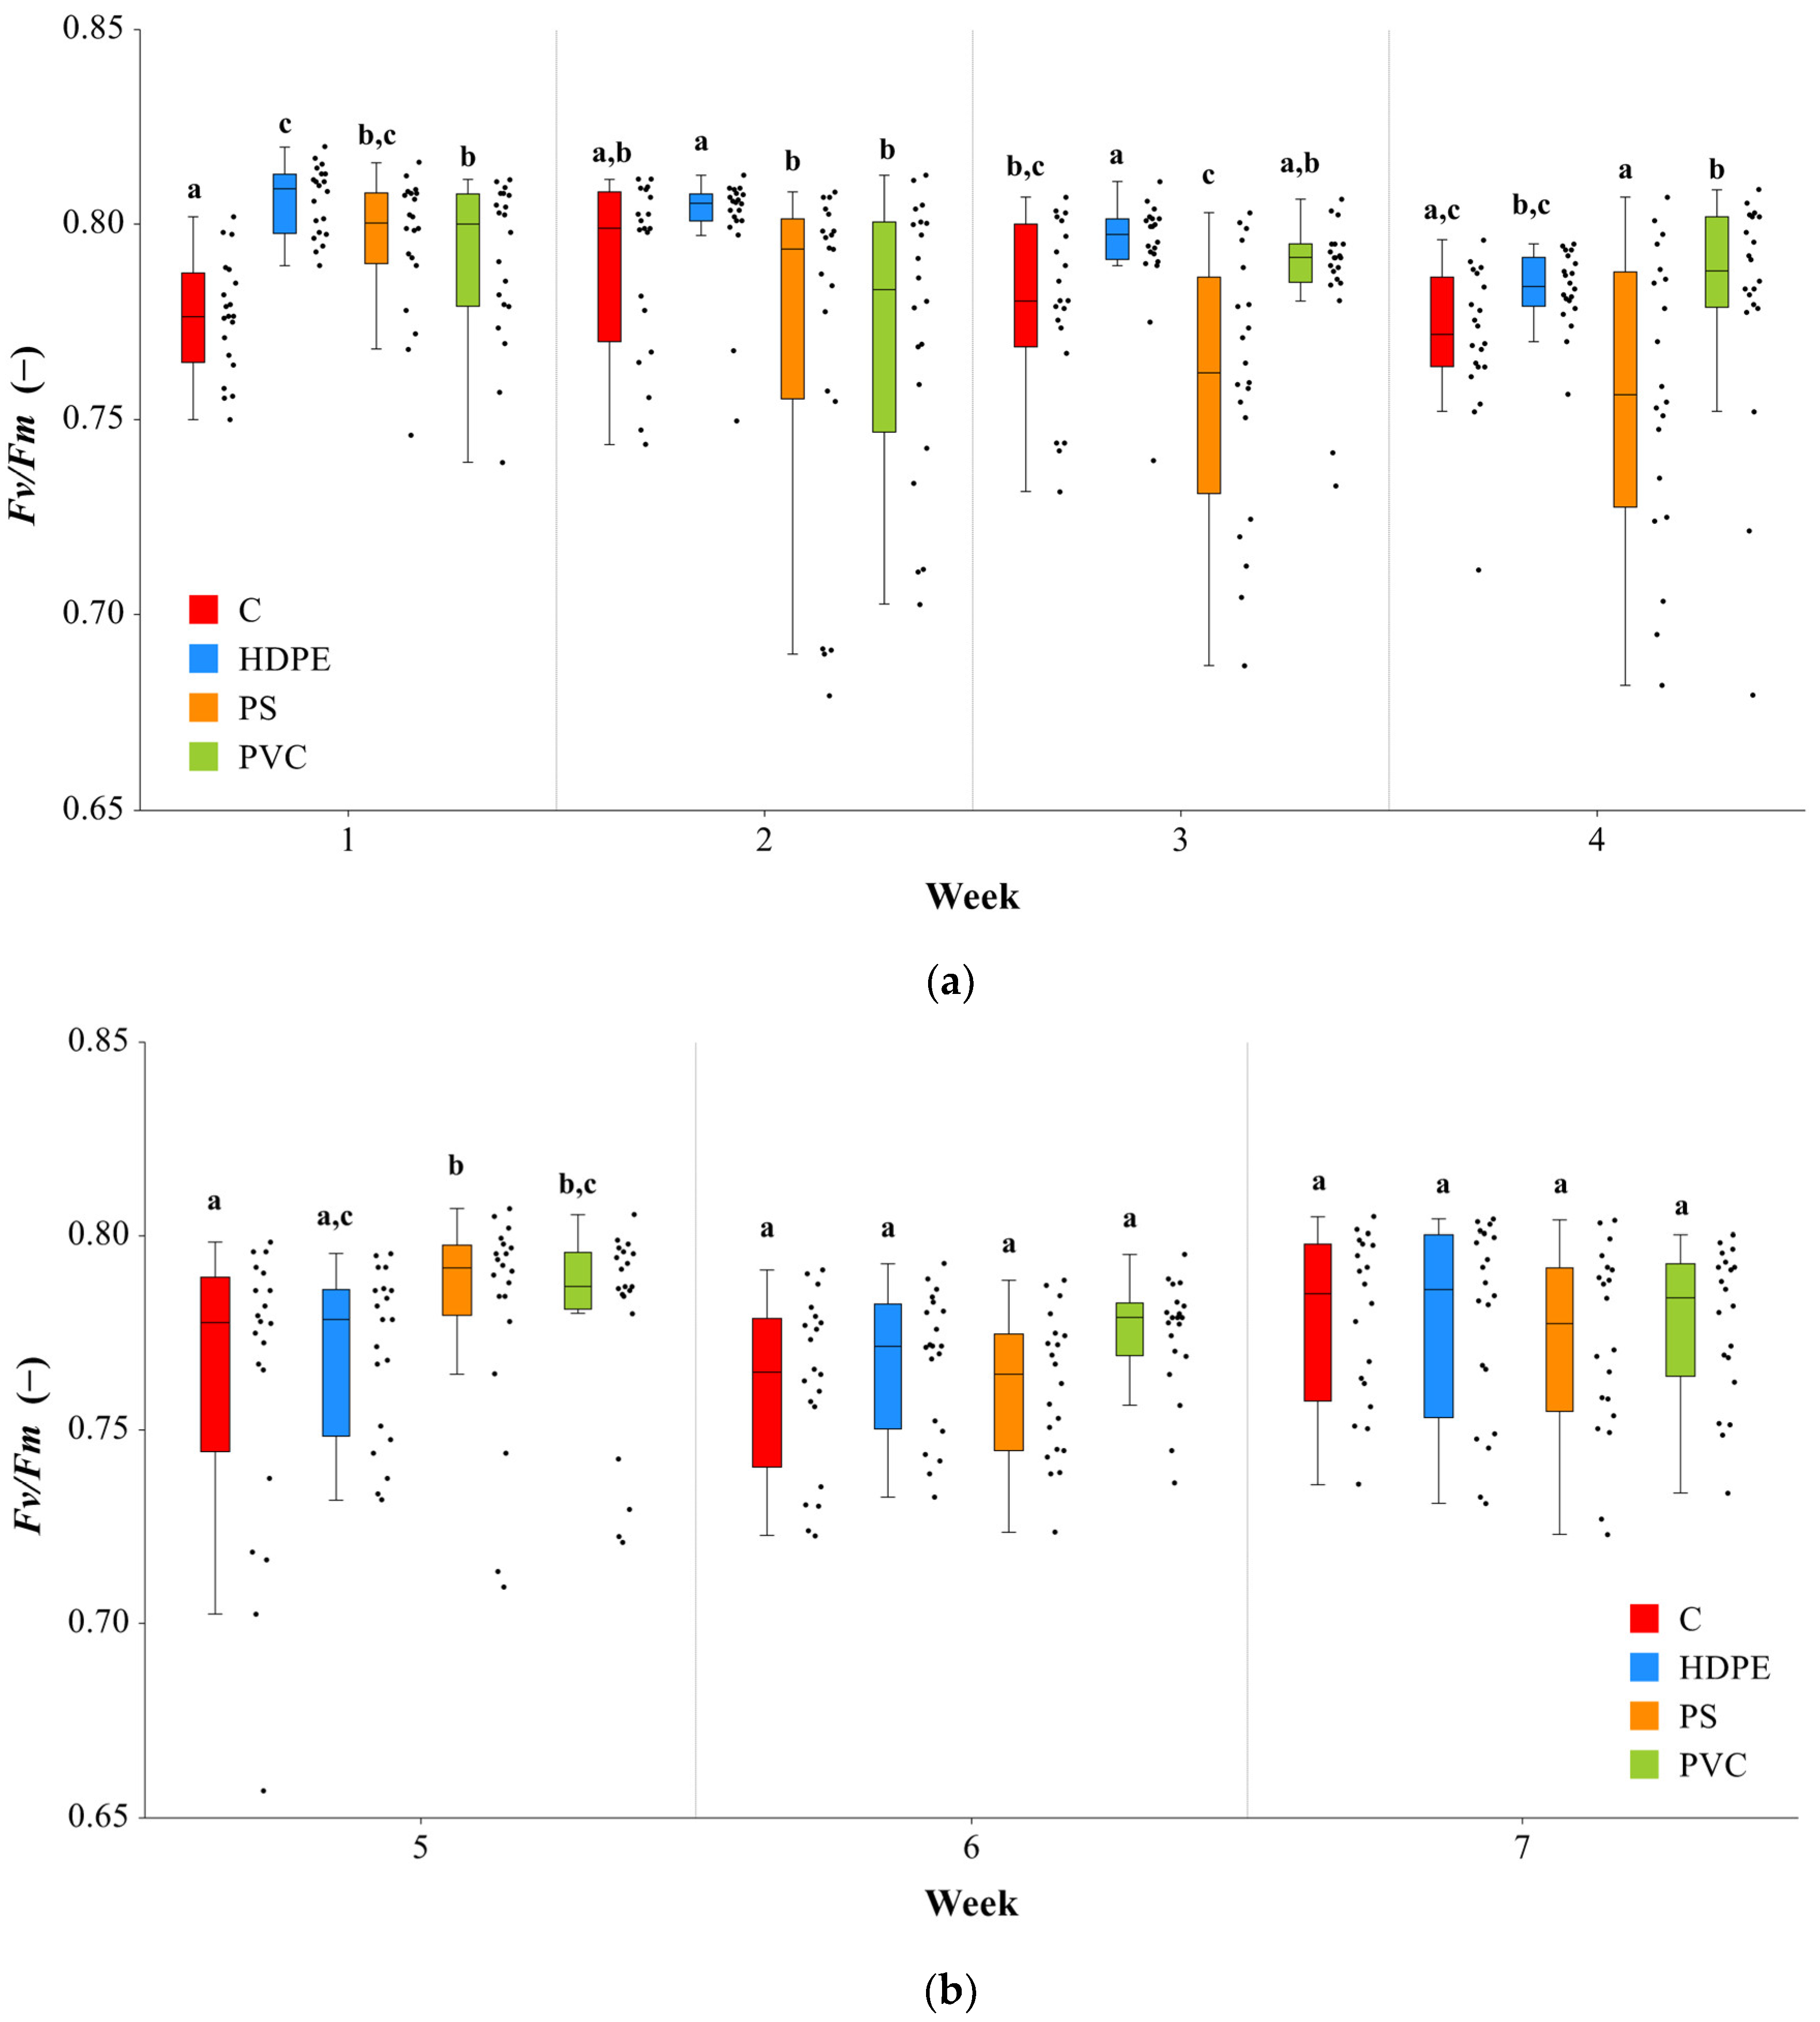
Measured values of the maximum photochemical efficiency of PSII (
Fv/
Fm) were evaluated during the seven-week growing period. In our study,
Fv/
Fm did not show any trend of the effect of microplastics on radish plants (
Figure 4). The
Fv/Fm ratio value is relatively stable under normal conditions. The
Fv/
Fm values of the microplastic treatments were higher than those of the control at the beginning of the growing season. Subsequently, there were fluctuations in values during our experiment, and the effect of microplastics on the plants was insignificant.
3.2.3. Effect of Microplastics on Nutrient Content in Crops
The nitrogen (N), phosphorus (P), and potassium (K) contents of radish plants were not significantly altered by microplastic contamination. A slight increase can be observed in the PVC treatment (
Table 3) compared to the other variants and the control. A microplastic-dependent decrease in the copper (Cu) content was found in all treatments compared to the control. In the PVC and PS treatments, plants showed lower amounts of magnesium (Mg) and iron (Fe) than the control. Differences in zinc (Zn) concentration in plants were low compared to the control. However, the microplastic-induced responses in biomass or photosynthetic efficiency did not correspond to the changes in crop element concentrations.
The Fv/Fm values of the microplastic treatments were higher than those of the control at the beginning of the growing season. Subsequently, there were fluctuations in values during our experiment, and the effect of microplastics on the plants was insignificant.
4. Discussion
The findings of our study provide new perspectives on how microplastics affect the properties of sandy soil and the growth of radishes. The addition of microplastics, specifically HDPE, PVC, and PS, significantly affected soil parameters such as bulk density, water repellency, hydraulic conductivity, and water sorptivity. The decrease in bulk density observed in all microplastic treatments aligns with a previous study by Machado et al. [
20], who found that soil contamination with six different microplastics (polyester fibres, polyamide beads, and four fragment types (polyethylene, polyester terephthalate, polypropylene, and polystyrene)) reduced the bulk density of loamy sand. Such an effect can be attributed to the lower density of microplastics compared to soil minerals. The effect of microplastics on bulk density can also be explained by their influence on pore space and particle interactions within the soil. In our study, the decrease in soil bulk density followed the order of microplastic density (PS > PVC > HDPE), which differs from the findings of Machado et al. [
19]. This suggests that the specific characteristics of microplastics and soil structure may play a role in determining the magnitude of bulk density changes. The decrease in bulk density in our study was solely due to the lower density of the microplastic particles, suggesting that interactions between the microplastic and sandy soil particles did not contribute to changes in pore space.
The increase in water drop penetration time (WDPT) and static contact angle (CA) observed in the HDPE and PVC treatments confirms the hypothesis that microplastics induce water repellency in the sandy soil. These findings align with the work of Cramer et al. [
44], who reported that PET particles induce soil water repellency in sand and that this effect is size-specific concerning the soil and microplastic particles. Microplastic particles can adhere to soil particles due to their hydrophobic nature. In sandy soils, microplastics accumulated at the soil–air interface create a layer with subcritical SWR. As water molecules encounter this layer, they experience an increased contact angle, resulting in inhibited infiltration. The formation of microplastic clusters further exacerbates the hydrophobicity by creating microscale air pockets that hinder water flow. Microplastic-induced SWR in the soil matrix is supported by the coarse nature of sandy soils, where the absence of fine particles limits the potential for capillary action and wettability enhancement. Furthermore, the capacity to physically coat hydrophobic microplastics is diminished due to the absence of micro- and nano-sized clay mineral particles. This absence prevents the disruption of the water-repellent effect and the promotion of wetting that clay minerals typically facilitate. In this context, microplastics in sandy soil disrupt the soil–water interface and weaken the soil’s hydrophilic properties.
Hydraulic conductivity, which represents the ability of water to move through the soil, was significantly decreased in the HDPE and PVC treatments, supporting the hypothesis that microplastics decrease hydraulic conductivity. These results contrast the findings of our previous research in silt loam soil [
15], suggesting that the impact of microplastics on hydraulic conductivity may vary depending on soil texture and the degree of water repellency induced by microplastics. The increased soil water repellency observed in this study indicates that water infiltration is impeded, potentially resulting in reduced water saturation and altered flow paths.
Water sorptivity, which reflects the ability of soil to absorb water rapidly through capillary action, was also significantly decreased in all microplastic treatments, supporting the hypothesis that microplastics affect water sorptivity. This decline can be attributed to the induced water repellency, which hinders water absorption through capillary action.
Regarding crop properties, this study did not find a statistically significant effect of microplastics on radish plant biomass. These results are consistent with the findings of Gong et al. [
45], who reported no significant impact of microplastic contamination on the biomass of radish and wheat. However, other studies have reported contradictory results, with some showing a reduction in root and shoot growth in pumpkins [
46] and a negative impact on plant growth biomass [
21]. The lack of consistency in these findings suggests that various factors, including plant species, microplastic type, exposure duration, and experimental conditions, may influence the effects of microplastics on crop biomass.
The maximum photochemical efficiency of PSII (Fv/Fm) did not show a consistent trend in response to microplastics. While initial increases in Fv/Fm were observed in the microplastic treatments compared to the control, these effects were not sustained and eventually returned to similar levels as the control. This suggests that microplastics may have transient effects on the early stages of plant growth or germination. Further research is needed to understand the underlying mechanisms.
The nutrient content of crops was not significantly altered by microplastic contamination, except for some minor changes in specific elements. These findings indicate that microplastics may not directly influence crop nutrient uptake or assimilation. The lack of correspondence between microplastic-induced changes in biomass or photosynthetic efficiency and crop element concentrations suggests complex interactions between microplastics and plant nutrient dynamics.
5. Conclusions
The purpose of this study was to investigate how the presence of microplastics in sandy soil affects both soil properties (including bulk density, water sorptivity, hydraulic conductivity, persistence, and severity of soil water repellency) and crop characteristics (such as fresh and dry weight, maximum photochemical efficiency of PSII, and nutrient content). By conducting this research, we aimed to provide valuable insights into the impact of microplastic contamination on agricultural systems.
Our findings demonstrate that the addition of microplastics induced an increase in the persistence and severity of soil water repellency, resulting in reduced water sorptivity and hydraulic conductivity. However, radish plant biomass is not significantly affected, likely due to the hydrophysical properties of sandy soil and plant adaptive responses. The coarse texture and larger particle size of sandy soil result in high hydraulic conductivity, which allows for rapid water movement and promotes aeration. Even if subcritical water repellency induced by microplastics was present in our experiment, it might not have impeded water movement enough to prevent plants from accessing water. Nevertheless, the increasing concentration of microplastics, especially HDPE and PVC, in sandy soils may pose a future problem by causing strong to extreme water repellency.
The addition of microplastics did not significantly impact the maximum photochemical efficiency of PSII, a measure of crop photosynthesis. Although the photosynthetic efficiency values fluctuated over time, they stabilised across all treatments by the end of the experiment. The nitrogen, phosphorus, potassium, and zinc contents in the crops were not significantly affected by microplastic contamination, but copper content was reduced in all treatments, and magnesium and iron were reduced in the PVC and PS treatments compared to the control. The changes in biomass or photosynthetic efficiency induced by microplastics did not correspond with changes in crop element concentrations.
Author Contributions
Conceptualization, L.L.; Data curation, L.T. and K.L.; Formal analysis, P.Š., K.L. and J.H.; Funding acquisition, L.L., J.H. and D.B.; Investigation, P.Š., L.B., L.T., K.L. and I.Z.; Methodology, P.Š., L.L., L.B., D.B. and I.Z.; Resources, L.L., J.H. and D.B.; Supervision, L.L. and J.H.; Validation, P.Š., L.L., L.T., K.L. and I.Z.; Visualization, P.Š.; Writing—original draft, P.Š. and L.B.; Writing—review and editing, P.Š., L.L., L.B., L.T., K.L., J.H., D.B. and I.Z. All authors have read and agreed to the published version of the manuscript.
Funding
This research was funded by the Slovak Scientific Grant Agency (VEGA) (project 2/0020/20), the Slovak Research and Development Agency (project APVV-19-0250), and the project “Sustainable smart farming systems taking into account the future challenges 313011W112” co-financed by the European Regional Development Fund within the operational program Integrated infrastructure.
Data Availability Statement
The data presented in this study are available upon request from the corresponding author. The data are not publicly available because researchers choose to withhold data temporarily to continue their investigations, build on the findings, and use the data for future publications.
Conflicts of Interest
The funders had no role in the design of the study; in the collection, analyses, or interpretation of data; in the writing of the manuscript; or in the decision to publish the results.
References
- Barnes, D.K.; Galgani, F.; Thompson, R.C.; Barlaz, M. Accumulation and fragmentation of plastic debris in global environments. Philos. Trans. R. Soc. B Biol. Sci. 2009, 364, 1985–1998. [Google Scholar] [CrossRef] [PubMed]
- Horton, A.A.; Svendsen, C.; Williams, R.J.; Spurgeon, D.J. Microplastics in freshwater and terrestrial environments: Evaluating the current understanding to identify the knowledge gaps and future research priorities. Sci. Total Environ. 2017, 586, 127–141. [Google Scholar] [CrossRef] [PubMed]
- Huerta Lwanga, E.; Gertsen, H.; Gooren, H.; Peters, P.; Salánki, T.; van der Ploeg, M.; Geissen, V. Microplastics in the terrestrial ecosystem: Implications for Lumbricus terrestris (Oligochaeta, Lumbricidae). Environ. Sci. Technol. 2016, 50, 2685–2691. [Google Scholar] [CrossRef] [PubMed]
- Li, J.; Zhang, H.; Ji, R.; Liu, S.; Zhang, D.; Yu, J.; Zhou, Q. Influence of microplastics on the intestinal microbial community composition of zebrafish. Environ. Pollut. 2018, 235, 774–783. [Google Scholar]
- Wang, F.; Shi, Y.; Han, M.; Yan, Z.; Zhang, J.; Liu, Q.; Zhou, Q. The impacts of microplastics on soil microorganisms and ecosystem functioning: A critical review. Earth Sci. Rev. 2020, 210, 103346. [Google Scholar]
- Karanasios, K.A.; Dobson, P.; Whitby, C. Investigating microplastic size and settling velocities in wastewater treatment plants and potential implications on soil systems. Sci. Total Environ. 2020, 705, 135876. [Google Scholar]
- Zhang, Y.; Jiang, W.; Li, D.; Ren, H.; Zhang, C.; Wu, X. Effects of plastic mulch film residues on wheat growth and soil properties. J. Hazard. Mater. 2019, 364, 769–777. [Google Scholar]
- Mbachu, O.; Jenkins, G.; Kaparaju, P.; Pratt, C. The rise of artificial soil carbon inputs: Reviewing microplastic pollution effects in the soil environment. Sci. Total Environ. 2021, 780, 146569. [Google Scholar] [CrossRef]
- Qi, Y.; Beriot, N.; Gort, G.; Lwanga, E.H.; Gooren, H.; Yang, X.; Geissen, V. Impact of plastic mulch film debris on soil physicochemical and hydrological properties. Environ. Pollut. 2020, 266, 115097. [Google Scholar] [CrossRef]
- Yu, H.; Zhang, Z.; Zhang, Y.; Song, Q.; Fan, P.; Xi, B.; Tan, W. Effects of microplastics on soil organic carbon and greenhouse gas emissions in the context of straw incorporation: A comparison with different types of soil. Environ. Pollut. 2021, 288, 117733. [Google Scholar] [CrossRef]
- Yu, Z.; Song, S.; Xu, X.; Ma, Q.; Lu, Y. Sources, migration, accumulation and influence of microplastics in terrestrial plant communities. Environ. Exp. Bot. 2021, 192, 104635. [Google Scholar] [CrossRef]
- Hazrati, S.; Tahmasebi-Sarvestani, Z.; Modarres-Sanavy, S.A.M.; Mokhtassi-Bidgoli, A.; Nicola, S. Effects of water stress and light intensity on chlorophyll fluorescence parameters and pigments of Aloe vera L. Plant Physiol. Biochem. 2016, 106, 141–148. [Google Scholar] [CrossRef] [PubMed]
- Ashraf, M.H.P.J.C.; Harris, P.J. Photosynthesis under stressful environments: An overview. Photosynthetica 2013, 51, 163–190. [Google Scholar] [CrossRef]
- Filaček, A.; Živčák, M.; Ferroni, L.; Barboričová, M.; Gašparovič, K.; Yang, X.; Landi, M.; Brestič, M. Pre-acclimation to elevated temperature stabilises the activity of photosystem I in wheat plants exposed to an episode of severe heat stress. Plants 2022, 11, 616. [Google Scholar] [CrossRef]
- Botyanszká, L.; Šurda, P.; Vitková, J.; Lichner, Ľ.; Igaz, D. Effect of microplastics on silty loam soil properties and radish growth. J. Hydrol. Hydromech. 2022, 70, 321–329. [Google Scholar] [CrossRef]
- Lichner, L.; Dlapa, P.; Doerr, S.H.; Mataix-Solera, J. Evaluation of different clay minerals as additives for soil water repellency alleviation. Appl. Clay Sci. 2006, 31, 238–248. [Google Scholar] [CrossRef]
- Kottek, M.; Grieser, J.; Beck, C.; Rudolf, B.; Rubel, F. World map of the Köppen-Geiger climate classification updated. Meteorol. Z. 2006, 15, 259–263. [Google Scholar] [CrossRef]
- WRB. World Reference Base for Soil Resources 2014; Update 2015; World Soil Resources Reports No. 106.; FAO: Rome, Italy, 2015; 192 p. [Google Scholar]
- Machado, A.A.d.S.; Lau, C.W.; Till, J.; Kloas, W.; Lehmann, A.; Becker, R.; Rillig, M.C. Impacts of microplastics on the soil biophysical environment. Environ. Sci. Technol. 2018, 52, 9656–9665. [Google Scholar] [CrossRef]
- Machado, A.A.D.S.; Lau, C.W.; Kloas, W.; Bergmann, J.; Bachelier, J.B.; Faltin, E.; Becker, R.; Görlich, A.S.; Rillig, M.C. Microplastics can change soil properties and affect plant performance. Environ. Sci. Technol. 2019, 53, 6044–6052. [Google Scholar] [CrossRef]
- Zang, H.D.; Zhou, J.; Marshall, M.R.; Chadwick, D.R.; Wen, Y.; Jones, D.L. Microplastics in the agroecosystem: Are they an emerging threat to the plant-soil system? Soil Biol. Biochem. 2020, 148, 107926. [Google Scholar] [CrossRef]
- Meng, F.; Yang, X.; Riksen, M.; Xu, M.; Geissen, V. Response of common bean (Phaseolus vulgaris L.) growth to soil contaminated with microplastics. Sci. Total Environ. 2021, 755, 142516. [Google Scholar] [CrossRef] [PubMed]
- Guo, Z.Q.; Li, P.; Yang, X.M.; Wang, Z.H.; Lu, B.B.; Chen, W.J.; Wu, Y.; Li, G.W.; Zhao, Z.W.; Liu, G.B.; et al. Soil texture is an important factor determining how microplastics affect soil hydraulic characteristics. Environ. Int. 2022, 165, 107293. [Google Scholar] [CrossRef] [PubMed]
- Fei, Y.; Huang, S.; Zhang, H.; Tong, Y.; Wen, D.; Xia, X.; Wang, H.; Luo, Y.; Barceló, D. Response of soil enzyme activities and bacterial communities to the accumulation of microplastics in an acid cropped soil. Sci. Total Environ. 2020, 707, 135634. [Google Scholar] [CrossRef] [PubMed]
- Ren, X.; Tang, J.; Liu, X.; Liu, Q. Effects of microplastics on greenhouse gas emissions and the microbial community in fertilized soil. Environ. Pollut. 2020, 256, 113347. [Google Scholar] [CrossRef]
- Stagnari, F.; Galieni, A.; D’Egidio, S.; Pagnani, G.; Pisante, M. Responses of radish (Raphanus sativus) to drought stress. Ann. Appl. Biol. 2018, 172, 170–186. [Google Scholar] [CrossRef]
- Decagon. EC-5 Soil Moisture Sensor–User’s Manual; Version 2; Decagon Devices, Inc.: Pullman, WA, USA, 2012. [Google Scholar]
- ISO 11272; Soil Quality. Determination of Dry Bulk Density. International Organization of Standardization: Geneva, Switzerland, 2017.
- Bordoloi, S.; Yamsani, S.K.; Garg, A.; Sekharan, S. Critical assessment of infiltration measurements for soils with varying fine content using a mini disk infiltrometer. J. Test. Eval. 2019, 47, 868–888. [Google Scholar] [CrossRef]
- Hallett, P.D. A brief overview of the causes, impacts and amelioration of soil water repellency—A review. Soil Water Res. 2008, 3, 521–528. [Google Scholar] [CrossRef]
- Zhang, R. Determination of soil sorptivity and hydraulic conductivity from the disk infiltrometer. Soil Sci. Soc. Am. J. 1997, 61, 1024–1030. [Google Scholar] [CrossRef]
- Decagon. Mini Disk Infiltrometer—User’s Manual; Version 10; Decagon Devices, Inc.: Pullman, WA, USA, 2012. [Google Scholar]
- Doerr, S.H. On standardising the “Water Drop Penetration Time” and the “Molarity of an Ethanol Droplet” techniques to classify soil hydrophobicity: A case study using medium textured soils. Earth Surf. Process. Landf. 1998, 23, 663–668. [Google Scholar] [CrossRef]
- Tinebra, I.; Alagna, V.; Iovino, M.; Bagarello, V. Comparing different application procedures of the water drop penetration time test to assess soil water repellency in a fire affected Sicilian area. Catena 2019, 177, 41–48. [Google Scholar] [CrossRef]
- Dekker, L.W.; Ritsema, C.J.; Oostindie, K.; Moore, D.; Wesseling, J.A. Methods for determining soil water repellency on field-moist samples. Water Resour. Res. 2009, 45, W00D33. [Google Scholar] [CrossRef]
- Bisdom, E.B.A.; Dekker, L.W.; Schoute, J.F.T. Water repellency of sieve fractions from sandy soils and relationships with organic material and soil structure. Geoderma 1993, 56, 105–118. [Google Scholar] [CrossRef]
- Bachmann, J.; Horton, R.; van der Ploeg, R.R.; Woche, S. Modified sessile drop method for assessing initial soil-water contact angle of sandy soil. Soil Sci. Soc. Am. J. 2000, 64, 564–567. [Google Scholar] [CrossRef]
- Goebel, M.-O.; Woche, S.K.; Abraham, P.M.; Schaumann, G.E.; Bachmann, J. Water repellency enhances the deposition of negatively charged hydrophilic colloids in a water-saturated sand matrix. Colloids Surf. A Physicochem. Eng. Asp. 2013, 431, 150–160. [Google Scholar] [CrossRef]
- Papierowska, E.; Matysiak, W.; Szatyłowicz, J.; Debaene, G.; Urbanek, E.; Kalisz, B.; Łachacz, A. Compatibility of methods used for soil water repellency determination for organic and organo-mineral soils. Geoderma 2018, 314, 221–231. [Google Scholar] [CrossRef]
- Parkhill, J.P.; Maillet, G.; Cullen, J.J. Fluorescence-based maximal quantum yield for PSII as a diagnostic of nutrient stress. J. Phycol. 2001, 37, 517–529. [Google Scholar] [CrossRef]
- Jones, J.B.; Case, V.W. Sampling, Handling and Analysing Plant Tissue Samples. In Soil Testing and Plant Analysis, 3rd ed.; Westerman, R.L., Ed.; Soil Science Society of America: Madison, WI, USA, 1990; pp. 389–427. [Google Scholar]
- Isaac, R.A.; Johnson, W.C. Determination of total nitrogen in plant tissue, using a block digestor. J. Assoc. Off. Anal. Chem. 1976, 59, 98–100. [Google Scholar] [CrossRef]
- NCSS L.L.C. NCSS 12 Statistical Software, NCSS L.L.C.: Kaysville, UT, USA, 2018.
- Cramer, A.; Benard, P.; Zarebanadkouki, M.; Kaestner, A.; Carminati, A. Microplastic induces soil water repellency and limits capillary flow. Vadose Zone J. 2023, 22, e20215. [Google Scholar] [CrossRef]
- Gong, W.; Zhang, W.; Jiang, M.; Li, S.; Liang, G.; Bu, Q.; Xua, L.; Zhu, H.; Lu, A. Species-dependent response of food crops to polystyrene nanoplastics and microplastics. Sci. Total Environ. 2021, 796, 148750. [Google Scholar] [CrossRef]
- Colzi, I.; Renna, L.; Bianchi, E.; Castellani, M.B.; Coppi, A.; Pignattelli, S.; Loppi, S.; Gonnelli, C. Impact of microplastics on growth, photosynthesis and essential elements in Cucurbita pepo L. J. Hazard. Mater. 2022, 423, 127238. [Google Scholar] [CrossRef]
| Disclaimer/Publisher’s Note: The statements, opinions and data contained in all publications are solely those of the individual author(s) and contributor(s) and not of MDPI and/or the editor(s). MDPI and/or the editor(s) disclaim responsibility for any injury to people or property resulting from any ideas, methods, instructions or products referred to in the content. |
© 2023 by the authors. Licensee MDPI, Basel, Switzerland. This article is an open access article distributed under the terms and conditions of the Creative Commons Attribution (CC BY) license (https://creativecommons.org/licenses/by/4.0/).

 ,
, 


