Article

Thermal Performance of a Flat-Plate Solar Collector for Drying Agricultural Crops

1
Department of Soils, Water and Agricultural Engineering, College of Agricultural and Marine Sciences, Sultan Qaboos University, Muscat 123, Oman
2
Department of Mechanical and Industrial Engineering, College of Engineering, Sultan Qaboos University, Muscat 123, Oman
3
Oil and Gas Research Center, Sultan Qaboos University, Muscat 123, Oman
*
Author to whom correspondence should be addressed.
AgriEngineering 2023, 5(4), 2349-2365; https://doi.org/10.3390/agriengineering5040144
Submission received: 13 September 2023 / Revised: 26 November 2023 / Accepted: 28 November 2023 / Published: 6 December 2023

Abstract

:
In this study, the finite volume method was used to evaluate the thermal performance of a flat-plate solar collector used to dry agricultural crops. A 3D numerical model was created and used to predict the outlet air velocities and temperatures for three inlet air velocities. When compared with experimental measurements, the numerical predictions showed good agreement under all testing conditions. Then, the numerical model was used to predict the internal airflow and heat transfer characteristics of the collector. The internal baffles were found to increase the dwell time and efficiency but also promote flow separation, which resulted in flow loss. In addition, the collector has a transparent cover that results in a substantial heat loss, which can be mitigated by adding a vacuum gap between the flow inside the collector and the cover. Increasing the flow rate increased the heat loss and decreased the heat uptake, which decreased the temperature difference between the inlet and outlet of the collector. Because the heat was lost through long-wavelength radiation via the transparent cover and sidewalls, coating the absorber plate with black matte paint to increase the solar radiation absorption coefficient did not improve the drying performance.

1. Introduction

In tropical and subtropical countries, the most popular method for preserving agricultural crops is by drying them. Drying agricultural products in many of these countries depends on exposing them to direct sunlight. Although this method is considered to be low cost, it has several disadvantages, the most prominent one being that these products are affected by dust, humidity, wind, and direct sunlight, which ultimately affects their quality and quantity as animals, birds, and insects often feed on them [1,2]. In order to overcome the disadvantages associated with open sun drying, many experimental studies have been implemented to dry agricultural products using several types of solar dryers. These devices accumulate solar radiation to a dry product in a dedicated structure. Unlike open sun drying, solar dryers can speed up the drying process by raising the air temperature, reducing the relative humidity, and increasing the air velocity in some types. It also protects the product from atmospheric influences such as dust, insects, and birds, which preserves its quality [3].
Solar dryers can be classified according to the air movement as passive (i.e., natural air circulation) and active (i.e., forced convection) and according to the mode of heat transfer as direct, indirect, mixed, and hybrid [3]. Direct solar dryers are usually developed by farmers using locally available materials. Examples of such solar dryers include box, cabinet, and tent dryers, which use a transparent cover to reduce heat losses and protect the drying crop from rain and dust. Indirect solar dryers comprise a solar collector and dryer cabinet. The solar collector collects heat from the sun that passes onto the dryer cabinet where the crops are dried. Mixed-mode dryers use a solar collector as well as a drying cabinet with a transparent cover [4]. Lastly, hybrid solar dryers use the solar collector as a supplemental heat source with another heat source, such as thermal storage, an auxiliary heating unit (e.g., electric, biomass, gas, and diesel), geothermal power or wastewater, photovoltaics, a heat pump, a chemical heat pump, or a dehumidification system [5,6,7]. Table 1 compares the advantages and disadvantages of these types of dryers.
Even though solar dryers are beneficial for drying agricultural produce, a proper and optimal solar dryer design is required to improve product drying, save energy, and lower the cost of dried goods [8]. Solar dryer efficiency has been enhanced by numerous techniques, including changing the collectors’ structural design [8,9,10,11,12], operating conditions [11,12], glass cover type [11], and geometry and material of absorber plate (Lu et al.) [9,13,14]. Several studies have used numerical simulations to optimize the thermal efficiency of flat-plate solar dryers. Bei et al. [10] used numerical simulations to analyze the operating conditions of flat-plate solar collectors in series and discussed the impact of the tube spacing and diameter on the thermal efficiency and water yield per unit area under the unsteady heat transfer condition. Kong et al. [12] optimized the thermal performance of a flat-plate solar collector by establishing a steady-state mathematical model and by analyzing the effects of operating, environmental, and structural parameters on the instantaneous efficiency. Lu et al. [13] introduced an efficiency factor and built a mathematical model for flat-plate solar collectors, which they used in computer simulations to study the impact of the absorber plate material and geometry on the thermal performance. Alvarez et al. [15] used the finite element method to establish a mathematical model of a bellows-type flat-plate solar collector, which they compared with experimental results for verification purposes. Dagdougui et al. [11] conducted simulations to analyze the impact of the glass cover type and layers on top of the collector on the heat loss. They optimized the design of the collector in terms of the size and the tube diameter and spacing. They also determined the optimal mass flow of the working fluid by setting an objective function that maximized the collector efficiency and outlet temperature. Molero Villar et al. [16] performed numerical simulations to analyze the thermal performance of parallel-pipe flat-plate solar collectors under the condition of non-uniform flow. Selmi et al. [17] compared the numerical and experimental results of solar collectors. Hu et al. [9] established a numerical model, which they used to explore the effects of different operating and structural parameters on the thermal efficiency of flat-plate solar collectors. Manoram et al. [14] performed a CFD study on the influence of V-shaped struts and their relative roughness pitch parameter on the thermal efficiency of solar collectors as well as Nusselt number and friction factor. Singh et al. [18] studied an indirect-type solar dryer. A CFD simulation was employed to model and simulate the solar dryer to obtain the dynamic and thermal performances of the dryer at different mass flows. Furthermore, Behera et al. [19] discussed the design and analysis of a hybrid-type solar dryer for drying tomatoes and bread toast. A CFD simulation was performed using the ANSYS Fluent Workbench (2021 R2), which was then validated using experimental results. Iranmanesh et al. [20] performed a CFD simulation and experimental investigation of a solar cabinet dryer equipped with a heat pipe evacuated tube solar collector and thermal storage system to obtain the thermal performance and efficiency. Moreover, the CFD simulation of the thermal storage and drying systems was performed to predict the thermal behavior of the fluid inside the storage system with and without PCM with higher precision (R2 > 0.95).
Two common numerical techniques used for the solution of fluid-based partial differential equations are as follows: the finite element method (FEM) and finite volume method (FVM). Both methods are based on discretizing the domain and developing a global assembled solution to the given problem [21]. However, FVM is better suited to problems concerned with the conservation of mass, energy, or momentum, such as fluid-based problems. Moreover, this is in addition to the flexibility of FVM at handling complex shapes compared with FEM, with less issues related to conversion. FVM is also based on the integral form of the conservation laws rather than their differential form. This results in more accuracy and stability for sharp gradients inside a domain, which is more suitable for fluid dynamics simulations. FVM can be computationally more expensive than FEM and needs finer discretization at the corners. Thus, FVM is justified for the current modeling of the flat solar collector when considering the achieved accuracy and simplicity of the developed model.
In this study, the finite volume CFD method was used to investigate the thermal performance of a flat-plate solar collector for drying agricultural crops. A baffle-type flat-plate solar collector was fabricated, and the thermal performance was measured under different conditions of inlet air velocities and under different environmental conditions of surrounding temperature and relative humidity. Then, a 3D numerical model was developed and compared with the experimental results for validation. The model was then applied to evaluate the internal airflow and heat transfer characteristics of the solar collector.

2. Methodology

2.1. Experiment

2.1.1. Structure of the Flat-Plate Solar Collector

Figure 1 shows the fabricated flat-plate solar collector, which had dimensions of 0.6 × 0.6 × 0.1 m. Five internal baffles, each with a length of 0.09 m, were set evenly to divide the collector into six channels to increase the dwell time of the airflow and improve the heat-collecting efficiency. A single acrylic glass cover with an emissivity coefficient of 0.92 was set 0.1 m above the absorber plate with a thickness of 6 mm. The absorber plate, sidewalls, and baffles were all composed of aluminum with a solar radiation absorption coefficient of 0.30. In the second stage of the experiment, the collector was coated with black matte paint, which increased the solar radiation absorption coefficient to 0.95 (±0.02). An electrical air blower was attached to the outlet of the collector to suck air through a circular inlet duct with a diameter of 0.076 m and force it along the serpentine path before it exited from the outlet.

2.1.2. Experimental Setup

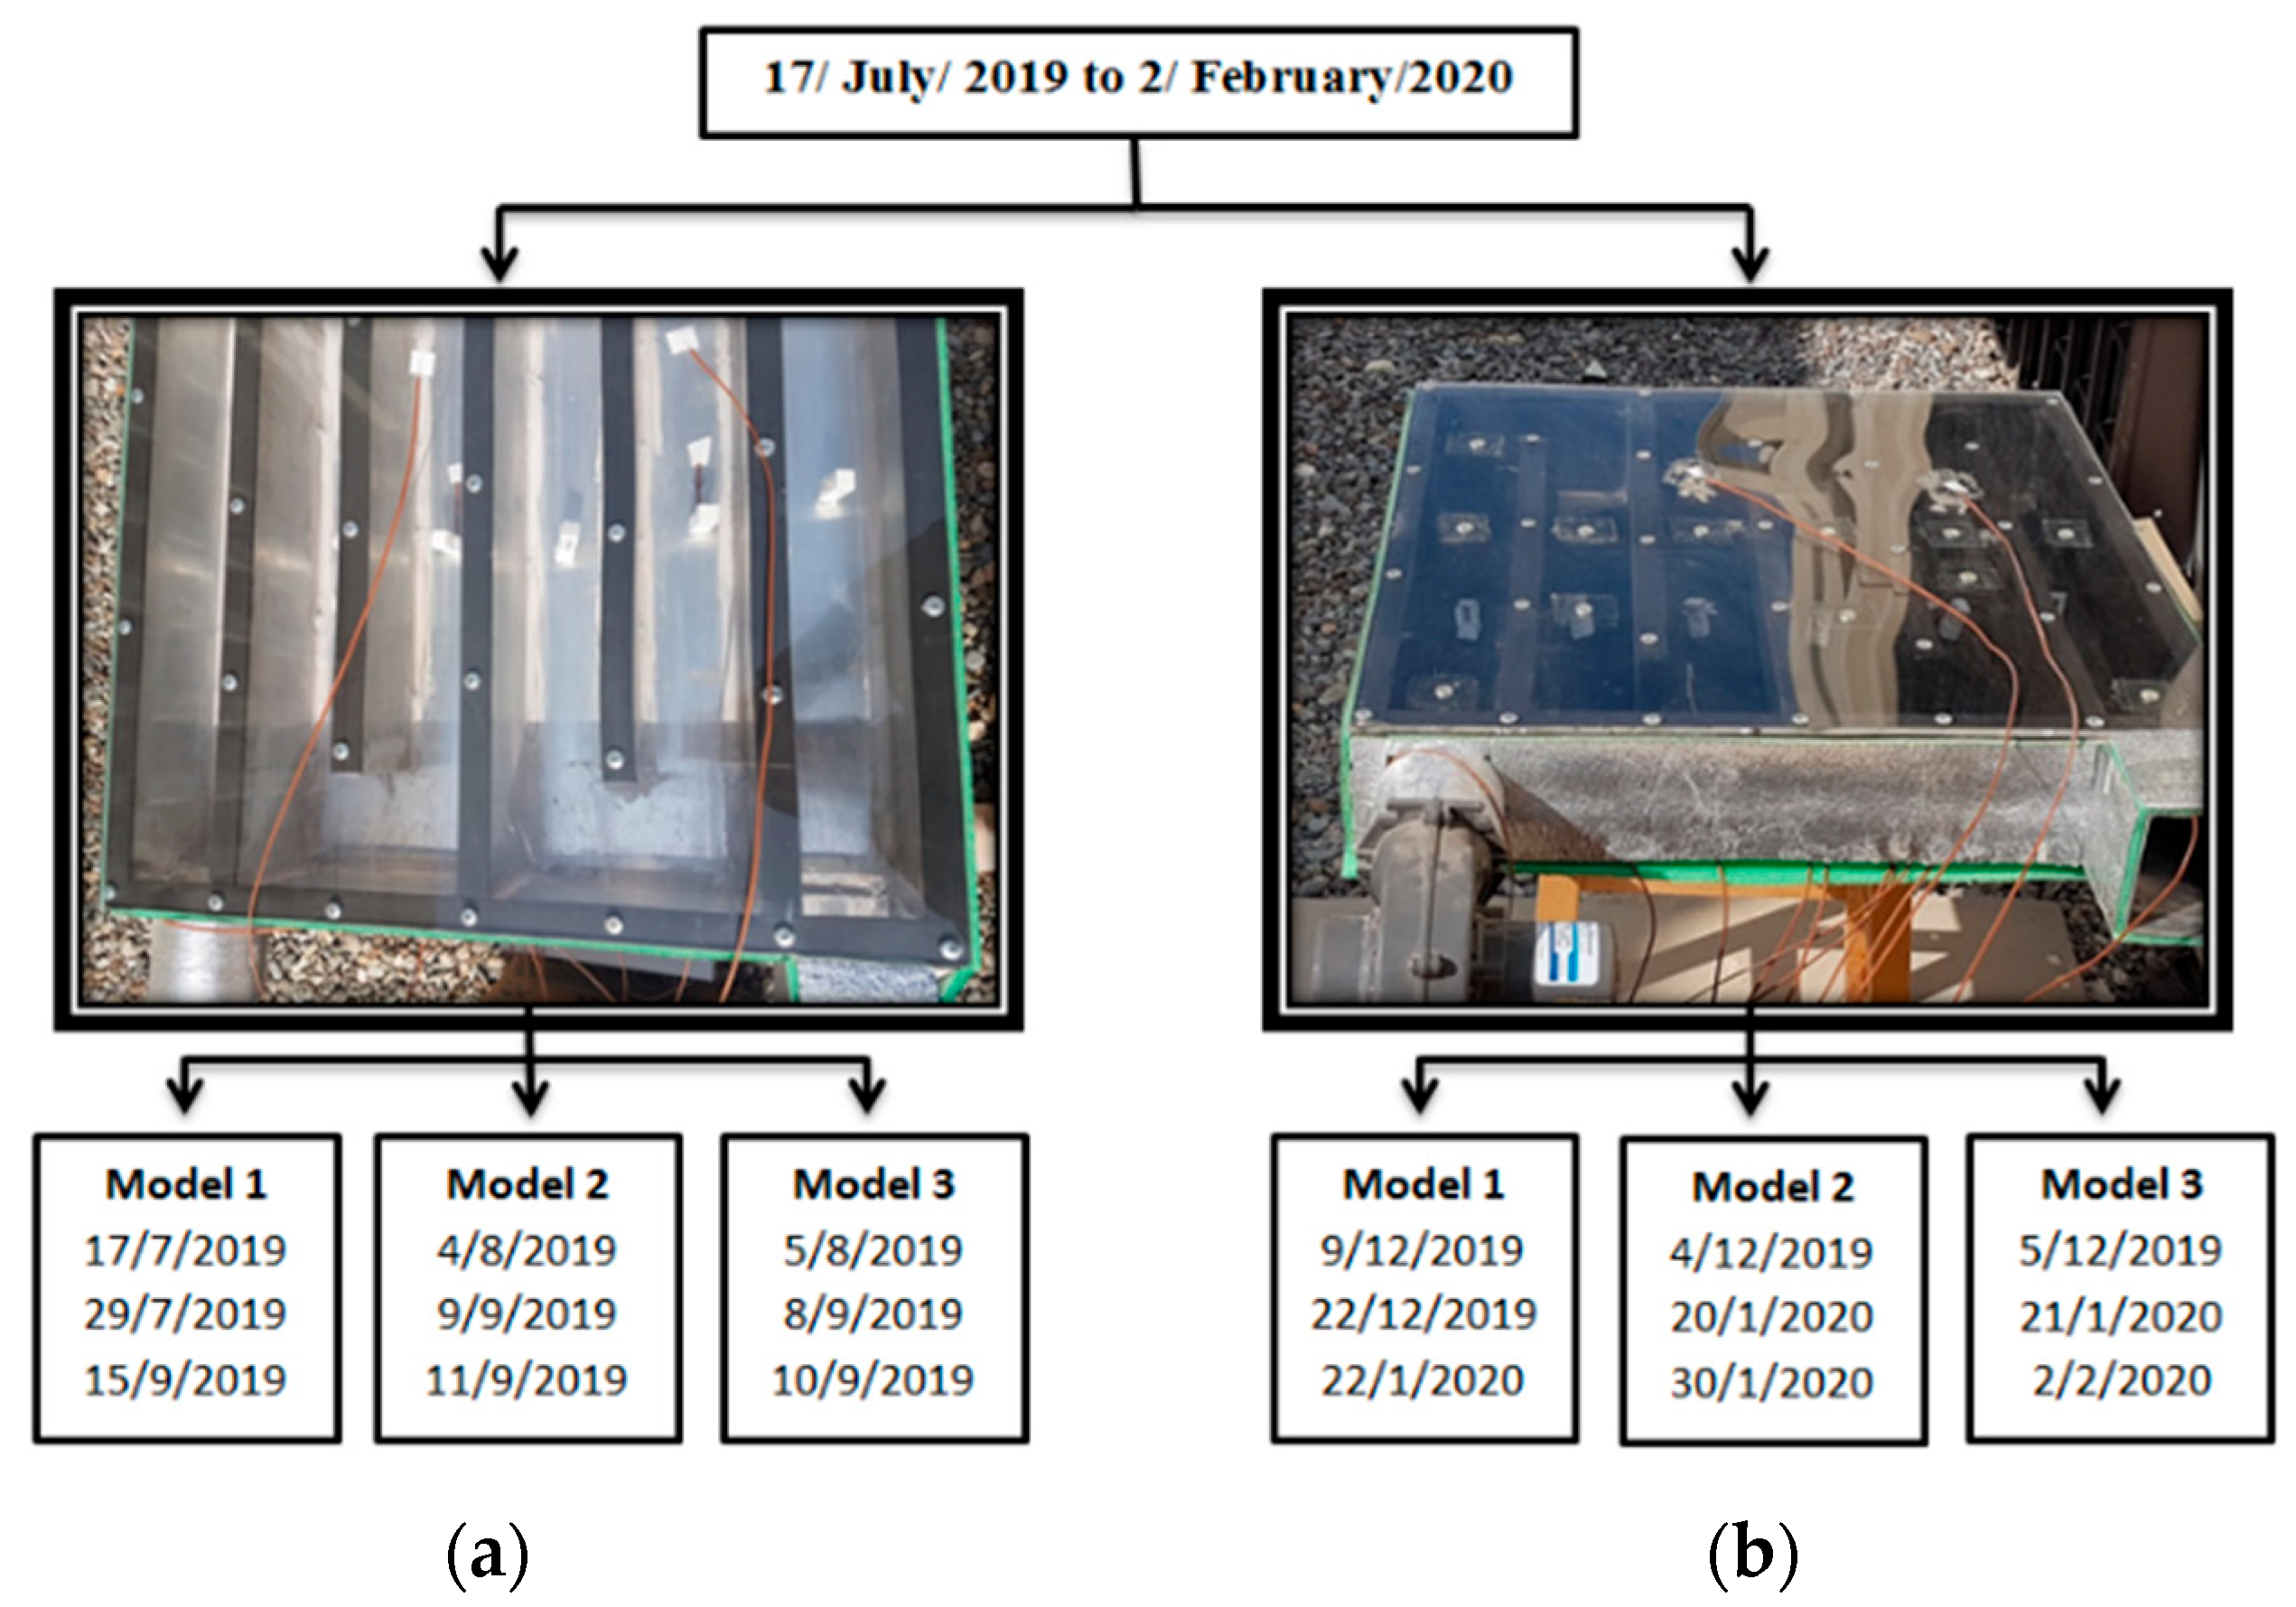
The solar collector was installed in an open area near the College of Agricultural and Marine Sciences at Sultan Qaboos University, Oman (23.5896° N, 58.1735° E). The experiment was run in two different stages. In the first stage, the polished absorber plate was used as is. In the second stage, the absorber plate was coated in black matte paint. For both stages, the solar collector was run at three different inlet air velocities: 1.14, 1, and 0.41 m/s. Each velocity was tested on a different date, as shown in Figure 2.
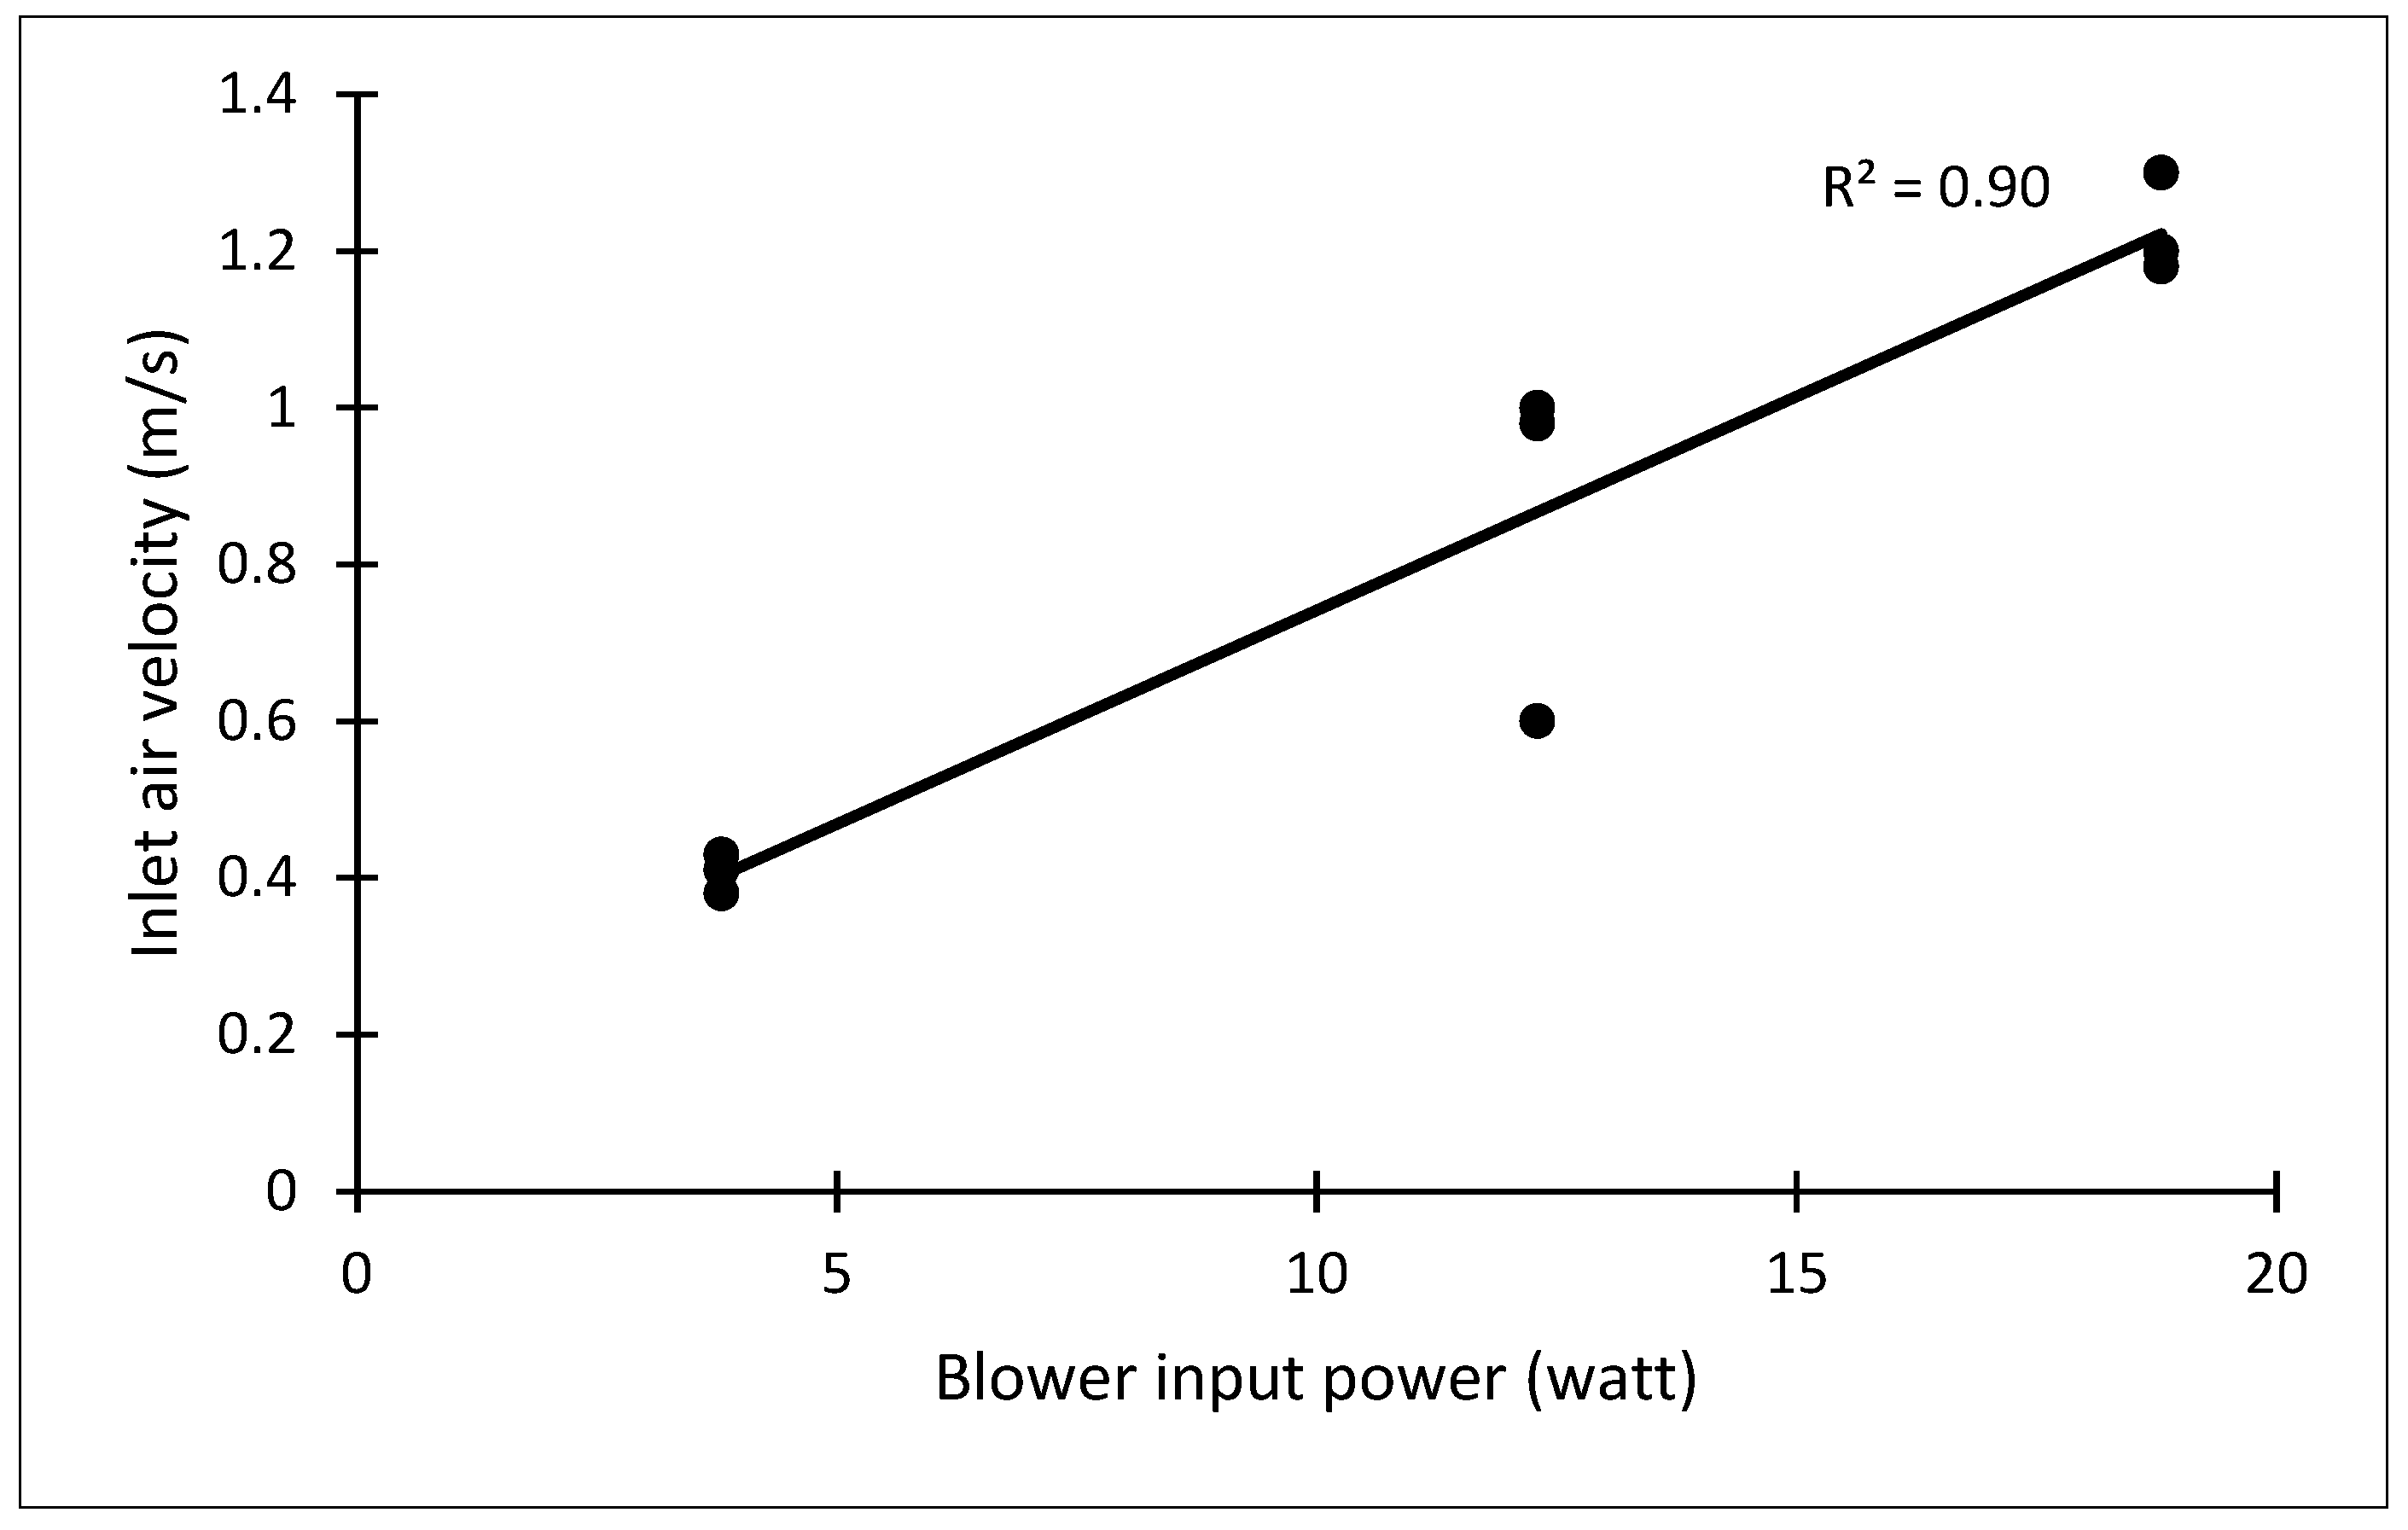
During the experiment, the average wind and heat flux were collected from the weather station at Sultan Qaboos University. Twelve thermocouples (TT-T-22-SLE-1000, OMEGA Norwalk, CT, USA) were used to measure the air temperature and surface temperature at different locations of the solar collector (six thermocouples inside each channel, two thermocouples on the surface of the absorber plate, two thermocouples at the inlet and outlet of the collector, and two thermocouples on the surface of the transparent cover). The thermocouples were connected to a data logger (CR3000, Campbell Scientific, Logan, UT, USA), which recorded the temperature data every 20 min. To eliminate the effect of direct solar radiation on the temperature measured by the thermocouples, they were protected by perforated housing composed of polystyrene foam material that still allows air to pass through. A flange bilge-type centrifugal air blower (TMC, Eveleigh, NSW, Australia) was used to circulate air inside the collector. The blower was rated at 12 V dc, 36 W, and had a maximum air induction of 150 m3/h. It was installed at the inlet of the collector. A motor velocity-controlling circuit was developed to control the blower power and thus the inlet air velocity into the collector. Figure 3 shows the relationship between the blower input power and inlet air velocity inside the collector. The air velocity inside the collector was measured using a digital anemometer (HHF-SD1, OMEGA, Norwalk, CT, USA). Table 2 lists the specifications of the measuring devices used in the experiment.

2.2. Numerical Model

2.2.1. Geometry and Mesh

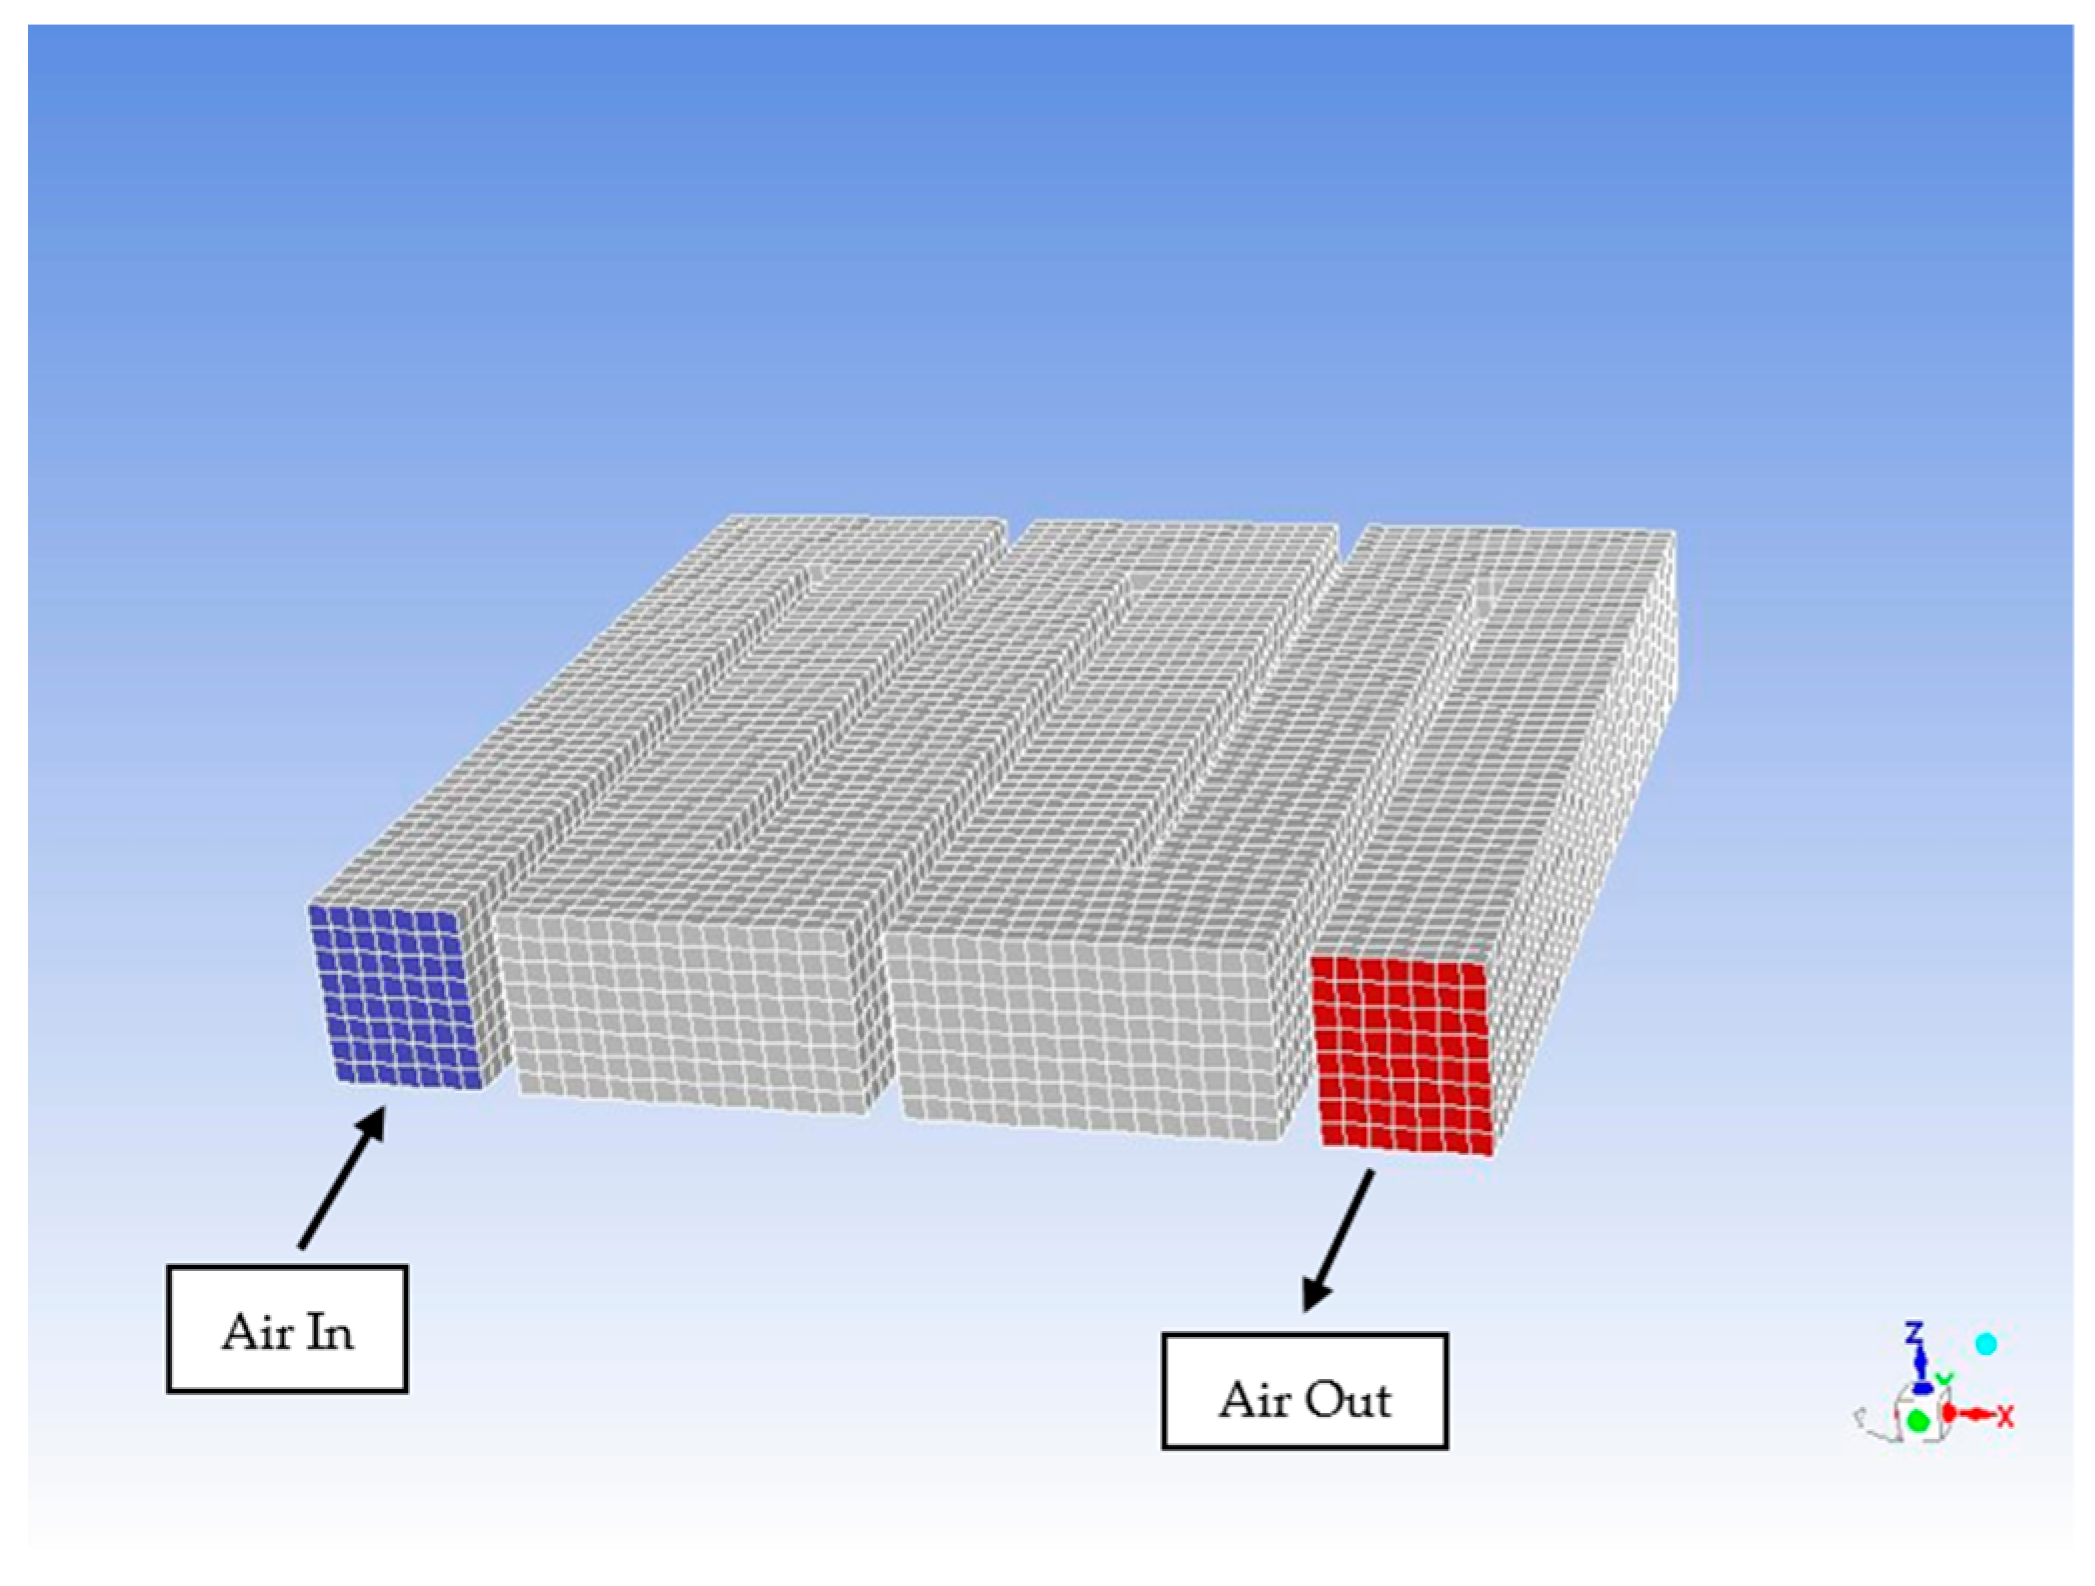
A three-dimensional numerical model of the flat-plate solar collector was developed. The actual dimensions of the geometry were used, and a mesh of the fluid domain was created in ANSYS FLUENT V12.0 with a hexahedron structure, as shown in Figure 4. The total grid number after the grid independence test was set to 16,904.

2.2.2. Turbulence, Boundary Conditions, and Material Properties

The airflow inside the collector was considered turbulent. Hence, the realizable k–ε turbulence model was selected for the inlet velocities of 1.14 and 1 m/s, and a laminar flow was considered for the inlet air velocity of 0.41 m/s. The air was considered an incompressible ideal gas, and the density was calculated by using the Boussinesq hypothesis. The walls were treated as stationary and no-slip boundaries. Table 3 presents the specific boundary conditions for each wall and the material properties. The numerical model was based on the following assumptions:
  • Heat losses from the lateral and bottom sides can be disregarded.
  • The baffles and lateral sides are adiabatic, and no heat transfer occurs between the baffles and absorber plate.
  • The effects of the measurement sensors on the flow field can be disregarded.
  • No air leaks.
  • The collector chamber is perpendicular to the heat flux (i.e., solar radiation).
The numerical model was solved by using the commercial software of ANSYS FLUENT V12.0. FVM was used to discretize the governing equations. The second-order upwind scheme was used to discretize the energy and momentum equations, and the first-order upwind scheme was used to discretize the turbulent kinetic energy and dissipation rate. The SIMPLE algorithm was used to find the numerical solution.
Table 3. Boundary conditions and material properties.
LocationBoundary ConditionMaterial Property
InletVelocity inlet-
OutletPressure outlet-
Absorber plateHeat fluxCp = 900 J/(kg K)
ρ = 2.719 g/cm3
λ = 202.4 W/(m K)
Transparent coverMixed boundary conditionCp = 1260 J/(kg K)
ρ = 1.185 g/cm3
λ = 0.19 W/(m K)
BafflesHeat flux = 0 W/m2Cp = 900 J/(kg K)
ρ = 2.719 g/cm3
λ = 202.4 W/(m K)
Air-Boussinesq approximation
Cp = Specific heat capacity, ρ = density, λ = thermal conductivity.

2.2.3. Mesh Sensitivity Analysis

The mesh size of the elements was determined according to the error percentages of the predicted outlet temperature and velocity. Table 4 presents the input parameters of the three inlet air velocities. The outlet temperature and outlet air velocity were computed at different mesh sizes of 1.2–6 cm for the different inlet air velocities. The error percentages of the outlet air velocity and temperature were then calculated as follows:
E r r o r   %   ( O u t l e t   A i r   T e m p e r a t u r e ) = | T o u t E x p e r i m e n t T o u t M o d e l | T o u t ( E x p e r i m e n t ) × 100
E r r o r   %   ( O u t l e t   A i r   V e l o c i t y ) = | V o u t E x p e r i m e n t V o u t M o d e l | V o u t ( E x p e r i m e n t ) × 100

2.2.4. Model Validation

For model validation, simulations were carried out to predict the outlet temperature and velocity, and the predicted values were compared with the experimental results. The input parameters used for the steady-state simulation were collected by running the flat-plate solar collector at different inlet velocities and inlet temperatures on different days. The simulation conditions were set to mimic the measured data collected from 11:00 a.m. to 5:00 p.m. The solar flux of the heat collector plate in the simulation was taken as the solar radiation intensity through the 6 mm thick glass cover corrected by the emissivity coefficients of the glass cover and absorber plate. The convective heat transfer coefficient for the external airflow over the glass cover surface was estimated by using the experimental correlation of McAdams [22]:
hext = 5.7 + 3.8u
where hext is the convective heat transfer coefficient for the external flow (W/(m2 K)) and u is the wind velocity (m/s). The other input parameters (i.e., solar radiation and average wind velocity) of each experimental date were retrieved from a nearby weather station at Sultan Qaboos University. Table 5 presents the measured and calculated input parameters for different inlet air velocities with the polished absorber plate. Table 6 presents the input parameters after the absorber plate was coated with black matte paint.

3. Results and Discussion

3.1. Mesh Selection

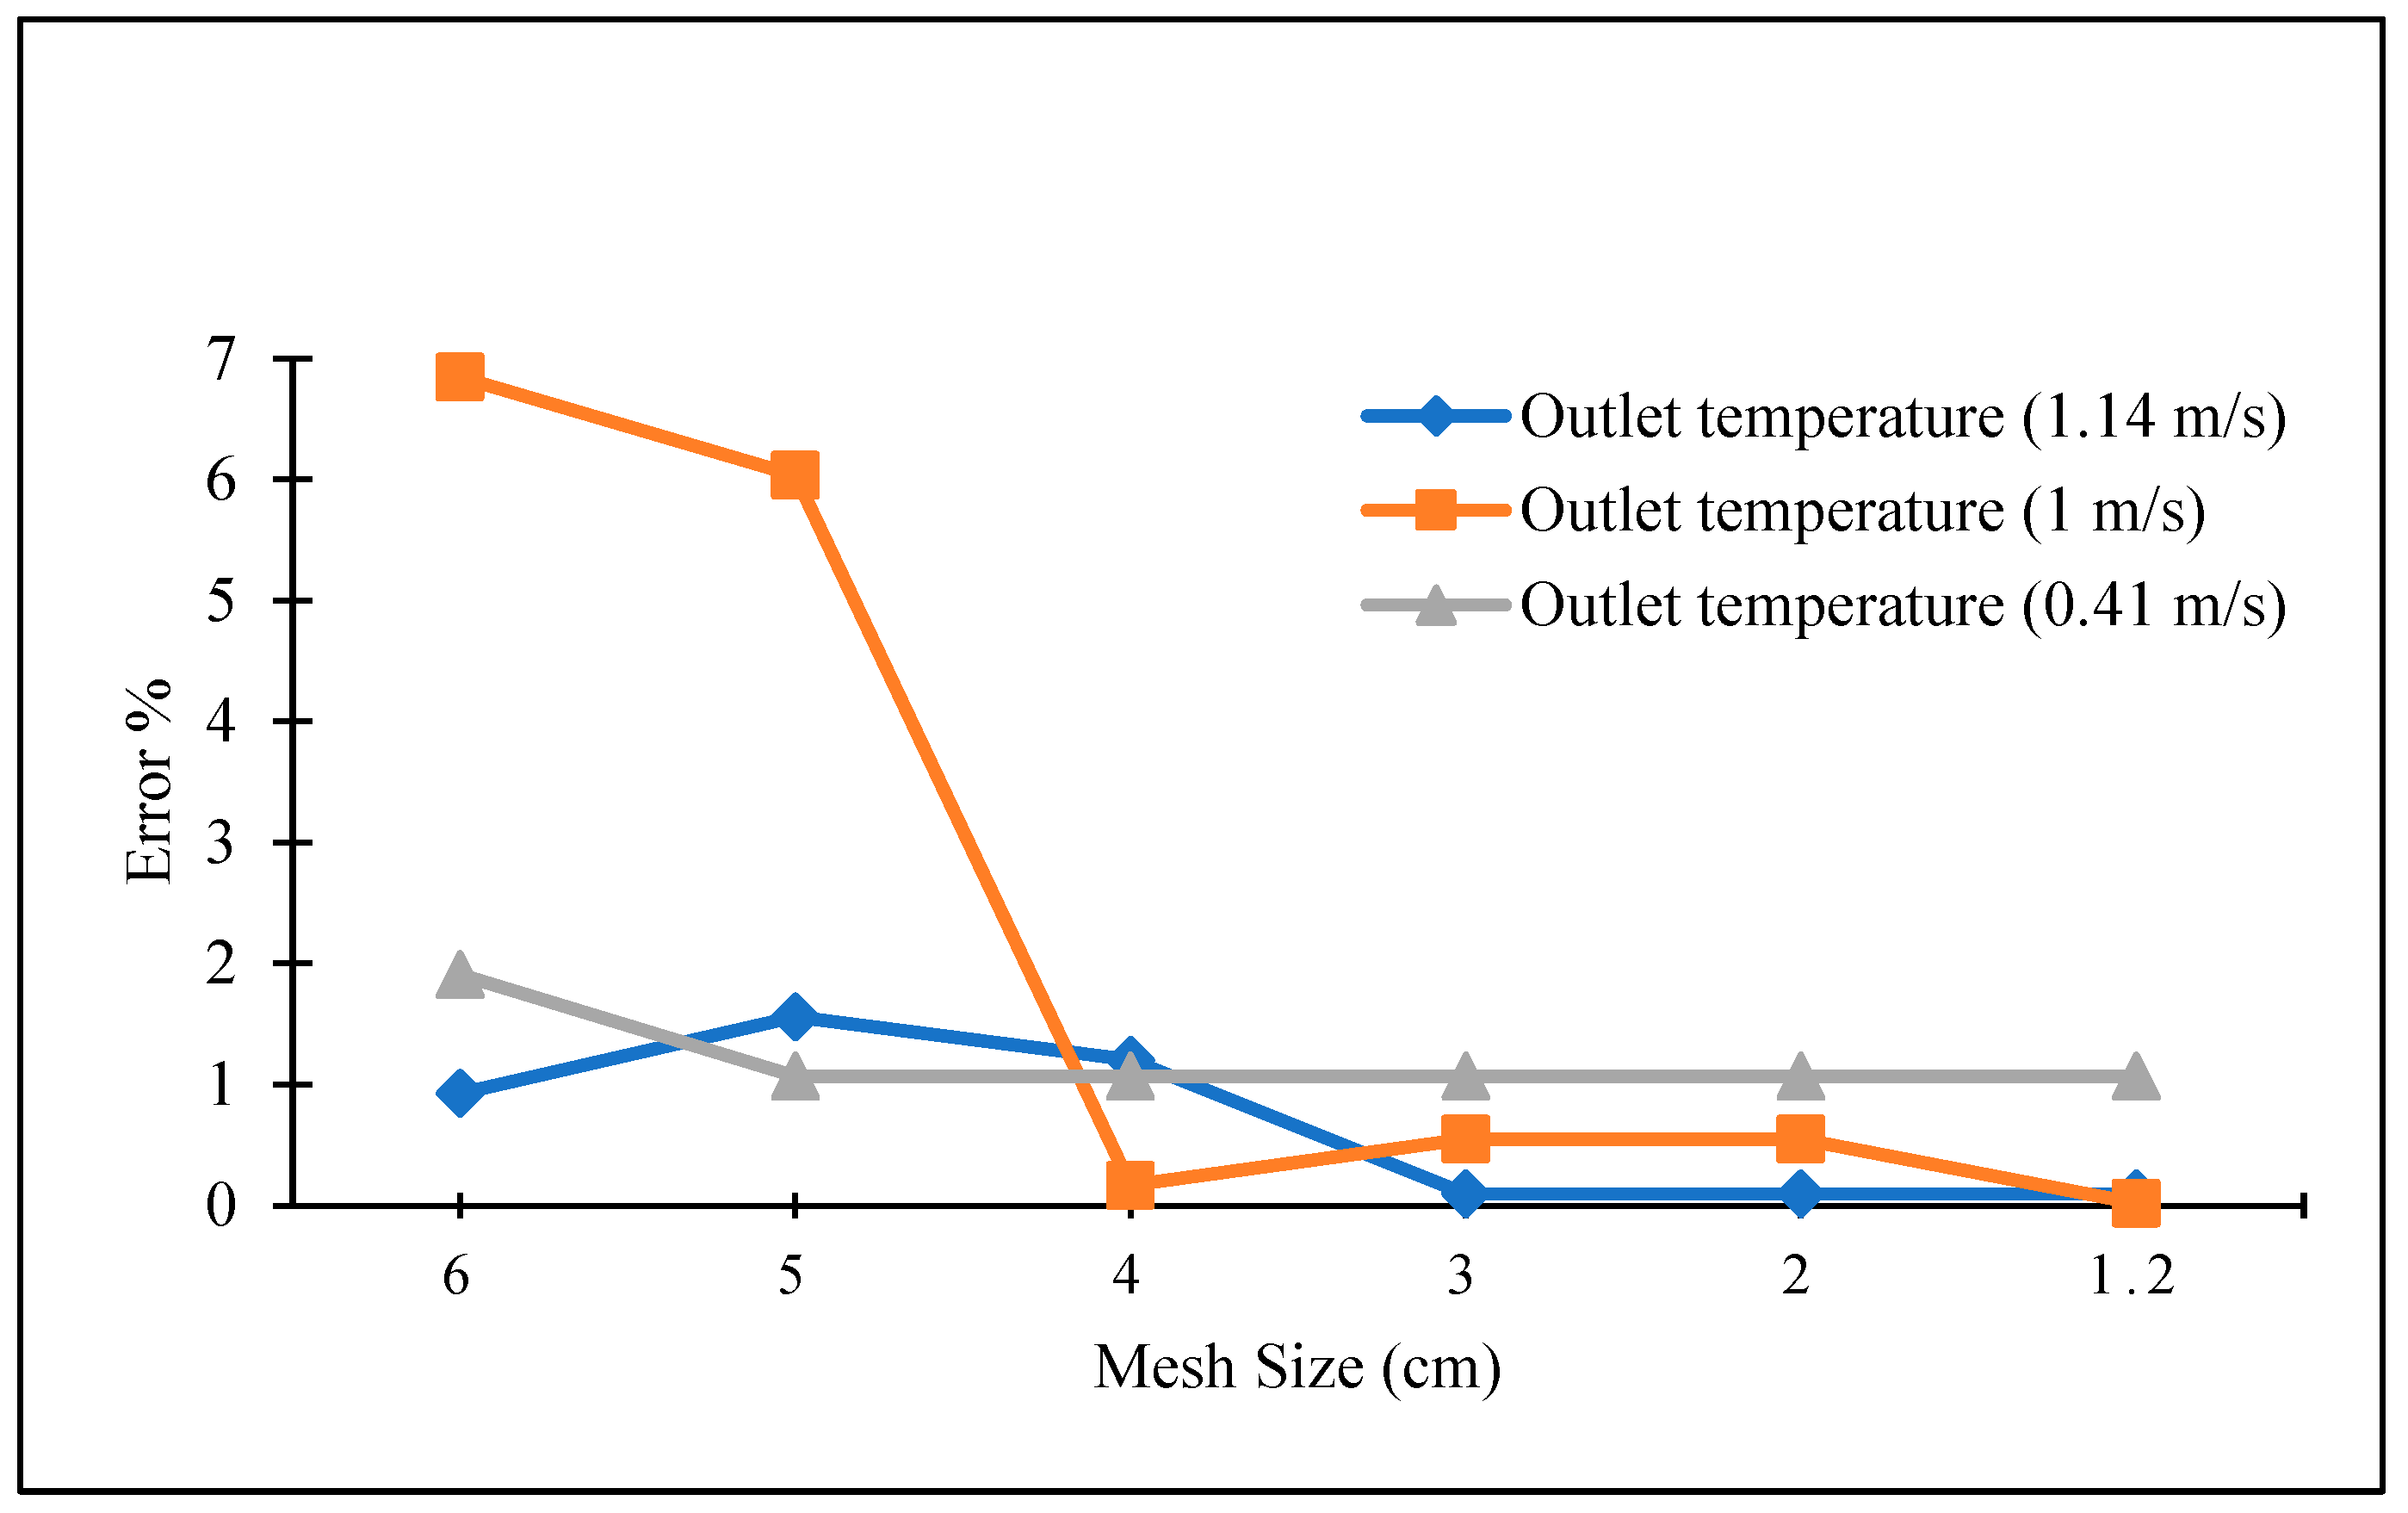
Figure 5 shows the effect of the mesh size on the error percentage of the outlet temperature. At an inlet air velocity of 0.41 m/s, the error percentage remained steady regardless of mesh size. At an inlet air velocity of 1 m/s, the error percentage decreased from 7% at a mesh size of 6 cm to 0.2% at a mesh size of 1.2 cm. At an inlet air velocity of 1.14 m/s, the error percentage decreased from close to 2% at a mesh size of 6 cm to 0.9% at a mesh size of 1.2 cm. Figure 6 shows the effect of the mesh size on the error percentage of the outlet air velocity. Reducing the mesh size from 6 cm to 1.2 cm decreased the error percentage from 100% to 6.1%, 4.8%, and 2.5% for inlet air velocities of 1.14, 1, and 0.41 m/s, respectively. Because a mesh size of 1.2 cm resulted in the smallest error for both the outlet temperature and air velocity, the mesh size of the model was set to 1.2 cm.

3.2. Model Validation

3.2.1. Outlet Temperature

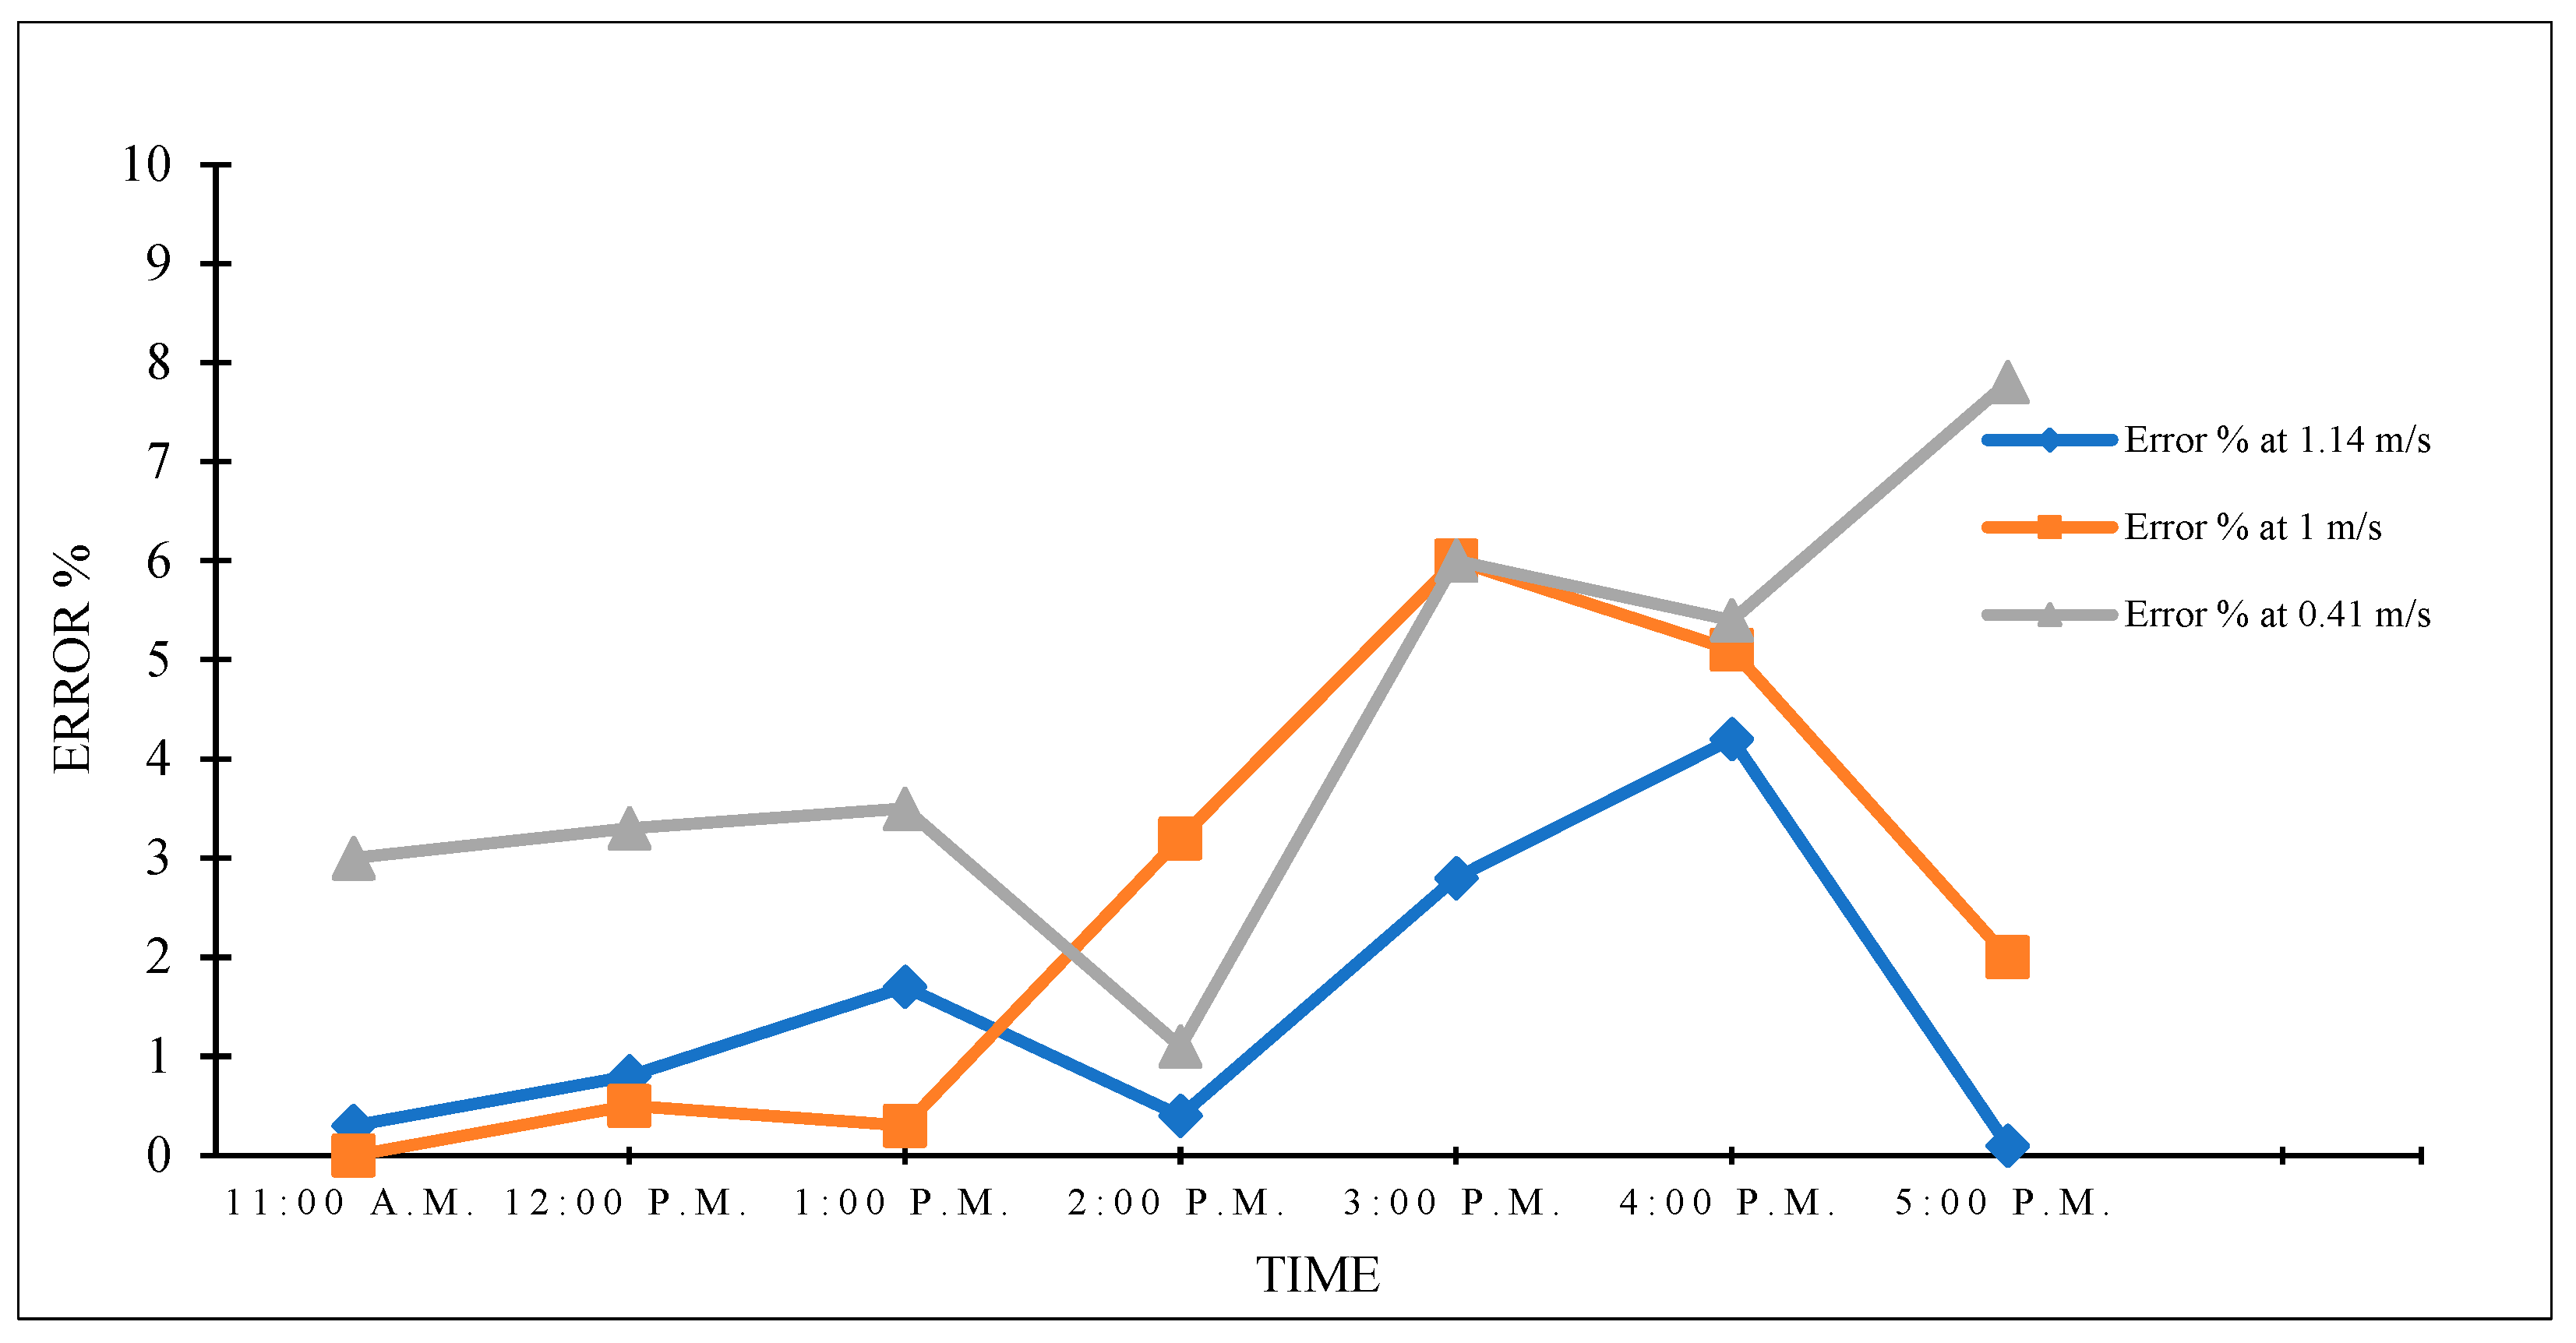
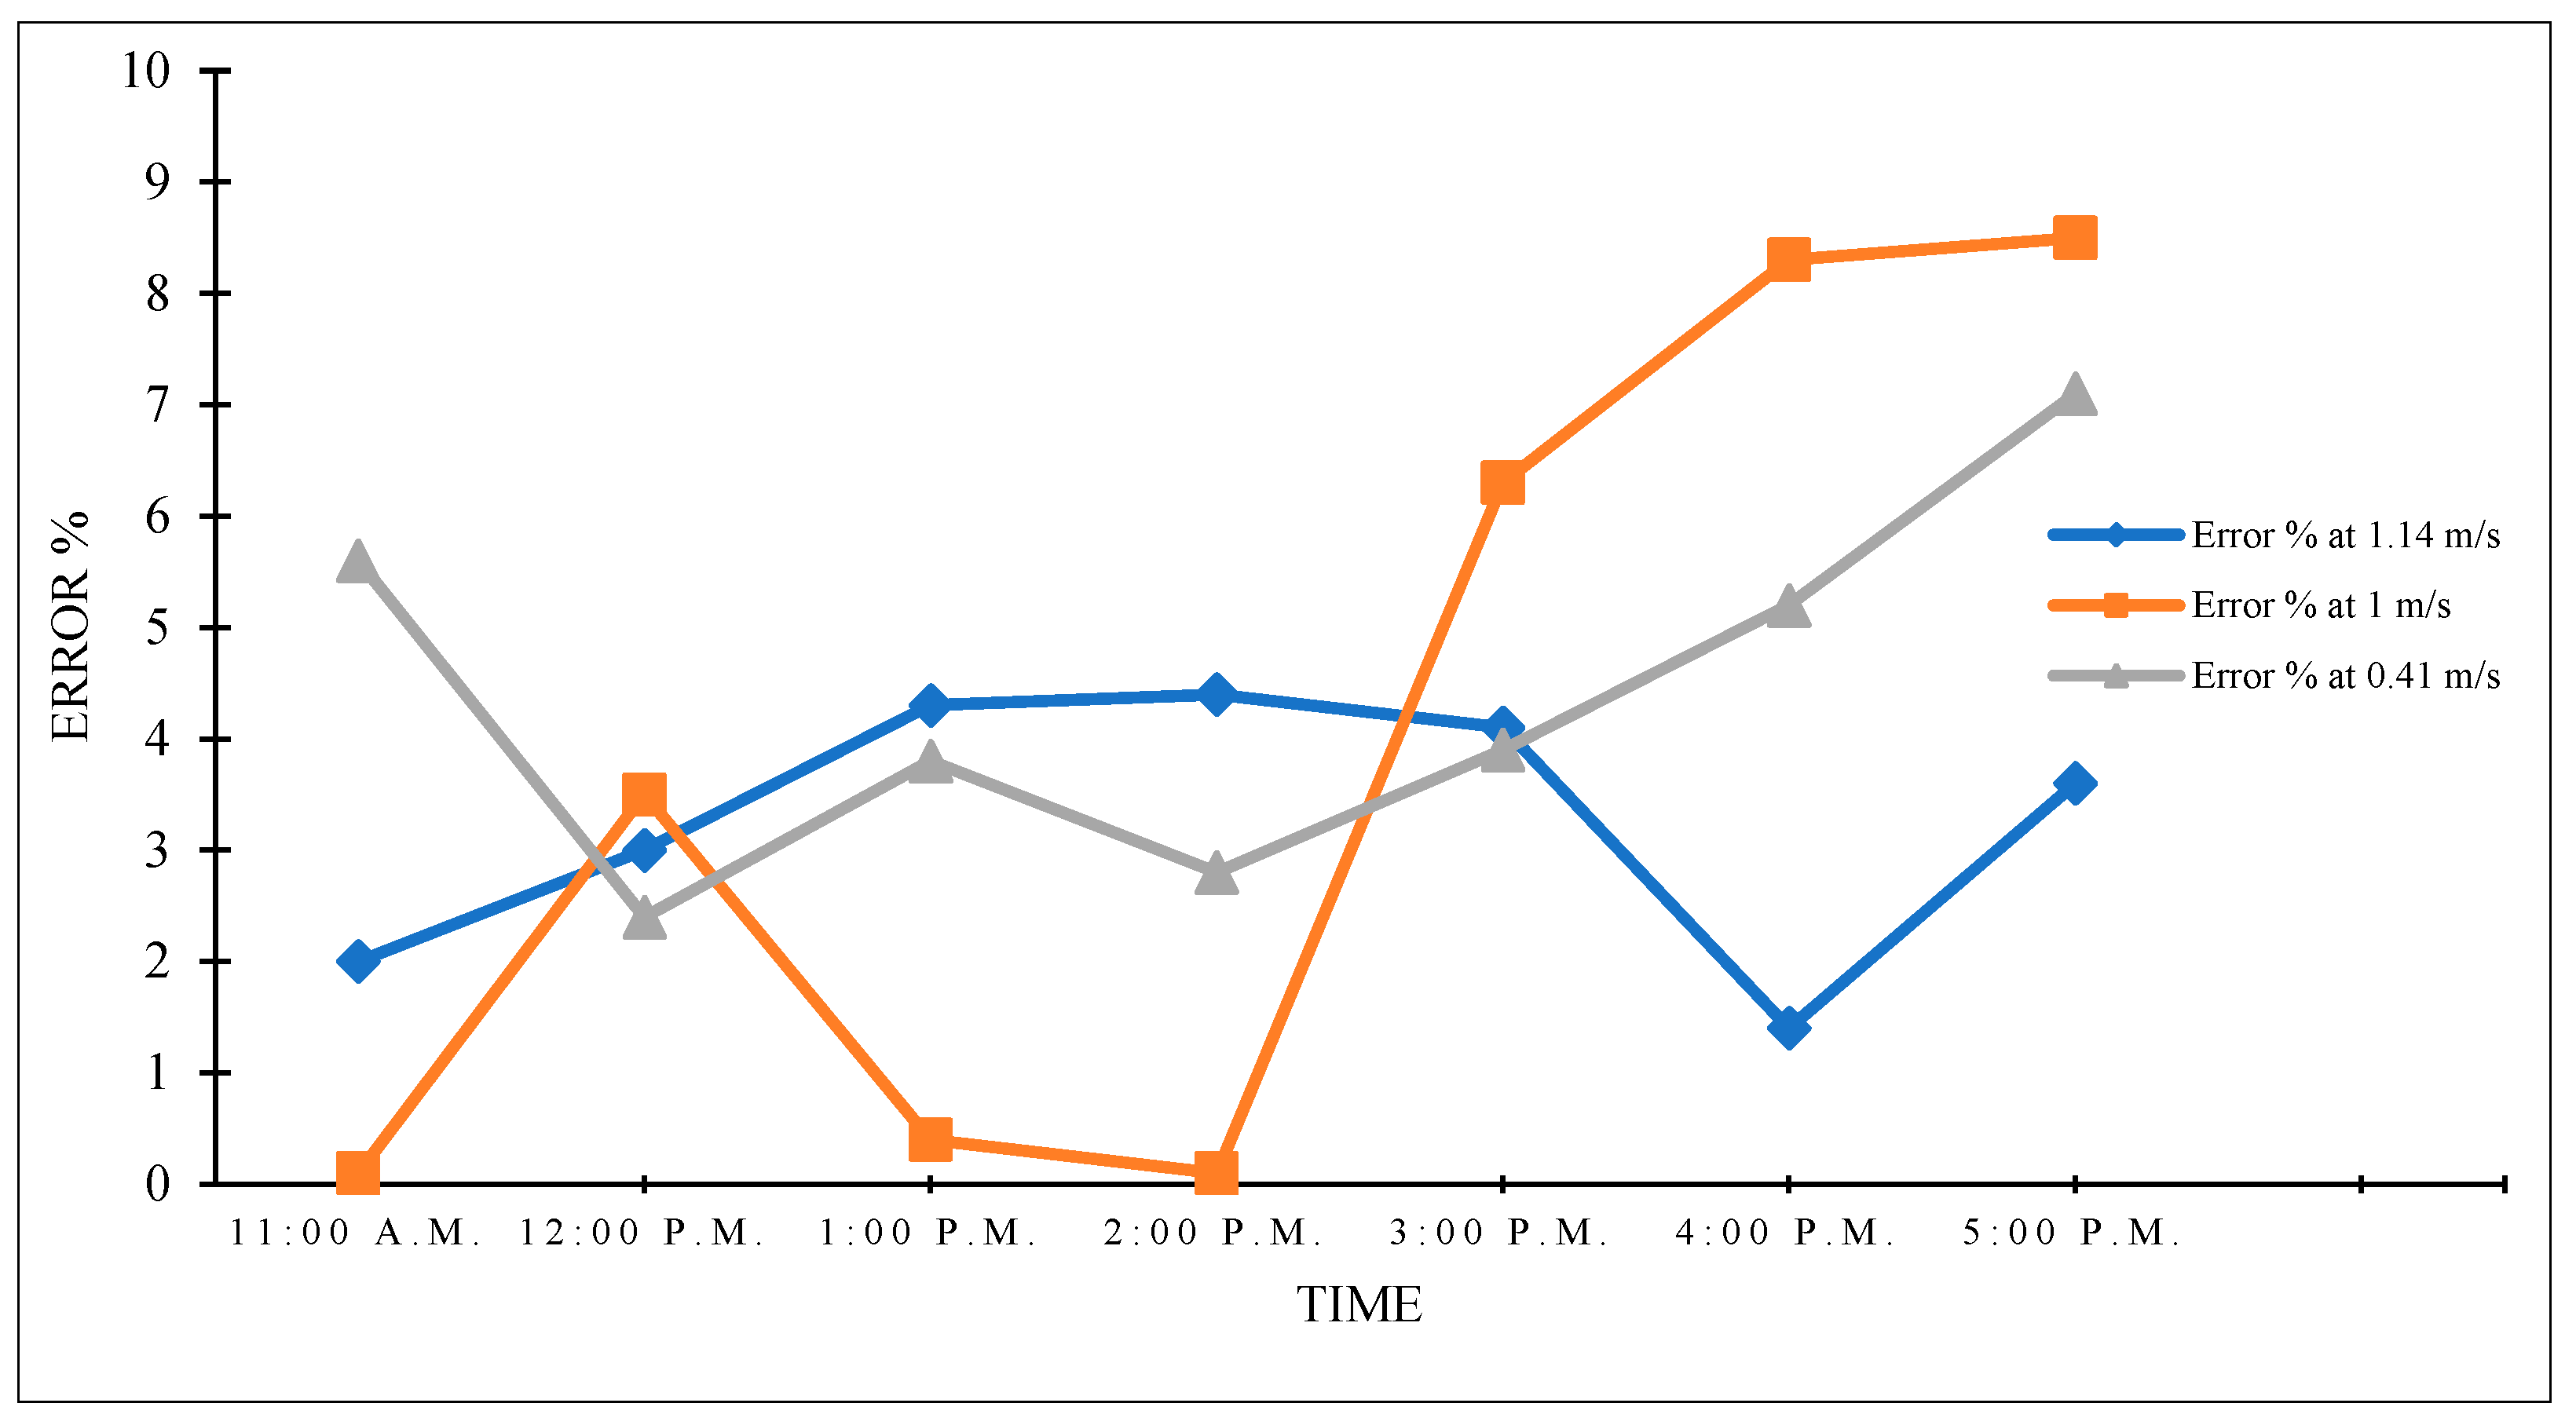
Table 7 and Table 8 present the experimental and predicted values outlet temperatures at different inlet air velocities with the polished and black matte absorber plates, respectively. Figure 7 and Figure 8 show the error percentages of the measured and predicted outlet temperatures with the polished and black matte absorber plates, respectively. With the polished absorber plate, the maximum error percentages were 4.2% (at 4:00 p.m.), 6% (at 3:00 p.m.), and 7.8% (at 5:00 p.m.) for inlet air velocities of 1.14, 1, and 0.41 m/s, respectively. With the black matte absorber plate, the maximum error percentages were 4.4% (at 2:00 p.m.), 8.5% (at 5:00 p.m.), and 7.1% (at 5:00 p.m.), for inlet air velocities of 1.14, 1, and 0.41 m/s, respectively. Overall, the error percentages between the measured and predicted output temperatures remained below 10% throughout the measurement period. With the polished absorber plate, the average error percentages at the different inlet air velocities were 1.5%, 2.4%, and 4.3%, respectively, while the average error percentages with the black matte plate were 3.2%, 3.9%, and 4.4%, respectively. The error percentage was lowest at the highest air inlet air velocity with both the polished and black matte absorber plates. The black matte absorber plate resulted in a higher average error percentage than the polished absorber plate at all inlet air velocities.

3.2.2. Outlet Air Velocity

Table 9 presents the experimental and predicted outlet air velocities at different inlet air velocities. The error percentages at inlet air velocities of 1.14, 1, and 0.41 m/s were 6.1%, 4.8%, and 2.5%, respectively. The error percentages were below 7%, which indicates good agreement between the measured and predicted values. Thus, the experimental results confirmed the validity of the numerical model.

3.3. Internal Flow and Heat Transfer Characteristics of the Flat-Plate Solar Collector

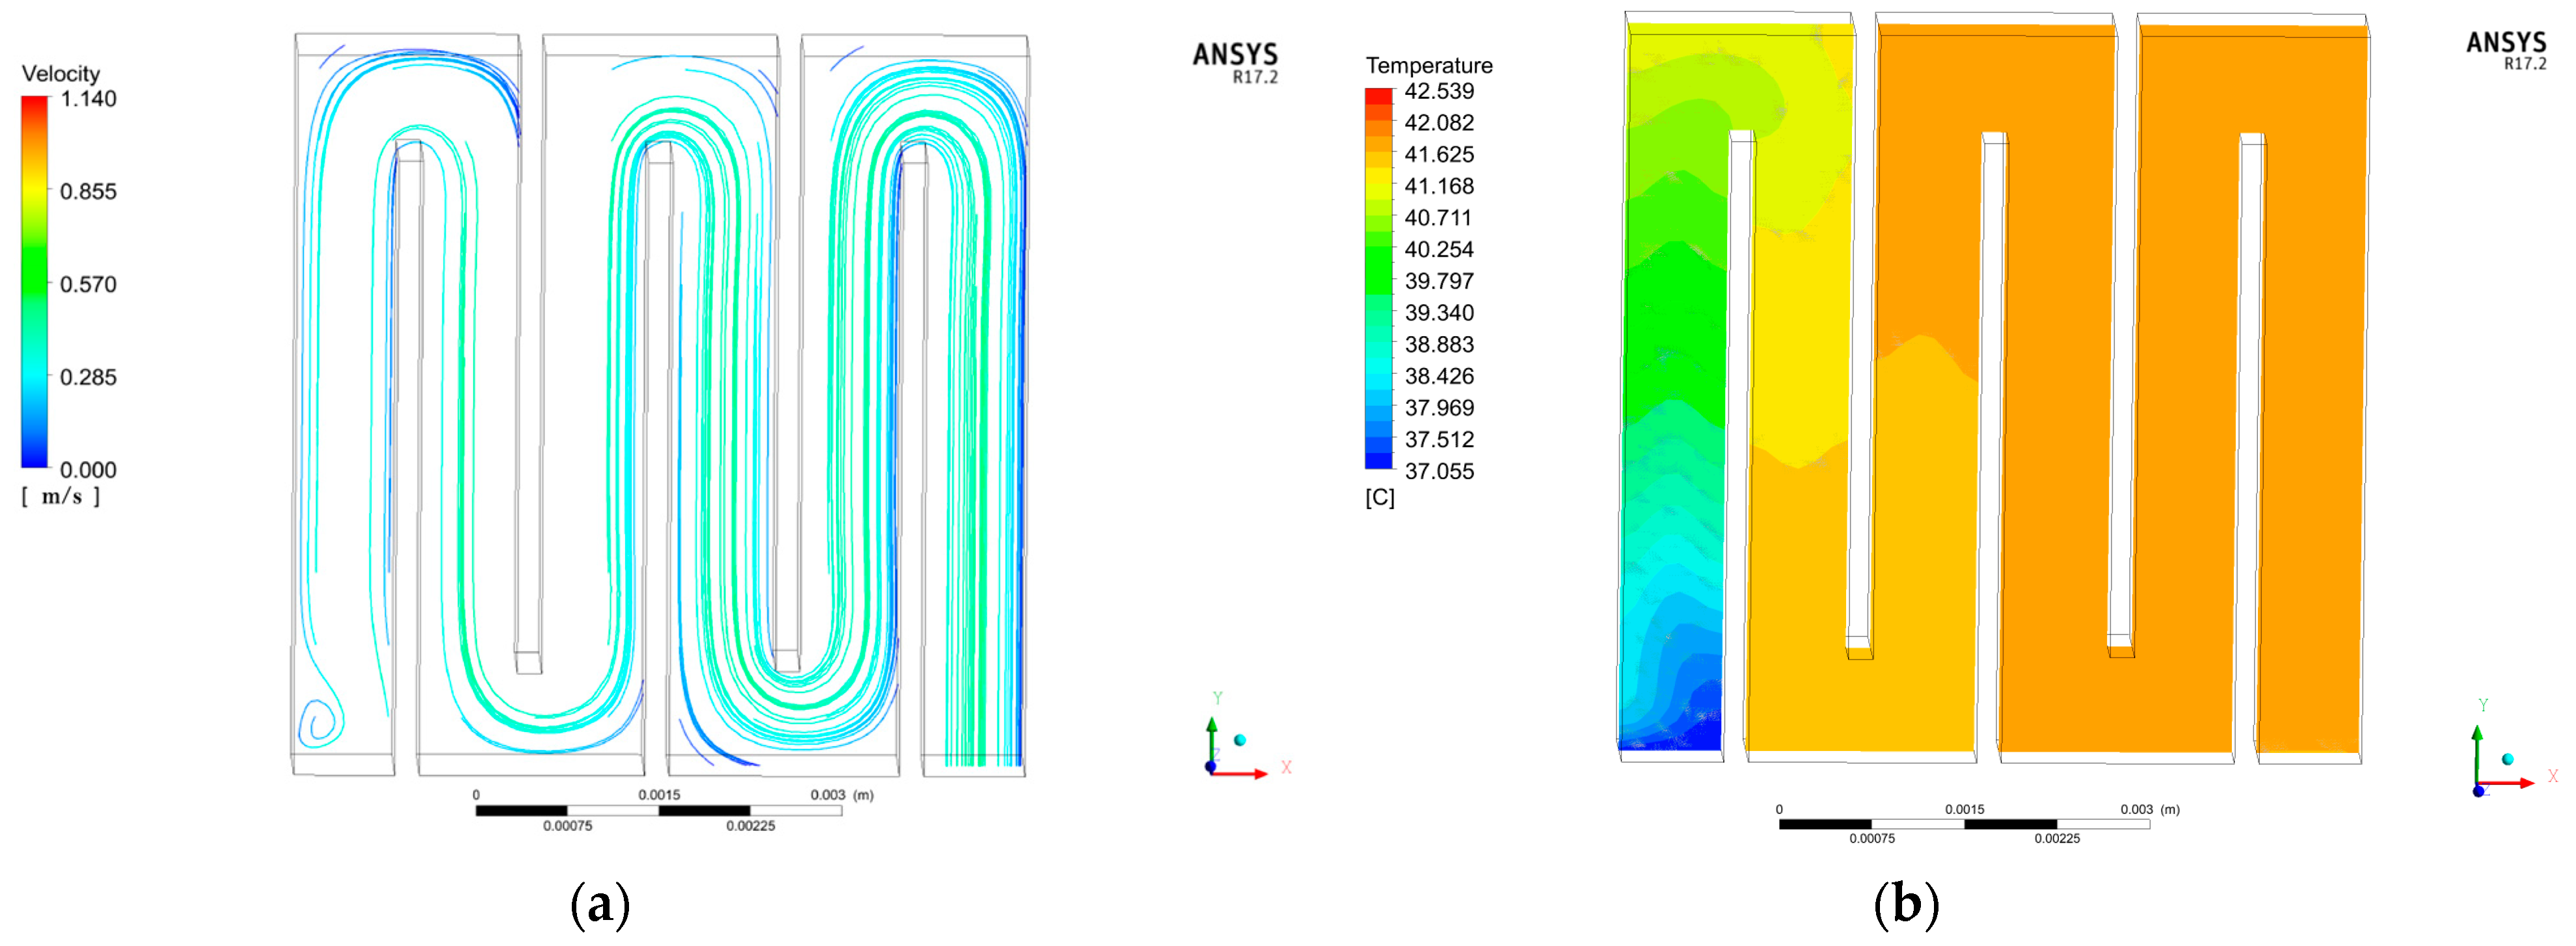
The model was used to analyze the internal flow and heat transfer characteristics of the collector. The following input parameters were set: an inlet air velocity of 1.14 m/s, heat flux of 762.7 W/m2, heat transfer coefficient of 18.2 W/m2-K, and inlet air temperature of 37.1 °C. The streamlines and temperature contours were mapped at the midsection of the flat-plate collector (z = 0.05 m) to minimize the influence of the solid walls. Figure 9a shows that the flow pattern in the collector was simple and directional. Flow separation occurred when the airflow was deflected 180° at the ends of the baffles, especially at the 90° internal corners, which resulted in flow loss in the first three channels. The temperature distribution was significantly influenced by the flow pattern. Figure 9b shows that the temperature of the airflow gradually increased as it moved along the channels. The temperature of the airflow was higher in channels 4–6 because the flow separation was reduced inside these channels, and the airflow became more directed.

3.4. Effect of the Inlet Air Velocity

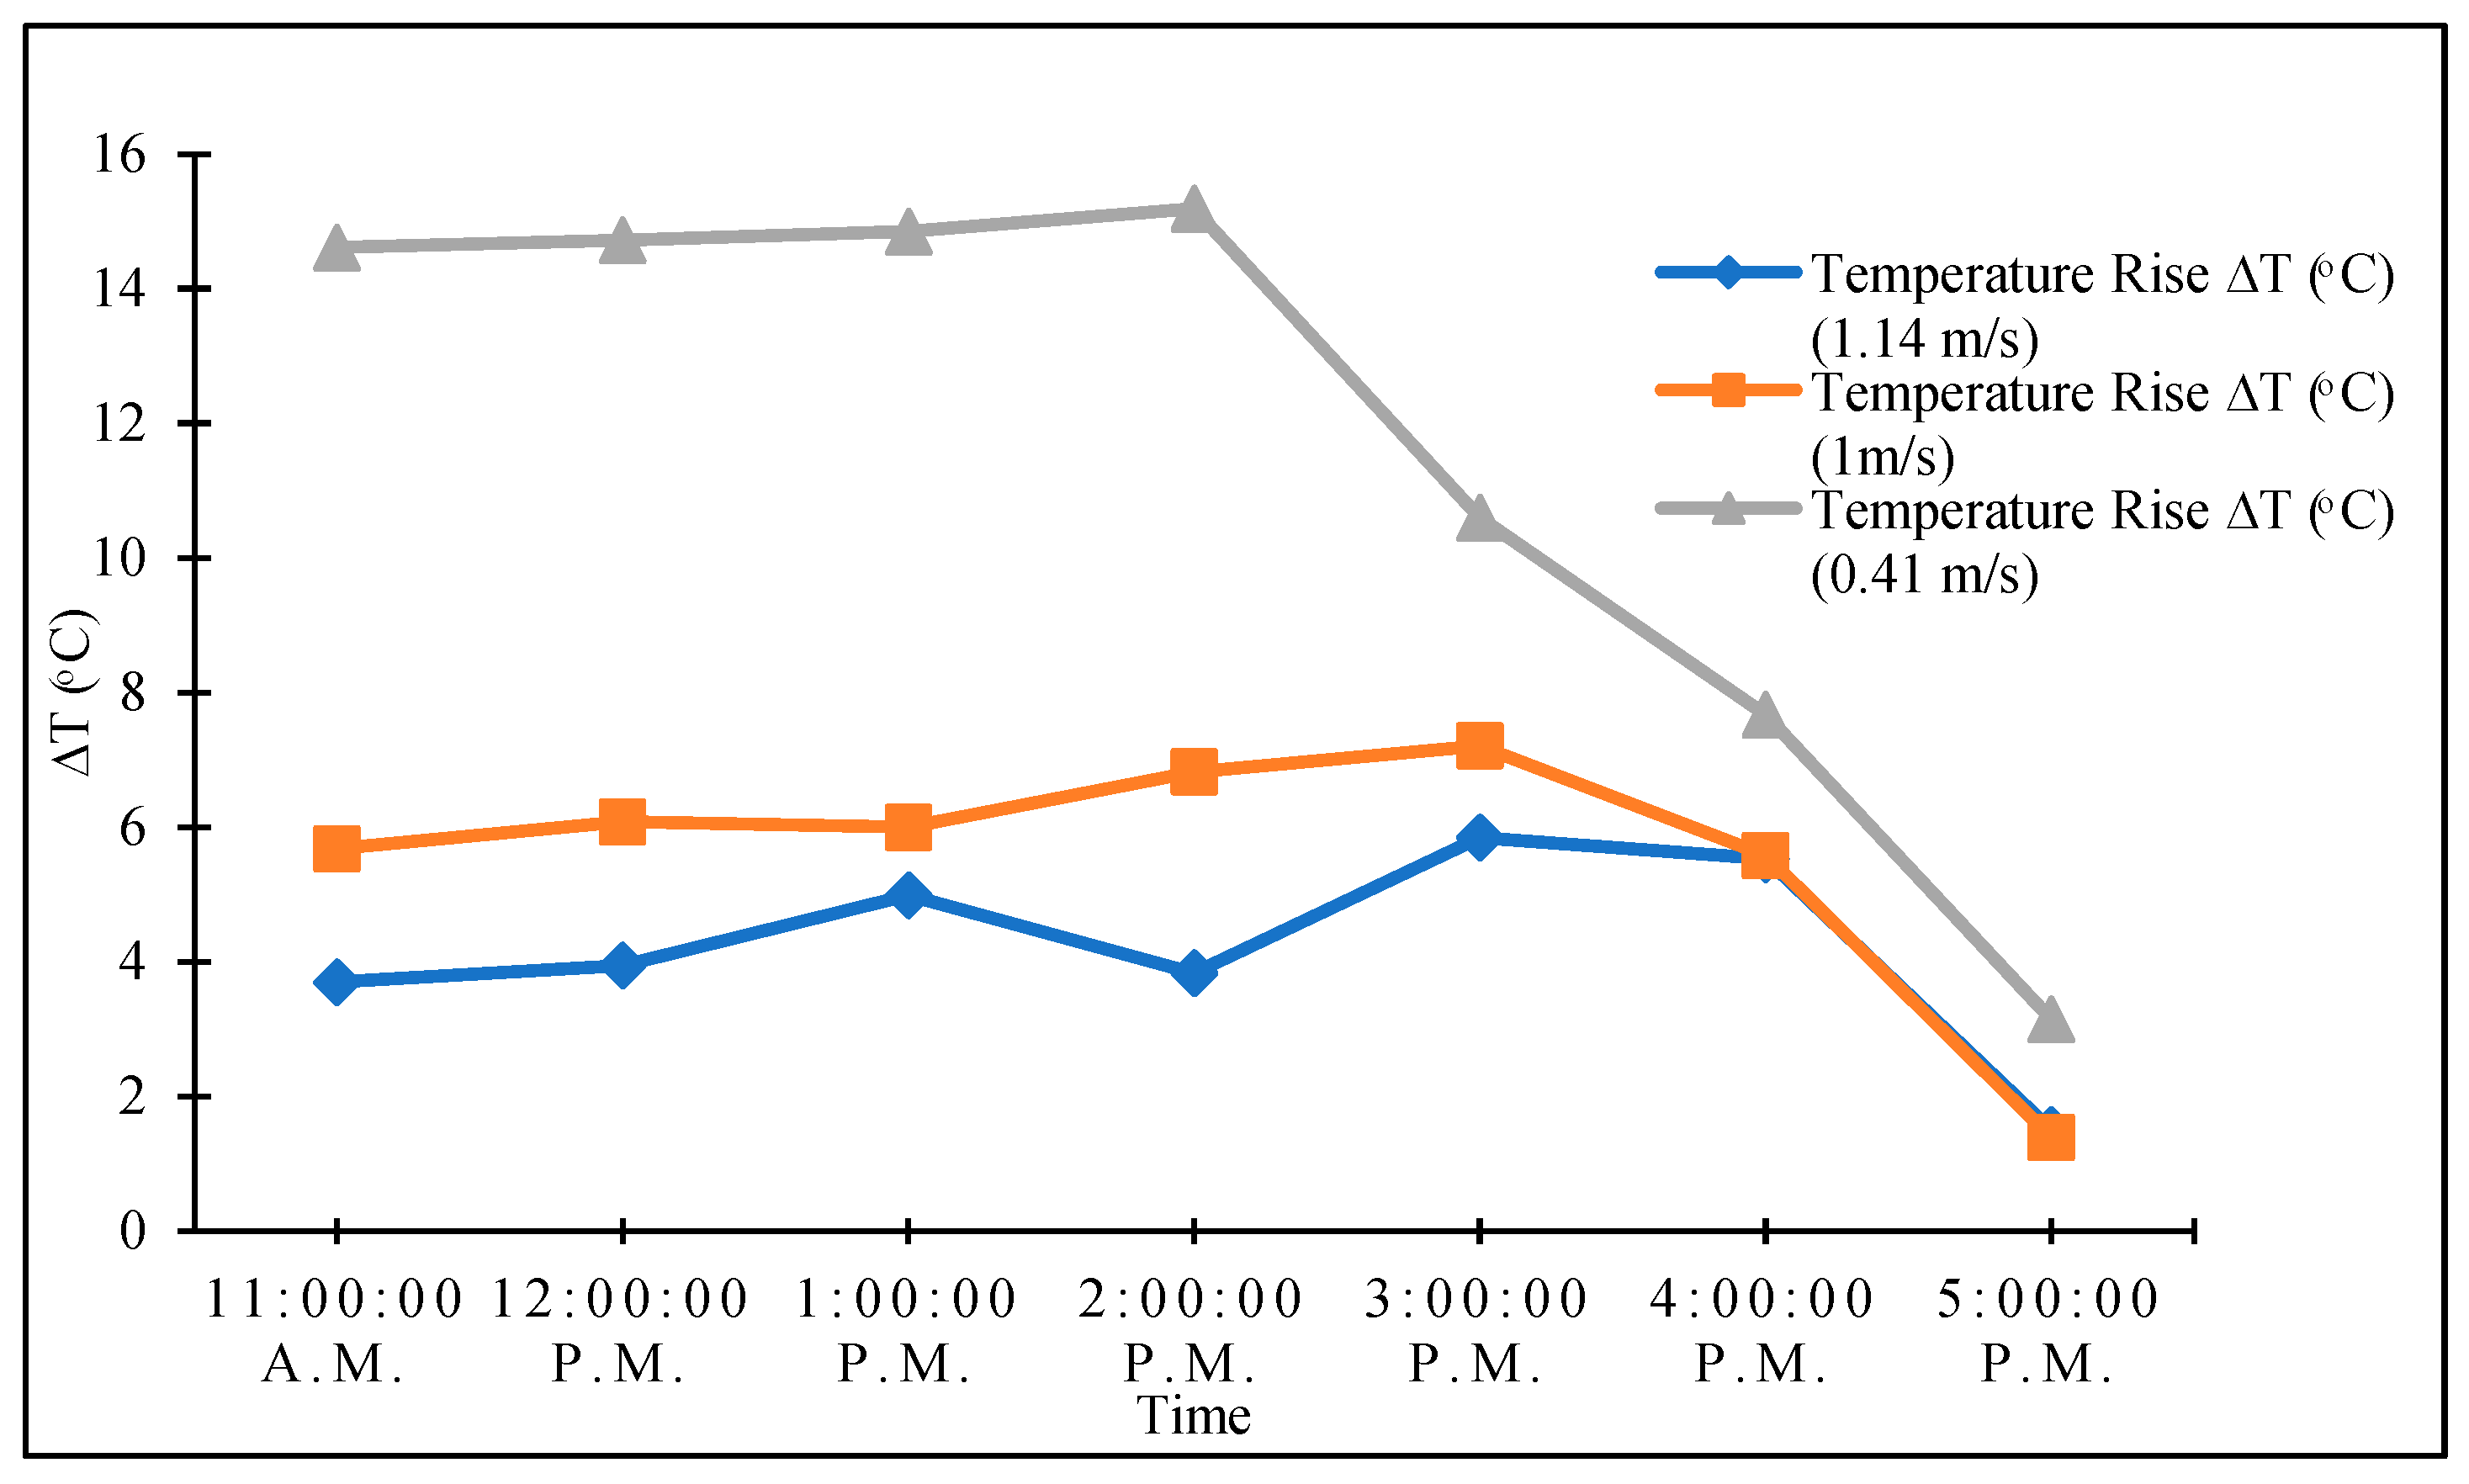
The change in temperature between the inlet and outlet (ΔT) of the collector was analyzed at different inlet air velocities. Figure 10 shows that ΔT was lowest at an inlet air velocity of 1.14 m/s with a maximum value of 5.9 °C at 3:00 p.m. At an inlet air velocity of 1 m/s, the maximum ΔT was 7.2 °C at 3:00 p.m. At an inlet air velocity of 0.41 m/s, the ΔT was largest with a maximum value of 15.2 °C at 2:00 p.m. These results indicate that ΔT increased with decreasing inlet air velocity because of the increased heat gain absorbed by the airflow inside the collector compared with heat loss through the transparent top cover. Theoretically, according to Equation (4), an increase in air flow increases the thermal efficiency of the device; however, this is negated by a decrease in outlet air temperature caused by the brief duration of heat exchange between the air and absorber plate. This result concurs with that of Dagdougui et al. [11], who discovered that the average temperature of the water exiting the solar heater decreases as the water flow increases. According to the authors, to address this issue, the optimal flow rate of the working fluid must be determined based on the system’s size and design objectives to achieve the highest outlet fluid temperature with the highest thermal efficiency. This is possible via optimization procedures.

3.5. Solar Collector Efficiency

The thermal efficiency of a flat-plate solar collector can be described as a function of the absorber area, incident radiation, and useful power [23], which can be affected by factors such as the geographic location, collector size, and humidity, velocity, and temperature of the surrounding air [24]. The thermal efficiency of the collector was calculated for both the polished and black matte absorbers:
η = ma cp (Tout − Tin)/Ac I
where η is the thermal efficiency (%), ma is the airflow rate (kg/s), cp is the specific heat of air (J/kg K), Tout is the outlet air temperature (°C), Tin is the inlet air temperature (°C), Ac is the area of the collector (m2), and I is the solar radiation (W/m2).
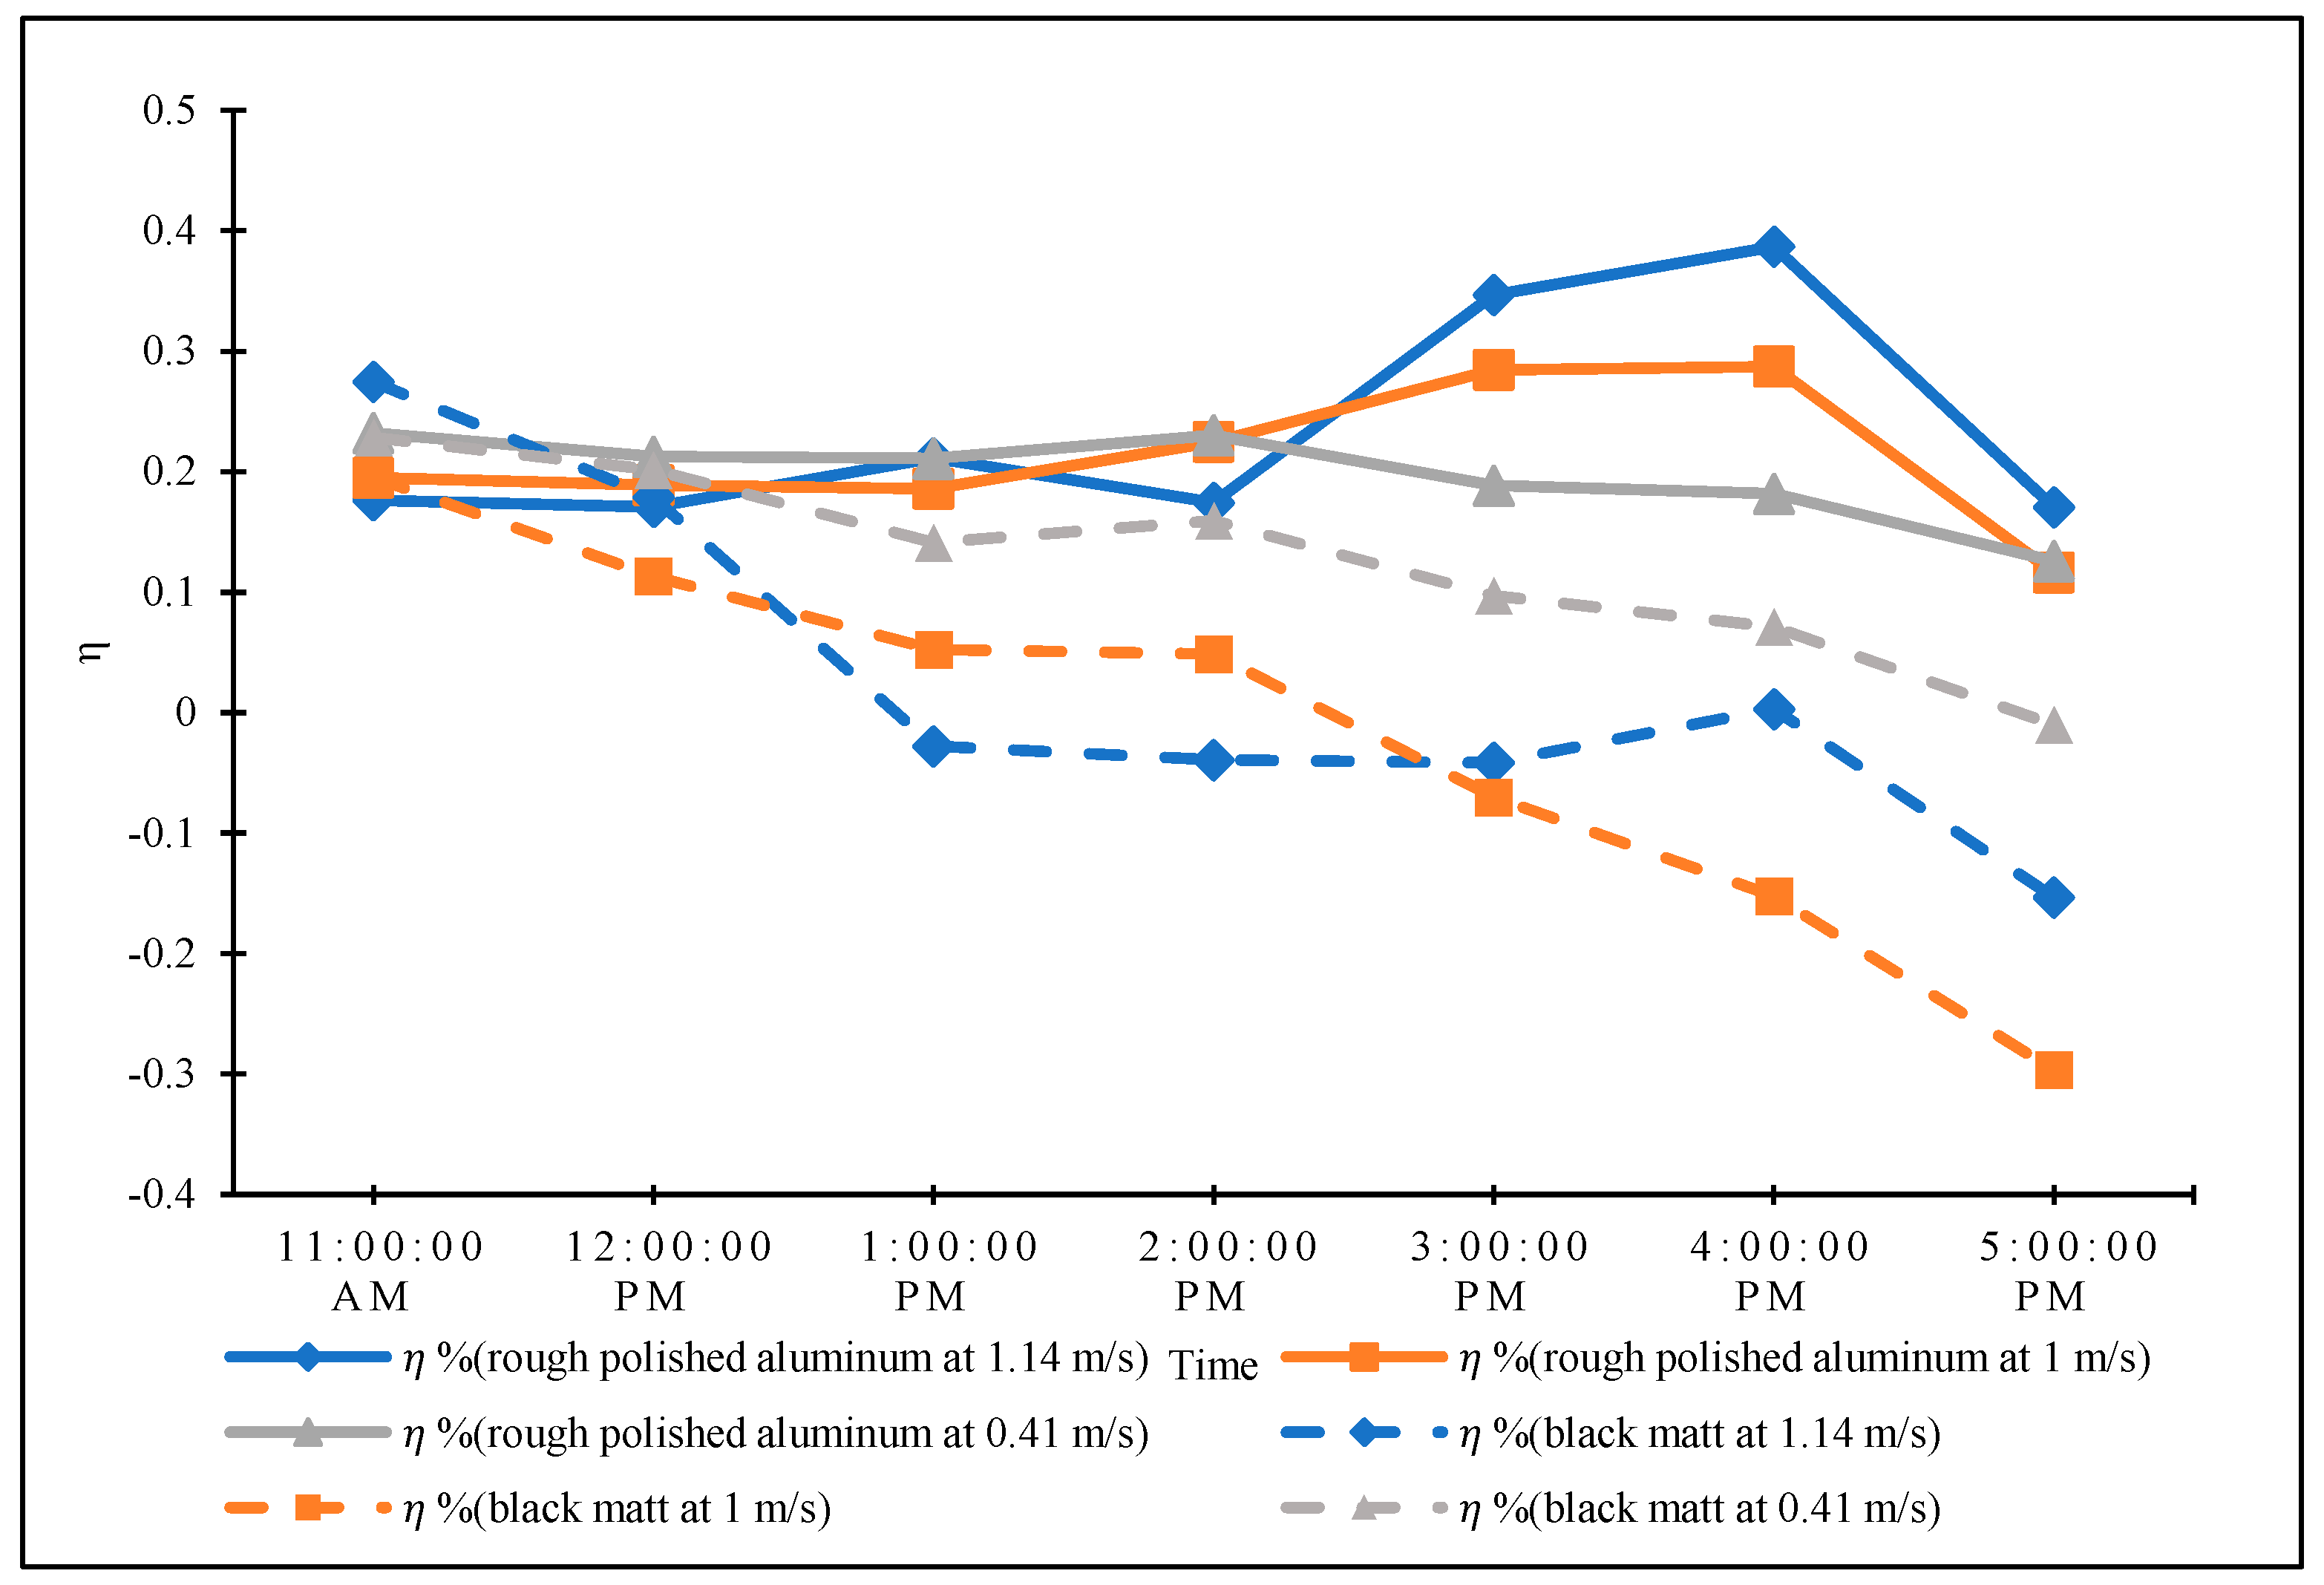
Figure 11 shows the thermal efficiency curves with the polished and black matte absorbers at different inlet air velocities. At an inlet air velocity of 1.14 m/s, the collector with the polished absorber had a thermal efficiency of 0.2 between 11:00 a.m. and 2:00 p.m., which increased to 0.34 and 0.39 at 3:00 p.m. and 4:00 p.m., respectively. The collector with the black matte absorber had a thermal efficiency of 0.2 between 11:00 a.m. and 12:00 p.m., which then decreased with time and reached −0.15 at 5:00 p.m. At an inlet air velocity of 1 m/s, the thermal efficiency of the collector with the polished absorber had a thermal efficiency of 0.2 between 11:00 a.m. and 2:00 p.m., which increased to 0.28 and 0.29 at 3:00 p.m. and 4:00 p.m., respectively. The collector with the black matte absorber had a thermal efficiency of 0.2 at 11:00 a.m., but the efficiency decreased to −0.3 at 5:00 p.m. At an inlet air velocity of 0.41 m/s, the thermal efficiency of the collector with the polished absorber had a thermal efficiency of 0.23 at 11:00 a.m., which decreased to 0.12 at 5:00 p.m. The collector with the black matte absorber had a thermal efficiency of 0.23 at 11:00 a.m., which decreased to 0.009 at 5:00 p.m. The results revealed that the black matte absorber plate with higher emissivity exhibited lower thermal efficiencies than the rough polished aluminum plate. This result is consistent with Tao et al. [25], who found that increasing the emissivity of the absorber plate of a flat-plate solar collector reduced its thermal efficiency due to the increase in thermal radiation losses back to the top cover. This is also consistent with the findings of Kong et al. [12] and Dagdougui et al. [11], who discovered that the solar collector’s top heat loss was reduced when a second cover was added; furthermore, combining Plexiglas and glass improved the collector’s efficiency. Furthermore, utilizing a double-layered transparent cover with a vacuum gap between layers would enhance insulation and reduce heat transfer between the absorber plate and the transparent cover, thereby reducing losses in our design.

3.6. Effects of Environmental Conditions

  • Figure 12, Figure 13 and Figure 14 show the effects of the surrounding air temperature on the thermal efficiency of the solar collector with both the polished and black matte absorbers at different inlet air velocities. At all inlet air velocities, the thermal efficiency showed a negative correlation with the surrounding air temperature with both types of absorbers. In other words, the thermal efficiency decreased with increasing temperature of the surrounding air. This is consistent with Equation (4) because a small ΔT reduces thermal efficiency and vice versa. However, this contradicts the results reported by Kong et al. [12], who discovered that a high ambient temperature significantly increases the solar collector’s thermal efficiency. This discrepancy in results could be attributed to the different solar collector designs and experimental conditions employed in the two studies. Figure 15, Figure 16 and Figure 17 show the effects of the relative humidity on the thermal efficiency. For the collector with the polished absorber, the thermal efficiency decreased as the relative humidity increased. For the collector with the black matte absorber, the thermal efficiency increased with the relative humidity. However, the collector showed a higher thermal efficiency with the polished absorber than with the black matte absorber for a given temperature and relative humidity. The highest thermal efficiency was obtained at an inlet air velocity of 1.14 m/s. This is because a higher inlet air velocity increases the volumetric airflow rate inside the collector, which increases the flow resistance and hence the convective heat transfer coefficient. This increases the rate of heat gain through the airflow from the absorber plate and reduces heat loss through radiation from the transparent cover. High ambient temperature and relative humidity were found to decrease the collector’s thermal efficiency. This can be explained by considering that air with a high humidity has a higher heat capacity than air with a low humidity, necessitating a greater amount of heat energy to raise its temperature.

4. Conclusions

  • A 3D numerical model of a flat-plate solar collector was developed and validated. The validated model was then used to analyze the flow and heat transfer characteristics of the collector. The design of the flat-plate solar collector used in this study was distinct from the ones developed and tested in the literature (closed-tube collectors in [16,17] and a corrugated channel with a high surface area in [15]), featuring the use of baffle-type channels that direct the working air through the flat-plate solar collector, with air being in direct contact with the bottom absorber plate and top transparent cover. Furthermore, unlike previous studies, this study also investigated the effect of three inlet air velocities (air flow rates) and the surrounding relative humidity on the thermal efficiency of the flat-plate solar collector.
  • The results showed that the internal baffles of the solar collector increased the air dwell time inside the channels of the collector and improved its thermal efficiency. However, they also caused flow separation, which resulted in flow losses in the first three channels. Optimizing the width of the first channel can improve the heat exchange between the absorber plate and airflow and thus improve the thermal efficiency of the solar collector. The results also indicated that the transparent cover through which the collector acquired heat was also the primary source of heat loss, with an average loss of −45.30 W/m2 as calculated by the numerical model. This is due to longwave radiation emitted from the absorber plate back through the transparent cover as well as heat loss from improperly insulated sidewalls. To address this issue, utilizing a double-layered transparent cover with a vacuum gap between layers would enhance insulation and reduce heat transfer between the absorber plate and the transparent cover, thereby reducing losses in our design. This study also revealed that increasing the inlet air velocity (or flow rate) increases the flow resistance. Thus, the convective heat transfer coefficient increases as more heat radiated from the absorber plate is absorbed by the air as opposed to being lost, resulting in an increase in the thermal efficiency of the collector. However, the experimental results demonstrated that ΔT decreases as the flow rate increases due to an increase in heat loss, which reduces heat gain. The results also demonstrated that high ambient temperature and relative humidity were found to decrease the collector’s thermal efficiency. Finally, increasing the absorber plate’s emissivity with black matte coating did not enhance its thermal efficiency. Conversely, it was determined in every experiment that the thermal efficacy of the black matte-coated absorber plate was lower than that of the rough polished aluminum absorber plate.

Author Contributions

Conceptualization, T.A.-S. and F.A.K.; methodology, T.A.-S. and F.A.K.; software, F.A.J. and F.A.K.; validation, F.A.K.; formal analysis, F.A.K.; investigation, F.A.K.; resources, T.A.-S.; data curation, F.A.J. and F.A.K.; writing—original draft preparation, F.A.K.; writing—review and editing, F.A.K., T.A.-S., P.B.P., F.A.J., N.A.-A. and O.A.G.; visualization, T.A.-S.; supervision, T.A.-S.; project administration, T.A.-S.; and funding acquisition, T.A.-S. All authors have read and agreed to the published version of the manuscript.

Funding

This work was supported by Sultan Qaboos University [grant: Dean’s Seed Fund].

Data Availability Statement

The data presented in this study are available on request from the corresponding author. The data are not publicly available due to privacy reasons.

Conflicts of Interest

The authors declare no conflict of interest.

References

  1. Boateng, I.D. A review of solar and solar-assisted drying of fresh produce: State of the art, drying kinetics, and product qualities. J. Sci. Food Agric. 2023, 103, 6137–6149. [Google Scholar] [CrossRef]
  2. El Hage, H.; Herez, A.; Ramadan, M.; Bazzi, H.; Khaled, M. An investigation on solar drying: A review with economic and environmental assessment. Energy 2018, 157, 815–829. [Google Scholar] [CrossRef]
  3. El-Mesery, H.S.; El-Seesy, A.I.; Hu, Z.; Li, Y. Recent developments in solar drying technology of food and agricultural products: A review. Renew. Sustain. Energy Rev. 2022, 157, 112070. [Google Scholar] [CrossRef]
  4. Lakshmi, D.V.N.; Muthukumar, P.; Layek, A.; Nayak, P.K. Drying kinetics and quality analysis of black turmeric (Curcuma caesia) drying in a mixed mode forced convection solar dryer integrated with thermal energy storage. Renew. Energy 2018, 120, 23–34. [Google Scholar] [CrossRef]
  5. Delgado-Plaza, E.; Peralta-Jaramillo, J.; Quilambaqui, M.; Gonzalez, O.; Reinoso-Tigre, J.; Arevalo, A.; Arancibia, M.; Paucar, M.; Velázquez-Martí, B. Thermal evaluation of a hybrid dryer with solar and geothermal energy for agroindustry application. Appl. Sci. 2019, 9, 4079. [Google Scholar] [CrossRef]
  6. Hao, W.; Liu, S.; Mi, B.; Lai, Y. Mathematical modeling and performance analysis of a new hybrid solar dryer of lemon slices for controlling drying temperature. Energies 2020, 13, 350. [Google Scholar] [CrossRef]
  7. Saini, R.K.; Saini, D.K.; Gupta, R.; Verma, P.; Thakur, R.; Kumar, S.; Wassouf, A. Technological development in solar dryers from 2016 to 2021—A review. Renew. Sustain. Energy Rev. 2023, 188, 188. [Google Scholar] [CrossRef]
  8. Motahayyer, M.; Arabhosseini, A.; Samimi-Akhijahani, H. Numerical analysis of thermal performance of a solar dryer and validated with experimental and thermo-graphical data. Sol. Energy 2019, 193, 692–705. [Google Scholar] [CrossRef]
  9. Hu, J.J.; Sun, X.S.; Xu, J.L.; Li, Z.X. Numerical analysis of mechanical ventilation solar air collector with internal baffles. Energy Build. 2013, 62, 230–238. [Google Scholar] [CrossRef]
  10. Bei, N.; Yun, D.; Qing, Y. Numerical simulation study on flat plate solar collector in series-connected system. Energy Conserv. Technol. 2011, 29, 20–23. (In Chinese) [Google Scholar]
  11. Dagdougui, H.; Ouammi, A.; Robba, M.; Sacile, R. Thermal analysis and performance optimization of a solar water heater flat plate collector: Application to Te’touan (Morocco). Renew. Sustain. Energy Rev. 2011, 15, 630–638. [Google Scholar] [CrossRef]
  12. Kong, X.; Lin, L.; Li, Y.; Ma, D. Simulation of thermal performance of flat-plate solar collector. Acta Energ. Solaris Sincia 2013, 38, 1404–1408. (In Chinese) [Google Scholar]
  13. Lu, Y.; Hongwen, Y.; Haicheng, D. Mathematical modeling and simulation of thermal properties of flat-plate solar collector. J. Univ. Jinan (Nat. Sci.) 2003, 27, 293–297. (In Chinese) [Google Scholar]
  14. Manoram, R.B.; Nagulan, T.; Kavinesh, B.; Kishore Kannan, J.K.; Kowshik, B. Numerical investigation on flat plate collector with struts for drying of fruits and vegetables. IOP Conf. Ser. Mater. Sci. Eng. 2020, 993, 012138. [Google Scholar] [CrossRef]
  15. Alvarez, A.; Cabeza, O.; Muñiz, M.C.; Varela, L.M. Experimental and numerical investigation of a flat-plate solar collector. Energy 2010, 35, 3707–3716. [Google Scholar] [CrossRef]
  16. Villar, N.M.; López, J.M.C.; Muñoz, F.D.; García, E.R.; Andrés, A.C. Numerical 3-D heat flux simulations on flat plate solar collectors. Sol. Energy 2009, 83, 1086–1092. [Google Scholar] [CrossRef]
  17. Selmi, M.; Al-Khawaja, M.J.; Marafia, A. Validation of CFD simulation for flat plate solar energy collector. Renew. Energy 2008, 33, 383–387. [Google Scholar] [CrossRef]
  18. Singh, R.; Salhan, P.; Kumar, A. CFD modelling and simulation of an indirect forced convection solar dryer. IOP Conf. Ser. Earth Environ. Sci. 2021, 795, 012008. [Google Scholar] [CrossRef]
  19. Behera, D.D.; Mohanty, R.C.; Mohanty, A.M. Thermal performance of a hybrid solar dryer through experimental and CFD investigation. J. Food Process Eng. 2023, 46, e14386. [Google Scholar] [CrossRef]
  20. Iranmanesh, M.; Samimi Akhijahani, H.; Barghi Jahromi, M.S. CFD modeling and evaluation the performance of a solar cabinet dryer equipped with evacuated tube solar collector and thermal storage system. Renew. Energy 2020, 145, 1192–1213. [Google Scholar] [CrossRef]
  21. Lopes, D.; Agujetas, R.; Puga, H.; Teixeira, J.; Lima, R.; Alejo, J.P.; Ferrera, C. Analysis of finite element and finite volume methods for fluid-structure interaction simulation of blood flow in a real stenosed artery. Int. J. Mech. Sci. 2021, 207, 106650. [Google Scholar] [CrossRef]
  22. McAdams, W.H. Heat Transmission, 3rd ed.; McGraw Hill: New York, NY, USA, 1954. [Google Scholar]
  23. Cerón, J.F.; Pérez-García, J.; Solano, J.P.; García, A.; Herrero-Martín, R. A coupled numerical model for tube-on-sheet flat-plate solar liquid collectors. Analysis and validation of the heat transfer mechanisms. Appl. Energy 2015, 140, 275–287. [Google Scholar] [CrossRef]
  24. Lingayat, A.; Chandramohan, V.P.; Raju, V.R.K. Design, development and performance of indirect type solar dryer for banana drying. Energy Procedia 2017, 109, 409–416. [Google Scholar] [CrossRef]
  25. Liu, T.; Lin, W.; Gao, W.; Luo, C.; Li, M.; Zheng, Q.; Xia, C. A parametric study on the termal performance of a solar air collector with a V-groove absorber. Int. J. Green Energy 2007, 4, 601–622. [Google Scholar] [CrossRef]
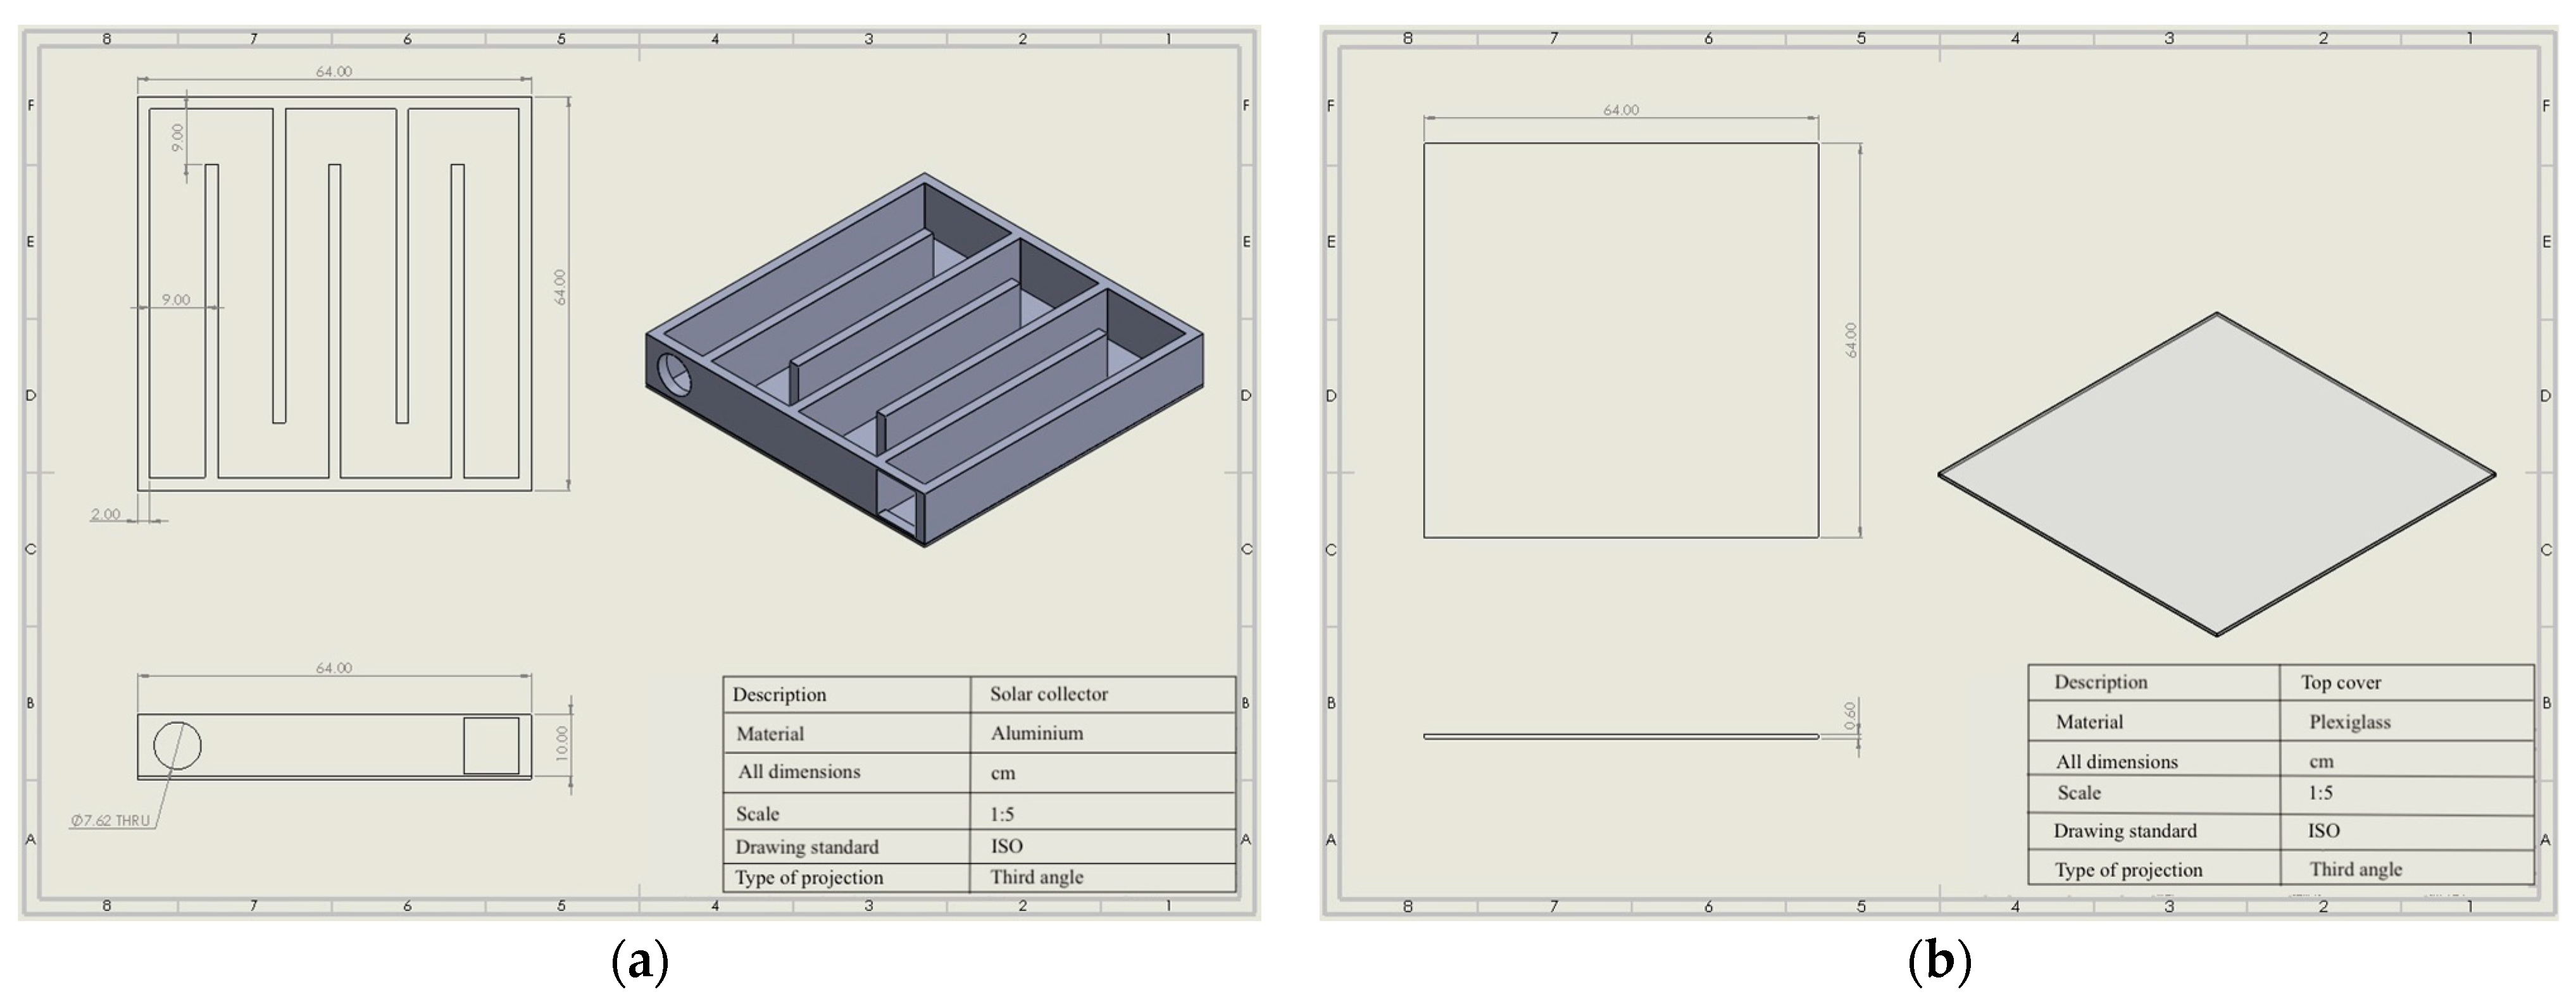
Figure 1. (a) Flat-plate solar collector with baffles. (b) Transparent top cover.
Agriengineering 05 00144 g001
Figure 2. Experimental setup for the flat-plate solar collector: (a) polished absorber plate and (b) absorber plate coated with black matte paint.
Agriengineering 05 00144 g002
Figure 3. Blower input power vs. inlet air velocity.
Agriengineering 05 00144 g003
Figure 4. Meshed fluid domain of the flat-plate solar collector.
Agriengineering 05 00144 g004
Figure 5. Error percentage of the outlet temperature according to mesh size at different inlet air velocities (note: average of measurements taken for the 3 days of 17 July, 29 July, and 15 September 2019 at 5:00 p.m., 11:00 a.m., and 2:00 p.m. for inlet air velocities of 1.14 m/s, 1 m/s, and 0.41 m/s, respectively).
Agriengineering 05 00144 g005
Figure 6. Error percentage of the outlet air velocity according to mesh size at different inlet air velocities (note: average of measurements taken for the 3 days of 17 July, 29 July, and 15 September 2019 at 5:00 p.m., 11:00 a.m., and 2:00 p.m. for inlet air velocities of 1.14 m/s, 1 m/s, and 0.41 m/s, respectively).
Agriengineering 05 00144 g006
Figure 7. Error percentage of the outlet temperature with the polished absorber plate at different inlet air velocities.
Agriengineering 05 00144 g007
Figure 8. Error percentage of the outlet temperature with the absorber plate coated with black matte paint at different inlet air velocities.
Agriengineering 05 00144 g008
Figure 9. (a) Streamlines and (b) temperature distribution of the airflow inside the collector.
Agriengineering 05 00144 g009
Figure 10. Change in temperature (ΔT) at different inlet air velocities.
Agriengineering 05 00144 g010
Figure 11. Thermal efficiency of the solar collector at different inlet air velocities.
Agriengineering 05 00144 g011
Figure 12. Thermal efficiency vs. temperature of the surrounding air at an inlet air velocity of 1.14 m/s.
Agriengineering 05 00144 g012
Figure 13. Thermal efficiency vs. temperature of the surrounding air at an inlet air velocity of 1 m/s.
Agriengineering 05 00144 g013
Figure 14. Thermal efficiency vs. temperature of the surrounding air at an inlet air velocity of 0.41 m/s.
Agriengineering 05 00144 g014
Figure 15. Thermal efficiency vs. relative humidity of the surrounding air at an inlet air velocity of 1.14 m/s.
Agriengineering 05 00144 g015
Figure 16. Thermal efficiency vs. relative humidity of the surrounding air at an inlet air velocity of 1 m/s.
Agriengineering 05 00144 g016
Figure 17. Thermal efficiency vs. relative humidity of the surrounding air at an inlet air velocity of 0.41 m/s.
Agriengineering 05 00144 g017
Table 1. Advantages and disadvantages of different types of solar dryers [3].
Dryer TypeAdvantagesDisadvantages
DirectSimple in construction, low cost, easy for loading and unloading products, protects agricultural products from dust and rain, and simple to operate.Low capacity
IndirectHigher drying rate than direct dryers, higher quality of dried products, good drying efficiency suitable for small farmsHigh capital cost
PassiveSimple to install and low capital and running costsLow capacity
ActiveShorter drying period than a passive dryerMore complex and expensive than a passive dryer
MixedSolar energy is incident on both the solar collector and drying chamber, high drying rate, and high drying efficiencyHigh capital cost
HybridCan operate during the absence of solar radiation, faster drying rate than passive and active dryersExpensive and still depends on fuel/gas
Table 2. Specifications of measurement devices used in the experiment.
Measurement DeviceParameterModelCompany/CountryPrecision
ThermocoupleTemperatureTT-T-22-SLE-1000OMEGA/Norwalk/CT/USA±1 °C
Digital anemometerAir velocityHHF-SD1OMEGA/Norwalk/CT/USA±(5% of reading + 0.1 m/s)
Wind speed sensorWind speed034B-ETCampbell Scientific/Logan/UT/USA±1.1% of true reading
PyranometerHeat fluxCS305-ETCampbell Scientific/Logan/UT/USA±5% for daily total radiation
Temperature/RH probeRelative humidityHMP60-ETSCampbell Scientific/LoganUT/USA±5% of reading
Table 4. Input parameters for different inlet air velocities.
Inlet Air Velocity (m/s)1.1410.41
Input Parameters
Inlet temperature (°C)34.6636.2537.15
Heat flux (W/m2)319.36778.63806.35
Heat transfer coefficient (W/m2 K)20.3916.3919.60
Table 5. Measured and calculated parameters with the polished aluminum absorber plate at different inlet air velocities.
Inlet Air Velocity (m/s)1.1410.41
TimeHeat Flux (W/m2)Heat Transfer Coefficient (W/m2-K)Inlet Air Temperature (°C)Heat Flux (W/m2)Heat Transfer Coefficient (W/m2-K)Inlet Air Temperature (°C)Heat Flux (W/m2)Heat Transfer Coefficient (W/m2-K)Inlet Air Temperature (°C)
11:00 a.m.762.718.237.1778.616.436.3773.814.438.5
12:00 p.m.850.221.037.0861.618.137.3850.720.637.4
1:00 p.m.859.822.435.6875.221.737.0868.621.037.1
2:00 p.m.792.323.035.8820.522.235.8806.419.637.2
3:00 p.m.618.424.335.1695.821.935.5691.619.937.3
4:00 p.m.516.723.334.8528.220.335.7521.020.436.8
5:00 p.m.319.420.434.7326.618.236.0312.918.636.1
Note: Average of measurements taken for the 3 days of 17 July, 29 July, and 15 September 2019.
Table 6. Measured and calculated parameters with the absorber plate coated by black matte paint at different inlet air velocities.
Inlet Air Velocity (m/s)1.1410.41
TimeHeat Flux (W/m2)Heat Transfer Coefficient (W/m2-K)Inlet Air Temperature (°C)Heat Flux (W/m2)Heat Transfer Coefficient (W/m2-K)Inlet Air Temperature (°C)Heat Flux (W/m2)Heat Transfer Coefficient (W/m2-K)Inlet Air Temperature (°C)
11:00 a.m.588.914.528.3591.213.527.9588.914.529.0
12:00 p.m.671.514.230.5682.012.531.8671.514.231.6
1:00 p.m.670.116.234.9705.614.933.8670.116.236.0
2:00 p.m.630.720.234.2624.817.633.6630.720.234.4
3:00 p.m.527.221.432.2533.218.934.9527.221.435.4
4:00 p.m.367.421.930.1363.719.232.9367.421.932.5
5:00 p.m.177.721.028.3186.018.029.2177.721.028.9
Note: Average of measurements taken for the 3 days of 9 and 22 December 2019 and 22 January 2020.
Table 7. Experimental and predicted outlet temperatures with the polished absorber plate at different inlet air velocities.
Inlet Air Velocity (m/s)1.1410.41
ExperimentModel ExperimentModel ExperimentModel
TimeTout (°C)Tout (°C)Error%Tout (°C)Tout (°C)Error%Tout (°C)Tout (°C)Error%
11:00 a.m.40.840.90.341.941.90.053.154.63.0
12:00 p.m.41.041.30.843.343.10.552.153.83.3
1:00 p.m.40.639.91.743.042.90.352.053.83.5
2:00 p.m.39.639.50.442.641.23.252.352.91.1
3:00 p.m.41.039.92.842.840.26.047.950.86.0
4:00 p.m.40.338.64.241.339.25.144.546.95.4
5:00 p.m.36.236.20.137.438.12.039.342.37.8
Table 8. Experimental and predicted outlet temperatures with the absorber plate coated by black matte paint at different inlet air velocities.
Inlet Air Velocity (m/s)1.1410.41
ExperimentModel ExperimentModel ExperimentModel
TimeTout (°C)Tout (°C)Error%Tout (°C)Tout (°C)Error%Tout (°C)Tout (°C)Error%
11:00 a.m.32.832.12.032.132.10.139.937.75.6
12:00 p.m.33.834.83.034.633.43.542.641.62.4
1:00 p.m.34.435.94.335.235.30.443.745.33.8
2:00 p.m.33.535.04.434.734.70.142.541.32.8
3:00 p.m.31.632.94.133.535.66.339.641.13.9
4:00 p.m.30.130.51.430.833.48.334.636.45.2
5:00 p.m.27.528.53.627.229.58.528.830.87.1
Table 9. Error percentage of the experimental and predicted outlet air velocities.
Inlet Air Velocity (m/s)Outlet Air Velocity (m/s)Outlet Air Velocity (m/s)Error%
ExperimentModel
1.140.490.466.1
10.420.44.8
0.410.180.182.5
Disclaimer/Publisher’s Note: The statements, opinions and data contained in all publications are solely those of the individual author(s) and contributor(s) and not of MDPI and/or the editor(s). MDPI and/or the editor(s) disclaim responsibility for any injury to people or property resulting from any ideas, methods, instructions or products referred to in the content.