Article

Influence of Temperature and LED Light Spectra on Flavonoid Contents in Poa pratensis

Agricultural Systems Engineering, Technical University Munich, 85354 Freising, Germany
*
Author to whom correspondence should be addressed.
AgriEngineering 2024, 6(3), 2167-2178; https://doi.org/10.3390/agriengineering6030127
Submission received: 27 March 2024 / Revised: 24 May 2024 / Accepted: 10 June 2024 / Published: 12 July 2024

Abstract

:
Light and temperature are the driving forces in plant development and growth. Specific photoreceptors provide the ability to sense and interpret light and temperature to regulate growth. Under the limited light conditions in most sports stadiums, natural grasses suffer from light deficiency. Artificial light provided by light-emitting diodes (LEDs) is used to increase their growth and adjust their development. Flavonoids like flavonols and anthocyanins are influenced by light conditions and temperature. Increased blue light can elevate the content of these secondary metabolites. Remote measurements of internal parameters using non-destructive methods provided information on their content under different temperature conditions for quality monitoring. This experiment tested flavonoid contents in Kentucky bluegrass (Poa pratensis) for different blue-to-red light ratios (0.6 and 0.4) and three temperature courses (constant temperature of 4 °C, constant temperature of 12 °C, and temperature switching among 12–8–4–8–12 °C). The results show elevated levels of flavonoids under blue-dominant artificial light as well as increased content under low-temperature (4 °C) conditions. The lack of flavonoids at elevated temperatures (12 °C), especially under red-dominant light, suggests an increased requirement for artificial blue light at increased temperatures. Non-destructive flavonoid determination was suitable for this experiment and can therefore be used for practical sports turf quality monitoring.

1. Introduction

Light is one of the most important factors in plant growth and physiological development. Plants use light as an energy source for photosynthesis as well as a regulation factor for photomorphogenesis [1]. Their ability to harness sunlight via photosynthesis is achieved by chlorophyll a, which has peak absorption at 430 and 660 nm, and chlorophyll b, which has peak absorption at 450 and 640 nm [2]. In addition to photosynthetic pigments, secondary plant metabolites like flavonoids are affected by light intensity and quality [3]. Therefore, a shortage of light results in quality and growth deficiencies [4]. Seasonal and regional reasons as well as shading structures in artificial facilities like sports stadiums can lead to natural-light deficiency. Modern sports stadiums are of enormous sizes, with most of the ground areas covered during stadium construction, resulting in closed or semi-closed stadium rooftops. This severely reduces the amount of available natural light reaching the surface. Since most professional sports stadiums use natural turf grasses like Kentucky bluegrass (Poa pratensis), a sufficient amount of light is required to prevent reduced quality. All turf grass species show reduced quality under high shade levels, resulting in thin vertical growth of shoots and a decrease in turf density [5]. The decreased shoot density reduces the wear tolerance of the turf in general and makes it more vulnerable to the stress of games [6]. Therefore, plant cover and shoot density have been identified as quality parameters.
Turf grasses are monocotyledons of the Poaceae family and are commonly divided into warm-season and cold-season turf grasses [7]. Cold-season turf grasses are mostly used in Europe and North America due to their moderate-temperature requirements. The optimum temperature for cold-season turf grass growth is between 20 and 25 °C. Growth reduces rapidly below 10 °C and is severely slowed down below 5 °C [8]. Because of this temperature response, the experiment was designed accordingly. Turf grasses often consist of a mixture of species, usually including varieties of Kentucky bluegrass (Poa pratensis) and perennial ryegrass (Lolium perenne). These species show reasonable wear tolerance to withstand the resulting stresses of games. Additionally, depending on the variety, these two turf grasses show sufficient growth in shaded environments [9]. Therefore, the amount of light required for turf grass growth differs among studies based on varieties and mixtures. Cold-season grasses like the Kentucky bluegrass used in this experiment require a minimum daily light amount of 10–12 mol·m−2·d−1 [10]. Because of this, artificial light in the experiment was adjusted to 13 mol·m−2·d−1 to provide a sufficient amount of light for the plants. Light is measured in photosynthetic photon flux density (PPFD). During the process, photons of photosynthetic active radiation (PAR) from 400 to 700 nm are measured over base area per second (µmol·m−2·s−1). The accumulation of these PPFD measurements over a period of 24 h is called daily light integral (DLI) and is given in mol·m−2·d−1 [11].
The deficit in natural light in a sports stadium caused by shading or seasonal reasons can be corrected by using supplemental lighting. Light-emitting diodes (LEDs) are a convincing option for artificial plant lighting [12]. Their ability to generate light at distinct wavelengths depending on the type of construction material [13] and their energy efficiency make them ideal for various plant cultivation systems [14]. Changing the light spectrum by using LEDs results in mostly blue and red light because of the absorption peaks of chlorophyll, increasing the efficiency of artificial lighting for plants and reducing energy usage.
Apart from chlorophyll, additional photoreceptors in plants absorb light from specific parts of the spectra to control the plant’s development and physiology. Photoreceptor proteins have a small chromophore molecule that allows them to sense and respond to certain wavelengths of light in a spectral area specific to them, ranging from UV-B to the far-red region of the light spectrum [15]. A broad variety of physiological effects are controlled by photoreceptors and their subsequent signal chains. Paradiso and Proietti (2022) showed a precise overview of photoreceptors and their effects. Photoreceptors in plants sense light from the UV region with ultraviolet-resistant locus 8 (UVR8) [16]; over the blue spectral range with cryptochromes (CRY1–2), phototropins (phot1–2), and Zeitlupe proteins; and up to the red/far-red region with Phytochromes (PHY A-E) [17]. The signaling of the different photoreceptors influences key regulators of light-mediated plant development. The most influential are phytochrome-interacting factors (PIFs), constitutive photomorphogenic 1 (COP1), and elongated hypocotyl 5 (HY5). These regulators and their interactions under varying light conditions shape plants’ physiology and control their development [18].
Complementary to the physiological effects of photoreceptors, internal parameters like flavonoids are also affected by different light qualities. Flavonoids are a large group of plant secondary metabolites that are vital for plant growth, development, and protection, including UV stress response [19]. Flavonoids consist of different sub-groups. The portable fluorescence sensor Multiplex® (Force-A, Orsay Cedex, France; version 3) has the capacity to provide destruction-free measurement of flavonols and anthocyanins and was therefore used in this experiment. Anthocyanins and flavonols (e.g., quercetin) are associated with hormone interactions [20]. This results in a change in plant physiology because of the influence of flavonoids on the transport of hormones like auxin. The consequence is a change in the plant’s physiology, especially in terms of branching [21]. Flavonoid contents can be influenced by light quality, especially in the blue region [22]. Two spectra were chosen accordingly to prove these findings and identify the additional influence of temperature by excluding all other influences naturally occurring in stadiums, like wind and rain. The monitoring of flavonoid contents can, therefore, show the light influence and the effectiveness of light quality. Destruction-free measurement devices based on leaf absorption and fluorescent signals can provide information on these flavonoids [23]. Spectral reflectance is a reliable, non-destructive method correlated with visual assessments to estimate turf grass stressors. The measurements of canopy reflectance provide frequent data that can be correlated to turf grass health [24]. Remote sensing was developed in agriculture for health status growth and stress detection and can therefore be used for turf grass quality determination [25]. The advantage of this method is its applicability for rapid and large-area real-time dynamic monitoring [26]. Remote sensing has emerged as an efficient tool to collect quantitative data in a high-throughput manner. Remote sensing has additionally been used to monitor the nitrogen status of the plants and detect drought stress in turf grass systems [27]. Because of these advantages, remote sensing is feasible for practical use in turf grass monitoring under stadium conditions. This experiment should, therefore, act as a proof of concept for remote sensing use in stadiums for plant quality determination.
Consequently, light influences the internal and external physiology of plants, which can be manipulated with artificial light. The effects on plants can be measured with appropriate remote sensing devices. Certainly, another effect exerted on these parameters is temperature. Besides light, temperature influences plant development and growth and can be sensed by the photoreceptor phytochrome [28]. Downstream signaling on transcription factors like PHYTOCHROME-INTERACTING FACTOR (PIF) is used for temperature signaling [29]. Since more photoreceptors are involved in the signaling interaction with PIFs, an effect on flavonoid contents can be assumed [18]. In the example of P. pratensis, low-temperature conditions showed increased contents of phenolic compounds [30]. Therefore, the investigation of temperature influence on the phenolic content of P. pratensis is needed for light quality adjustment to optimize light conditions. Due to different temperatures depending on the season, location, and daytime, artificial-light quality adjustment could be reasonable in combination with temperature changes. Therefore, the observation of flavonoid alteration in closed environments at constant light intensity and spectrum must be observed to determine temperature effects to include them in future open-field applications and stadiums.
The objective of this study is to determine efficient artificial lightning at different temperatures through non-destructive measurement of temperature influence on flavonoid and anthocyanin contents in P. pratensis with different blue-to-red LED lighting ratios.

2. Materials and Methods

2.1. Plant Material and Transplantation

The Kentucky bluegrass var. Julius (P. pratensis) was used in this experiment because of the highly dense growth and high wear tolerance [6]. It was seeded on growing medium “A200” (Stender GmbH, Schermbeck, Germany) mixed with 20% quartz sand and fertilized with 10 g of mixed turf fertilizer 10N-5P-8K-7S (Schwab Rollrasen, Pörnbach, Germany) in 0.7 liter pots. The seeds were covered with quartz sand and cultivated for three months under shaded greenhouse conditions with a mean temperature of 15 °C. The plants were provided with an average of 10 mol·m−2·d−1 of natural light until transplantation into a cooling chamber without natural light that allowed the temperature to be adjusted between 1 to 30 °C by active cooling, with temperature measurements at a five-minute frequency. The plants were shortened once a week to a height of 3 cm. Twenty-four pots with Kentucky bluegrass were prepared in total as described above for the experimental procedures.

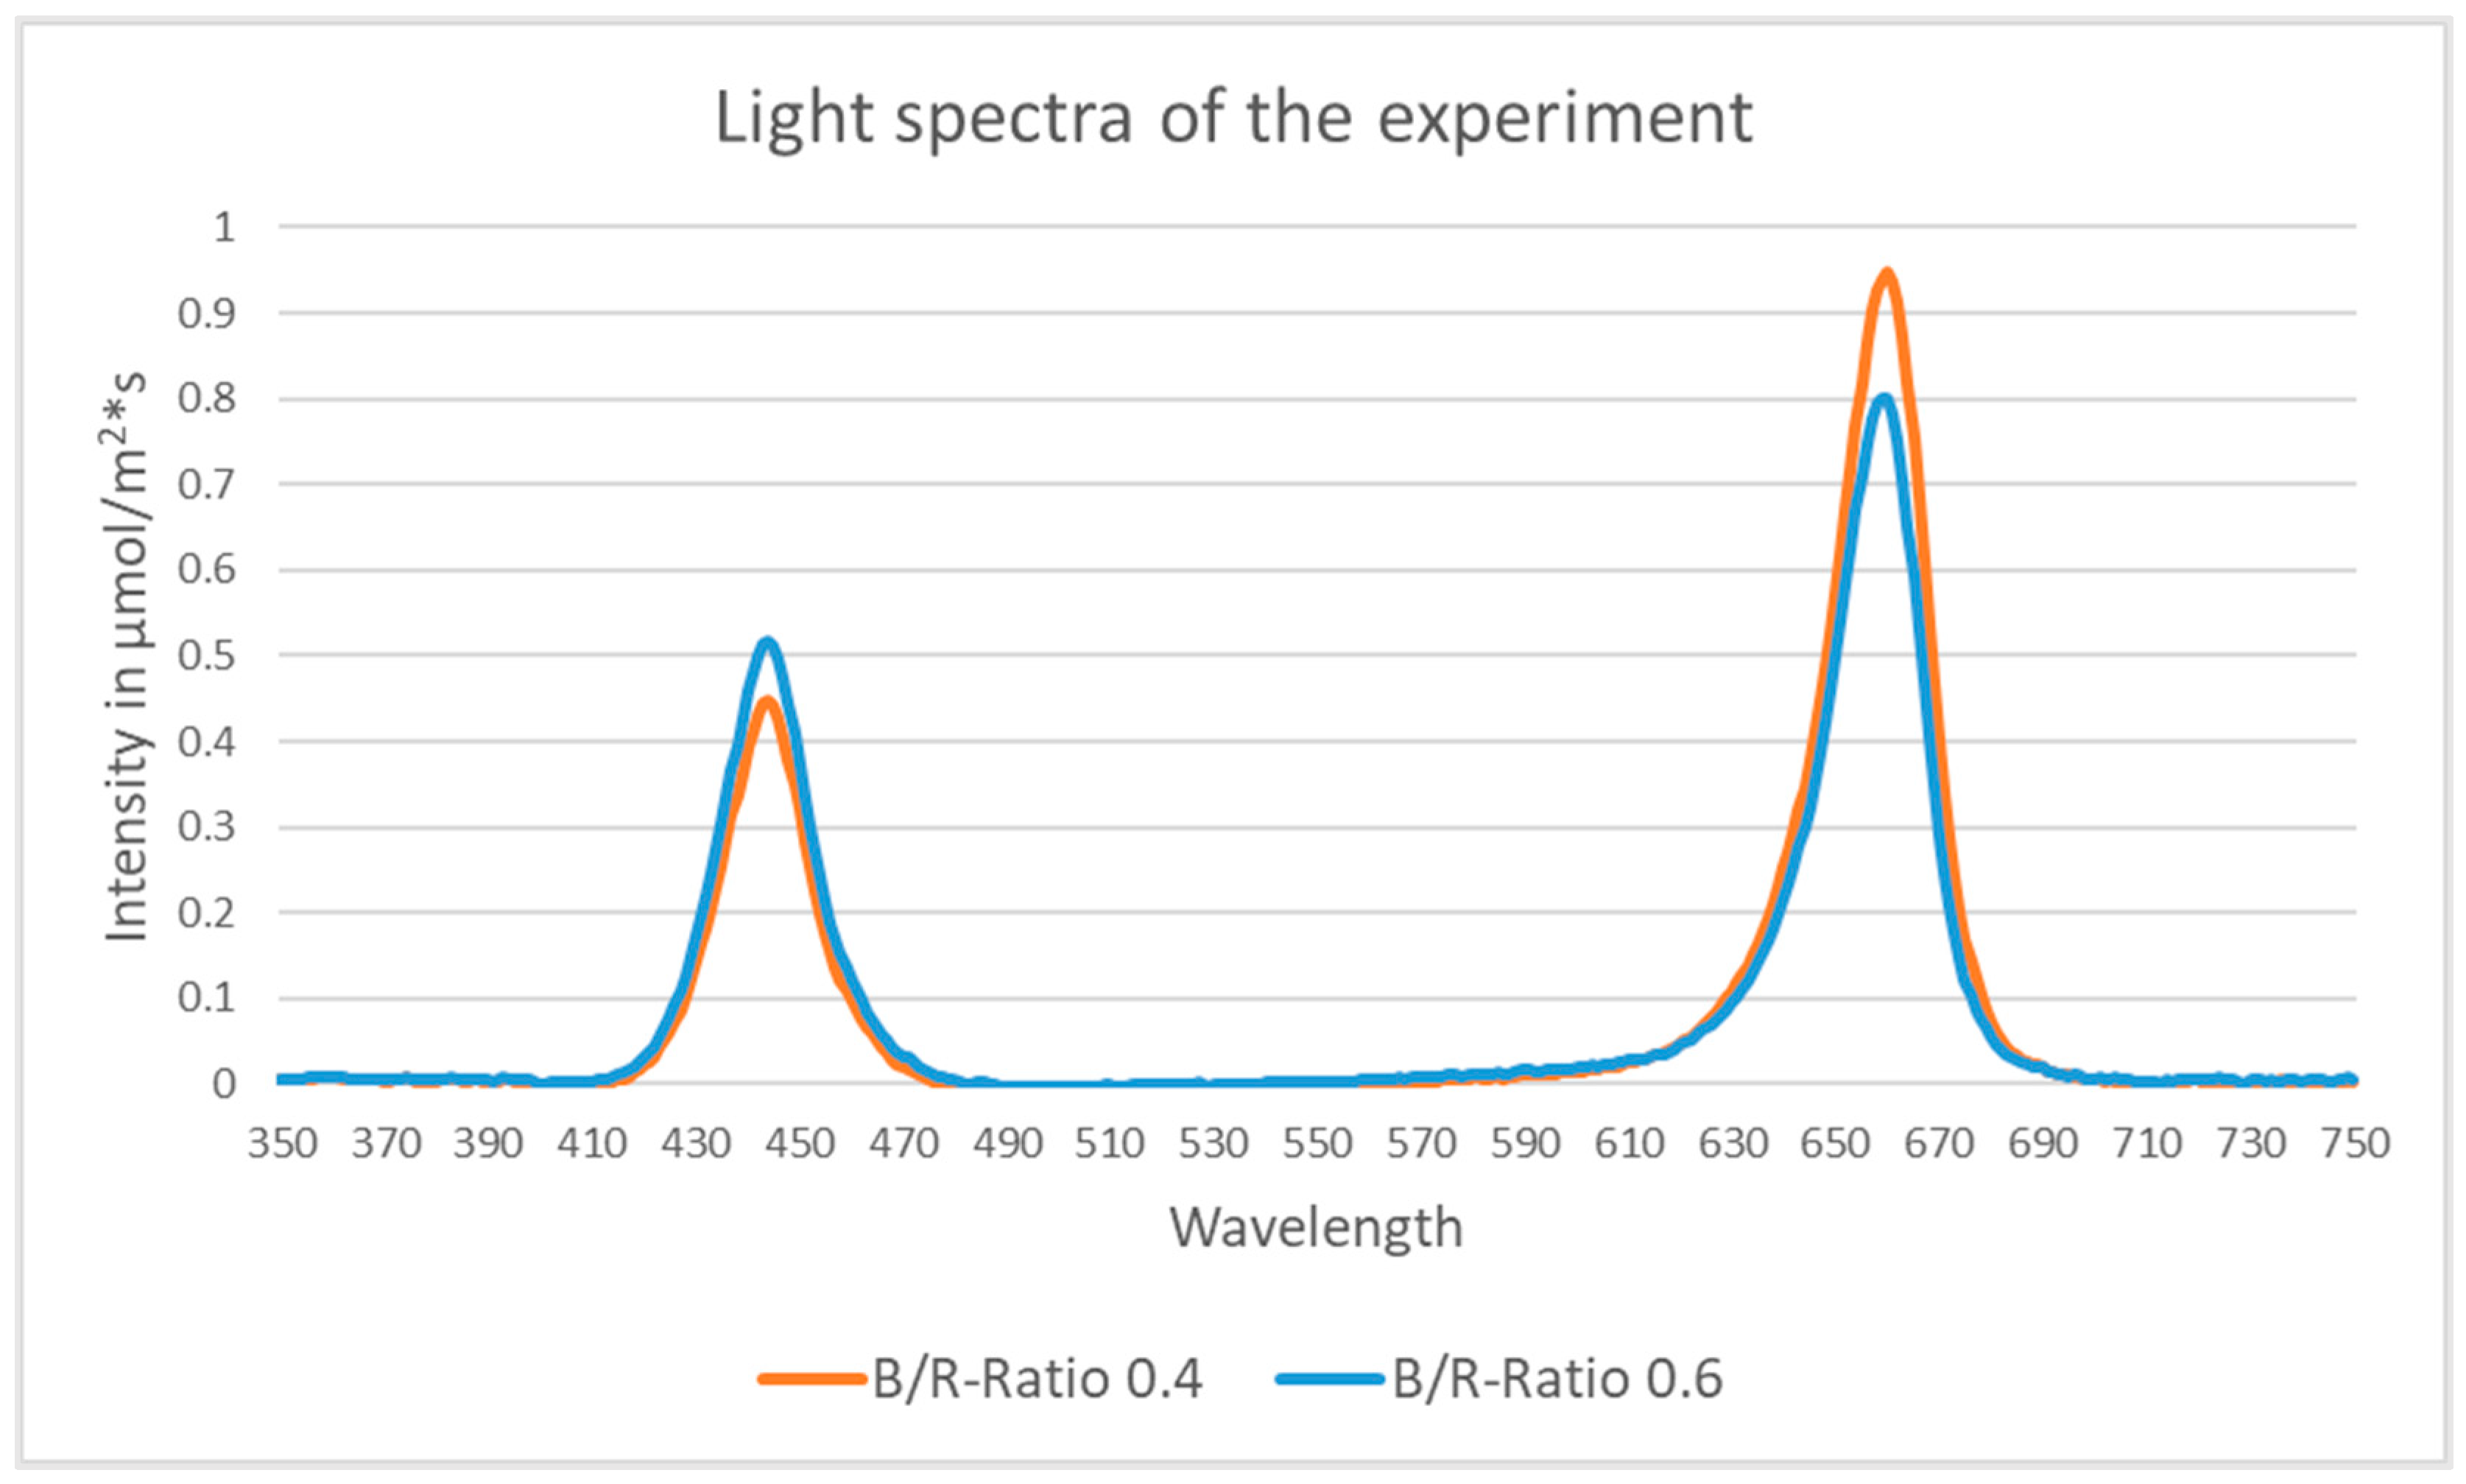
2.2. Experimental Design and Treatments

Eight pots were randomly distributed under two Mobile LED Racks by Rhenac GreenTec AG (Rhenac GreenTec AG, Hennef, Germany), resulting in four pots per rack. These LED racks emit variable light spectra in the range of 395–750 nm with a maximum photon flux density of 500 µmol·m−2·s−1. The light intensity for this experiment was adjusted with a quantum sensor (LI-190R; LI-COR Environmental GmbH, Bad Homburg, Germany) to 300 µmol·m−2·s−1 of artificial LED light consisting only of blue and red light. The peaks of the light spectrum were 445 nm for the blue LEDs and 660 nm for the red LEDs, as adjusted with the BLACK-Comet-HR Spectrometer by StellarNet (StellarNet, Inc., Florida, United States of America). A total of 12 h of daylight was given to the plants, resulting in a daily light integral (DLI) of 13 mol·m−2·d−1. The two artificial-light spectra were adjusted to blue-to-red ratios of 0.4 for the first rack and 0.6 for the second one (Figure 1).
The experiment was separated into three experimental procedures consisting of constant temperature of 4 °C, constant temperature of 12 °C, and weekly temperature changes among 12–8–4–8–12 °C. The relative humidity in all experiments was approximately 70% during daytime and 80% at night. Eight pots of Kentucky bluegrass were used for each of the three experimental procedures. The light intensity and spectra described before were used in all three experimental procedures. The plants were cultivated for one week at the predetermined temperatures in the cooling chamber for acclimation before the first remote measurements.
The overview of the experimental procedures is as follows:
  • Constant temperature of 4 °C over five weeks with three days of acclimatization (4 °C);
  • Constant temperature of 12 °C over five weeks with three days of acclimatization (12 °C);
  • Weekly temperature changes over five weeks, 12–8–4–8–12 °C, with three days of acclimatization (12 °C).

2.3. Internal Parameter Profile

The internal parameters were obtained at the same time every week over the five weeks of each experiment with a destruction-free measurement by the portable fluorescence sensor Multiplex® (Force-A, Orsay Cedex, France; version 3). The plants were measured for the first time after an acclimatization period of one week at their predetermined temperature of the experiment. Before the measurement, the plants were shortened to a height of 3 cm. Afterwards, the sensor was held closely over the plants to conduct the measurement. The Multiplex® sensor assesses plant pigment content by its screening effect on fluorescence. Multiparametric measurements upon excitation and detection of light at different wavelengths are used to calculate vegetation indices that quantify plant pigment concentrations [31].
The main internal parameter for the determination of temperature importance was the Multiplex-Unit for flavonols and anthocyanins because of the influence light and temperature can have on them [22]. The calculation of the indices for flavonols and anthocyanins can be performed through the logarithmic calculation of the far-red fluorescence (FRF) of red (R), green (G), and ultraviolet (UV) light of the measurement and their standards. The standards are provided by the measuring device itself. This results in two equations:
Anthocyanin Index = log(FRF_R/FRF_G) − log(std_FRF_R/std_FRF_G)
adjusted as per [31].
Flavonol Index = log(FRF_R/FRF_UV) − log(std_FRF_R/std_FRF_UV)
adjusted as per [23].
The anthocyanin content in this experiment was rated from −0.1 (low level) to 0.1 Multiplex-Units (high level). The flavonol content in this experiment was rated from 0.5 (low level) to 1.0 (high level) Multiplex-Units.

2.4. Length Increase at Switching Temperature

Besides the internal profile, the external parameter of length increase in cm per week was measured as a sample for length growth at different temperatures for the switching temperature experiment. The length increase measurement was performed once a week before the measurement of the internal parameters when the plants were shortened to 3 cm in height. The mean increase in height in cm over a week per pot resulted from this measurement. A complete measurement of length increase on the whole stadium was not feasible. Therefore, a sample of height increase was measured in this experimental procedure to verify connections between internal and external growth effects.

2.5. Data Analysis

The data are presented as means ± standard deviation and were analyzed by two-way analysis of variance (ANOVA) after verifying homoscedasticity by Levene’s test. Tukey’s HSD test was used to compare means at a significance level of p < 0.05. The influences of growth time (weeks), spectrum, and the interaction of these two factors were statistically analyzed. Since internal substances are accumulated over time, the parameter of time (weeks) was used to determine plant behavior over time under constant light conditions. All statistical analyses were conducted in RStudio (version 1.3.1093; RStudio Team (2020), Boston, MA, USA).

3. Results

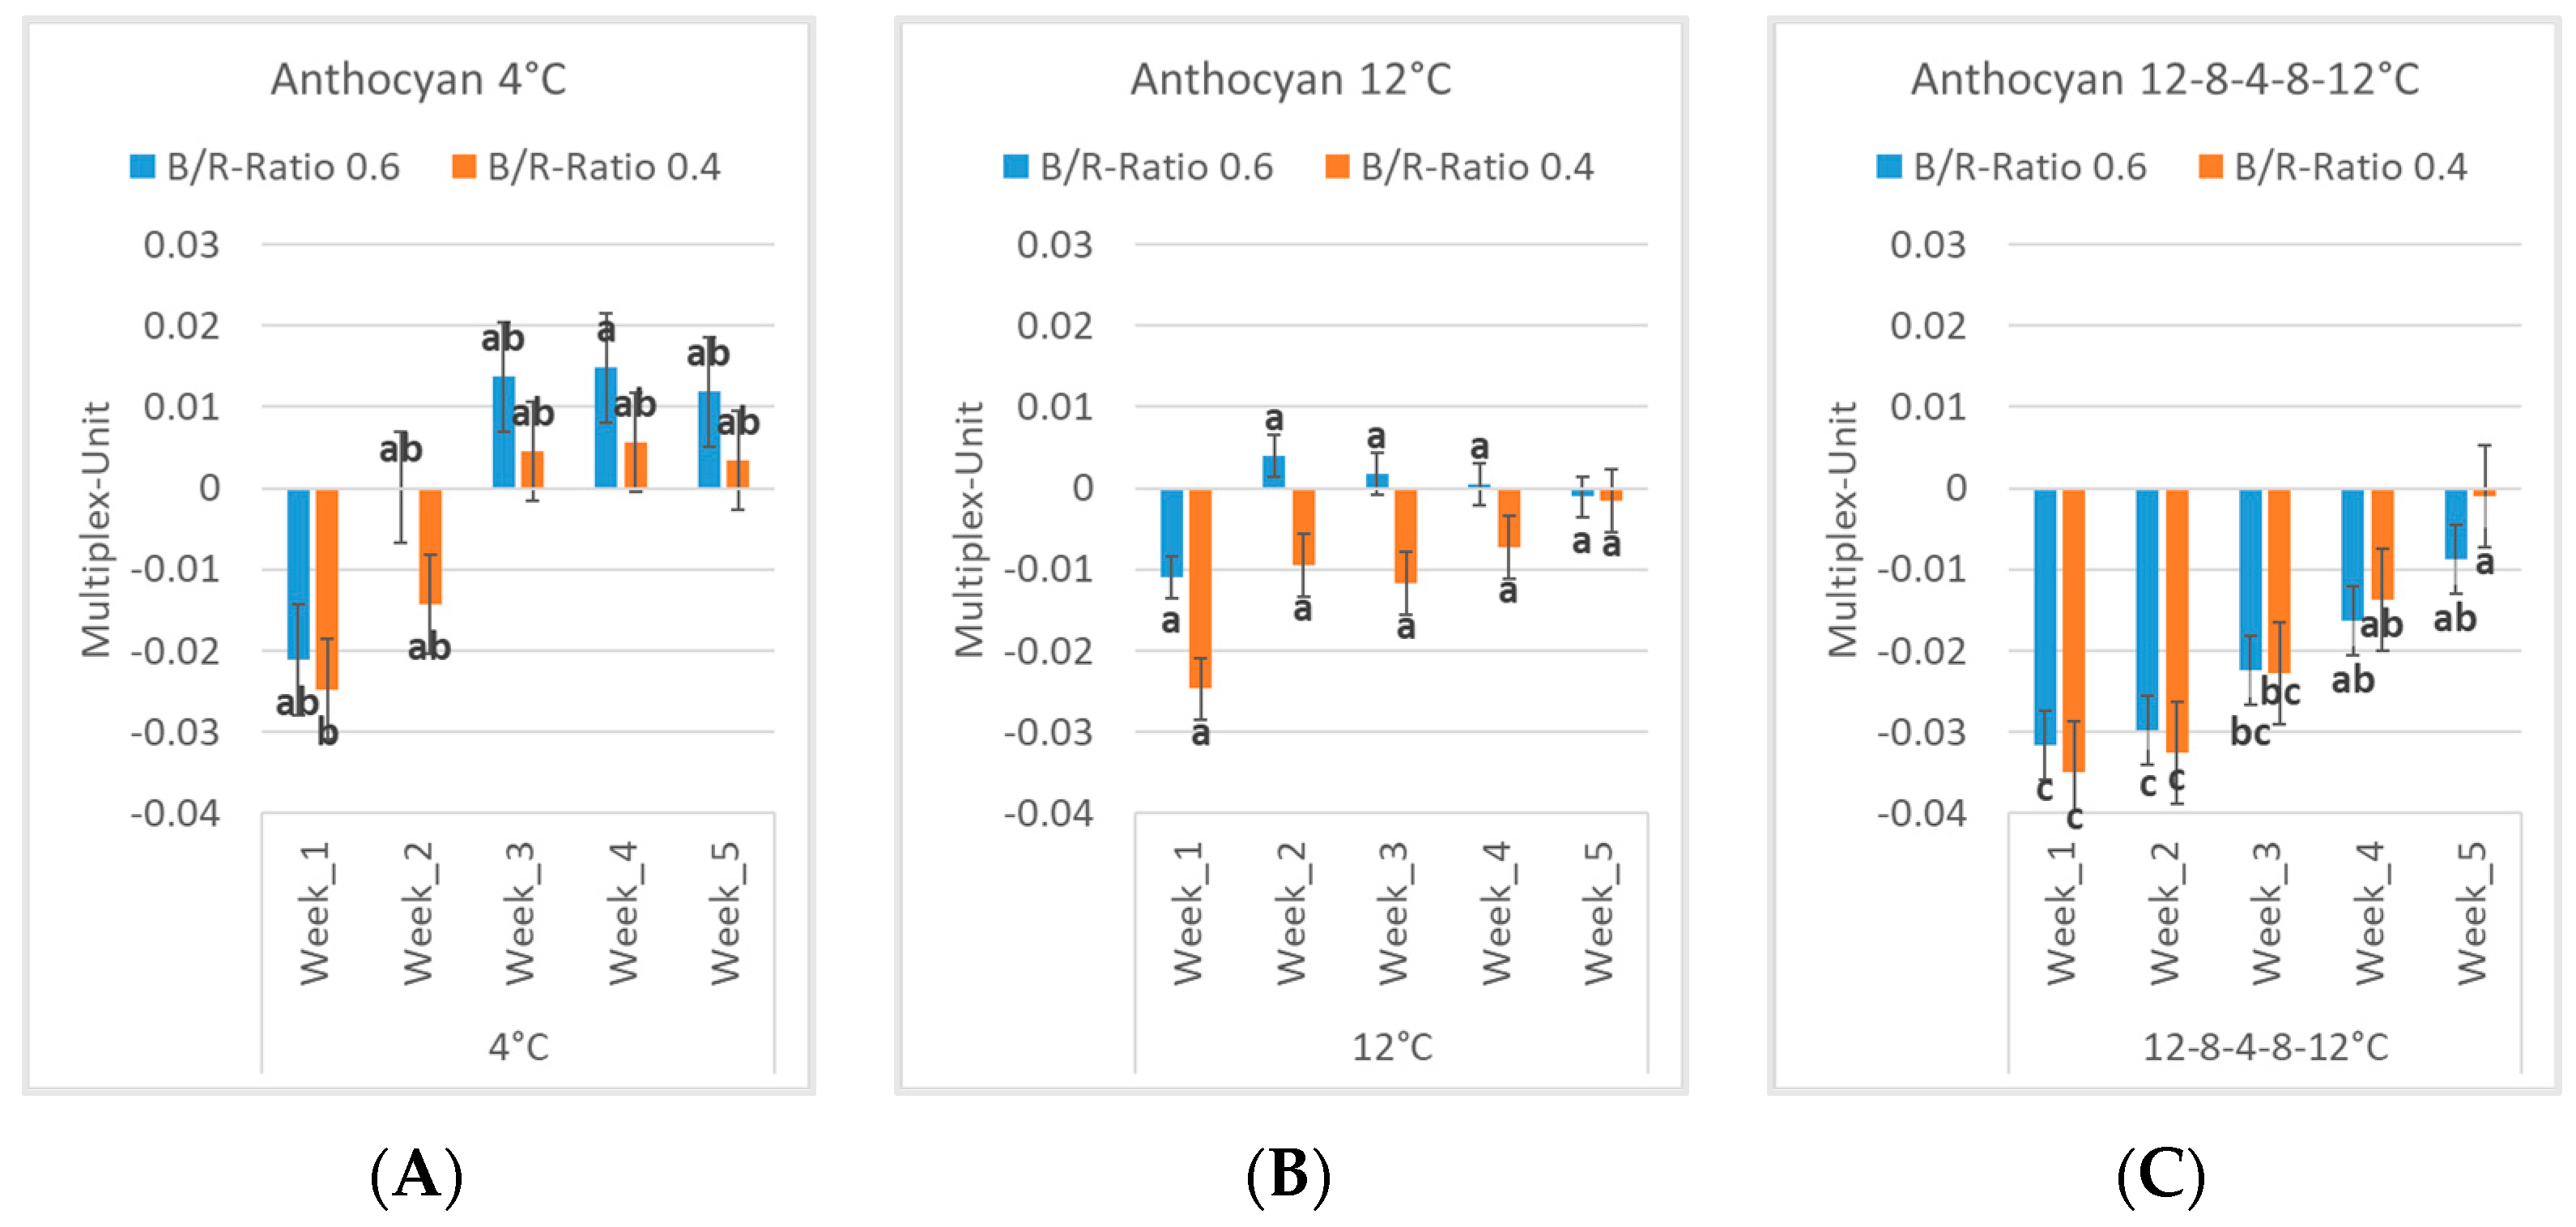
3.1. Internal Parameters: Flavonols and Anthocyanins

The measurements with the Multiplex® sensor resulted in weekly readings of flavonol and anthocyanin contents in Multiplex-Units for each pot in all three experiments after shortening the plants to 3 cm in height. The level of flavonols changed over the five weeks in all three experiments starting at 0.3 to 0.4 Multiplex-Units. In each case, the last week showed significant differences compared with the first week (Table 1 and Figure 2). The levels of flavonols in the 4 °C experiment increased until the third week and remained at nearly constant levels of around 0.6. The variant with increased blue light showed slightly higher concentrations over the whole time of the trial (Figure 2A). The 12 °C experiment, in contrast, showed a decrease in flavonoid levels until the fourth week before becoming constant at around 0.2 Multiplex-Units. The spectrum with higher blue content showed lower levels of flavonol content in the first two weeks but was higher from the third week to the last one (Figure 2B). The experimental procedure with switching temperature showed a small decrease in flavonol levels. This could be noticed in the second week, after which the levels increased until the last week. The blue spectrum showed slightly higher levels than the red one in this procedure except for the last week (Figure 2C).
The anthocyanin levels also changed over the five weeks in all three experimental procedures starting at −0.01 to −0.03 Multiplex-Units. Because of the logarithmic calculation and the relatively low concentrations, the results of this parameter can be negative. The negative results imply low content of anthocyanins. The 4 °C and 12 °C experimental procedures showed no significant differences among the weeks (Figure 3A,B). In contrast, the switching temperature procedure showed significant differences throughout the experimental period, especially between the first and the final week of the experiment (Table 1 and Figure 3C). The anthocyanin content increased in all three experimental designs over the weeks. The levels of blue-dominant light were always higher than the levels of the red-dominant light, except for the last two weeks of the switching temperature experimental procedure, where elevated anthocyanin contents under red-dominant light could be observed in comparison to blue-dominant light.

3.2. Differences among Experiments

The changing levels of internal parameters over the weeks showed partial significant differences. The comparison of the three experimental procedures in total showed significant differences. Plants of the experimental procedure at the lowest temperature (4 °C) showed the highest result in flavonol content over the five weeks. It was significantly higher compared with the other two procedures (Figure 4A). The switching temperature setting had slightly higher flavonol content compared with the highest-temperature (12 °C) experiment. The anthocyanin content was also the highest at the 4 °C constant temperature setting but only significantly increased compared with the varying temperature procedure (Figure 4B). Both internal parameters were elevated at the B/R ratio of 0.6 compared with the B/R ratio of 0.4. The only deviation was that in anthocyanin content in the varying temperature procedure, with slightly higher results at the B/R ratio of 0.4.

3.3. Differences in Length Increase

The length increase measurement for the switching temperature procedure varied severely with temperature changes. In the first week, at 12 °C, the length increase was over 4 cm per week and halved each week while the temperature was dropped to 8 °C and 4 °C. The length increase showed significant differences for the first three weeks. The temperature rise to 8 °C in week four resulted in a significant length increase compared with the third week. It was comparable to week two at the same temperature and only showed a slightly lower length increase. The results of week four were significantly lower than those of the first week. The further increase in temperature in week five to 12 °C resulted in a slightly elevated length increase compared with week four. Despite showing significant differences in length increase in week three at 4 °C, no statistical difference was found compared to week four at 8 °C. However, a significant difference was also perceived compared with the first week at 12 °C (Figure 5).

4. Discussion

The results show the clear influence of temperature on flavonoid quantity. Changes in the contents of flavonols and anthocyanins over five weeks were detected in all temperature experiments. The influence on these substances according to the spectrum was also noticeable in all experiments. In general, the contents of flavonols and anthocyanins were elevated under blue-dominant light. The effect of the photoreceptors under UV and blue light promoting flavonoid biosynthesis explains these results and shows the impact of differences in light spectra in experiments [22]. Especially, anthocyanin accumulation is increased under blue light conditions [32]. Further, the direct influence of light spectra stress conditions also increases the accumulation of flavonoids to protect plants from light damage [33]. Temperature change can also be considered a stress condition, and so can its frequent change. Changes in phenolic compounds due to temperature changes have been reported for different plant species. Secondary metabolite accumulation as a result of environmental stress can explain the increased content until a balanced state is reached [34]. In all the experimental procedures, measurements of higher anthocyanin content for the 0.4 ratio were exclusively present in the last two weeks of the switching temperature experimental procedure. Because of the increased content of anthocyanins compared with the blue-dominant light spectrum elevated proportions of red light seem to increase stress conditions for the plants at rising temperatures. Temperature changes in general seem to cause increased stress, since the anthocyanin levels of the two experiments at constant temperature showed relatively stable levels from week three to the last week. Certainly, the plants in the switching temperature experiment showed the highest means of anthocyanin contents under the three temperature regimes. Interestingly, the accumulation of anthocyanin content started around one week later than in the other experiments. The identification of that fact and the opposite development at the end of this experimental procedure suggest that more stress is induced by increases in temperatures after cold periods. The plants in the 4 °C experiment under blue light conditions showed the highest anthocyanin contents, confirming the previous assumptions of increased accumulation under conditions of lower temperature and increased blue light [30].
The flavonol content was decreased in the experiment at elevated temperature and, accordingly, in that with multiple high-temperature periods. Plants can react to elevated and lower temperatures. The increase in flavonoid production is in general increased at lower temperatures [35]. In all experiments, the blue-dominant variant showed elevated flavonol content compared with red-dominant artificial lighting. Since there was only a statistical difference in the variants under the 4 °C conditions, this temperature can indicate a limit for blue light intensity. In contrast, flavonol contents in the high-temperature experiments were relatively low, especially under red-dominant light. This suggests an increase in blue light to elevate flavonol levels. Appropriate content of flavonols is required for stable growth and development in P. pratensis. The results in length increase per week and the flavonol levels in the switching temperature experimental procedure indicate an influence of flavonols on length increase. The temperature increase in the last two weeks of the switching temperature experiment still showed elevated flavonol levels. The effect of temperature drop influenced plant growth and persisted for at least a week. The flavonol levels in the last week of the switching temperature procedure can be compared to the length increase per week. The results indicate a reduction in length growth at elevated flavonol levels. Flavonols like quercetin are associated, according to their structure, with interactions with plant hormones [20]. Studies indicate the influence of flavonols on PIN proteins relevant for auxin transport [36]. Additionally, flavonols affect the movement of auxin and influence plant physiology [21]. Bud outgrowth is increased by the hormone cytokinin, whose biosynthesis is inhibited by auxin [37]. Therefore, the branching of plants should be increased with reduced auxin activity. Auxin signaling itself interacts with further photoreceptors, like cryptochrome and phytochrome, and is therefore affected by light in different ways [38]. This results in a possibility to predict the plant´s growth behavior by monitoring the flavonoid levels by remote sensing.
The temperature interpretation of the phytochrome and consequently of PIFs is also influenced by light [29]. Additionally, the accumulation and localization of the core signaling components PIFs as well as COP1 and HY5 are dependent on light and temperature conditions [28]. The interaction of these components and their direct connection to the photoreceptors increases the control options with appropriate light spectra at associated temperatures [18]. Therefore, the efficiency of artificial light can be increased if spectral quality is adjusted according to temperature. Increased flavonol content at lower temperatures reduces the need for blue light to increase that parameter. Additionally, anthocyanin content provides information on the level of plant stress and can therefore be used as a source of information for blue light intensity. The increased stress condition compared with the low values of flavonols at elevated temperatures increases the need for blue light to ensure appropriate growth and development in plants. The adjustment of the light spectra according to temperature can be used for the optimization of plant growth. The results can be monitored with remote sensing devices to integrate internal plant parameters like flavonols for artificial-light management. The desired results are denser turfs with increased wear tolerance and more resistance to the stress of games if included in turf maintenance. Light-induced low-level stress caused by artificial light can, therefore, prepare and toughen up plants for the effects of games even if growth is slightly reduced.
In general, reduced growth in plants can be observed at lower temperatures. The reduction was greatest in the 4 °C experiment and confirmed the growing behavior of turf under reduced-temperature conditions [8]. The contents of internal parameters were the highest in the lowest-temperature experimental procedure. However, the effects of reduced temperature could already be perceived at 8 °C in a weakened form in the changing light experimental procedure. This indicates the temperature of 8 °C as a turning point for light spectral adjustment. The switching temperature experiment had a mean temperature of 8.8 °C over the five weeks. Therefore, it can be assumed as a mean for temperature influence in comparison with the other two experimental procedures. The reduction in growth at lower temperatures and thus the decreased use of available artificial light result in the possibility of adjusting the light intensity according to the temperature. If the plants only use a proportion of available light under low-temperature conditions, then reduced amount of light and energy input could be sufficient for healthy plant growth and reduced energy quantity. The non-destructive remote sensing method for plant status assessment showed reliable results of secondary plant metabolites comparable to literature findings. Therefore, remote sensing measurement devices look promising for the fast and constant monitoring of plant status on sports fields.
The purpose of the experiment was to prove the concept of light quality and temperature influence on plant quality by monitoring flavonoid contents with a remote sensing device. The results indicate a connection among temperature, light spectra, and flavonoid contents. Future experiments under open-field conditions must be conducted to validate the results of these experiments and the method of remote sensing for plant status assessment. Under open-field conditions, additional biotic and abiotic effects influence the growth and development of plants. Specifically, the effects of different temperatures and shading conditions and the effect of changing natural-light spectra influence the internal parameters. Therefore, experiments under open-field conditions with appropriate experimental designs should be carried out next to confirm the results of closed-environment attempts. These experiments should also indicate the ratio of blue-to-red artificial light and the possibility to adjust it under open-field conditions with natural light and under constantly changing temperature conditions. Additionally, open-field experiments are needed to verify the temperature turning point of light spectra for the matching temperature. The validation of the assumed temperature of 8 °C needs to be performed to reduce artificial-light input and increase efficiency by appropriate artificial-light management.

5. Conclusions

Plant growth and development are severely influenced by light and temperature. These influence include internal parameters like flavonols and anthocyanins. Non-destructive measurement devices can give appropriate information on these substances and, consequently, the option to influence them by artificial-light spectra at predetermined temperatures. The reduced levels of flavonols and anthocyanins at elevated temperatures confirm the influence of temperature on their contents. This concludes an elevated proportion of blue light in the artificial-light spectrum at elevated temperatures. This is required to increase the stability of plants and their ability to withstand lower and switching temperatures. In contrast, elevated proportions of red light in the artificial-light spectrum increase plant growth under low-temperature conditions. This supports the adjustment of artificial-light spectra by including temperature while constantly monitoring flavonol and anthocyanin contents with remote sensing devices. The results of the experiments in general show the applicability of non-destructive remote sensing devices for sports turf secondary metabolite estimation for potential integration in artificial-light management. This experiment proves the concept of quality assessment through the remote sensing of flavonoids to potentially optimize artificial-light quality according to temperature. The supposed 8 °C turning point and the results of the experiments need to be validated in open-field experiments with natural-light effects and changing temperatures for further confirmation of the concept.

Author Contributions

Conceptualization, A.S. and H.B.; methodology, A.S.; software, A.S.; validation, A.S. and H.B.; formal analysis, A.S. and H.B.; investigation, A.S.; resources, A.S.; data curation, A.S.; writing—original draft preparation, A.S.; writing—review and editing, H.B.; visualization, A.S.; supervision, H.B.; project administration, H.B.; funding acquisition, H.B. All authors have read and agreed to the published version of the manuscript.

Funding

This research was financed by the company Rhenac GreenTec AG.

Data Availability Statement

The data presented in this paper can be accessed upon request to the corresponding author.

Acknowledgments

The authors are very thankful to the practical support of the employees of the Chair of Agricultural Systems Engineering and of the Plant Technology Center of Technical University Munich and the technical support of the company Rhenac GreenTec AG.

Conflicts of Interest

The authors declare no conflicts of interests.

References

  1. Babla, M.; Cai, S.; Chen, G.; Tissue, D.T.; Cazzonelli, C.I.; Chen, Z.-H. Molecular Evolution and Interaction of Membrane Transport and Photoreception in plants. Front. Genet. 2019, 10, 956. [Google Scholar] [CrossRef]
  2. Saleem, M.; Atta, B.M.; Ali, Z.; Bilal, M. Laser-induced fluorescence spectroscopy for early disease detection in grapefruit plants. Photochem. Photobiol. Sci. Off. J. Eur. Photochem. Assoc. Eur. Soc. Photobiol. 2020, 19, 713–721. [Google Scholar] [CrossRef]
  3. Idris, A.; Linatoc, A.C.; Abu Bakar, M.F.; Takai, Z.I.; Audu, Y. Effect of Light Quality and Quantity on the Accumulation of Flavonoid in Plant Species. J. Sci. Technol. 2018, 10, 32–45. [Google Scholar] [CrossRef]
  4. Tan, Z.G.; Qian, Y.L. Light Intensity Affects Gibberellic Acid Content in Kentucky Bluegrass. HortScience 2003, 38, 113–116. [Google Scholar] [CrossRef]
  5. Tegg, R.S.; Lane, P.A. A comparison of the performance and growth of a range of turfgrass species under shade. Aust. J. Exp. Agric. 2004, 44, 353. [Google Scholar] [CrossRef]
  6. Cereti, C.F.; Ruggeri, R.; Rossini, F. Cool-Season Turfgrass Species and Cultivars: Response to Simulated Traffic in Central Italy. Ital. J. Agron. 2010, 5, 53. [Google Scholar] [CrossRef]
  7. Reyes, T.H.; Pompeiano, A.; Ranieri, A.; Volterrani, M.; Guglielminetti, L.; Scartazza, A. Photosynthetic performance of five cool-season turfgrasses under UV-B exposure. Plant Physiol. Biochem. 2020, 151, 181–187. [Google Scholar] [CrossRef]
  8. Moser, L.E.; Hoveland, C. Cool-Season Grass Overview. In Cool-Season Forage Grasses; Moser, L.E., Buxton, D.R., Casler, M.D., Eds.; American Society of Agronomy, Crop Science Society of America, Soil Science Society of America (Agronomy Monographs): Madison, WI, USA, 1996; pp. 1–14. [Google Scholar]
  9. Laboisse, S.; Combes, D.; Escobar-Gutierrez, A.; Hurlus, J.M. Spatial distribution of simulated turfgrass photosynthesis in football stadium pitch. In Proceedings of the 2018 6th International Symposium on Plant Growth Modeling, Simulation, Visualization and Applications (PMA), Hefei, China, 4–8 November 2018; pp. 111–114. [Google Scholar]
  10. Mann, R.L. Growing sports turf in shady environment. Acta Hortic. 2016, 83–90. [Google Scholar] [CrossRef]
  11. Gardner, D.S.; Goss, R.M. Management of Turfgrass in Shade. In Turfgrass: Biology, Use, and Management; Stier, J.C., Horgan, B.P., Bonos, S.A., Eds.; American Society of Agronomy, Crop Science Society of America, Soil Science Society of America: Madison, WI, USA, 2013; pp. 219–247. [Google Scholar]
  12. Abélard, E.; Galbrun, C. The effects of artificial lighting on sports turf. Int. Turfgrass Soc. Res. J. 2022, 14, 1016–1021. [Google Scholar] [CrossRef]
  13. Bourget, C.M. An Introduction to Light-emitting Diode. HortScience 2008, 43, 1944–1946. [Google Scholar] [CrossRef]
  14. Cocetta, G.; Casciani, D.; Bulgari, R.; Musante, F.; Kołton, A.; Rossi, M.; Ferrante, A. Light use efficiency for vegetables production in protected and indoor environment. Eur. Phys. J. Plus 2017, 132, 43. [Google Scholar] [CrossRef]
  15. Bantis, F.; Smirnakou, S.; Ouzounis, T.; Koukounaras, A.; Ntagkas, N.; Radoglou, K. Current status and recent achievements in the field of horticulture with the use of light-emitting diodes (LEDs). Sci. Hortic. 2018, 235, 437–451. [Google Scholar] [CrossRef]
  16. Yang, X.; Montano, S.; Ren, Z. How Does Photoreceptor UVR8 Perceive a UV-B Signal? Photochem. Photobiol. 2015, 91, 993–1003. [Google Scholar] [CrossRef]
  17. Tilbrook, K.; Arongaus, A.B.; Binkert, M.; Heijde, M.; Yin, R.; Ulm, R. The UVR8 UV-B Photoreceptor: Perception, Signaling and Response. Arab. Book 2013, 11, e0164. [Google Scholar] [CrossRef]
  18. Su, J.; Liu, B.; Liao, J.; Yang, Z.; Lin, C.; Oka, Y. Coordination of Cryptochrome and Phytochrome Signals in the Regulation of Plant Light Response. Agronomy 2017, 7, 25. [Google Scholar] [CrossRef]
  19. Julkunen-Tiitto, R.; Nenadis, N.; Neugart, S.; Robson, M.; Agati, G.; Vepsäläinen, J.; Zipoli, G.; Nybakken, L.; Winkler, B.; Jansen, M.A.K. Assessing the response of plant flavonoids to UV radiation: An overview of appropriate technique. Phytochem. Rev. 2015, 14, 273–297. [Google Scholar] [CrossRef]
  20. Winkel-Shirley, B. Biosynthesis of flavonoids and effects of stress. Curr. Opin. Plant Biol. 2002, 5, 218–223. [Google Scholar] [CrossRef]
  21. Brunetti, C.; Di Ferdinando, M.; Fini, A.; Pollastri, S.; Tattini, M. Flavonoids as antioxidants and developmental regulators: Relative significance in plants and human. Int. J. Mol. Sci. 2013, 14, 3540–3555. [Google Scholar] [CrossRef]
  22. Paradiso, R.; Proietti, S. Light-Quality Manipulation to Control Plant Growth and Photomorphogenesis in Greenhouse Horticulture: The State of the Art and the Opportunities of Modern LED System. J. Plant Growth Regul. 2022, 41, 742–780. [Google Scholar] [CrossRef]
  23. Agati, G.; Cerovic, Z.G.; Pinelli, P.; Tattini, M. Light-induced accumulation of ortho-dihydroxylated flavonoids as non-destructively monitored by chlorophyll fluorescence excitation technique. Environ. Exp. Bot. 2011, 73, 3–9. [Google Scholar] [CrossRef]
  24. Carlson, M.G.; Gaussoin, R.E.; Puntel, L.A. A review of precision management for golf course turfgrass. Crop Forage Turfgrass Manag. 2022, 8, e20183. [Google Scholar] [CrossRef]
  25. Fitz-Rodríguez, E.; Choi, C.Y. Monitoring turfgrass quality using multispectral radiometry. Trans. ASAE 2002, 45, 865. [Google Scholar] [CrossRef]
  26. Dong, L.; Xiong, L.; Sun, X.; Shah, S.; Guo, Z.; Zhao, X.; Liu, L.; Cheng, L.; Tian, Z.; Xie, F.; et al. Morphophysiological Responses of Two Cool-Season Turfgrasses with Different Shade Tolerance. Agronomy 2022, 12, 959. [Google Scholar] [CrossRef]
  27. Wang, T.; Chandra, A.; Jung, J.; Chang, A. UAV remote sensing based estimation of green cover during turfgrass establishment. Comput. Electron. Agric. 2022, 194, 106721. [Google Scholar] [CrossRef]
  28. Legris, M.; Nieto, C.; Sellaro, R.; Prat, S.; Casal, J.J. Perception and signalling of light and temperature cues in plant. Plant J. Cell Mol. Biol. 2017, 90, 683–697. [Google Scholar] [CrossRef]
  29. Balcerowicz, M. Phytochrome-interacting factors at the interface of light and temperature signalling. Physiol. Plant. 2020, 169, 347–356. [Google Scholar] [CrossRef]
  30. Sarkar, D.; Bhowmik, P.C.; Kwon, Y.I.; Shetty, K. Cold Acclimation Responses of Three Cool-season Turfgrasses and the Role of Proline-associated Pentose Phosphate Pathway. J. Amer. Soc. Hort. Sci. 2009, 134, 210–220. [Google Scholar] [CrossRef]
  31. Ben Ghozlen, N.; Cerovic, Z.G.; Germain, C.; Toutain, S.; Latouche, G. Non-destructive optical monitoring of grape maturation by proximal sensing. Sensors 2010, 10, 10040–10068. [Google Scholar] [CrossRef]
  32. Chen, D.-Q.; Li, Z.-Y.; Pan, R.-C.; Wang, X.-J. Anthocyanin Accumulation Mediated by Blue Light and Cytokinin in Arabidopsis Seedlings. J. Integr. Plant Biol. 2006, 48, 420–425. [Google Scholar] [CrossRef]
  33. Agati, G.; Azzarello, E.; Pollastri, S.; Tattini, M. Flavonoids as antioxidants in plants: Location and functional significance. Plant Sci. Int. J. Exp. Plant Biol. 2012, 196, 67–76. [Google Scholar] [CrossRef]
  34. Qaderi, M.M.; Martel, A.B.; Strugnell, C.A. Environmental Factors Regulate Plant Secondary Metabolites. Plants 2023, 12, 447. [Google Scholar] [CrossRef] [PubMed]
  35. Jaakola, L.; Hohtola, A. Effect of latitude on flavonoid biosynthesis in plants. Plant Cell Environ. 2010, 33, 1239–1247. [Google Scholar] [CrossRef] [PubMed]
  36. Peer, W.A.; Bandyopadhyay, A.; Blakeslee, J.J.; Makam, S.N.; Chen, R.J.; Masson, P.H.; Murphy, A.S. Variation in expression and protein localization of the PIN family of auxin efflux facilitator proteins in flavonoid mutants with altered auxin transport in Arabidopsis thaliana. Plant Cell 2004, 16, 1898–1911. [Google Scholar] [CrossRef] [PubMed]
  37. Demotes-Mainard, S.; Péron, T.; Corot, A.; Bertheloot, J.; Le Gourrierec, J.; Pelleschi-Travier, S.; Crespel, L.; Morel, P.; Huché-Thélier, L.; Boumaza, R.; et al. Plant responses to red and far-red lights, applications in horticulture. Environ. Exp. Bot. 2016, 121, 4–21. [Google Scholar] [CrossRef]
  38. Xu, F.; He, S.; Zhang, J.; Mao, Z.; Wang, W.; Li, T.; Hua, J.; Du, S.; Xu, P.; Li, L.; et al. Photoactivated CRY1 and phyB Interact Directly with AUX/IAA Proteins to Inhibit Auxin Signaling in Arabidopsis. Mol. Plant 2018, 11, 523–541. [Google Scholar] [CrossRef]
Figure 1. Artificial-light spectra of the two LED racks of the experiments with blue (445 nm)-to-red (660 nm) ratios (B/R ratios) of 0.4 and 0.6.
Agriengineering 06 00127 g001
Figure 2. Flavonol contents in Multiplex-Units for the two light spectra (B/R ratio of 0.6 and B/R ratio of 0.4) and the three experimental procedures (4 °C (A), 12 °C (B), and 12–8–4–8–12 °C (C)) over the weeks with their standard deviation and their groups within the experimental procedures. Different letters indicate significant differences among the weekly measurements (p < 0.05).
Agriengineering 06 00127 g002
Figure 3. Anthocyanin contents in Multiplex-Units for the two light spectra (B/R ratio of 0.6 and B/R ratio of 0.4) and the three experimental procedures (4 °C (A), 12 °C (B), 12–8–4–8–12 °C (C)) over the weeks with their standard deviation and their groups within the experimental procedures. Different letters indicate significant differences among the weakly measurements (p < 0.05).
Agriengineering 06 00127 g003
Figure 4. Means of flavonol (A) and anthocyanin (B) contents for the two light spectra (B/R ratio of 0.6 and B/R ratio of 0.4) and the three experimental procedures of all five weeks summarized with their standard deviation and their groups within the parameters. Different letters indicate significant differences among the results (p < 0.05).
Agriengineering 06 00127 g004
Figure 5. Means of length increase for the two light spectra (B/R ratio of 0.6 and B/R ratio of 0.4) over the weeks with their standard deviation. Different letters indicate significant differences in mean length increase per week (p < 0.05).
Agriengineering 06 00127 g005
Table 1. Statistical results of flavonol and anthocyanin contents for each of the three experimental procedures (4 °C, 12 °C, and 12–8–4–8–12 °C) by week, spectrum, and their interaction. Significance is indicated with *** at p < 0.001.
4 °C12 °C12–8–4–8–12 °C
FlavonolAnthocyaninFlavonolAnthocyaninFlavonolAnthocyanin
Week1.90 × 10−12 ***0.00 ***1.55 × 10⁻¹⁰ ***0.408.81 × 10−10 ***9.93 × 10⁻⁹ ***
Spectrum0.00 ***0.090.500.110.310.75
Interaction Week/Spectrum0.140.980.780.940.210.50
Disclaimer/Publisher’s Note: The statements, opinions and data contained in all publications are solely those of the individual author(s) and contributor(s) and not of MDPI and/or the editor(s). MDPI and/or the editor(s) disclaim responsibility for any injury to people or property resulting from any ideas, methods, instructions or products referred to in the content.

