Abstract
Coffee post-processing drying eliminates moisture content, reduces fungal and microbe growth, and develops unique aroma and flavor compounds. Thai coffee producers use controlled-environment drying (CED) techniques to improve the quality and cupping scores of the coffee. This research investigated how different drying methods, including sun drying (SD), controlled-environment drying at 20–30 °C, 50–55% RH, and fast drying (FD) at 30–45 °C influenced the physicochemical characteristics of coffee undergoing dry (DP), washed (WP), and honey (HP) processing. Results showed that true density, moisture content, water activity, color, caffeine, trigonelline, chlorogenic acid, caffeic acid, sucrose, and fructose in green coffee beans were significantly affected (p < 0.05) by both drying technique and post-harvest processing. Drying techniques and processing directly impacted the characteristics of green (GCB) and roasted coffee beans (RCB). Findings suggested a correlation between CED, SD, and FD based on the physicochemical and biochemical properties and sugar contents of both green and roasted coffee beans.
1. Introduction
Thailand first introduced coffee farming in 1849. The most common coffee varieties are Arabica, which is mainly found in Northern Thailand, and Robusta, which is primarily grown in the southern region [1,2,3]. Arabica varieties, including Catimor, Caturra, Typica, Bourbon, Catuai, and Mundo Novo, are mainly cultivated in Chiang Rai, Chiang Mai, Nan, Lampang, and Tak Provinces [1,2,3]. Many coffee plantations now commonly grow mixed Caffea arabica seeds as it costs more to separate beans during post-harvesting. Climate change also negatively impacts rising temperatures and water scarcity [4]. Thus, several Thai coffee farmers focus on the drying stage to reduce the moisture from 55–60% to 9–12% as a safe range for storage before roasting while also enhancing the organoleptic qualities of green coffee beans.
The drying stage is a critical post-harvest procedure that contributes significantly to the development of the distinctive color, flavor, and taste of a coffee beverage [5]. Sun drying is a common technique utilized by coffee producers in Thailand. The taste of the coffee is significantly affected by the sun-drying process, which depends on climatic conditions [5]. Several researchers investigated mechanical drying techniques in industrial settings to reduce drying time [6,7]. Shofinita et al. [6] reported that a high temperature during the drying process could lead to reduced storage time and structural damage; therefore, methods of coffee drying and the operating conditions should be carefully considered. Both sun and machine drying are essential to achieving homogeneity, ensuring the desired color, and controlling pests to enhance the longevity of storage [7]. However, many parameters influence coffee quality. The drying phase is an essential element in enhancing the quality of coffee flavor and minimizing damage from an undesirable taste and off-flavor.
Drying and post-processing treatments both impact the physicochemical properties of green coffee beans, such as density [8,9], moisture content [10,11], and water activity [12]. These factors contribute to multiple benefits, including weight and volume reduction, storage and transportation costs, handling systems, grading, hulling, aroma, flavor, and texture, as well as sensory attributes [6,7]. Biochemical compounds in coffee, including caffeine, trigonelline, chlorogenic acid, and caffeic acid, impact its flavor by imparting astringency, bitterness, and aromatic formations that contribute to acidity [13,14,15]. Coffee composition undergoes a slight change or remains stable throughout post-harvest processing because enzymatic and chemical processes are influenced by the drying conditions and duration [6,7,15]. The biochemical structure of Arabica is strongly affected by variety, growing environment, altitude, and processing [16,17].
Sugar content is an essential element present in the coffee cherry, mucilage pulp, and green coffee beans. The sugar level increases or decreases in response to the consumption and degradation of microorganisms in the cellular structure of the green coffee bean surface during dehydration and post-processing [18,19]. The sugar content in coffee consists of sucrose, glucose, and fructose. These sugars play a crucial role in the development of fragrance and flavor during the roasting process through Maillard, Strecker, and degradation reactions [20,21]. High sugar content in green coffee beans (GCB) results in a more pronounced ultimate sweetness, as well as stronger precursors [21,22]. Therefore, the drying and post-harvest processing techniques perform critical roles in the coffee manufacturing process, with a direct impact on the volatile and physicochemical compounds, collectively establishing the product’s quality and desired characteristics and ensuring a high-quality cup of coffee. Jitjaroen et al. [23] investigated the low temperature and low relative humidity (LTLH) conditions for coffee drying by controlling the temperature and relative humidity inside the drying chamber at conditions lower than the ambient. Results showed that sugar concentrations gradually increased during drying. However, knowledge of how controlled environmental drying impacts coffee quality remains limited. Therefore, this study investigated the impact of different drying treatments, such as sun drying (SD), controlled-environment drying (CED), and fast drying (FD), along with different post-harvest processing as dry (DP), washed (WP), and honey processes (HP) on the physicochemical and biochemical properties of Thai Arabica coffee.
2. Materials and Methods
2.1. Sample Preparation
Coffee (Caffea arabica L.) cherries were collected as mixed varieties of Catimor, Caturra, Catuai, and Bourbon from Doi Chang, Thailand, during the 2022–2023 harvesting season, at an altitude of 1250–1300 m. After harvesting the ripe cherry, the samples were floated to remove soil, dirt, leaves, and twigs and washed to obtain clean cherries. Next, the cherries were divided into dry process (DP), washed process (WP), and honey process (HP). DP involved drying the whole cherries, while the WP and HP processes involved de-pulping to remove the outer skin. HP was directly drying with parchment and mucilage. For WP, after pulping, coffee parchment was submerged under water overnight or until the water pH reached 4.3–4.5, and then, mucilage was cleaned by washing and dried.
Two kilograms of samples, e.g., cherry (DP), parchment with mucilage (HP), and wet clean parchment (WP), were put in the basket prior to drying. The initial moisture content (% w.b.) of coffee beans was 73.45 ± 2.40%, 53.69 ± 3.36%, and 51.80 ± 5.23% for DP, HP, and WP, respectively. Different drying techniques, e.g., sun drying (SD), controlled-environment drying (CED), and fast drying (FD), were applied. Samples were dried until the moisture content reached 9–12% (w.b.). The details of drying conditions are shown in Table 1. For CED and FD, the coffee baskets were placed on the shelf in the drying chamber. A diagram of the drying chamber is shown in Figure 1. The drying chamber was the metalized tent with the size of 300 cm × 150 cm × 200 cm equipped with a dehumidifier (LG, MD19GQGA1, Bangkok, Thailand) and heater (Hisense, AP1022HW1G, Suwanee, GA, USA) to control temperature and humidity inside the chamber. Temperature and RH inside the drying chamber were recorded using the data logger (Tinytag Talk 2: TK-4023-PK, Gemini Data Loggers, Chichester, West Sussex, UK). The CED system was controlled by a temperature not exceeding 30 °C, with 55% RH during the first three days of drying and then with 50% RH until the end of drying. In the case of FD, the temperature was set in the range of 30–40 °C with 55% RH during the first three days of drying and then set to 50% RH until the end of drying.

Table 1.
The three drying methods.
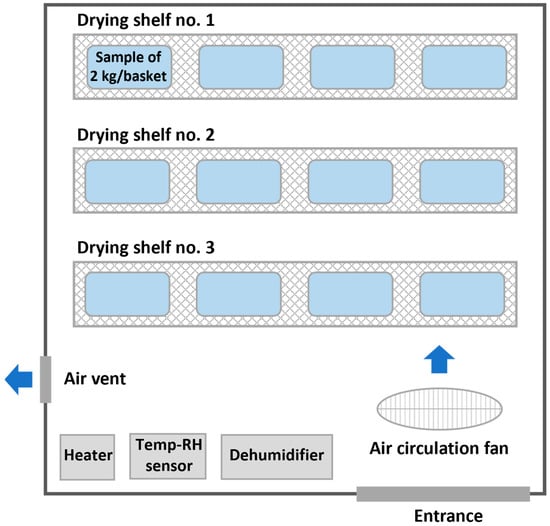
Figure 1.
Schematic diagram of drying chamber for CED and FD.
After drying, the dried coffee cherries and parchment were packed in hermetic bags and stored (25 °C with 50% RH) for three months before roasting. A 500 g aliquot of each processed GCB hermetic bag underwent roasting using the Specialty Coffee Association (SCA) roasting procedure for the cupping protocol [24]. The roasting was conducted using an HB coffee roaster (HB-L2, The Coffee Company, Ltd., Hong Kong, China) under the control of Artisan (2.4.4, freeware) software. The roasting profile was conducted at 208 °C for 8–10 min. Figure 2 shows the appearance of the coffee after the post-harvest processing step.
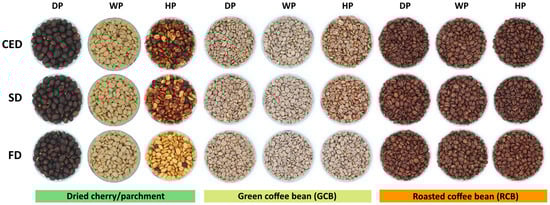
Figure 2.
Samples along coffee post-harvest processing from dried cherry, parchment to green coffee bean (GCB), and roasted coffee bean (RCB); CED, controlled-environment drying; SD, sun drying; FD, fast drying; DP, natural process; WP, washing process; HP, honey process.
2.2. True Density Determination
The true density was measured using the water displacement method following Chandrasekar and Viswanathan [25]. Twenty-five samples were weighed and placed in a 500 mL measuring cylinder filled with water up to 50 mL. The occupied volume was recorded, and the density was calculated using Equation (1):
Density = weight of coffee (g)/(v2 − v1) volume of coffee (mL)
2.3. Color Determination
The color values of GCB were measured using a colorimeter (Color Quest XE, Hunter Associates, Reston, VA, USA) and expressed according to the CIE Lab color scale [26]. The colorimeter was calibrated using a standard white tile to obtain the coordinates for the illuminant D65: L* = 94.64, a* = −0.80, and b* = 0.07. L* measures lightness (L* = 100 means white; L* = 0 means black); a* indicates the contribution of red or green (redness (+) and greenness (−)), and b* determines the role of blue or yellow (yellowness (+) and blueness (−)).
2.4. Moisture Content (MC)
The moisture content was determined by drying 3 g of the sample in a vacuum oven at 70 ± 1 °C under 5 kPa for 16.0 ± 0.5 h until a constant weight was achieved and calculated using the AOAC 2000 method 979.12 [27] by Equation (2). Moisture content in dry basis (MCdb) and moisture ratio (MR) were expressed in Equations (3) and (4), respectively.
where MR is the dimensionless moisture content ratio; Mt is the moisture content at any time (% d.b.); M0 is the initial moisture content (% d.b.), and Me is the equilibrium moisture content (% d.b.)
MCwb = mass of water (g)/mass of samples (g) × 100
MCdb = mass of water (g)/mass of dry matter (g) × 100
MR = (Mt − Me)/(M0 − Me)
2.5. Water Activity (aw)
The water activity (aw) of ground green coffee bean samples was measured at 25 °C using a water activity meter (Aqua Lab, Decagon, WA, USA) that included auto analysis [28].
2.6. Caffeine, Trigonelline, Chlorogenic Acid, and Caffeic Acid
The samples were extracted in triplicate. Briefly, 1 g of ground coffee was suspended in 15 mL of methanol, shaken for one hour without heating, and then filtered through filter paper (Whatman No. 1). The samples were extracted using methanol three times, and the final volume was adjusted to 50 mL. Next, the samples were filtered through a 0.22 µm cellulose ester membrane (Millipore, Brazil). The final extract was diluted with water (1:1) before high-performance liquid chromatography (RP-HPLC) analysis.
Caffeine, trigonelline, chlorogenic acid (CGA), and caffeic acid were determined by reversed-phase high-performance liquid chromatography (RP-HPLC), according to Cordoba et al. [29]. Quantitative analyses were carried out using an HPLC (Shimadzu, LabSolutions, Tokyo, Japan) with a diode array detector (UV/VIS). The separation was achieved in a Gemini column C-18 that measured 250 mm × 4.6 mm and 5 µm at 25 °C. The mobile phase was modified and used with orthophosphoric acid 0.1% (A) and methanol (B) HPLC grade. The gradient was adjusted as follows: 0 to 8 min: A/B 96/4; 20 min: A/B 72/28; 25–28 min, A/B 58/42 at a flow rate of 1.5 mL/min. CGA and caffeic acid were detected at 325 nm, caffeine at 275 nm, and trigonelline at 220 nm. The injection volume was 10 µL. The concentrations of bioactive compounds were calculated using a regression equation of their concentrations and the peak area obtained from the HPLC standard [29].
2.7. Measurement of Sugar Content (Sucrose, Glucose, Fructose)
The sugar standards used in this study were sucrose, D (+)-glucose, and D (−)-fructose, with 98.9%, 99.5%, and 99.9% purity, respectively. The ultrapure water used in the solutions, sugar extraction, and chromatographic system was purified by a Milli-Q system. Sugar extraction was performed by placing 5 g of ground coffee samples in the tube. The samples were added with 15 mL of Milli-Q water, boiled in a water bath at 80 °C for 30 min, and filtered with No.4. The samples were extracted with Milli-Q three times, and the final volume was adjusted to 50 mL. After that, the samples were filtrated by a cellulose ester membrane with a pore size of 0.22 µm before storing at 5 °C for further quantification of sugars [30].
The sugars were separated by HPLC following Constantino et al. [30] using a cation exchange column composed of 8% cross-linked divinylbenzene and Pb2+ ions (Aminex HPX-87P, 300 mm × 7.8 mm, 9 µm, Bio-Rad, Hercules, CA, USA) and placed in an oven at 80 °C. Ultrapure water was used at the mobile phase at a flow rate of 0.8 mL/min. A manual injector, Rheodyne 7125, containing a 20 µL sampling loop, was used to introduce the samples into the system. A RID-10A refractive index detector was used for sugar detection, and the integration of peaks and area values was obtained using CLASS-VP™ software (v5.0, Shimadzu, LabSolutions, Tokyo, Japan). Sugar identification was carried out according to retention times and the addition of sucrose, glucose, and fructose standards to the samples. Individual quantification of sugars was performed by external standardization using analytical curves comprising six concentrations of a mixture of glucose, sucrose, and fructose.
2.8. Statistical Analysis
Results from various treatments for true density, color moisture content, water activity, caffeine, trigonelline, chlorogenic acid, caffeic acid, sucrose, and fructose were recorded as mean values with standard deviations (n = 3). Analysis of variance (ANOVA) was carried out using SPSS statistical software (version 20, SPSS Inc., Chicago, IL, USA). Tukey’s test (p ≤ 0.05) was used to compare mean data to identify significant variations between the treatments. Principal component analysis (PCA) was performed using R Statistical Software (v4.1.2, R Core Team, Indianapolis, IN, USA, 2021), and the results of physicochemical properties, biochemical properties, and sugar content data were normalized to exclude dimensional consequences before analysis.
3. Results and Discussion
3.1. Effect of Drying Techniques on Weight Loss
Figure 3 shows the drying characteristics of coffee undergoing different drying conditions. The drying times of each drying technique were significantly different (p < 0.05). CED had a longer drying time compared with the others due to a lower drying temperature, as shown in Table 1. The final MC values (% w.b.) of the coffee ranged from 9.0 to 12.0%. The MC values of CED were 11.00 ± 0.06%, 11.20 ± 0.10%, and 9.69 ± 0.09% for DP, WP, and HP, respectively, with SD 10.96 ± 0.30%, 9.44 ± 0.07%, and 9.52 ± 1.26% for DP, WP, and HP, respectively, and FD 10.99 ± 0.14, 9.4 ± 1.00, and 9.95 ± 0.54% for DP, WP, and HP, respectively. Different coffee processing methods influenced the drying time. In CED, a higher initial MC (73.45 ± 2.40% w.b.) of DP required a longer drying time of 28 days to reach 11.00% w.b. compared to the lower initial MC of WP and HP (51.80 ± 5.23% and 53.69 ± 3.36%, respectively). The phenomenon of initial MC on drying time was also found in SD and FD, as shown in Table 1.
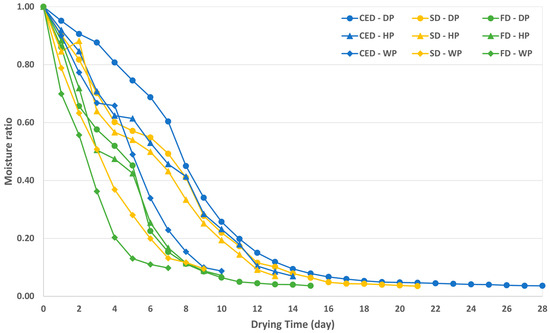
Figure 3.
Drying characteristics of coffee undergoing different drying techniques. CED, controlled-environment drying; SD, sun drying; FD, fast drying; DP, drying process; WP, washing process; HP, honey process.
FD at high temperatures resulted in higher weight loss compared to the other drying techniques, with a shorter drying period. CED required a longer time to reduce MC. In DP samples (Figure 3), the higher drying temperature of FD led to a lower equilibrium moisture content (EMC) compared to other drying techniques. Higher drying temperatures increase the air’s ability to retain moisture, resulting in a lower EMC. Increasing the drying temperature or reducing the RH shortened the drying time and lessened the damage caused by unnecessary overfermentation. Fermentation inside the cherry created unique flavor characteristics, whicsted by lowering the temperature or increasing the RH. SD required no extra investment costs, as it was dried under natural conditions. However, this method relied on weather conditions. Strong levels of sunlight caused the surface cell structure to break down. In this study, CED was the slowest process for reducing MC, its possible slow drying preventing the loss or degradation of some flavor-precursor compounds, as well as the formation of undesirable components in high-temperature drying such as FD. However, CED requires careful supervision to avoid overfermentation during processing.
3.2. Physicochemical Properties of Green and Roasted Coffee Beans
Table 2 shows the true density (TD), color, moisture content (MC), and water activity (aw) of green (GCB) and roasted coffee beans (RCB) under different processing and drying conditions. Drying techniques significantly impacted (p < 0.05) coffee TD, color, MC, and aw of GCB and RCB. However, the lightness (L*) and yellowness (b*) did not impact RCB (p > 0.05) due to the controlled roasted color level according to the SCA cupping protocol at 63 Agtron.
Table 2.
The physicochemical properties of green and roasted coffee beans.
3.2.1. True Density (TD)
TD values of GCB and RCB ranged from 1.16 ± 0.01 to 1.23 ± 0.01 g/mL and from 0.69 ± 0.02 to 0.75 ± 0.01 g/mL, respectively. TD values of GCB were similar to previous investigations [31]. After roasting, TD reduced due to the loss of moisture content caused by heating [8]. CED, GCB, and RCB (1.18 ± 0.02 to 1.23 ± 0.01 g/mL and 0.71 ± 0.02 to 0.75 ± 0.01 g/mL) provided higher TD content than SD (1.16 ± 0.01 to 1.20 ± 0.01 g/mL and 0.70 ± 0.01 to 0.73 ± 0.01 g/mL) and FD (1.16 ± 0.01 to 1.19 ± 0.03 g/mL and 0.69 ± 0.02 to 0.70 ± 0.01 g/mL), respectively. Bustos-Vanegas et al. [8] concluded that a higher density of coffee beans indicated better quality, with a denser and harder cell structure in the seeds. GCB had greater length, width, and thickness, with a relatively higher average angle [31]. Thus, CED might be the best drying technique to improve coffee quality in terms of physical attributes.
3.2.2. Color
The maximum L* of GCB ranged from 51.55 ± 0.35 to 54.07 ± 0.42, 52.13 ± 0.04 to 52.49 ± 0.11, and 50.57 ± 0.15 to 52.70 ± 0.15, for FD, SD, and CED, respectively. The FD had a whitish coffee shading, reflected in the digital image shown in Figure 2. The GCB of FD was brighter since less fermentation occurred during drying. Tsai and Jioe [9] claimed that the color of GCB related to the mucilage of the fermentation method performed during coffee processing as bluish, greenish, whitish, yellowish, and brownish. The WP yielded lower a* (0.71 ± 0.17, 1.10 ± 0.07, and 0.93 ± 0.16 for CED, SD, and FD, respectively) than DP (1.85 ± 0.18, 1.92 ± 0.01, and 2.57 ± 0.34) and HP (2.48 ± 0.47, 2.52 ± 0.25, and 1.82 ± 0.54), respectively. WP exhibited the most greenish color, while DP and HP presented a hint of redness (Figure 2). In terms of a*, different processing methods influenced the character of GCB more than the other drying methods. After roasting, the DP and HP of the FD technique were more brownish than the other processing methods due to increased natural fermentation time [9]. The green coffee bean cell structure broke down by FD at a high temperature, while roasting the GCB might easily brunt [8]. In terms of b*, HP from CED showed the highest yellowness, ranging from 9.66 ± 0.52 to 10.02 ± 1.30 compared to DP (8.53 ± 0.31 to 10.00 ± 0.51) and WP (7.32 ± 0.31 to 8.25 ± 0.29). The b* value might be improved by long-term CED from the browning reaction of the mucilage components. Several yeasts and bacteria grow very rapidly in the coffee mucilage during the drying process. The fructose and glucose in the mucilage produce mannitol, glycerol, and lactic acid [32]. Figueroa et al. [33] stated that fermentation broke down the mucilage, which was made up of hemicelluloses, pectin substances, and sugars broken down by enzymes and bacteria in nature. Thus, long-term drying with CED presented more fermentations and increased the yellowness compared to FD and SD.
3.2.3. Moisture Content (MC)
The MC of GCB ranged from 8.48 ± 0.22 to 11.23 ± 0.56%, as shown in Table 2. The safety range of the moisture level of GCB is 8.0–12.5% (w.b.) [11]. GCB at less than 8% MC could lead to an unpleased appearance, while MC over 12.5% was more vulnerable to microbial development, mycotoxin formation, fungal growth, and sensory changes that reduced coffee quality [10,11]. The MC of RCB ranged from 1.74 ± 0.01 to 2.40 ± 0.07%, corresponding to the reported light-medium roasting level of 1.64 ± 0.22 to 2.57 ± 0.00 [34]. GCB beans are usually roasted using the SCAA roasting profile. This causes a loss of MC and impacts the physicochemical properties and the formation of several flavor and volatile compounds.
3.2.4. Water Activity (aw)
The aw of GCB ranged from 0.52 ± 0.02 to 0.62 ± 0.00, indicating a specialty grade of GCB (aw < 0.7), according to the Specialty Coffee Association of America (SCAA). The aw content ranged from 0.52 ± 0.02 to 0.62 ± 0.00 in CED, 0.53 ± 0.01 to 0.58 ± 0.00 in SD, and 0.53 ± 0.01 to 0.57 ± 0.01 in FD. The aw value observed in the connected adsorption isotherm could be explained by water–matrix interactions based on the particular chemical, structural, and cellular characteristics of GCB [12]. After roasting, the aw reduced from 0.38 ± 0.02 to 0.44 ± 0.02. Baggenstoss et al. [35] stated that high aw content in RCB gave less brittleness. Thus, the RCB process causes a fixed, brittle, and fragile structure that progressively results in the loss of distinctive bean crunchiness and crispiness [12]. The lowest aw of WP could break easily and release energy quickly, resulting in a very brittle and delicate texture of RCB. Thus, during coffee berry drying, physical qualities cause a considerable decrease in the superficial area, volume, and diameter and influence the final cup quality. The drying process influences the aroma level, volatile compounds, sugar, amino acid, aw, MC, CGA, sulfur-containing substances, sensory quality, and other miscellaneous compounds of sun and mechanically-dried coffee beans [7]. Different drying methods altered the physicochemical parameters of GCB and RCB, which are related to the final cupping quality.
3.3. Biochemical Properties of Green and Roasted Coffee Beans
Biochemical compounds discovered in coffee, including caffeine, trigonelline, chlorogenic acid (CGA), and caffeic acid (CA), have been identified as contributors to the acidity, bitterness, astringency, and volatile compound formation [13,29]. Caffeine, trigonelline, CGA, and CA of GCB and RCB were significantly affected (p < 0.05) by post-harvest processes and drying techniques, except for CA in RCB, as shown in Table 3.
Table 3.
The biochemical properties of green and roasted coffee beans.
3.3.1. Caffeine
The caffeine level of GCB was highest in CED, at 1.01 ± 0.02, 0.91 ± 0.03, and 0.92 ± 0.02 mg/mL for DP, WP, and HP, respectively, followed by SD at 0.95 ± 0.02, 0.88 ± 0.03, and 0.87 ± 0.04 mg/mL, and FD at 0.90 ± 0.01, 0.82 ± 0.01, and 0.86 ± 0.02 mg/mL, respectively. Mengistu et al. [17] demonstrated that GCB caffeine content interacted with mildness and cupping quality. Caffeine is the primary component in coffee and ensures the ultimate quality of the beverage [17]. Extending the drying time exhibited higher caffeine concentration in CED than in SD and FD. The lower caffeine content observed in GCB in FD and SD was possibly attributed to the parchment receiving an excessive temperature beyond 40 °C during the drying process, as opposed to the uniform drying achieved by mechanical dryers [7]. Thus, the application of high temperatures throughout the drying procedure could result in the loss of storage time and structural impairment [36]. Comparing coffee processing methods, GCB caffeine content was lower in WP than in DP and HP. WP was fermented under water to dissolve the mucilage layer by enzymes. Sinaga et al. [37] claimed that GCB fermentation reduced caffeine as the enzymes generated by microorganisms degraded caffeine compounds into simpler molecules. Mintesnot and Dechass [38] also reported that WP lost 3% of its caffeine during the soaking step compared to DP. After roasting, DP had 0.76 ± 0.48, 0.68 ± 0.01, and 0.65 ± 0.00 mg/mL of caffeine content for CED, SD, and FD, respectively, and exhibited higher content than WP (0.71 ± 0.01, 0.72 ± 0.02, 0.68 ± 0.01 mg/mL) and HP (0.64 ± 0.01, 0.68 ± 0.00, 0.60 ± 0.02 mg/mL), respectively. The RCB caffeine level was similar to that reported for a coffee brew, ranging from 0.63 to 1.05 mg/L, with caffeine content decreasing as roasting, grinding, and brewing times increased [15]. An estimated 30% of the initial caffeine content could be diminished throughout the roasting step [6]. In the case of DP, an alkaloid and nitrogenous secondary metabolite might impart a stronger taste, high body, astringency, and bitterness associated with coffee flavor than in WP and HP [6,16].
3.3.2. Trigonelline
The highest level of trigonelline of GCB was found in DP, WP, and HP undergoing CED as 0.68 ± 0.11, 0.54 ± 0.01, and 0.51 ± 0.04 mg/mL, followed by FD at 0.64 ± 0.04, 0.55 ± 0.07, and 0.50 ± 0.02 mg/mL and SD at 0.61 ± 0.09, 0.57 ± 0.03, and 0.48 ± 0.03 mg/mL, respectively. However, after roasting, the trigonelline content of RCB was high in SD DP, WP, and HP at 0.24 ± 0.01, 0.22 ± 0.01, and 0.21 ± 0.02 mg/mL, respectively, followed by FD at 0.23 ± 0.00, 0.22 ± 0.01, and 0.22 ± 0.00 mg/mL, and CED at 0.23 ± 0.01, 0.22 ± 0.02, and 0.21 ± 0.01 mg/mL. Our findings corresponded with the reported range of 0.4–2.4 mg/mL for trigonelline in spent coffee grounds [39] and 0.11–0.44 mg/mL for cold brew [15]. Dong et al. [40] reported that SD preserved caffeine and trigonelline contents better than other methods such as room temperature, solar, heat pump, hot air, and freeze drying due to the longer drying period. Thus, when compared to SD and FD, CED maintained higher levels of trigonelline and caffeine concentrations. DP also maintained a higher trigonelline content than WP and HP. Mintesnot and Dechassa [38] reported that trigonelline levels reduced with wet treatment and were influenced by altitude and processing methods. Trigonelline is a key precursor volatile compound that contributes to aroma and flavor [15,17]. RCB showed reduced trigonelline content under CED in comparison to SD and FD. This distinction was attributed to the high trigonelline content in GCB, which, during the degradation stage of roasting, was converted into other volatile compounds, including nicotinic acid, pyridine, pyrroles, 3-methyl-pyridine, and methyl ester [15,17,41]. Trigonelline content reduced during roasting, as about 50% of the volatile molecules blew up, resulting in the formation of volatile chemicals [41]. Levels of trigonelline in coffee were correlated with various environmental factors, including soil fertility, pH value, and coffee species, which were influenced by the roasting process [17].
3.3.3. Chlorogenic Acid (CGA)
Chlorogenic acid (CGA) is the most common phenolic compound found in coffee that is mainly responsible for flavor formation, coffee pigmentation, aroma formation, bitterness, and astringency of coffee beverages [17,38]. As shown in Table 3, the CGA content of GCB was highest in DP undergoing CED, SD, and FD at 205.38 ± 2.42, 189.99 ± 3.13, and 122.42 ± 0.56 mg/mL, respectively, followed by HP at 109.08 ± 0.94, 123.82 ± 0.76, and 103.98 ± 3.49 mg/mL and WP at 79.61 ± 2.34, 76.81 ± 1.65, and 68.35 ± 5.68 mg/mL. The CGA contents obtained in this study were close to the range from 86.42 to 61.15 mg/g of total CGA identified in GCB and reported by Moon et al. [42]. RCB resulted in a reduction in CGA; the CGA contents from SD were 25.99 ± 0.56, 24.53 ± 0.68, and 25.65 ± 0.32 mg/mL for DP, WP, and HP, respectively. CED contents were 24.44 ± 3.17, 23.37 ± 0.94, and 24.05 ± 3.38 mg/mL, and FD contents were 22.77 ± 0.52, and 21.20 ± 1.51, 21.53 ± 0.93 mg/mL, respectively. Moon et al. [42] discovered that the amount of CGA decreased by approximately 50% after roasting. The CGA content was measured at 28.12 mg/g for light roast, 18.84 mg/g for medium roast, 2.84 mg/g for city roast, and 0.47 mg/g for French roast, indicating that long roasting times resulted in lower CGA content.
Our results showed that drying and processing influenced the concentration of CGA in both GCB and RCB. In comparison to SD and CED, FD provided a lower CGA value as a result of applying drying temperature at a higher range of 30 to 45 °C. This phenomenon was attributed to the instability of CGA isomers during thermal processing, which promoted their degradation at a drying temperature of 50 °C [43]. Deotale et al. [44] revealed that spray drying, freeze drying, and conductive hydro drying influenced instant coffee’s CGA content. CGA reduced during roasting and post-processing, although spray freeze drying using sublimation retained the greatest amount of CGA [44]. Mintesnot and Dechassa [38] reported that altitude and processing altered CGA subgroups or individual CGA, which included up to 14% of CGA and affected coffee quality, acidity, and bitterness. Drying conditions influenced coffee seed metabolic activity, causing stress metabolism led to the loss of volatile compounds [43]. Thus, the method involving lower temperature and gradual drying was associated with a greater concentration of CGA, with a higher amount in CED compared to SD and FD. DP yielded superior CGA content compared to WP and HP.
3.3.4. Caffeic Acid
Caffeic acid (CA) and chlorogenic acid (CGA) are the two main phenolic acids found in coffee, as reported by Li et al. [45]. The concentration of CA in GCB was highest in CED at 0.45 ± 1.12, 0.41 ± 0.39, and 0.39 ± 0.99 mg/mL for DP, WP, and HP, respectively, followed by FD at 0.40 ± 0.11, 0.45 ± 0.21, and 0.37 ± 0.66 mg/mL and SD at 0.41 ± 0.30, 0.38 ± 0.41, and 0.30 ± 0.25 mg/mL, respectively. However, there were no significant differences (p > 0.05) in RCB, which ranged between 0.18 ± 0.03 and 0.20 ± 0.01 mg/mL. The CA content exhibited a reduction after roasting, corresponding to the decrease in CA from 0.242 to 0.249 mg/g observed in Robusta coffee extract reported by Jeszka-Skowron et al. [13]. Moon and Shibamoto [46] observed that CA released the highest quantity of volatile compounds throughout the process of RCB. The roasting process of coffee resulted in the degradation of CGA isomers into volatile compounds and their conversion into major acids such as CA, which occurred as an ester with quinic acid called 5-caffeolquinic acid [16]. On the other hand, GCB from CED gave higher CA values, which were attributed to its higher amount of CGA compared to SD and FD. Hernandex-Ayala et al. [47] demonstrated that CA, pyrrole, and thioglycolic acid exhibited the strongest protection factor against rancidity. The process of coffee roasting leads to the formation of phenolic compounds such as CA, gallic acid, pyrogallol, and purpurogallin. These chemicals serve to counterbalance the reduction in antioxidant capacity caused by the breakdown of CGA [14].
3.4. Sugar Content of Green and Roasted Coffee Beans
The components of sugar content, such as sucrose (non-reducing sugar), glucose, and fructose (reducing sugar), are crucial for the formation of aroma and flavor during the Maillard reaction and Strecker degradation of the roasting step [44]. As a result, sucrose and fructose were identified in GCB, whereas fructose was detected in RCB, and glucose was not detected. Table 4 shows that post-harvest processing and drying techniques significantly influenced (p < 0.05) sucrose and fructose levels.
Table 4.
Sugar contents of green and roasted coffee beans.
Sucrose content in HP was greater for CED, SD, and FD at 9.55 ± 1.76, 7.45 ± 0.61, and 5.55 ± 0.04%, respectively, and higher than DP (6.15 ± 0.04, 5.60 ± 0.33, and 5.23 ± 0.73%) and WP (5.15 ± 0.04, 6.60 ± 0.41, and 4.35 ± 0.37%). Knopp, Bytof, and Selmar [48] reported a range of 7.07% sucrose in arabica GCB. Mintesnot and Dechassa [38] established that altitude and unwashed processing had a substantial effect on the sucrose concentration in GCB. The WP unwashed processing method had an important impact on the complex metabolic activities of the beans during the drying step, particularly influencing sugar content and taste precursors. Sugar concentration plays a crucial role in the coffee cherry, mucilage, and pulp until the coffee reaches the green coffee bean stage [18,19].
Fructose of GCB was found at high levels in DP LTLH, SD, and FD at 3.75 ± 0.40, 2.20 ± 0.33, and 1.53 ± 0.04%, respectively. WP gave 1.30 ± 0.57, 1.77 ± 0.41, and 1.10 ± 0.08%, while HP recorded 1.20 ± 0.65, 1.70 ± 0.16, and 1.60 ± 0.04%, respectively. DP exhibited greater fructose in comparison to WP and HP as a result of de-pulping, rinsing, and fermentation. Following the fermentation process of endosperms, the concentrations of sucrose, fructose, glucose, and caffeine reduced, which was caused by the prolonged fermentation period. This led to an increase in acetic acid, ethanol, glycerol, glucuronic acid, lactic acid, mannitol, and succinic acid concentrations [49]. Thus, sucrose and fructose contents in HP and DP were greater than in WP. CED showed higher sugar content than the other drying methods. The high sucrose content in GCB presented more intense coffee cupping and flavor precursors [22].
After the roasting process, only fructose contents were found. Fructose contents in the DP of CED, SD, and FD were 2.07 ± 0.41, 1.33 ± 0.25, and 0.96 ± 0.33, respectively, and higher compared to HP (1.15 ± 0.20, 0.95 ± 0.18, and 0.68 ± 0.15) and WP (0.95 ± 0.29, 1.07 ± 0.50, and 0.60 ± 0.08), respectively. During roasting, the Maillard reaction is primarily responsible for the development of aroma in coffee. This involves the reaction between amino acids and reducing sugars, resulting in the formation of nitrogenous heterocycles and brown melanoidins, which contribute to the sweetness of coffee [22].
3.5. Principal Component Analysis (PCA) of Green and Roasted Coffee Beans
PCA was applied to identify green and roasted coffee physicochemical properties, including TD, L*, a*, b*, MC, aw, caffeine, trigonelline, CGA, CA, sucrose, and fructose contents from the CED, SD, and FD methods. The PCA score plot in Figure 4a indicates that the first two principal components, PC1 (55.58%) and PC2 (35.86%), collectively accounted for 91.44% of the total variance in GCB. The physicochemical parameters of TD, fructose, CGA, caffeine, trigonelline, and caffeic acid were associated with the drying methods of CED-DPG, SD-DPG, and FD-DPG. The drying rates of CED-HPG, SD-HPG, and FD-HPG were much greater and contrasted with sucrose, color L* a* b*, MC, and aw. The drying methods CED-WPG, FD-WPG, and SD-WPG were correlated with MC, aw, and CA. Therefore, it was inferred that various post-harvest processes had a primary impact on the physical, chemical, and sugar compositions of GCB. When comparing these processes, the CED technique resulted in increased amounts of physicochemical, biochemical, and sugar contents in GCB. SD resulted in moderate changes in these compounds, while FD exhibited the lowest changes.
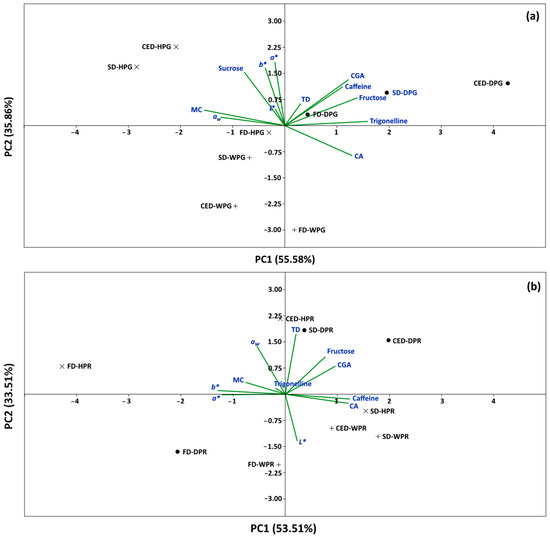
Figure 4.
Biplot of the relative physicochemical, biochemical, and sugar contents of coffee from different drying and post-harvest processing methods, (a) GCB, (b) RCB. CED, controlled-environment drying; SD, sun drying; FD, fast drying; DP, drying process; WP, washing process; HP, honey process; G, green coffee bean; R, roasted coffee bean; CGA, chlorogenic acid; CA, caffeic acid; TD, true density.
The PCA biplot illustrates the relationship between the component of RCB and the ability of selected qualitative indicators to distinguish between different drying and processing methods. PC1 and PC2 were retained based on their combined percentage of 87.02%. The principal components of RCB accounted for PC1 (53.51%) and PC2 (33.51%). CED-DPR, CED-HPR, SD-DPR, CED-WPR, SD-HPR, and SD-WPR were assessed based on aw, TD, fructose, CGA, caffeine, CA, color L*, and trigonelline contents. CED-DPR, SD-DPR, and CED-HPR had higher levels of TD, fructose, and CGA, whereas SD-HPR, SD-WPR, and CED-WPR exhibited higher levels of caffeine and CA. By contrast, FD-HPR, FD-DPR, and FD-WPR corresponded to MC, a*, b*, and L*. Thus, RCB had a greater influence on drying techniques than post-harvest processing, and SD had the most equivalent effect on coffee quality as CED compared to FD.
4. Conclusions
This research investigated the influence of post-harvest processing and drying methods on the physicochemical and biochemical compositions and sugar content of GCB and RCB. CED influenced the quality of GCB by promoting high levels of physicochemicals, biochemicals, and sugar content, followed by SD and FD. The quality of RCB relied on the initial GCB. The roasting process decreased the initial qualities (MC, aw, color, TD, caffeine, trigonelline, CGA, CA, sucrose, and fructose) while creating the specific aroma and flavor characteristics. Post-harvest processing was also a key factor in GCB qualities. DP provided the highest biochemical properties on caffeine, trigonelline, GCA, and CA, all of which were linked to the cup quality. HP provided high sucrose and fructose content, which produced a variety of compounds when roasting. WP removed some chemical characteristics during post-harvest processing. For further studies, the optimization of post-harvest processing among these three proposed techniques and their effect on volatile compounds and cup quality should be investigated.
Author Contributions
Conceptualization, R.S., S.W. and S.A.M.; methodology, R.S. and S.A.M.; software, R.S. and S.A.M.; validation, R.S.; formal analysis, R.S. and S.A.M.; investigation, S.A.M. and R.S.; data curation, S.A.M.; writing—original draft preparation, S.A.M.; writing—review and editing, R.S., S.W. and H.K.; visualization, R.S and S.A.M.; supervision, R.S. and S.W.; project administration, R.S.; funding acquisition, R.S. All authors have read and agreed to the published version of this manuscript.
Funding
This study was financially supported by Mae Fah Luang University under the National Science, Research, and Innovation Fund (NSRF) 2022: grant 652A04027. The research was partially supported by Mae Fah Luang University through the reinventing fund, post-graduate scholarship, Coffee Quality Research Group (CQR), and the Integrated AgriTech Ecosystem Research Group (IATE).
Data Availability Statement
The original contributions presented in the study are included in the article, further inquiries can be directed to the corresponding author.
Acknowledgments
The authors would like to thank the Scientific and Technological Instruments Center, Tea and Coffee Institute, and FoodInnopolis @ MFU for supporting the facilities and equipment used in this study.
Conflicts of Interest
The authors declare no conflicts of interest.
References
- Azavedo, M. The from farm to cup specialty coffee trend in Thailand and Vietnam. A major assumption about shortening supply chains disproven. Tech. Soc. Sci. J. 2021, 23, 540–556. [Google Scholar]
- Ruiz, X.F.Q.; Nigmann, T.; Schreiber, C.; Neilson, J. Collective Action Milieus and Governance Structures of Protected Geographical Indications for Coffee in Colombia, Thailand and Indonesia. Int. J. Commons 2020, 14, 329–343. [Google Scholar] [CrossRef]
- Noppakoonwong, U.; Khomarwut, C.; Hanthewee, M.; Jarintorn, S.; Hassarungsee, S.; Meesook, S.; Daoruang, C.; Naka, P.; Lertwatanakiat, S.; Satayawut, K.; et al. Research and development of Arabica coffee in Thailand. In Proceedings of the 25th International Conference on Coffee Science (ASIC), Armenia, Colombia, 8–13 September 2014; pp. 8–13. [Google Scholar]
- Humphries, U.W.; Waqas, M.; Hlaing, P.T.; Wangwongchai, A.; Dechpichai, P. Determination of crop water requirements and potential evapotranspiration for sustainable coffee farming in response to future climate change scenarios. Smart Agric. Technol. 2024, 8, 100435. [Google Scholar] [CrossRef]
- Ghosh, P.; Venkatachalapathy, N. Processing and drying of coffee—A review. Int. J. Eng. Res. Technol. 2014, 3, 784–794. [Google Scholar]
- Shofinita, D.; Lestari, D.; Aliwarga, L.; Sumampouw, G.A.; Ambarwati, S.A.; Gunawan, K.C.; Achmadi, A.B. Drying methods of coffee extracts and their effects on physicochemical properties: A review. Food Bioprocess Technol. 2024, 17, 47–72. [Google Scholar] [CrossRef]
- Aryal, B. Study of Physicochemical Properties of Coffee Bean from Different Processing Methods. Ph.D. Dissertation, Department of Food Technology, Central Campus of Technology, Institute of Science and Technology, Tribhuvan University, Kirtipur, Nepal, 2023. [Google Scholar]
- Bustos-Vanegas, J.D.; Correa, P.C.; Martins, M.A.; Baptestini, F.M.; Campos, R.C.; de Oliveira, G.H.H.; Nunes, E.H.M. Developing predictive models for determining physical properties of coffee beans during the roasting process. Ind. Crops Prod. 2018, 112, 839–845. [Google Scholar] [CrossRef]
- Tsai, C.F.; Jioe, I.P.J. The analysis of chlorogenic acid and caffeine content and its correlation with coffee bean color under different roasting degree and sources of coffee (Coffea arabica typica). Processes 2021, 9, 2040. [Google Scholar] [CrossRef]
- Levate Macedo, L.; da Silva Araujo, C.; Costa Vimercati, W.; Gherardi Hein, P.R.; Pimenta, C.J.; Henriques Saraiva, S. Evaluation of chemical properties of intact green coffee beans using near-infrared spectroscopy. J. Sci. Food Agric. 2021, 101, 3500–3507. [Google Scholar] [CrossRef] [PubMed]
- Adnan, A.; Horsten, D.V.; Pawelzik, E. Rapid prediction of moisture content in intact green coffee beans using near infrared spectroscopy. Foods 2017, 6, 38. [Google Scholar] [CrossRef]
- Pittia, P.; Nicoli, M.C.; Sacchetti, G. Effect of moisture and water activity on textural properties of raw and roasted coffee beans. J. Texture Stud. 2007, 38, 116–134. [Google Scholar] [CrossRef]
- Jeszka-Skowron, M.; Frankowski, R.; Zgoła-Grześkowiak, A.; Płatkiewicz, J. Comprehensive Analysis of Metabolites in Brews Prepared from Naturally and Technologically Treated Coffee Beans. Antioxidants 2022, 12, 95. [Google Scholar] [CrossRef] [PubMed]
- Liao, Y.C.; Kim, T.; Silva, J.L.; Hu, W.Y.; Chen, B.Y. Effects of roasting degrees on phenolic compounds and antioxidant activity in coffee beans from different geographic origins. LWT 2022, 168, 113965. [Google Scholar] [CrossRef]
- Heo, J.; Adhikari, K.; Choi, K.S.; Lee, J. Analysis of caffeine, chlorogenic acid, trigonelline, and volatile compounds in cold brew coffee using high-performance liquid chromatography and solid-phase microextraction—Gas chromatography-mass spectrometry. Foods 2020, 9, 1746. [Google Scholar] [CrossRef]
- Girma, B.; Gure, A.; Wedajo, F. Influence of Altitude on Caffeine, 5-caffeoylquinic acid, and nicotinic acid contents of arabica coffee varieties. J. Chem. 2020, 2020, 3904761. [Google Scholar] [CrossRef]
- Mengistu, M.W.; Workie, M.A.; Mohammed, A.S. Biochemical compounds of Arabica coffee (Coffea arabica L.) varieties grown in northwestern highlands of Ethiopia. Cogent Food Agric. 2020, 6, 1741319. [Google Scholar] [CrossRef]
- de Oliveira Junqueira, A.C.; de Melo Pereira, G.V.; Medina, J.D.C.; Alvear, M.C.; Rosero, R.; de Carvalho Neto, D.P.; Enriquez, H.G.; Soccol, C.R. First description of bacterial and fungal communities in Colombian coffee beans fermentation analyzed using Illumina-based amplicon sequencing. Sci. Rep. 2019, 9, 8794. [Google Scholar] [CrossRef]
- Silva, C.F.; Schwan, R.F.; Dias, E.S.; Wheals, A.E. Microbial diversity during maturation and natural processing of coffee cherries of Coffea arabica in Brazil. Int. J. Food Microbiol. 2000, 60, 251–260. [Google Scholar] [CrossRef]
- Kulapichitr, F.; Borompichaichartkul, C.; Fang, M.; Suppavorasatit, I.; Cadwallader, K.R. Effect of post-harvest drying process on chlorogenic acids, antioxidant activities and CIE-Lab color of Thai Arabica green coffee beans. Food Chem. 2022, 366, 130504. [Google Scholar] [CrossRef]
- Somporn, C.; Kamtuo, A.; Theerakulpisut, P.; Siriamornpun, S. Effect of shading on yield, sugar content, phenolic acids and antioxidant property of coffee beans (Coffea Arabica L. cv. Catimor) harvested from north-eastern Thailand. J. Sci. Food Agric. 2012, 92, 1956–1963. [Google Scholar]
- Barbosa, M.D.S.G.; dos Santos Scholz, M.B.; Kitzberger, C.S.G.; de Toledo Benassi, M. Correlation between the composition of green Arabica coffee beans and the sensory quality of coffee brews. Food Chem. 2019, 292, 275–280. [Google Scholar] [CrossRef]
- Jitjaroen, W.; Kongngoen, R.; Panjai, L. The equations of coffee Brixter index: The boosting of sugar concentration in post-harvest by using low temperature, low relative humidity. Eur. Food Res. Technol. 2024, 250, 311–323. [Google Scholar] [CrossRef]
- Specialty Coffee Association of America Cupping Protocol (SCAA). SCAA Protocols. Cupping Specialty Coffee. America. 2015. Available online: https://www.scaa.org/PDF/resources/cupping-protocols.pdf (accessed on 3 February 2024).
- Chandrasekar, V.; Viswanathan, R. Physical and thermal properties of coffee. J. Agric. Eng. Res. 1999, 73, 227–234. [Google Scholar] [CrossRef]
- Wongsa, P.; Khampa, N.; Horadee, S.; Chaiwarith, J.; Rattanapanone, N. Quality and bioactive compounds of blends of Arabica and Robusta spray-dried coffee. Food Chem. 2019, 283, 579–587. [Google Scholar] [CrossRef] [PubMed]
- Official Methods of Analysis of AOAC International, 17th ed.; Official Method 979.12; AOAC International: Gaithersburg, MD, USA, 2000.
- Akbar, A.; Medina, A.; Magan, N. Resilience of Aspergillus westerdijkiae strains to interacting climate-related abiotic factors: Effects on growth and ochratoxin A production on coffee-based medium and in stored coffee. Microorganisms 2020, 8, 1268. [Google Scholar] [CrossRef] [PubMed]
- Cordoba, N.; Moreno, F.L.; Osorio, C.; Velasquez, S.; Ruiz, Y. Chemical and sensory evaluation of cold brew coffees using different roasting profiles and brewing methods. Food Res. Int. 2021, 141, 110141. [Google Scholar] [CrossRef] [PubMed]
- Constantino, L.M.; Gil, Z.N.; Montoya, E.C.; Benavides, P. Coffee Berry Borer (Hypothenemus hampei) Emergence from Ground Fruits Across Varying Altitudes and Climate Cycles, and the Effect on Coffee Tree Infestation. Neotrop. Entomol. 2021, 50, 374–387. [Google Scholar] [CrossRef]
- Silvia, E.; Sidebang, B. Engineering properties of coffee beans from various colors of coffee cherries. Agric. Agric. Sci. Procedia 2015, 3, 274–277. [Google Scholar]
- Elhalis, H.; Cox, J.; Zhao, J. Ecological diversity, evolution and metabolism of microbial communities in the wet fermentation of Australian coffee beans. Int. J. Food Microbiol. 2020, 321, 108544. [Google Scholar] [CrossRef]
- Figueroa Campos, G.A.; Sagu, S.T.; Saravia Celis, P.; Rawel, H.M. Comparison of batch and continuous wet-processing of coffee: Changes in the main compounds in beans, by-products and wastewater. Foods 2020, 9, 1135. [Google Scholar] [CrossRef]
- Putri, D.P.; Andriansyah, R.C.E.; Setiyoningrum, F.; Yulianti, L.E.; Hidayat, D.D. Physicochemical properties of Robusta coffee at various roasting levels using different roaster types. In BIO Web of Conferences; EDP Sciences: Les Ulis, France, 2023; Volume 69, p. 03016. [Google Scholar]
- Baggenstoss, J.; Perren, R.; Escher, F. Water content of roasted coffee: Impact on grinding behaviour, extraction, and aroma retention. Eur. Food Res. Technol. 2008, 227, 1357–1365. [Google Scholar] [CrossRef][Green Version]
- Toschi, T.G.; Cardenia, V.; Bonaga, G.; Mandrioli, M.; Rodriguez-Estrada, M.T. Coffee silver skin: Characterization, possible uses, and safety aspects. J. Agric. Food Chem. 2014, 62, 10836–10844. [Google Scholar] [CrossRef] [PubMed]
- Sinaga, R.R.; Maryana, N.; Hidayat, P. Diversity and foraging activity of coffee insect pollinators in land near and far from the forest of North Sumatra, Indonesia. Biodiversitas J. Biol. Divers. 2024, 25, 240–248. [Google Scholar] [CrossRef]
- Mintesnot, A.; Dechassa, N. Effect of altitude, shade, and processing methods on the quality and biochemical composition of green coffee beans in Ethiopia. East Afr. J. Sci. 2018, 12, 87–100. [Google Scholar]
- Konstantinidis, N.; Franke, H.; Schwarz, S.; Lachenmeier, D.W. Risk assessment of trigonelline in coffee and coffee by-products. Molecules 2023, 28, 3460. [Google Scholar] [CrossRef] [PubMed]
- Dong, W.; Hu, R.; Chu, Z.; Zhao, J.; Tan, L. Effect of different drying techniques on bioactive components, fatty acid composition, and volatile profile of robusta coffee beans. Food Chem. 2017, 234, 121–130. [Google Scholar] [CrossRef] [PubMed]
- Bicho, N.C.; Leitao, A.E.; Ramalho, J.C.; de Alvarenga, N.B.; Lidon, F.C. Identification of chemical clusters discriminators of Arabica and Robusta green coffee. Int. J. Food Prop. 2013, 16, 895–904. [Google Scholar] [CrossRef]
- Moon, J.K.; Yoo, H.S.; Shibamoto, T. Role of roasting conditions in the level of chlorogenic acid content in coffee beans: Correlation with coffee acidity. J. Agric. Food Chem. 2009, 57, 5365–5369. [Google Scholar] [CrossRef]
- Kulapichitr, F.; Borompichaichartkul, C.; Suppavorasatit, I.; Cadwallader, K.R. Impact of drying process on chemical composition and key aroma components of Arabica coffee. Food Chem. 2019, 291, 49–58. [Google Scholar] [CrossRef]
- Deotale, S.M.; Dutta, S.; Moses, J.A.; Anandharamakrishnan, C. Influence of drying techniques on sensory profile and chlorogenic acid content of instant coffee powders. Meas. Food 2022, 6, 100030. [Google Scholar] [CrossRef]
- Li, X.; Yang, L.; Hao, M.; Song, T.; He, Y.; Yang, M.; Zhang, J. Chlorogenic acid as an indispensible partner of caffeic acid in coffee via selective regulation of prooxidative actions of caffeic acid. Food Res. Int. 2023, 173, 113482. [Google Scholar] [CrossRef]
- Moon, J.K.; Shibamoto, T. Formation of volatile chemicals from thermal degradation of less volatile coffee components: Quinic acid, caffeic acid, and chlorogenic acid. J. Agric. Food Chem. 2010, 58, 5465–5470. [Google Scholar] [CrossRef] [PubMed]
- Hernandez-Ayala, L.F.; Perez-Gonzalez, A.; Reina, M.; Guzman-Lopez, E.G.; Galano, A. Morning Antioxidants: Molecular Insights on the Chemistry of Coffee Components. Preprints 2023, 2023062138. [Google Scholar] [CrossRef]
- Knopp, S.; Bytof, G.; Selmar, D. Influence of processing on the content of sugars in green Arabica coffee beans. Eur. Food Res. Technol. 2006, 223, 195–201. [Google Scholar] [CrossRef]
- De Bruyn, F.; Zhang, S.J.; Pothakos, V.; Torres, J.; Lambot, C.; Moroni, A.V.; Callanan, M.; Sybesma, W.; Weckx, S.; De Vuyst, L. Exploring the Impacts of Postharvest Processing on the Microbiota and Metabolite Profiles during Green Coffee Bean Production. Appl. Environ. Microbiol. 2017, 83, e02398-16. [Google Scholar] [CrossRef]
Disclaimer/Publisher’s Note: The statements, opinions and data contained in all publications are solely those of the individual author(s) and contributor(s) and not of MDPI and/or the editor(s). MDPI and/or the editor(s) disclaim responsibility for any injury to people or property resulting from any ideas, methods, instructions or products referred to in the content. |
© 2024 by the authors. Licensee MDPI, Basel, Switzerland. This article is an open access article distributed under the terms and conditions of the Creative Commons Attribution (CC BY) license (https://creativecommons.org/licenses/by/4.0/).