Article

Remote Monitoring of Bee Apiaries as a Tool for Crisis Management

by
Efthymios Rodias
1,2,* and
Vasileios Kilimpas
2
1
Istitute for Bio-Economy and Agri-Technology (iBO), Centre for Research and Technology—Hellas (CERTH), 10th km Charilaou-Thermi Road, Balkan Centre, 57001 Thermi, Greece
2
Department of Agricultural Development, Agri-Food and Natural Resources Management, National and Kapodistrian University of Athens (Evripos Campus), 34400 Psachna, Greece
*
Author to whom correspondence should be addressed.
AgriEngineering 2024, 6(3), 2269-2282; https://doi.org/10.3390/agriengineering6030133
Submission received: 3 June 2024 / Revised: 28 June 2024 / Accepted: 11 July 2024 / Published: 17 July 2024

Abstract

:
Apiculture has presented significant growth in the last decades in Europe and worldwide. According to the Food and Agriculture Organization (FAO), there were 25.1 million bee colonies in Europe in 2021, with most of them being located in the southeastern countries. Smart technologies have invaded almost every pillar of agriculture, including apiculture. Modern apiculture is rather more nomadic than sedentary. Nomadism in beekeeping requires monitoring the settlement of bee colonies, in more than one place per year, in order to select more honey and pollen and contribute to the overall growth of the bees. To this scope, it is efficient to monitor and have wide control of bees remotely, in parallel with other smart applications, in order to prevent crises that would affect bee survival and/or yield production. The objectives of this paper are to outline a series of automation systems in apiculture used as a means towards the optimization of bee apiary management processes. Four beekeepers’ case studies were used to demonstrate how sensors and communication means transfer multiple bee-related data from various bee apiary locations to a single control system. The methodology was based on input/output data evaluation, risk prioritization based on real data, and feedback to the beekeeper based on the potential risks. Based on the results, the most significant risks are related to bad weather conditions, varroa mites, and bee colony health. Furthermore, the beekeeper is able to optimize the whole management, operations, and strategic planning throughout the year. Last, it should be noted that the presented remote monitoring system will never substitute the necessity of traditional beekeeper visits, but it contributes to minimizing them based on the monitored daily data.

1. Introduction

In the last decades, modern agriculture has made huge steps forward, not only in technological advancements but also in related scientific research. The use of the Internet of Things has been incorporated along with other state-of-the-art technologies, such as agricultural robotics, remote control, and monitoring, etc. [1,2,3]. Although most of these technologies have been implemented in crop and livestock production processes, there is a lot to be done in the apiculture sector, given that the bees are the main pollinators in most insect-pollinated crops, highlighting their crucial role (over 100 million bee colonies globally) [4]. The exploitation of the huge amount of data that can be extracted in modern bee colonies is a challenge and could be the starting point of various technological steps. The collection and sharing of data, and their management and processing through various sources (sensors, observational data), is critical and requires a beehive management information system, similar to the Farm Management Information Systems used in crop production systems [5,6]. The next step is the overall remote monitoring of bee colonies [7]. This is much more significant in cases where nomadic beekeeping is held.
Towards incorporating more sustainable beekeeping practices both in nomadic and static apiculture, the challenges that should be taken into account are connected to two main pillars; namely, the financial and the environmental [8]. Focusing mainly on nomadic apiculture, the financial pillar is directly connected to the finding and localization of optimal places to establish bee colonies towards the minimization of logistics costs and maximization of the honey and other bee product yield. On the other hand, the environmental pillar is correlated to the minimization of the carbon footprint of the overall beekeeping processes that are finally included in honey production [9]. These two main challenges constitute the moving power to assimilate remote monitoring technologies in nomadic apiculture.
Remote monitoring tools and applications include indicatively: local weather monitoring, beehive weight alteration, bee traffic analysis, and beehive colonies’ external environment monitoring [10,11]. These may contribute essentially to the bee colony’s management, at the first stage, and, furthermore, to the minimization of honey production costs and the carbon footprint of honey products. More specifically, their necessity is of major importance under extreme circumstances or, more commonly, under specific conditions that would significantly affect honey production. These conditions are the crises or risks that could occur in apiculture, and they should certainly be faced in a timely manner.
Risk management processing in any kind of business/enterprise follows specific steps (Figure 1). First, identifying potential risks should be an objective that affects the business (here, the beekeeping enterprise) in a positive way and may teach a lot to each one of the participants/employees. Actually, risks in a beekeeping business are anything that may have an effect either on the beehive management and task scheduling, the cost/budget spent for the various tasks, or generally, on the success or failure of the business. For effective risk identification, it is encouraged to have optimal communication among the participating personnel or consultants to share the risks that may be faced. In the second step, the probability of a risk to occur is analyzed together with each risk’s impact in order to determine a response plan for each specific case. Thirdly comes risk prioritization. Each risk should be ranked by taking into account its likelihood to occur and its effect on the business. In the fourth step, after identifying the worst risks, a treatment plan should be executed effectively by minimizing or eliminating the associated risks. After the completion of the abovementioned steps, the results should be monitored in order to ensure that all the risks have been managed in an effective way and that they have been minimized, or, at least, that they remain at a low level [12].
Based on these risk management processes, there is little literature background related to apicultural systems. In [13], the authors have attempted to determine risk factors that affect apicultural farms in certain regions of Turkey and develop strategies to face them. On the other hand, an IoT approach that includes beehive weight measurements by using partly remote and proximal means and tools outlines only slightly the contribution of remote monitoring in the risk management of apicultural systems [14]. Of course, there are a few smart apiculture systems that provide remote monitoring among other smart applications, without emphasizing the necessity of focusing on potential risks and crises during a given production cycle and suggesting potential solutions [11,15,16,17,18]. Apiculture faces significant losses year by year due to many reasons such as lack of flowers, climate change, insecticides, varroa mites, etc. [19,20]. This fact underlines the need to combine the knowledge coming from smart remote monitoring systems and risk assessing to treat these risks under optimal circumstances and achieve the minimization of costs and losses.
The main aim of this paper is, firstly, to present the capabilities of a remote monitoring beehive system applied in nomadic apicultural systems. The second step is to identify the potential risks that a nomadic beekeeper may confront and to present solutions based on smart remote monitoring, targeting the minimization of production costs and the carbon footprint. To this scope, different case studies are presented.

2. Materials and Methods

2.1. System Architecture

For the scope of this study, the remote monitoring beehive system that was used was the Metriflex©, Model type E1 (Chalkida, Greece). The capabilities of this system include a series of sensors for the measurement of various types of data:
  • Weather conditions (ambient temperature and relative humidity) of the apiary
  • Inside-hive temperature
  • Beehive weight
  • Flight conditions assessment
  • Beehive door activity
  • GPS location tracking
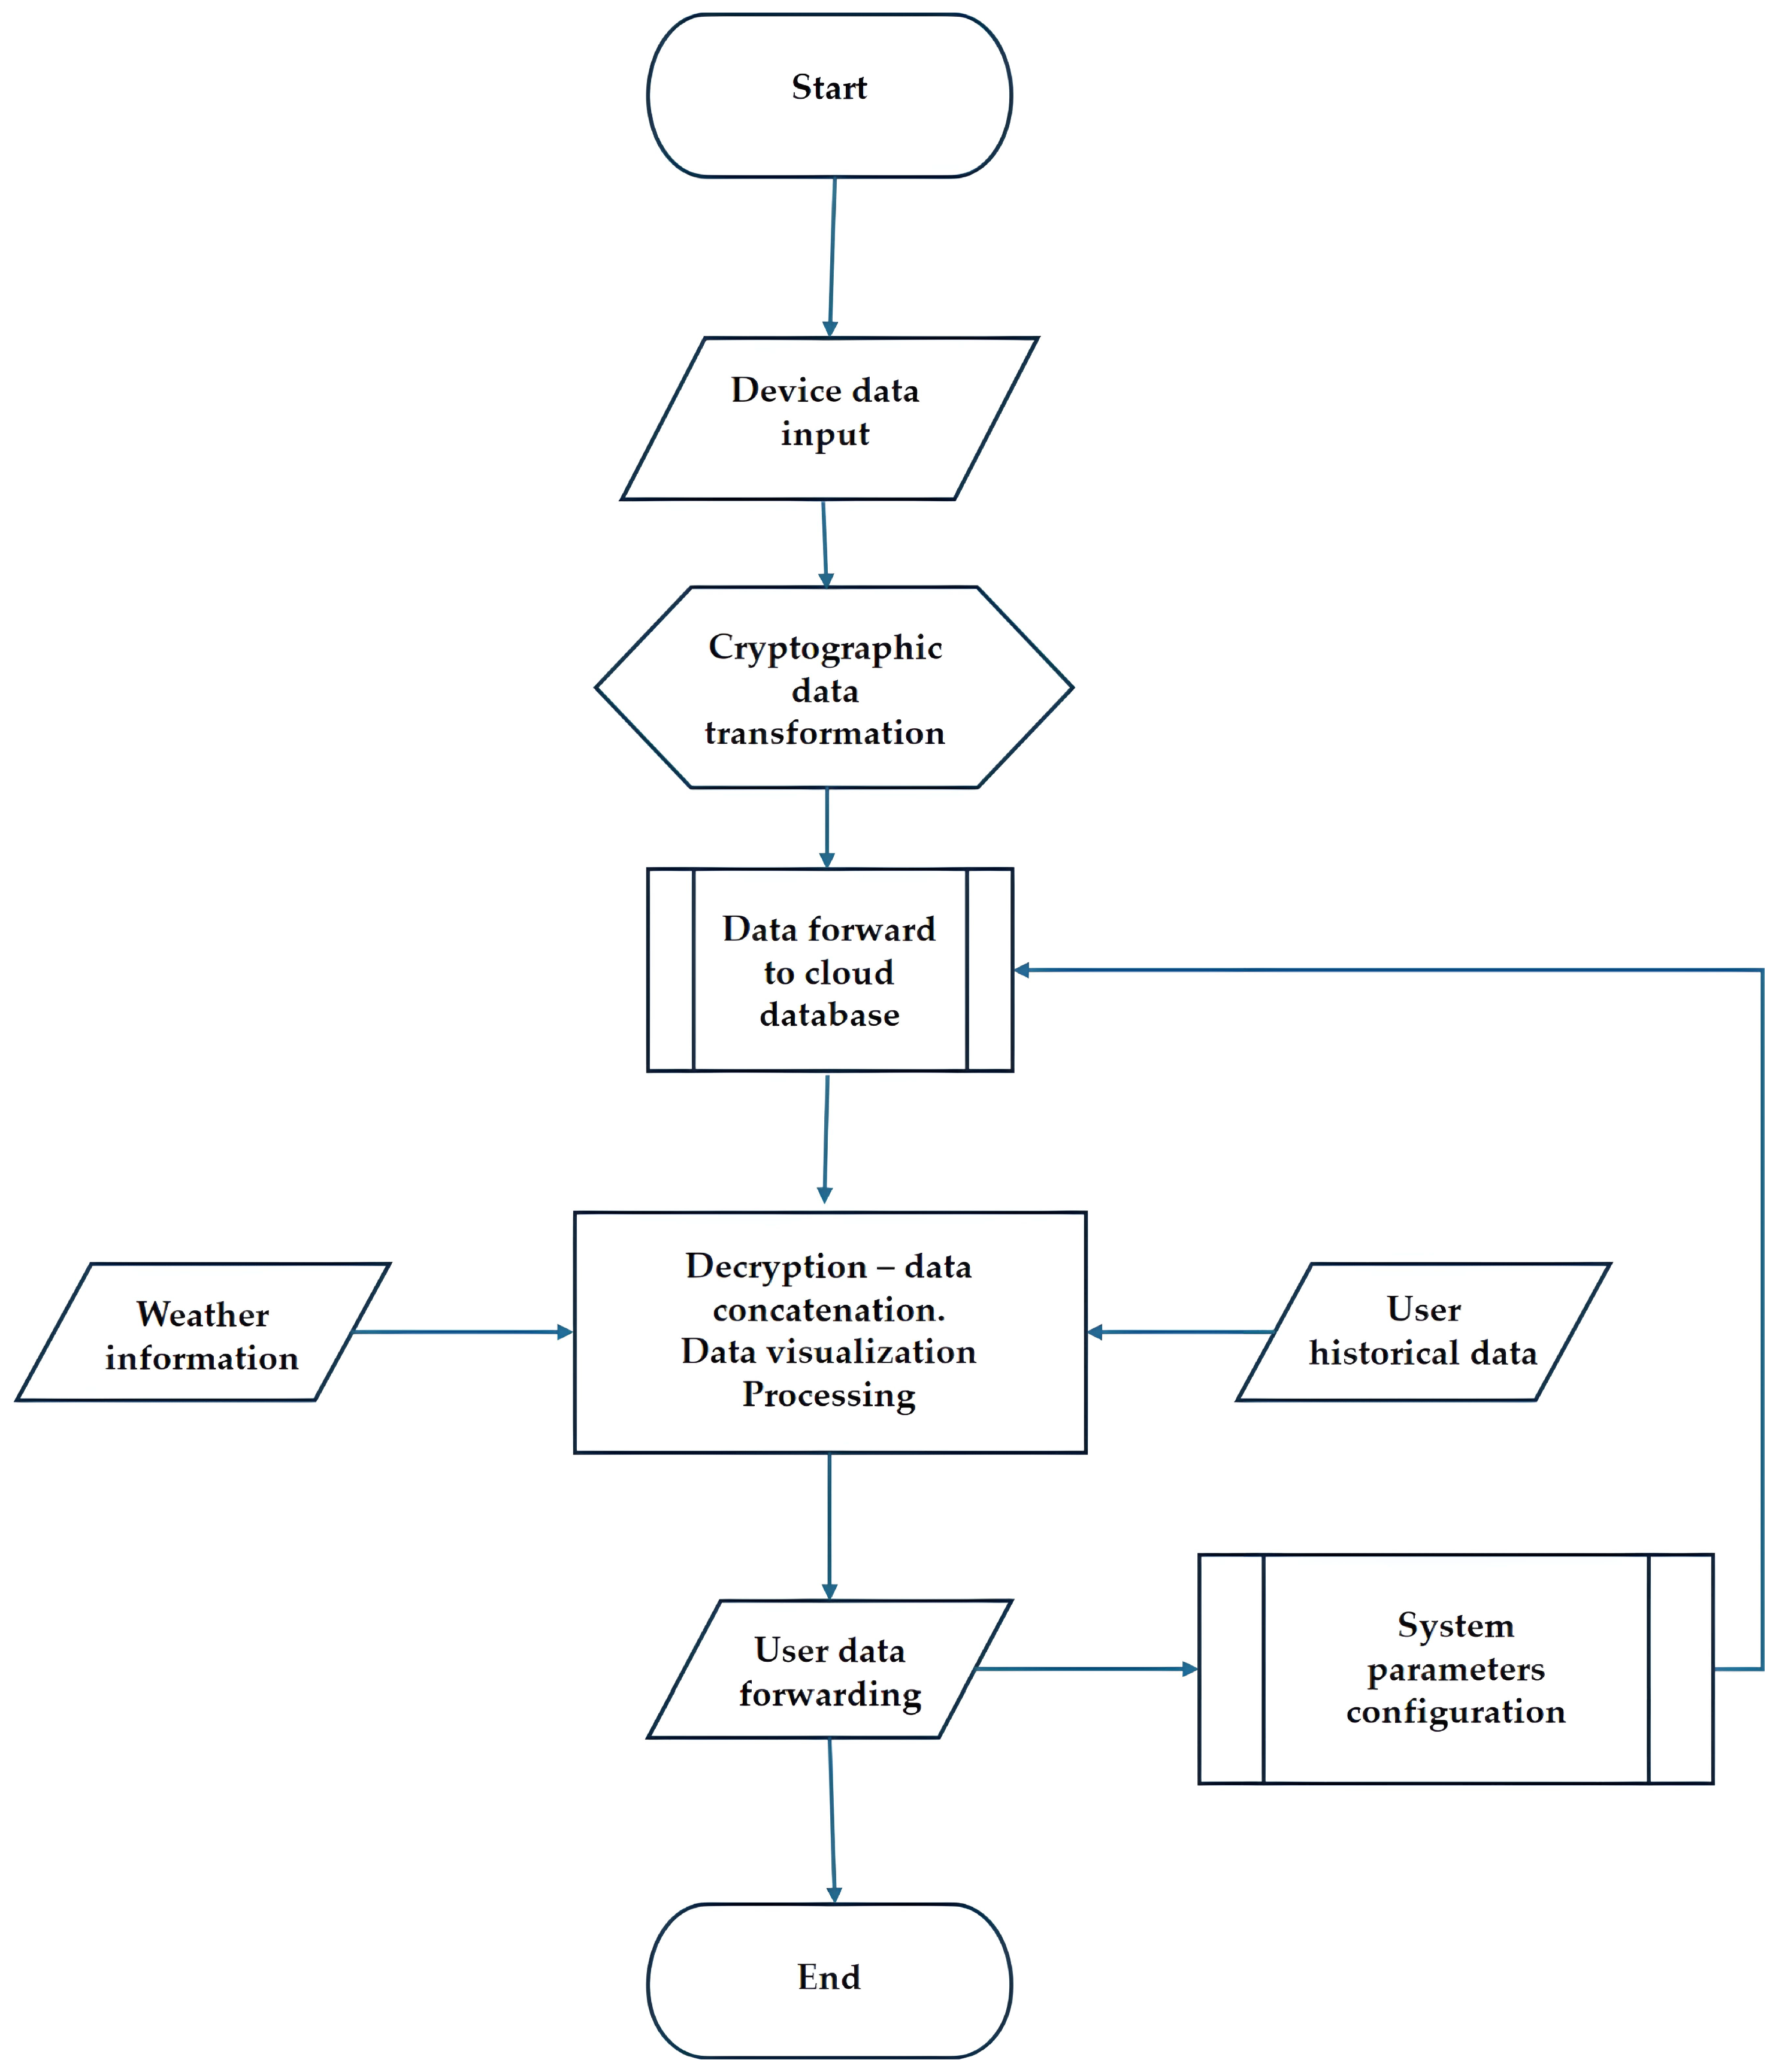
The algorithm upon which the control of the whole system and the related data is based is shown in Figure 2. More specifically, as the starting point of the flow, the input from the device data in the field is gathered. The data are transformed into an encrypted format to be securely sent via the GSM network. After this, the encrypted data are forwarded to the system cloud database via the GSM network. The main process begins with data decrypting and concatenation with the historical user data to create graphs. Additionally, ambient meteorological data are collected from an external provider based on the location of the device and generate updates to the user. The produced data and graphs are forwarded to the user. The user is able to configure system parameters and settings at any time.
In addition to the Metriflex remote monitoring system, a surveillance system was used in order to send alerts when any potential thief appears, or in the event of wild animal or European bee-eater attacks. The cost of the overall system does not exceed one thousand euros, based on the current situation.

2.2. Input/Output Data

The Metriflex remote monitoring system takes into account a massive amount of data as input on an hourly basis for each bee apiary location. These data should be safe to avoid potential malfunctions, bugs, or hacking attempts. After processing and concatenating the various types of data, a set of charts is produced to be sent to the user, and text output information is generated to be sent to the user. These input and output hourly data are presented in Table 1 (including an example of BK (Beekeeper) 1). A summary of these input and produced output data is sent periodically to the user, giving an overview of the apiary status. More specifically, there is a set of weather-related data, beehive scale data, GSM signal, location, etc. It should be noted that, as presented in Table 1, the direct beehive weight change refers to the difference between the current measurement and the previous one, while the daily beehive weight change refers to the change that occurred from the previous day, at the same time, up to the current day and time.
The basic monitoring protocol includes three periodical update messages (Periodic 1: ~9:00 a.m., Periodic 2: ~2:00 p.m., and Periodic 3: 8:00 p.m.) throughout the day (24 h). This can be configured based on the user preferences. In case of weight disorder (due to thief/animal attack), the system will send an alert message informing the user of this event.
Focusing on the produced output, apart from the generated graph of the weight 24-h variance and the BFCI (Bee Flight Conditions Chart) polygon chart (see Section 3.1), there is an option to summarize the cumulative beehive weight from a starting day (set by the user) up to the present. This option is meaningful mainly during foraging periods when the beekeeper moves the bee apiaries to a location to collect the honey and wants to know the mean foraged honey yield per day and the cumulative total yield. Last, the door activity sensor is able to send an alert message in case a massive bee presence event occurs (potential case of a swarm).

2.3. Experimental Case Studies

To demonstrate the functionalities of the proposed system, a set of four real nomadic beekeepers was evaluated. Their bee colonies’ locations and their bee farms are spread in various locations around Greece. All of these beekeepers follow nomadic apiculture and, as a consequence, they make specific annual planning regarding the locations where they move their bee hives in order to collect different varieties of honey and/or help their bee apiaries grow. In Figure 3, the four sets of bee colonies’ journeys for the year 2023 are presented. The honey blooms that they targeted varied from two to four per annum. Obviously, the scheduling of the honey bloomings that each beekeeper follows may vary each year.
In parallel, the allocation of the blooming types that each beekeeper follows to transfer his/her beehives throughout the year is presented in Figure 4. It should be noted that yellow pins represent the bee apiaries’ locations while the orange ones represent the bee farms’ locations. The honey-giving crops that these beekeepers target are wildflowers, thyme, fir trees, and pine trees. These crops are among the most significant crops in Greek apiculture and in the Greek honey market. Of course, the blooming period is volatile and may vary year by year depending on the weather conditions, the early or late spring, and the bee colonies’ growth level when the flower blooming period approaches.
The four beekeepers made use of the remote monitoring system for a whole year and collected the data to further self-assess the overall growth of their bee apiaries. From BK 1 to BK 4, the number of beehives they managed for the tested period was 156, 342, 120, and 220, respectively. These beekeepers were selected based on their willingness to provide their data. The collected data were mainly related to weather, weight measurements, door activity data, and safety data (by using a surveillance camera). For the scope of this study, these data will be used for identifying potential risks and their impact, prioritizing them, and finding optimal solutions to treat them.

3. Results

3.1. Apiary Monitoring and Data
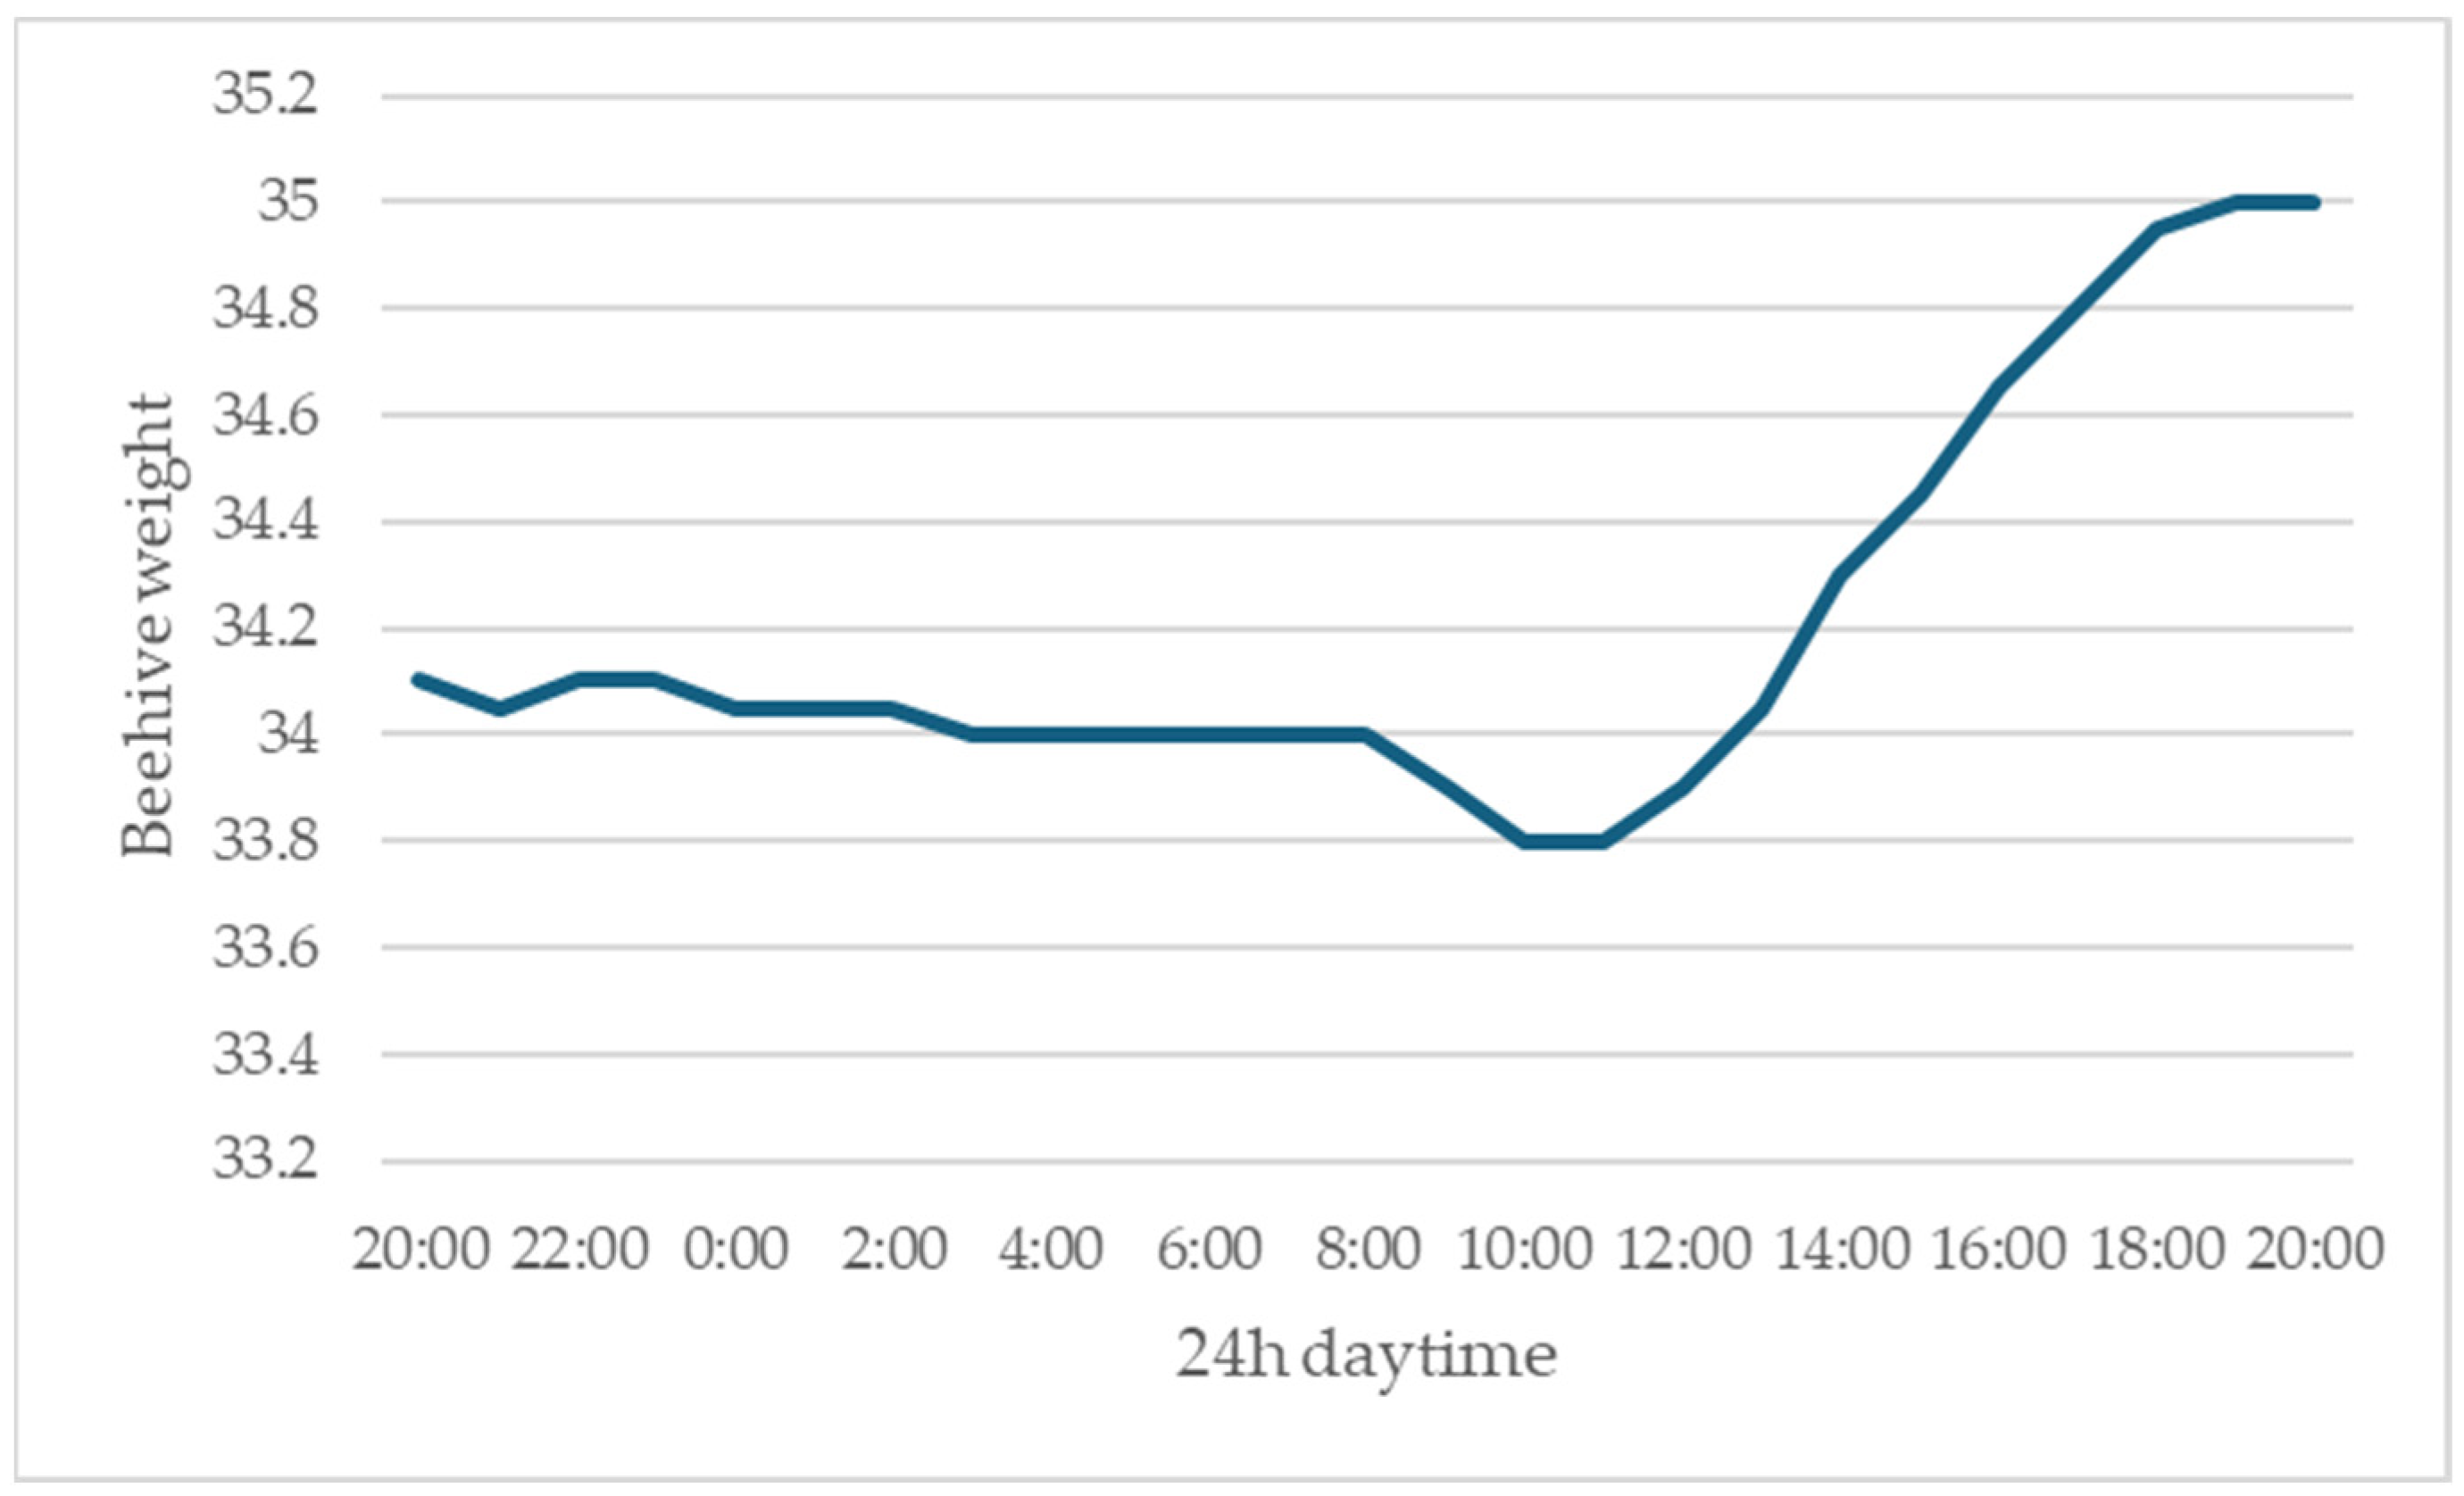
Based on the data provided by the four indicative remote monitoring systems (one system for each beekeeper), a number of results can be extracted. The 24-h variance of an indicative beehive weight during the foraging period represents the daily foraging capacity of the apiary (Figure 5). In Figure 5, this daily variance initiates at 20.00 on the previous day and ends at the same time on the upcoming day. This configuration has been set to the system because, during spring at that time (20.00), almost all the bees are inside the hive due to the upcoming night. So, the beehive scale calculates the difference between a full hive including bees every 24 h. In parallel, the daily beehive weight variance in a normal spring period could provide significant insight into the health and growth of the bee apiaries. For the purposes of this study and based on the beekeepers’ suggestions, one remote monitoring system has been considered for every 50 beehive colonies’ group, taking into account an average colony regarding growth, bee population, and food supplies (pollen, honey, water).
Figure 5. Twenty-four-hour beehive weight variance in a foraging period.
Agriengineering 06 00133 g005
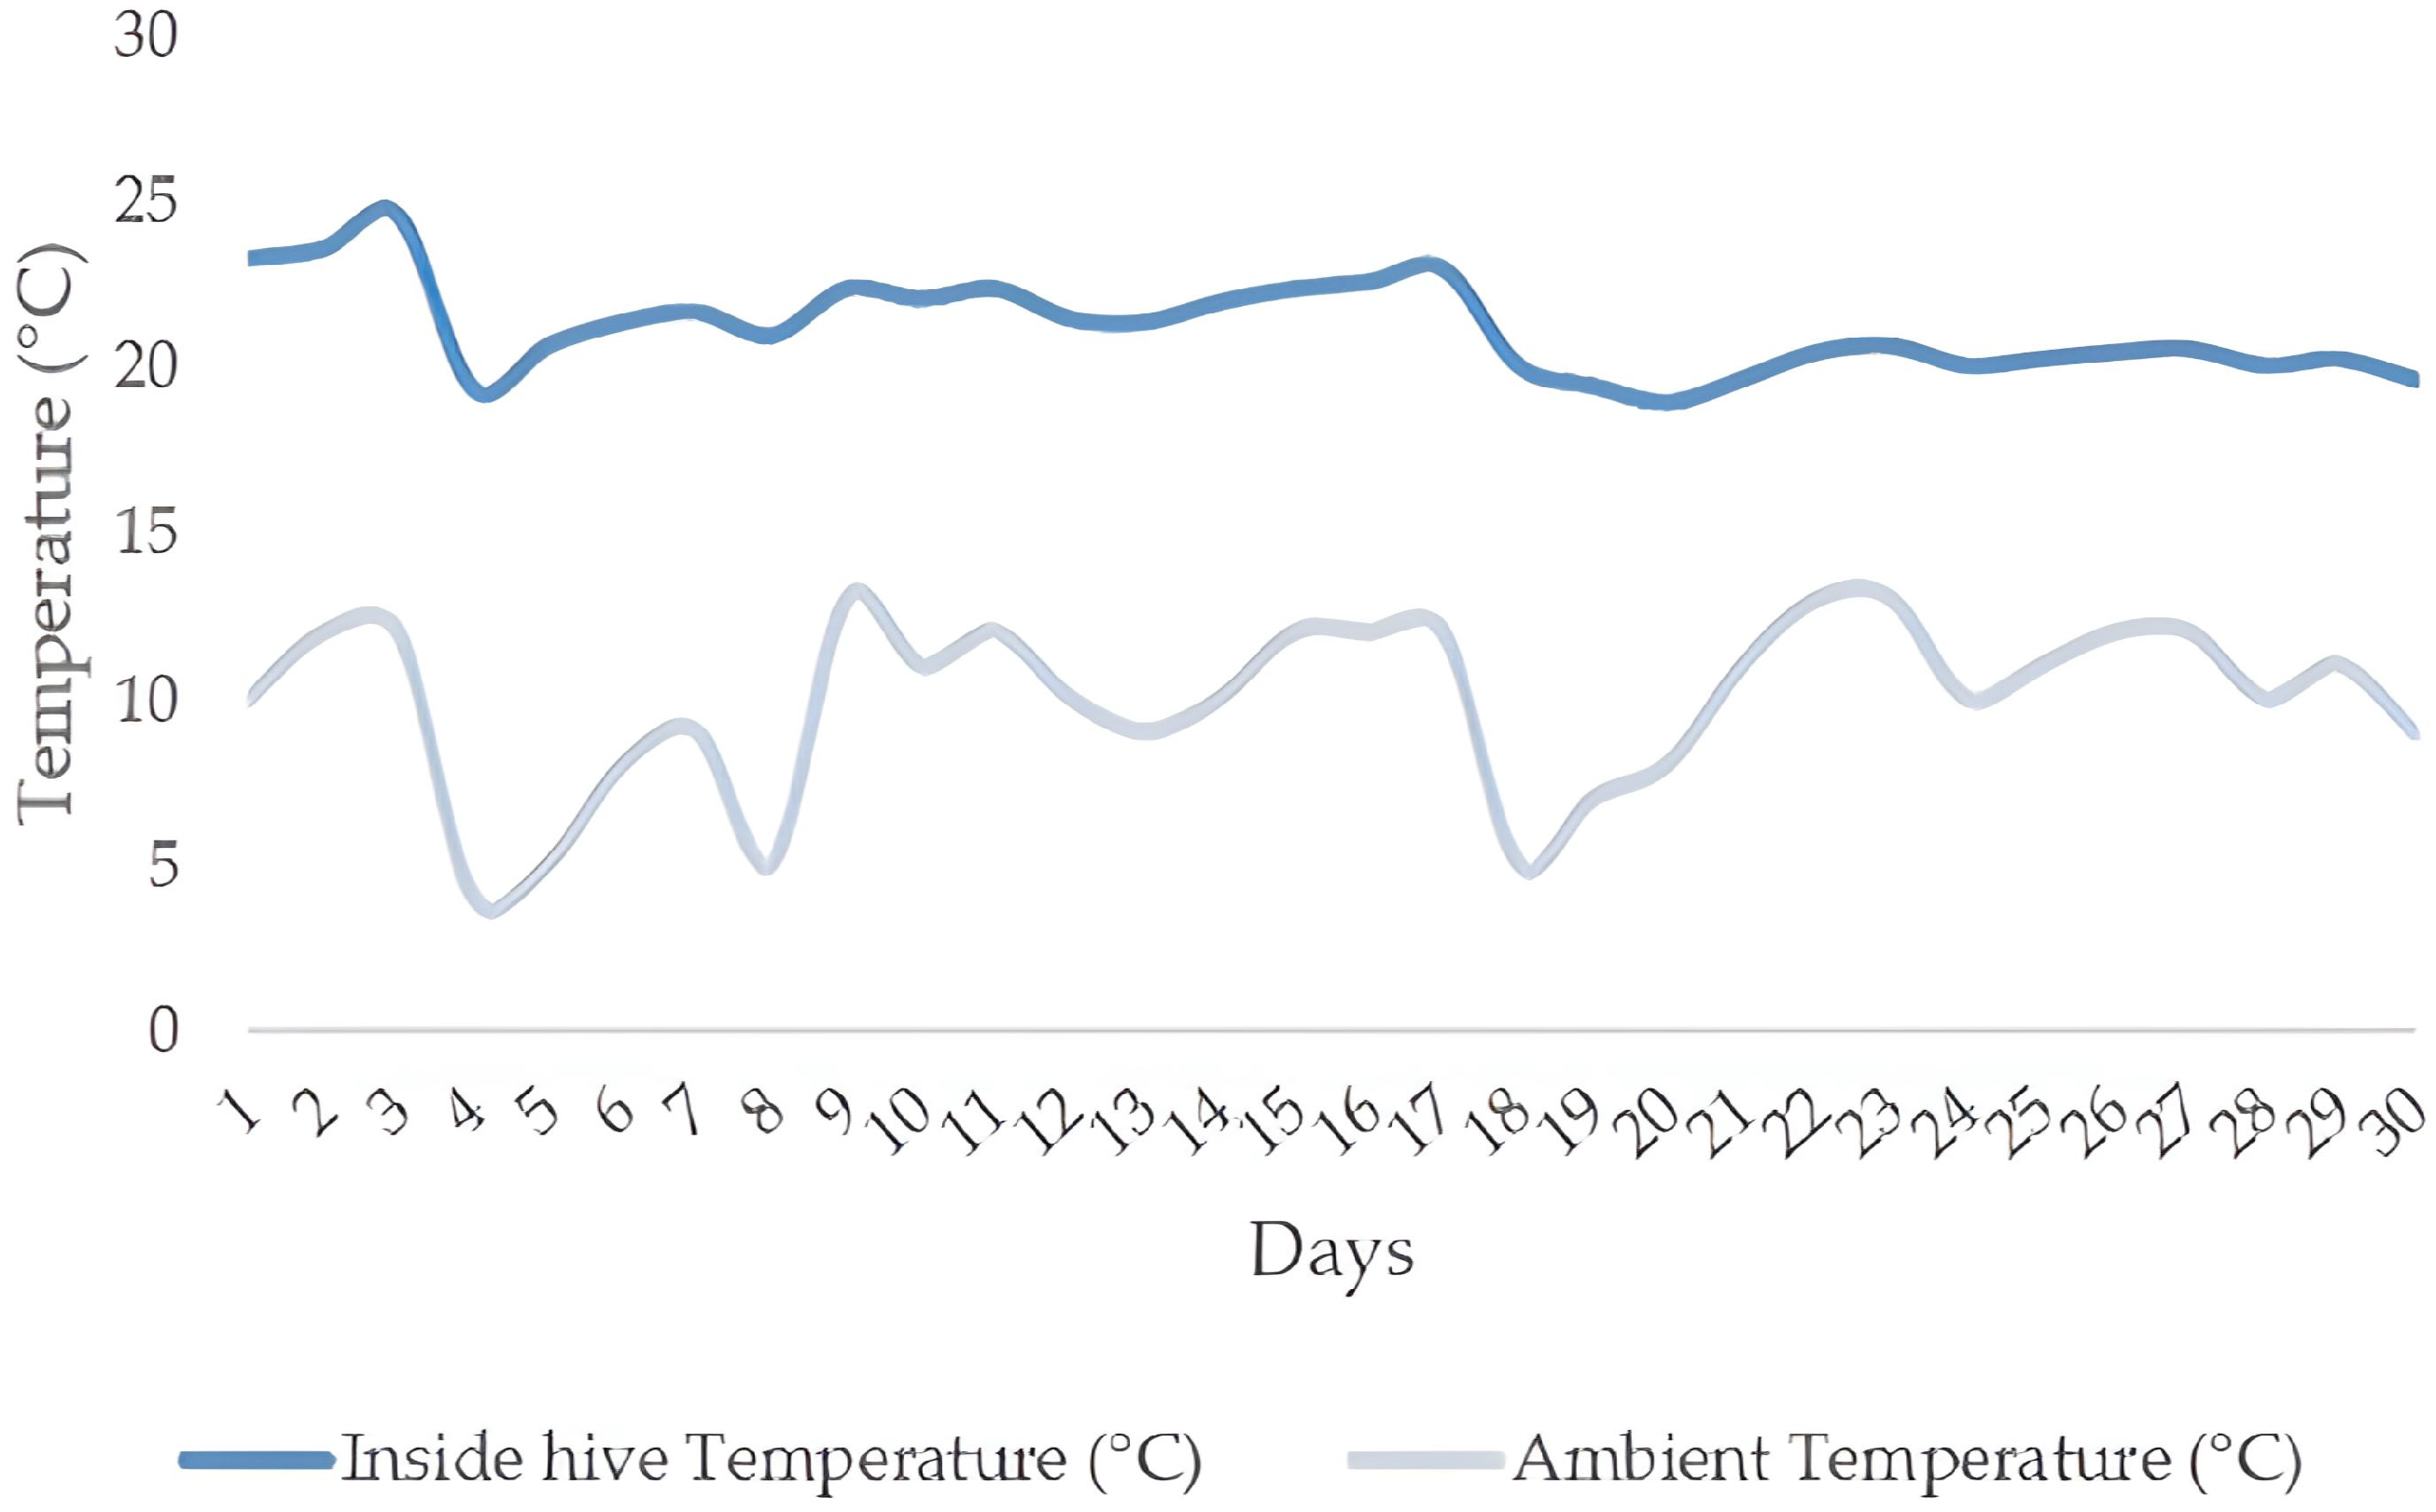
The variance between the inside and outside temperature of the hive for the period of winter reflects valuable output regarding the health of the bee colonies. It is widely known that, for bee colonies during overwintering, a minimum bee population should exist for the bee colony to survive, especially under adverse conditions in northern regions [21]. This population size threshold is of vital importance for conserving the internal temperature of the hive under viable conditions. To this scope, in each case study, a couple of small-to-medium-sized bee colonies were selected to evaluate their survival capability based on inside and ambient temperatures. These temperature variations are indicatively presented for BK 3 (regarding January) in Figure 6. Of course, in order to extract safe output from this experiment, a rational diet for the bee colonies should have been preceded, based on the fact that winter bees should be well-fed before low winter temperatures appear.
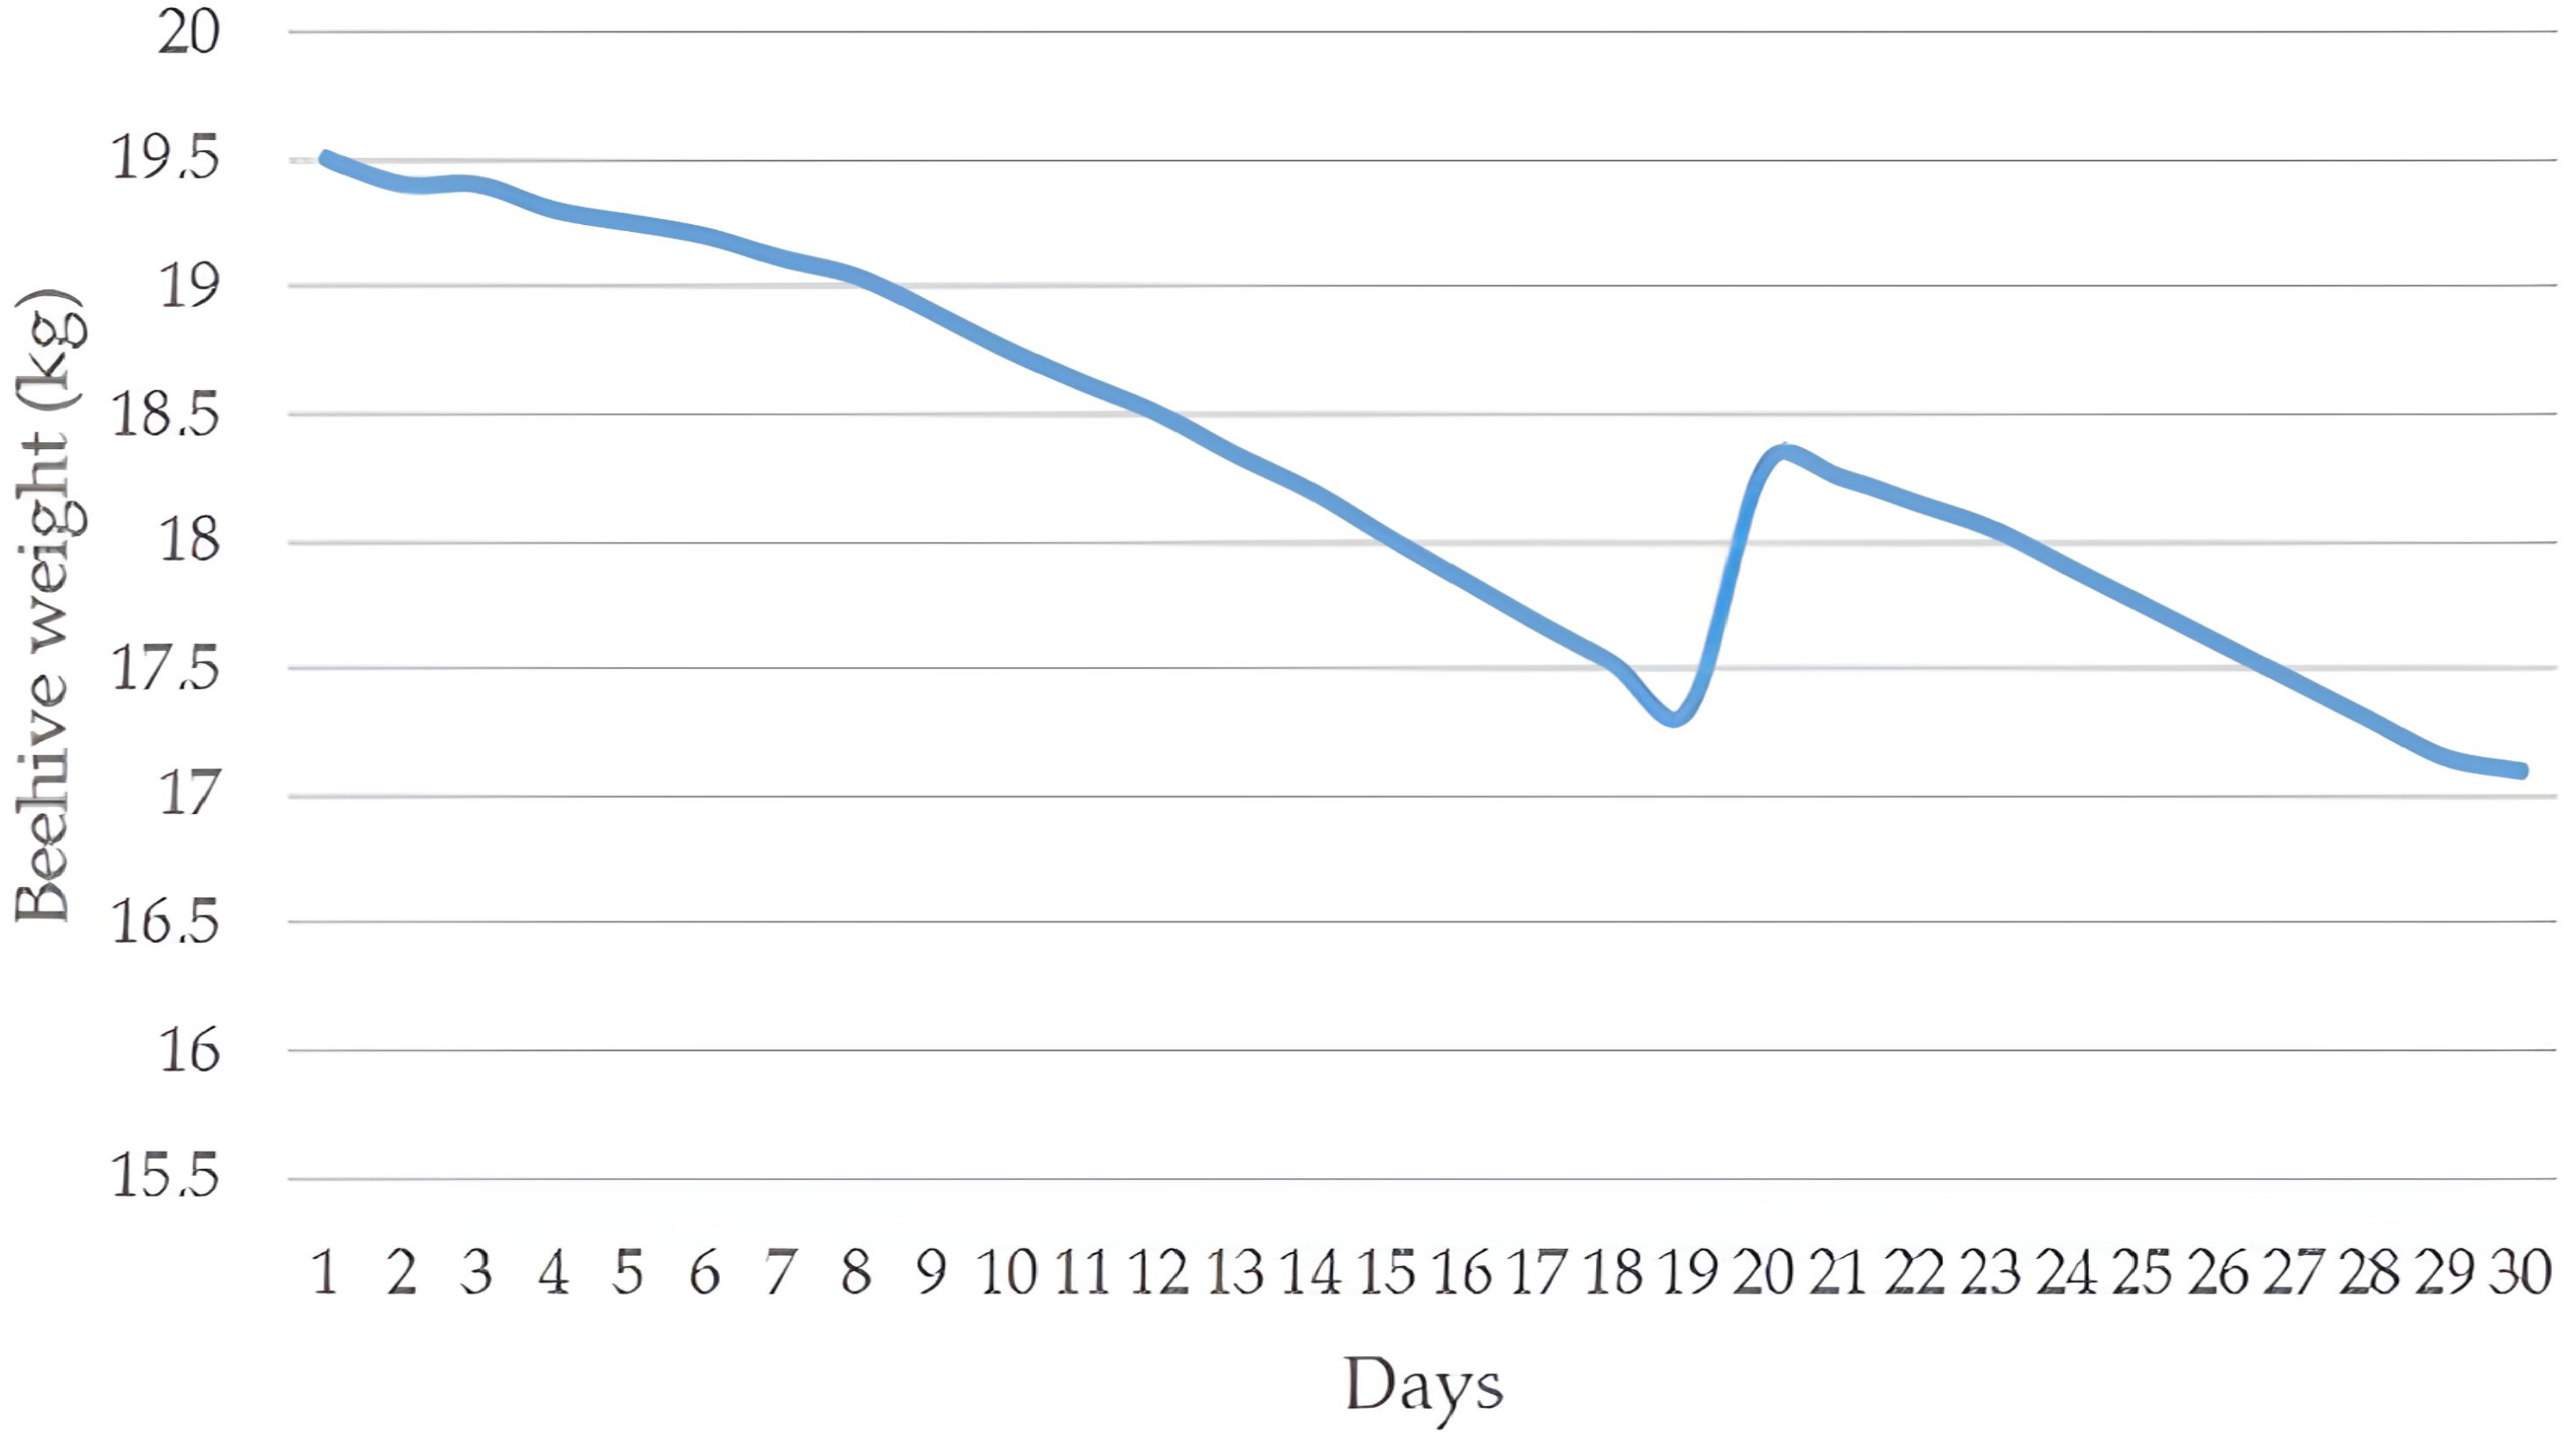
Further to the aforementioned, a daily measurement of the bee colony’s weight could provide notable information regarding the health of bees and the survival of the bee colonies (Figure 7). During winter in Mediterranean countries, an average bee colony requires approximately 150 g of feeding per day [22]. Based on this, and following the recorded feeding consumption, the beekeeper should act in a timely fashion to help the colony survive (as presented on Day 20 in Figure 7), unless there is enough food savings in the bee colony. It is obvious that the daily feeding may vary depending on the size of the colony, the type of feeding, the age of the bees, the location of the apiary, and other parameters. Nonetheless, it can serve as a valuable key factor in evaluating bee colony health throughout the winter period [23].
A remarkable asset of the proposed system is its capability to monitor beehive door activity. For this purpose, a lidar (Light Detection and Ranging) sensor is used to detect inbounding and outbounding bees and collect the data. Clarifying further, lidar is a method for determining ranges by targeting bees with a laser and measuring the time for the reflected light to return to the receiver [24]. Even though this part of the system needs further modification to be fully functional, its potential is noteworthy, given that it can detect and record massive flying movements and give valuable outcomes. For example, a swarm can be detected on time and, as a sequence, be captured in a new beehive, although it is a prerequisite that the beekeeper is able to visit the apiary the same/next day. In addition, the number of foraging bees can approximately be assessed per blooming season. Indicatively, the lidar sensor for BK 4 is presented in Figure 8. Its main function is as follows: The sensor beams up to a range of 30–35 cm. It may be interrupted by the bees and each sample is sent to the control system every 5 s. Every 18 min, the precedent data are collected and sent to the control system. In case there are significant beam interruptions in this short time period, an alert is sent to the beekeeper.
One more valuable tool is included in the presented system and introduces an innovative key indicator named the Bee Flight Conditions Indicator (BFCI). This indicator is extracted by using a mathematical algorithm (Equation (1)) and by using weather data related to bee apiary ambient temperature (in °C), precipitation (in mm), and wind speed (in km/h):
B F C I = θ A T + b P R + c W S
where θ, b, and c represent gravity factors for each of the three types of data, AT stands for ambient temperature in °C, PR is precipitation in mm, and WS is wind speed in km/h.
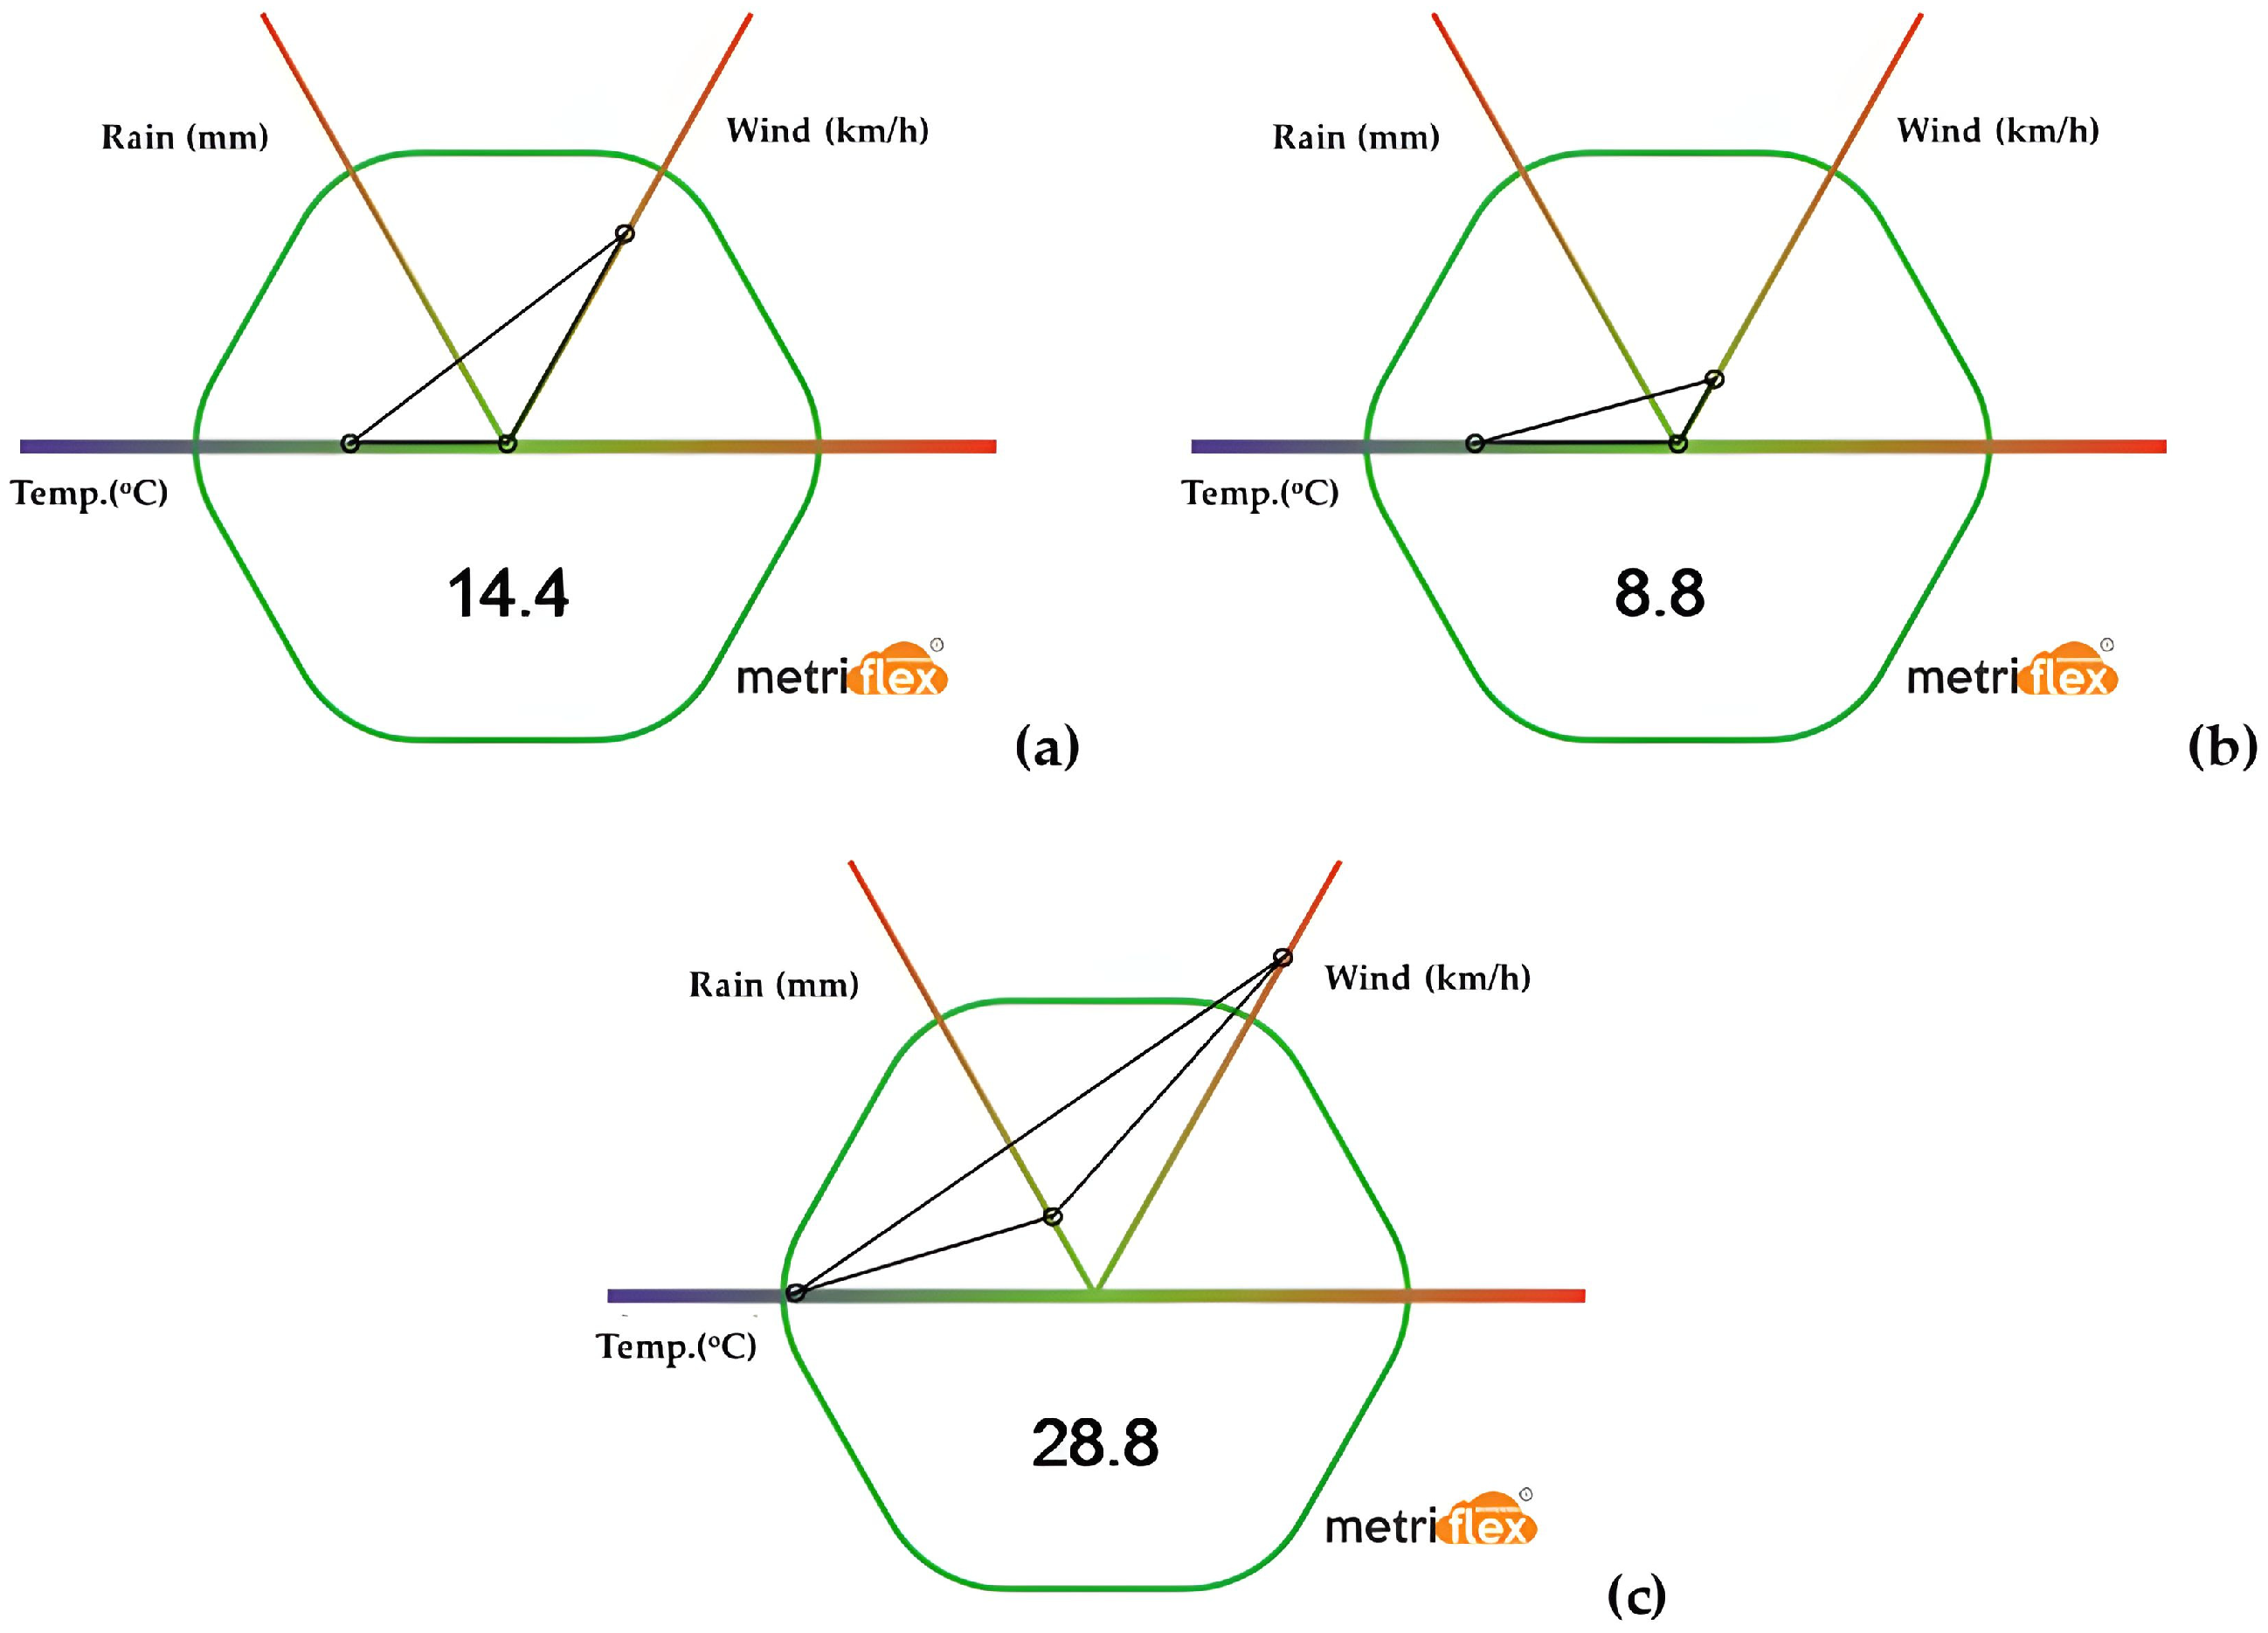
The gravity factors are represented with the reverse unit compared to the one they associated with, i.e., θ in °C−1, b in mm−1, and c in h/km. BFCI is dimensionless and is classified into the presented groups based on its value (Table 2). Its key importance can be evaluated under risky weather conditions such as heavy rain, strong winds, or high/low temperatures. In Figure 9, three indicative cases are presented: (a) for app. 20 °C, 0 mm rainfall, and 16 km/h wind speed, (b) for app. 18 °C, 0 mm rainfall, and 5 km/h wind speed, and (c) app. 15 °C, 0,5 mm rainfall, and 25 km/h wind speed. BFCI can be easily combined with bee-scale measurements to extract even more accurate results for the flight conditions. For example, when a significant upward change in beehive weight appears, it might lead to misleading monitoring results. By monitoring, in parallel BFCI-produced chart and beehive scale input, we may notice that this upward change is due to heavy rain in the bee apiary region, so bees are not able to fly (the first cause of beehive change) and there is a small, but important, amount of water (about 200 mL) on the beehive top (second cause).
Last, a 4K autonomous surveillance camera system (LS VISION Solar Camera 4G, Shanghai, China) was set in each bee apiary location where each beekeeper moved his/her beehives. This was used as a key anti-theft protection against humans, wild animals (bears, rats, etc.), hornets, and the European bee-eater (Merops apiaster)—a migratory bird that feeds on bees, mostly during spring. It is crucial to monitor the bee apiary because, apart from human thieves, wild animals may cause significant losses in the apiary more than once. Additionally, bee-eaters love to feed on queens during their mating flights, causing indirect, significant damage to their bee colonies.

3.2. Assessed Risks and Impact

The assessed risks in the current study can be divided into the following categories: security risks, weather-related risks, production risks, and overwintering risks. These categories were set for the various bee apiary locations throughout the year. In Table 3, the risks per category are analyzed and scored from one to ten, based on their impact on the apiary’s economic sustainability. The scores were extracted not only from the four beekeepers’ actual experiences but also from an in-depth questionnaire that was produced and shared with a wide group of more than 150 beekeepers in Greece. In this way, the main objective for the risk impact rating is on the level, importance, and potential losses related to each risk. Of course, the risk categorization and the related risks are not absolute, given that there is intercorrelation between the various categories. For example, and to make it clearer, bad feeding during overwintering may directly affect (a few months later on in early spring) the colony health and, as a consequence, may affect the production risk category.

3.3. Risks Prioritization and Treatment

Based on the identified risks mentioned above, a sorting prioritization list was generated to treat in the optimal way each risk (Table 4). The current remote monitoring system is able to treat most of these risks, even though there is still a lot to be done. Apart from these, it should be noted that these risks and proposed smart solutions may be negotiable by other beekeepers who handle bees under different circumstances.

4. Discussion

Apicultural systems face a number of potential risks and crises during the various production processes. Reduced yields, bee colony losses due to viruses and varroa mites, and even climate disorders are only indicative samples. In this paper, it was attempted to point out the main risks that occur to Greek apicultural systems and the probability of incorporating smart apicultural tools and technologies to treat them. More specifically, four beekeepers and the annual nomadic operations they apply were used for the demonstration of the presented system. As presented in the results, in most cases they were able, based on the feedback they had from the system, to reduce potential direct or indirect risks, minimizing the associated costs.
More specifically, based on the results, the main highlighted risks that may lead to production and bee colony losses are related to varroa mites and unstable weather conditions throughout the year. Regarding the varroa mite, following annual prevention and treatment protocols against it and evaluating the mite population at least 2–3 times per year is one of the most highly noteworthy processes. A bee apiary that has almost 0–1% varroa mites is healthy and has a high potential to achieve notable honey yields, while colonies with detected infestation of equal or more than 2% are considered to be reaching minimum threshold levels [25,26]. To this point, apart from varroa testers and the indirect information that comes from the beehive scale, there is a lack of technological tools that could give the opportunity to the beekeeper/manager to remotely monitor the presence of the varroa mite. Based on the current situation, varroa mites can be monitored remotely only indirectly. There are a few indirect ways to monitor it. Firstly, the beekeeper should keep records on the growth stage of each bee colony and, in parallel, mark the “bad” bee colonies to facilitate with them as soon as possible. Another way is to change the bee queens often to keep optimal DNA circumstances for the conservation of the bees’ self-cleaning behavior.
In parallel, unstable or bad weather conditions, especially during foraging periods, could be remotely monitored by weather sensors in parallel with bee scale data, and, in case its duration is prolonged, a new apiary location should be selected to avoid yield and bee apiary losses.
As the next step, or in parallel with varroa treatment, comes virus/disease prevention. A healthy bee apiary is varroa-free and, as a consequence, is virus- and disease-free. The health of a bee colony can be indirectly monitored remotely by the beehive scale, the door activity sensor, and the inside hive temperature (especially in winter). Of course, the presence of the beekeeper is inevitable to make appropriate changes in the hive when needed. Towards the maximization of yields and the minimization of logistics costs, a group of healthy bee colonies can be promising, and by being monitored remotely, can eliminate any potential risks.
Moderately significant potential risks are related to bad feeding, bad flight conditions, and low inside temperatures. Bad feeding and bad flight conditions can be monitored mainly by beehive scale variance in parallel with weather conditions and smart weather sensor data. Low/bad inside hive temperatures can be monitored by inside temperature sensors and by adapting the use of insulated beehives or hive tops. Furthermore, the inside relative humidity should be monitored to avoid the risk of potential diseases that grow in high relative humidity environments.
Less significant risks are regarding wild animals, door-activity, bee-eaters, and thieves. These can be faced and monitored remotely by using surveillance systems, intimidating fences, alarms, GPS trackers, etc., in addition to the beehive scale. The door activity detector could send an alarm in case of a leaving swarm, but there is more scientific research to be done to optimize that kind of detection and not create an alarm in case of “play flights” (those short flights taken in front of the hive to acquaint young foraging bees with their immediate surroundings).
In order to assess the advantages of a remote monitoring system, it should be combined with feedback on its usage from the beekeepers. For example, a more experienced beekeeper would take the information related to the bee apiary based on fewer measures, compared with a less experienced beekeeper. Of course, the experience of a beekeeper is subjective because it is based on local conditions that differentiate from one place to another. To this point, the feedback from the beekeepers is crucial to optimize the weak points of the system and create new solutions on potential support and technological solutions they may need. The beekeepers receive feedback from the system on the most high-importance risks they might face.
Overall, this study attempted to fill the gap and highlight the smart apicultural tools in beekeepers’ hands towards not only the maximization of yields and profits but, more substantially, detecting the potential risks and crises throughout the apicultural processes to evaluate them based on their impact and to suggest optimal management. It is true that in nomadic apiculture a substantial share of the annual cost relates to logistics costs. Providers to the scientific and technology worlds should offer smart, remotely monitored solutions to manage apiaries and minimize this cost. As for future steps, the authors will focus on the optimization of the door activity detector system to record the amount and type of incoming pollen in order to emphasize the optimal colony health based on bee feeding with high-quality natural pollen.

Author Contributions

Conceptualization, E.R. and V.K.; methodology, E.R.; software, V.K.; validation, E.R. and V.K.; formal analysis, E.R.; investigation, E.R.; resources, V.K.; data curation, V.K.; writing—original draft preparation, E.R.; writing—review and editing, E.R. and V.K.; visualization, E.R. and V.K.; supervision, E.R.; project administration, E.R.; funding acquisition, E.R. All authors have read and agreed to the published version of the manuscript.

Funding

This research received no external funding.

Institutional Review Board Statement

Not applicable.

Informed Consent Statement

Not applicable.

Data Availability Statement

Data is unavailable due to privacy restrictions.

Conflicts of Interest

The authors declare no conflicts of interest.

References

  1. Goap, A.; Sharma, D.; Shukla, A.K.; Krishna, C.R. An IoT based smart irrigation management system using Machine learning and open source technologies. Comput. Electron. Agric. 2018, 155, 41–49. [Google Scholar] [CrossRef]
  2. Fountas, S.; Mylonas, N.; Malounas, I.; Rodias, E.; Santos, C.H.; Pekkeriet, E. Agricultural robotics for field operations. Sensors 2020, 9, 2672. [Google Scholar] [CrossRef] [PubMed]
  3. Bohnenkamp, D.; Behmann, J.; Mahlein, A.K. In-field detection of Yellow Rust in Wheat on the Ground Canopy and UAV Scale. Remote Sens. 2019, 21, 2495. [Google Scholar] [CrossRef]
  4. FAO. FAO Statistics. Available online: https://www.fao.org/faostat/en/#data/QC (accessed on 14 June 2024).
  5. Guruprasad, S.M.; Leiding, B. BeeOpen—An Open Data Sharing Ecosystem for Apiculture. Agriculture 2024, 14, 470. [Google Scholar] [CrossRef]
  6. Cota, D.; Martins, J.; Mamede, H.; Branco, F. BHiveSense: An integrated information system architecture for sustainable remote monitoring and management of apiaries based on IoT and microservices. J. Open Innov. Technol. Mark. Complex. 2023, 9, 3. [Google Scholar] [CrossRef]
  7. Kviesis, A.; Komasilovs, V.; Ozols, N.; Zacepins, A. Bee colony remote monitoring based on IoT using ESP-NOW protocol. PeerJ Comput. Sci. 2023, 9, e1363. [Google Scholar] [CrossRef] [PubMed]
  8. FAO. Good Beekeeping Practices for Sustainable Apiculture; Food and Agriculture Organization, Global: Rome, Italy, 2021. [Google Scholar]
  9. Pignagnoli, A.; Pignedoli, S.; Carpana, E.; Costa, C.; Prà, A.D. Carbon footprint of honey in different beekeeping systems. Sustainability 2021, 13, 11063. [Google Scholar] [CrossRef]
  10. Kulyukin, V.; Mukherjee, S. On video analysis of omnidirectional bee traffic: Counting bee motions with motion detection and image classification. Appl. Sci. 2019, 9, 3743. [Google Scholar] [CrossRef]
  11. Catania, P.; Vallone, M. Application of a precision apiculture system to monitor honey daily production. Sensors 2020, 20, 2012. [Google Scholar] [CrossRef]
  12. Aven, T. Risk assessment and risk management: Review of recent advances on their foundation. Eur. J. Oper. Res. 2016, 253, 1–13. [Google Scholar] [CrossRef]
  13. Karadas, K.; Birinci, A. Identification of risk factors affecting production of beekeeping farms and development of risk management strategies: A new approach. Rev. Bras. Zootec. 2018, 47, e20170252. [Google Scholar] [CrossRef]
  14. Kady, C.; Chedid, A.M.; Kortbawi, I.; Yaacoub, C.; Akl, A.; Daclin, N.; Trousset, F.; Pfister, F.; Zacharewicz, G. IoT-Driven Workflows for Risk Management and Control of Beehives. Diversity 2021, 13, 296. [Google Scholar] [CrossRef]
  15. Zgank, A. Bee swarm activity acoustic classification for an iot-based farm service. Sensors 2020, 20, 21. [Google Scholar] [CrossRef] [PubMed]
  16. Henry, E.; Adamchuk, V.; Stanhope, T.; Buddle, C.; Rindlaub, N. Precision apiculture: Development of a wireless sensor network for honeybee hives. Comput. Electron. Agric. 2019, 156, 138–144. [Google Scholar] [CrossRef]
  17. Bratek, P.; Dziurdzia, P. Energy-efficient wireless weight sensor for remote beehive monitoring. Sensors 2021, 21, 6032. [Google Scholar] [CrossRef] [PubMed]
  18. Gil-Lebrero, S.; Quiles-Latorre, F.J.; Ortiz-López, M.; Sánchez-Ruiz, V.; Gámiz-López, V.; Luna-Rodríguez, J.J. Honey bee colonies remote monitoring system. Sensors 2017, 17, 55. [Google Scholar] [CrossRef] [PubMed]
  19. Goulson, D.; Nicholls, E.; Botías, C.; Rotheray, E.L. Bee declines driven by combined Stress from parasites, pesticides, and lack of flowers. Science 2015, 347, 1255957. [Google Scholar] [CrossRef] [PubMed]
  20. Neumann, P.; Carreck, N.L. Honey bee colony losses. J. Apic. Res. 2010, 49, 1–6. [Google Scholar] [CrossRef]
  21. Döke, M.A.; McGrady, C.M.; Otieno, M.; Grozinger, C.M.; Frazier, M. Colony Size, Rather Than Geographic Origin of Stocks, Predicts Overwintering Success in Honey Bees (Hymenoptera: Apidae) in the Northeastern United States. J. Econ. Entomol. 2019, 112, 525–533. [Google Scholar] [CrossRef]
  22. Tawfik, A.I.; Ahmed, Z.H.; Abdel-Rahman, M.F.; Moustafa, A.M. Influence of winter feeding on colony development and the antioxidant system of the honey bee, Apis mellifera. J. Apic. Res. 2020, 59, 752–763. [Google Scholar] [CrossRef]
  23. Quinlan, G.; Döke, M.A.; Ortiz-Alvarado, Y.; Rodriguez-Gomez, N.; Koru, Y.B.; Underwood, R. Carbohydrate nutrition associated with health of overwintering honey bees. J. Insect Sci. 2023, 23, 16. [Google Scholar] [CrossRef] [PubMed]
  24. Rydhmer, K.; Prangsma, J.; Brydegaard, M.; Smith, H.G.; Kirkeby, C.; Kappel Schmidt, I.; Boelt, B. Scheimpflug lidar range profiling of bee activity patterns and spatial distributions. Anim. Biotelemetry 2022, 10, 14. [Google Scholar] [CrossRef]
  25. Jack, C.J.; Ellis, J.D. Integrated Pest Management Control of Varroa destructor (Acari: Varroidae), the Most Damaging Pest of (Apis mellifera L. (Hymenoptera: Apidae)) Colonies. J. Insect Sci. 2021, 21, 6. [Google Scholar] [CrossRef] [PubMed]
  26. Shegaw, T.; Arke, A.; Belay, N.; Giorgis, D.H. Diagnostic survey on varroa mite (Varroa distractor) prevalence in South-Western Ethiopia. Cogent Food Agric. 2022, 8, 2143610. [Google Scholar] [CrossRef]
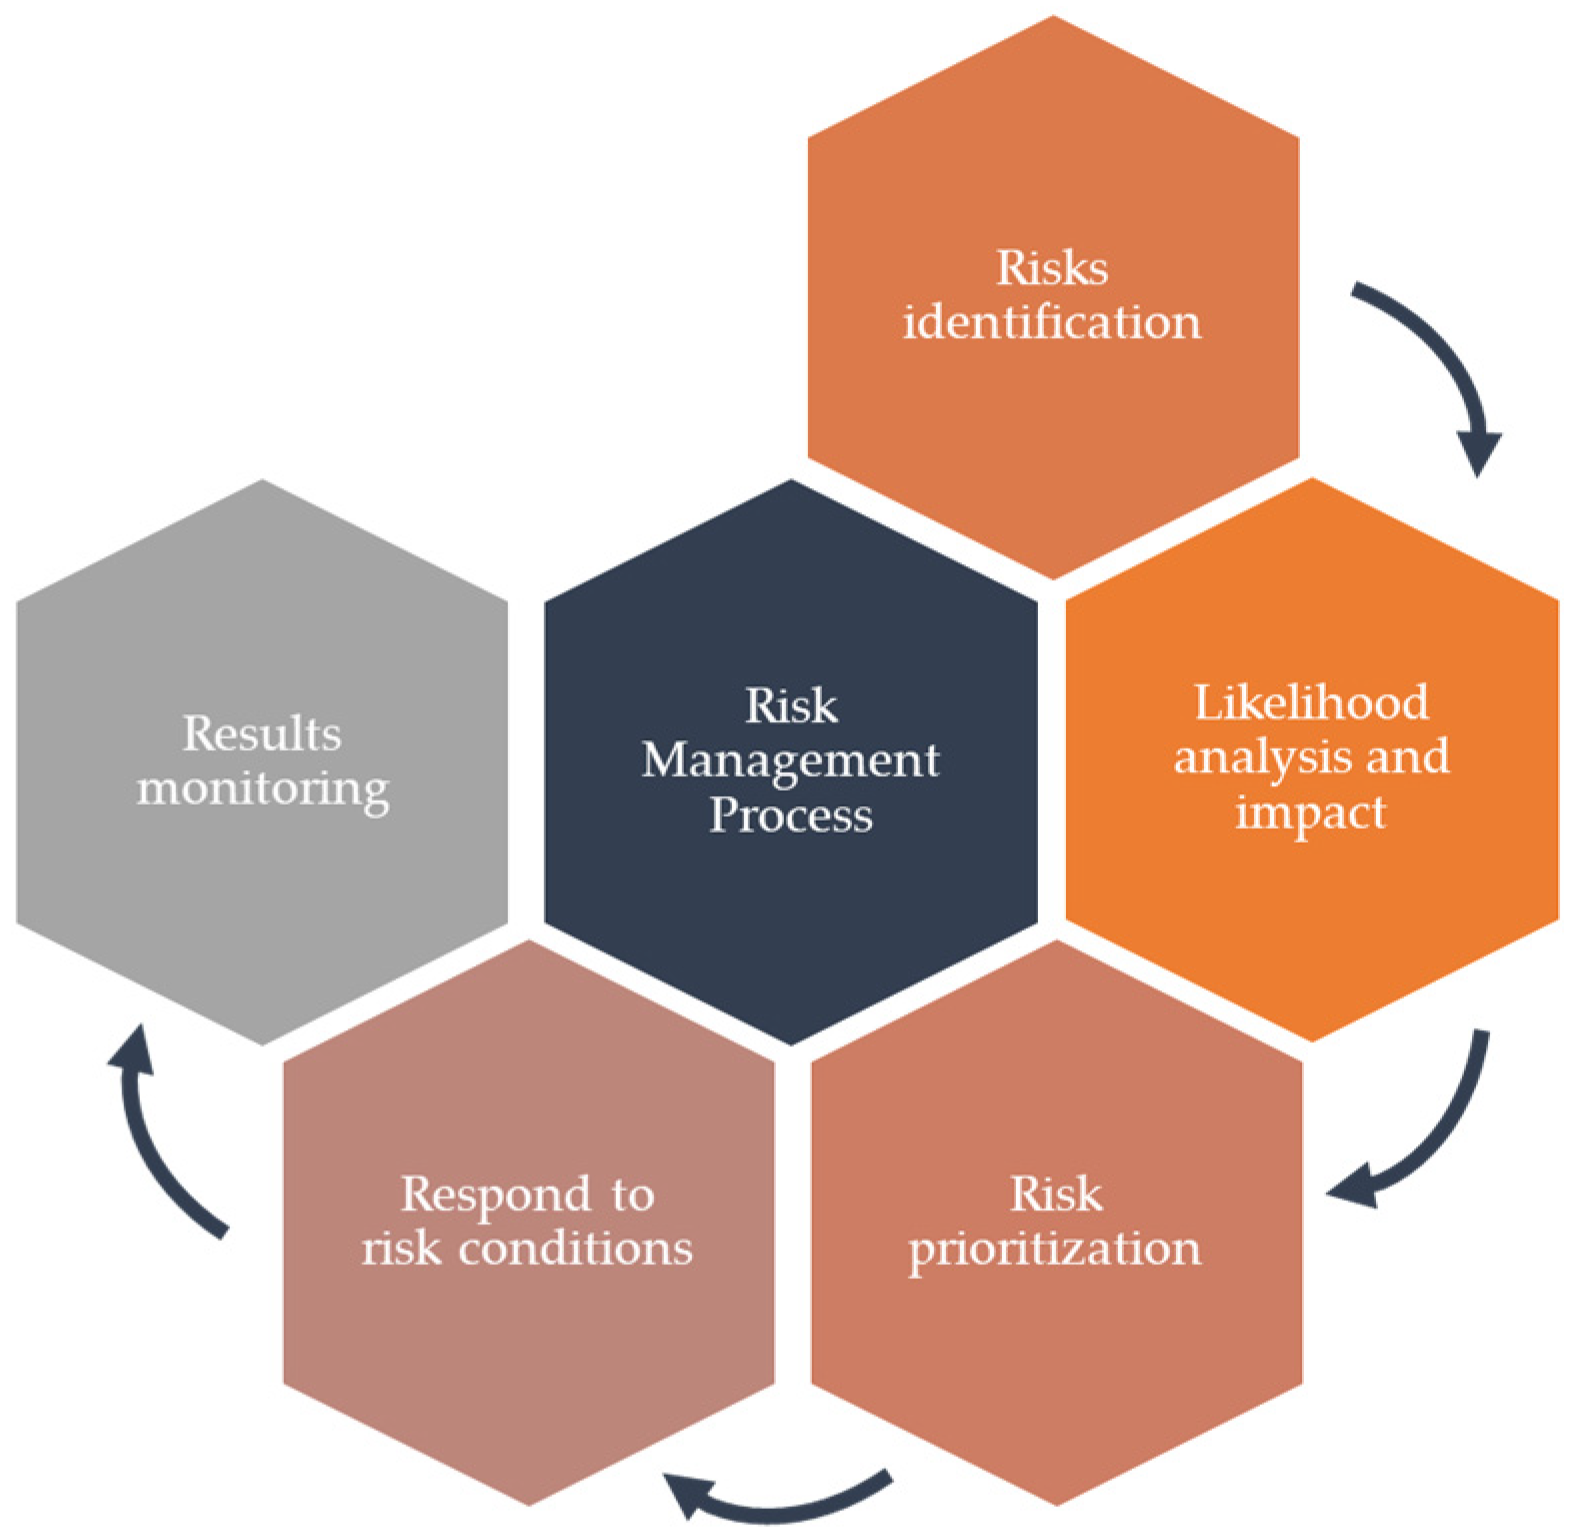
Figure 1. The five steps in risk management processing.
Agriengineering 06 00133 g001
Figure 2. The overall architecture of the control algorithm.
Agriengineering 06 00133 g002
Figure 3. The beehives’ journeys per blooming period for each beekeeper (BK).
Agriengineering 06 00133 g003
Figure 4. Bee apiary and bee farm locations.
Agriengineering 06 00133 g004
Figure 6. Monthly variation of inside and outside temperature during winter for BK 3.
Agriengineering 06 00133 g006
Figure 7. Monthly feeding consumption during winter.
Agriengineering 06 00133 g007
Figure 8. Lidar beehive door activity sensor.
Agriengineering 06 00133 g008
Figure 9. Indicative results of BFCI for various bee apiaries [(a) good, (b) excellent, and (c) very bad].
Agriengineering 06 00133 g009
Table 1. Input and output dataset.
Type of DataBK1 Example
InputBeehive weight (kg)44.70
Ambient temperature (°C)26.0
Ambient relative humidity (%)83
Inside hive temperature (°C)33
Wind speed (km/h)25.4
Wind directionNW
Daily beehive weight change (kg)+0.40
Direct beehive weight change 1 (kg)+0.25
Battery (%)83
GSM Signal17/31
WeatherMostly sunny
Location (incl. Google Maps link)Lat.: 38.270550 N |
Lon.: 22.938683 E
OutputStatus 2Periodical 2
24 h beehive varianceSee Figure 5
Polygon BFCI chart9
Cumulative beehive weight change (kg) 35.25
Door activity monitoringN/A
1 Difference with the previous measurement; 2 Periodical or weight disorder; 3 Sum of the foraged honey weight.
Table 2. BFCI classes and ranges.
Flight Conditions ClassRange
Excellent0–10
Good11–15
Moderate16–20
Bad21–25
Very bad>26
Table 3. Allocation of risks in risk categories and their impact.
Risk CategoriesRisksRisk Impact Rating
SecurityThieves3
Wild animals5
Bee-eater4
WeatherUnstable/bad weather conditions8
Bad flight conditions6
ProductionDoor activity4
Colony health7
Varroa mite8
Viruses7
OverwinteringBad feeding6
Low inside temperatures6
Table 4. Risks prioritization and treatment.
RisksRisk Impact RatingSmart Solutions
Thieves3Surveillance cameras
Alarm system
GPS trackers
Beehive scale
Bee-eater4Alarm system
Intimidating sounds
Door activity4Door activity detector
Surveillance cameras
Beehive scale
Wild animals5Surveillance cameras
Alarm system
Intimidating sounds
Electric fence
Bad flight conditions6Smart weather forecast and meteorological sensors
Beehive scale
Low inside temperatures6Modern hives
Insulation solutions
Inside temperature monitoring
Bad feeding6Beehive scale
Colony health7Beehive scale
Inside hive temperature
Door activity detector
Viruses7Beehive scale
Varroa mite8Beehive portable varroa tester
Beehive scale
Unstable/bad weather8Weather forecasting
Beehive scale
Disclaimer/Publisher’s Note: The statements, opinions and data contained in all publications are solely those of the individual author(s) and contributor(s) and not of MDPI and/or the editor(s). MDPI and/or the editor(s) disclaim responsibility for any injury to people or property resulting from any ideas, methods, instructions or products referred to in the content.