Abstract
This study evaluates a solar PV-powered evaporative cooling system for vegetable cooling. The system features dual cooling chambers with two different biomass pads, operating at different temperatures. To assess its potential, the research examines the evolution of temperature and humidity of the cooling chamber, evaporative effectiveness, cooling capacity, coefficient of performance (COP), energy metrics, greenhouse gas emissions, and overall cost. The results show that the system achieved a temperature depression range of 0.22 to 5.2 °C and 0.57 to 10.94 °C for wood shavings and polyurethane foam, respectively, under no-load conditions, while the values were 0.79 to 4.7 °C and 1.22 to 9.88 °C, with average values of 3.09 and 7.0 °C, for the same materials under loaded conditions. Loaded conditions also yielded a cooling capacity of 5.7 to 33.93 W for wood shavings and 8.13 to 75.55 W for polyurethane foam. The cooling efficiency ranged from 19.9 to 96.42% for polyurethane foam and 3.62 to 60% for wood shavings. The system’s COP was higher than that of solar-powered mechanical chillers, ranging from 2.37 to 22.92. The energy production factor was 2.3 to 2.4, with a lifecycle conversion efficiency of 0.5 and an energy payback time of 1.1 and 2.2 years for using polyurethane foam and wood shavings, respectively. The net present value was positive, and the levelized cost of energy was low, at 36.7 to 38.3 NGN/kWh (0.043–0.045 USD/kWh), making it a viable alternative to grid-based energy systems in Nigeria. Additionally, the system offers significant CO2 mitigation potential, with estimated carbon credits of NGN 65,059 (USD 71.56) and NGN 98,576.49 (USD 108.43) over its lifetime.
1. Introduction
Cooling systems have been proven to reduce postharvest losses and improve the storage of fruits and vegetables [1]. Several methods, including mechanical refrigeration, controlled atmospheres, adiabatic cooling, and evaporative cooling, can extend the shelf life of perishable produce [2]. Nigeria’s tropical climate drives demand for cooling systems, as high temperatures necessitate cooling solutions. Furthermore, shifting consumer preferences for fresh produce in Sub-Saharan Africa have boosted the market potential of cooling systems in this region [3,4]. The literature shows that cold storage can increase agricultural profit margins by 40% through reduced postharvest losses [5]. As a result, the cooling system market has vast potential in densely populated developing countries like Nigeria. Table 1 highlights the potential for cold storage of various products in Nigeria, with an estimated cost-saving potential of NGN 111 billion.

Table 1.
Cold storage market potential for Nigeria [5].
In Nigeria, researchers and farmers have explored various temporary storage methods for freshly harvested fruits and vegetables in rural areas [6]. However, power shortages and unreliable supply have hindered the use of conventional refrigerators, leading to chilling injuries due to excessive temperature reduction. This has prompted the search for cost-effective techniques to achieve suitable ambient conditions for preserving or cooling fruits and vegetables at optimal temperatures without chilling injuries. Evaporative cooling systems have emerged as a viable solution for removing field heat and preserving moderate-temperature produce. Evaporative cooling occurs when moisture is added to air with a relative humidity below 100%. The potential for evaporative cooling increases as relative humidity decreases, with the effectiveness of cooling dependent on the difference between air dry-bulb and wet-bulb temperatures. This technique reduces temperatures by absorbing energy from the surrounding environment as water evaporates. Evaporative cooling systems utilize mists, sprays, or wetted pads to lower air temperature, increasing relative humidity while cooling the air. The typical evaporative pad cooling system consists of a pad (wetting) medium, water supply line, water recirculation pump, water distribution header, fan or blower, gutter, sump tank, and bleed-off line (in some designs) [6]. As air flows past the wet pad surfaces, moisture acquires heat, evaporates, and removes heat energy from the air. This results in exhaust air with a lower temperature and elevated moisture content. Water is continuously recirculated over and through the wetting medium capillaries during operation. Evaporative coolers have been developed and deployed for domestic, agricultural, and industrial applications in recent years, with various sizes and capacities available [6]. For example, Dai and Sumathy investigated a cross-flow direct evaporative cooler using wet honeycomb paper and found an optimal air channel length for performance improvement [7]. Bowman et al. [8] studied passive downdraft evaporative cooling (PDEC) to reduce energy consumption in hot, dry climates. Jaber and Ajib [9] designed indirect evaporative air conditioning to reduce energy consumption without negatively affecting thermal comfort, with the goal of lowering the imported oil bill on the national level and reducing the emission of harmful gases to the environment on the international level. Despite their increasing performance and high energy efficiency, these systems have high electrical energy consumption and cause peak electricity loads because they depend on energy from the grid. Thus, they are most of the time not suitable for rural areas due to low electricity penetration density and the need to power fans and pumps. Furthermore, the increasing cost of energy over the past few years has made the energy-saving concept one of the most important research areas in the energy industry. Moreover, energy consumption is directly related to the greenhouse gas effect and environmental pollution, which is responsible for increased global temperature or global warming. The aforementioned problems have increased the desire to adopt renewable energy systems in energy devices. In most countries, available evaporative coolers are those that depend on natural wind flow [10], which is not reliable. A typical example is the pot-in-pot design or zeer pot design [11]. These designs have been adopted in rural areas, especially for cooling and short-term preservation of vegetables and fruits. The performance of these coolers is limited by low air flow rates and the need to manually re-wet the pads, which increases operational drudgery. To mitigate this and constantly maintain a steady air flow rate and water recirculation at reduced energy consumption for increased performance, Schulz [12] invented a new solar evaporative cooler retrofit kit to decrease the amount of electrical power supplied and the cost of operating such a common evaporative cooler. Solar energy is one form of renewable energy that is well distributed and available globally. In recent years, solar energy has been adopted as a cost-effective energy solution. It is clean, renewable, and environmentally friendly. Solar systems have been envisaged from an energy perspective for a sun-powered world [13].
Therefore, solar energy can be harnessed to various degrees to power the energy world, especially in rural areas with no electricity. This has been applied in the literature to power evaporative cooling systems. For example, Olosunde et al. [14] developed a solar-powered evaporative cooling system for preserving tomatoes, mangoes, bananas, and carrots in rural areas of Nigeria. The aim was to overcome the irregular power supply prevalent in rural areas. The designed evaporative cooling system had a capacity of about 0.39 m3 and delivered an exhaust temperature range of 7.8 to 15.4 °C and a relative humidity range of 44 to 96.8%, capable of preserving the products for 14 to 28 days. Saleh et al. [15] evaluated solar evaporative coolers for storing citrus and tomatoes for rural farmers in Nigeria, using charcoal as the wetting medium. They obtained an average temperature depression of 7 °C and achieved a storage life of 14 days with a saturation efficiency of 41%. Mekonen et al. [16] presented a two-stage solar-powered active evaporative cooling system in Ethiopia using activated carbon as the cooling pad. The cooler provided a temperature drop of about 9 to 15 °C under various operating conditions, with a relative humidity of up to 88% and a COP of 52.2 at a cooling capacity of 3653 W. Mansuri et al. [17] developed a solar-powered evaporative cooling system for storing fresh fruits and vegetables in India, using wet wool, khas, and CELdek as cooling pads. Under various operating conditions, they achieved a maximum relative humidity increase of 59% and a temperature drop of 14.6 °C. However, CELdek outperformed other cooling pads, with a cooling efficiency of 78.67%. Despite the above studies, research on evaporative cooling is ongoing. Various local materials, including biomass materials, have been tested as cooling pads due to the high cost of exotic pads [18,19]. The above assertions informed the design of the present solar evaporative cooler for cooling fruits and vegetables. Furthermore, noticing that fruits and vegetables require different cooling rates, the current research attempted to develop a novel evaporative cooler with dual cooling chambers capable of cooling concurrently at different temperatures. This was conceived by using different types of cooling pads or wetting media with different moisture absorption capacities, affecting the exhaust temperature range as shown in several studies in the literature [20]. Research has shown that different wetting materials can produce different cooling efficiency [21]. However, apart from energy demand, another challenge in adopting this cooler in most rural areas is the lack of techno-economic feasibility data on solar evaporative coolers, as the initial investment cost might seem high for farmers. This study will present a trade-off between the evaporative cooling system to be adopted and the energy sources for different countries [22]. This kind of study is lacking in Nigeria. Additionally, the energy pay-back time of PV-powered systems is a major concern, as it is a good CO2 emission indicator [23]. Furthermore, although a solar evaporative cooler is renewable, the energy used in manufacturing most of the components represented in the embodied energy is not renewable, coming from electricity or fossil-based fuels. Thus, there is a need to study the impact of the embodied energy in the CO2 emission, which will assist in reducing CO2 emissions into the environment. Therefore, the present research aims to (1) develop and test a solar PV-powered evaporative cooling system with dual cooling chambers and biomass pads, (2) evaluate the system’s cooling performance, energy efficiency, and environmental impact, (3) assess the techno-economic feasibility of the system for smallholder farmers in tropical regions, and (4) compare the performance of different biomass pads (wood shavings and polyurethane foam) in the evaporative cooling system. However, the novelty of this research lies in developing a solar PV-powered evaporative cooling system with dual cooling chambers, utilizing biomass pads (wood shavings and polyurethane foam) as a sustainable and locally available solution and conducting comprehensive energy analysis and economic evaluation to assess its techno-economic feasibility and environmental impact in the tropical environment of Nigeria, where postharvest losses are significant and energy access is limited, making it an innovative solution for reducing postharvest losses and improving the cooling of fruits and vegetables while promoting sustainable energy and reducing environmental impact.
2. Materials and Methods
2.1. Sizing of Solar PV Module for Solar-Powered Evaporative Cooling
To determine the number of PV modules or size of the PV module and the battery capacity to power the evaporative cooling system, the daily energy requirement of the evaporative cooling system must be determined.
2.1.1. Power Requirement of the PV Module
Based on the design, the evaporative cooling system’s fan and water pump were rated at 25 W, but an allowance of three times more energy is needed to start the pump. Assuming the evaporative cooler will run for t hours in a day, the overall energy needed (in W per day) will be given as follows [22]:
where Pi is the rated power of the fan and pump, and t is the maximum daily sunshine hours (11.41 h, the maximum value from Table 2 for Nigeria). Also, making provision for an energy loss of up to 30% (0.3) for the system [24], the overall energy needed to run the pump and fans for the evaporative cooling presented in Equation (1), will be raised by 30% (i.e., 0.3 Ec + Ec) as follows [24]:
Therefore, the power requirement for the PV panel (W) needed is given by Opoku et al. [25] as follows:
where:
fman: manufacturer’s tolerance for solar panel = 0.90 [25]
ftemp: temperature correction factor for solar panel = 1.04
fdirt: derating factor for dirt on solar panel = 0.97
ηbat: efficiency of battery = 85%
ηreg: efficiency of regulator/charge controller = 85%
tav: average sunshine hours per day in south-eastern Nigeria, taken as 7 h [26].
Table 2.
Typical Nigerian weather by month [27].
Table 2.
Typical Nigerian weather by month [27].
| Month | Jan | Feb | Mar | Apr | May | Jun | Jul | Aug | Sep | Nov | Oct | Dec | Ave. |
|---|---|---|---|---|---|---|---|---|---|---|---|---|---|
| Recorded high, °C | 39.5 | 41.2 | 41.9 | 42.6 | 42.8 | 40.2 | 36.0 | 33.4 | 36.37 | 38.7 | 37.8 | 38.2 | 42.8 |
| Average high, °C | 35.6 | 36.9 | 37.4 | 37.2 | 35.4 | 32.9 | 30.4 | 29.4 | 30.61 | 32.8 | 34.6 | 34.6 | 34.0 |
| Daily average, °C | 29.3 | 30.9 | 32.1 | 32.4 | 31.3 | 29.2 | 27.2 | 26.3 | 27.23 | 28.8 | 29.8 | 29.0 | 29.5 |
| Average low, °C | 20.3 | 22.4 | 24.6 | 25.7 | 25.7 | 24.4 | 23.1 | 22.5 | 22.94 | 23.6 | 23.1 | 21.0 | 23.3 |
| Recorded low, °C | 13.8 | 16.6 | 20.7 | 23.0 | 22.5 | 21.7 | 20.4 | 19.9 | 20.48 | 21.3 | 20.1 | 16.1 | 13.8 |
| Average precipitation mm | 16.9 | 39.2 | 68.0 | 95.2 | 151.1 | 190.8 | 277.5 | 31.9 | 285.5 | 17.6 | 61.2 | 15.0 | 141.3 |
| Average precipitation days (≥1.0 mm) | 3.2 | 6.7 | 10.9 | 13.3 | 17.7 | 19.9 | 24.7 | 25.3 | 23.67 | 18.0 | 9.1 | 3.3 | 14.6 |
| Average relative humidity (%) | 36.2 | 41.6 | 46.82 | 53.6 | 63.6 | 71.1 | 77.7 | 81.6 | 79.5 | 69.3 | 52.8 | 39.4 | 59.4 |
| Mean monthly sunshine hours | 11.4 | 11.3 | 11.0 | 11.1 | 11.0 | 10.4 | 9.5 | 9.0 | 9.6 | 10.3 | 10.5 | 10.9 | 10.5 |
Therefore, the total number of panels required is given as follows [24]:
where R is the rated power (W) of a single solar panel.
2.1.2. Battery Capacity
The battery capacity (BC) for energy storage is calculated considering 15% loss. Thus, the battery capacity (Amp–h) is given as follows [25]:
where:
V is the nominal battery voltage (taking as 12 V)
df is the temperature correction factor (1.01).
2.1.3. Charge Controller Design
The controller rating is based on the PV specifications. It is calculated as follows [24]:
where I is the short circuit current of the 250 W PV panel, taken as 2.4 A. The specifications of the solar module are presented in Table 3, while the cost is presented in Table 4.
Table 3.
Calculated solar panel specifications for cooling systems.
Table 4.
Capital cost of the solar evaporative cooler.
2.2. Description of the Cooler
The schematic representative design of the solar evaporative cooling system (EVC) is shown in Figure 1. The solar evaporative cooling system (EVC) shown in Figure 1 consists of a submersible water pump (6 V DC, 5 W, Decdeal, China), two water tanks (40 × 40 cm, polycarbonate glass), two cooling pads or wetting media (polyurethane foam and wood shavings), a water distribution line, four axial fans (8 × 8 cm, 12 V, 0.3 A DC, ADDA), a solar panel (250 W, 1.5 × 0.67 × 0.035 m), and a solar control charger, all housed in a rectangular-shaped hood (0.42 × 0.42 × 0.50 cm) with a particle board exterior and aluminum sheet lining to prevent heat infiltration and rust, as seen in the fabricated cooling system pictured in Figure 1.
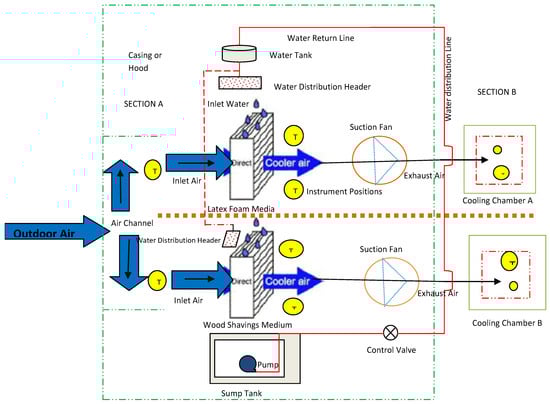
Figure 1.
Architectural representation of the evaporative cooling system.
The hood (casing) is divided into two sections: Section A is at the back while Section B is at the front. Section A contains the water pump, two axial fans, cooling pads, water distribution header, wetting media, and two water reservoir tanks. The water pump recirculates water from the bottom tank to the top tank, which is connected to the water distribution line that supplies water to the wetting media. The water from the top tank is distributed by gravity to the pads through the water distribution header. The two wetting media, polyurethane foam and wood shavings, are separately placed in compartments located on each side of the hood, as shown in Figure 2. Each compartment is designed to hold one type of wetting medium, allowing for simultaneous testing of both materials. The two axial fans are located between the cooling chamber and the cooling pads, sucking cooled air through the wetting medium into the storage chamber. The operating air flow rate is approximately 3 m/s, which is effective for this small evaporative cooling system. Behind the cooling pad holder is an air channel that distributes inlet air to both pads, covered with a galvanized net at the back of the hood. The fan and pump are powered by a solar photovoltaic (PV) panel, which collects solar energy and converts it to electrical energy. A solar charge controller is used to control the power going from the solar panels to the accessories. The balance of the system (BOS) diagram of the PV system connection is presented in Figure 3.
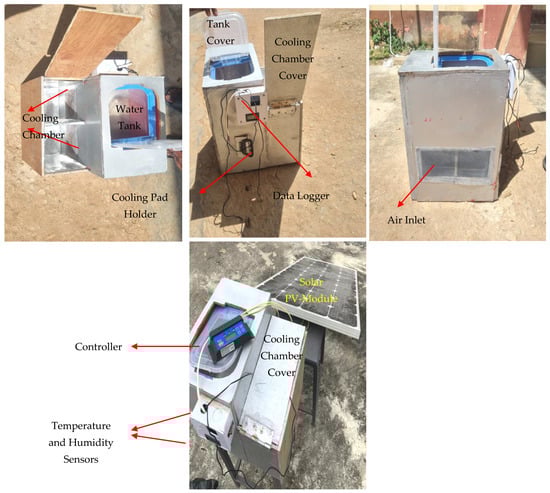
Figure 2.
Developed solar PV-powered evaporative cooler.
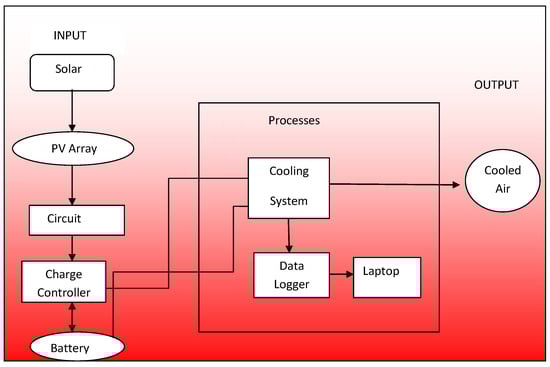
Figure 3.
The balance of the system diagram of the solar PV evaporative cooling system.
Section B, which is the cooling chamber, is divided into two storage sections: Cooling Chamber A and Cooling Chamber B, which operate simultaneously. Cooling Chamber A uses polyurethane foam as the wetting material, while Cooling Chamber B uses wood shavings. The two storage chambers are designed to cool fruits and vegetables with different temperature needs simultaneously.
2.3. Cooling Efficiency
The effectiveness of the pad is based on the saturation efficiency. The saturation efficiency (η) of the cooling pad used was calculated using the formula by Harris [28] as:
where:
- Ta = dry-bulb inlet temperature, °C
- Tc = dry-bulb exhaust temperature, °C
- Tw = wet-bulb inlet temperature, °C given as follows.
The wet-bulb temperature is derived with Equation (8) as follows [18,19]:
where Tdb is the dry-bulb temperature (°C), and Rh is the relative humidity (%).
2.4. Formulation of Energy Metrics
The flow chart of the energy analysis is shown in Figure 4. The figure depicts the energy flow of the solar evaporative cooling system, showcasing its potential for sustainable and energy-efficient cooling solutions. The input solar energy is the energy from the sun that drives the cooling process, while the embodied energy represents the energy invested in the system’s production and materials. Meanwhile, Energy Output represents the cooler cooling energy potential, illustrating the ultimate goal of the evaporative cooler to provide cooling energy.
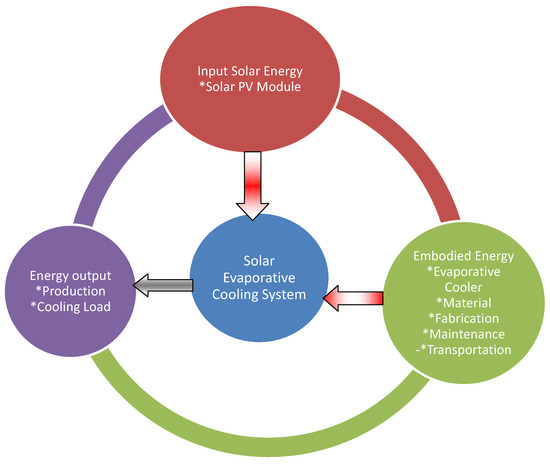
Figure 4.
Flow chart of energy analysis for the solar evaporative cooling system.
2.4.1. Energy Payback Time (EPBT)
This is the time needed to recover energy input during the production of components. It is given as follows [29,30]:
Eemb is the embodied energy (kWh) of the components presented in Table 5.
Table 5.
Estimated embodied energy for the solar evaporative cooler components [31,32,33].
The energy output flow (Eout) of the system was deduced considering both electrical and thermal energy flows. In this case, these two energy flows include the solar gain expanded in the form of solar power output from the PV module and the energy output of the cold air utilized in cooling the product. Assuming that the solar PV-module-powered evaporative cooler runs for 20 h per day, the energy output per year (Eout) of the entire system (Wh) is the sum of the energy output by the solar PV module for powering the system per year (Wh/year) and the thermal energy extracted from the air and utilized in cooling load removal by the evaporative cooler per year (Wh/year), which was calculated as follows:
where is the airflow rate (kg/s), Cpair is the specific heat capacity of air (J/kg·K), ΔT is the average change in temperature (°K), P is the rated power of the PV module (W), and tyear is the total annual time of operation per year (h/year).
2.4.2. Energy Production Factor
The energy production factor is given in Equation (11) [34] as follows:
where n is the lifetime of the cooling system (10 years).
2.4.3. Coefficient of Performance (COP)
The coefficient of performance (COP) is determined as the ratio of thermal cooling obtained to energy input [35]:
2.4.4. Life Cycle Conversion Efficiency (LCCE)
This is the ratio of the overall energy output by the system with respect to the energy input over the lifetime of operation of the evaporative cooler, adapted from Rajput et al. [34] as follows:
where:
Ein is the annual energy input (kWh/year).
2.5. Greenhouse Gas Emissions
The benefit of using an evaporative cooler is its carbon emission mitigation potential. The environmental impact of using the cooler is assessed based on diesel- and electricity-powered systems. The greenhouse gas emission mitigation potential of the cooling system is determined as follows. For a diesel-powered cooling system, the energy consumed in running the fans and pump in kWh is determined as follows by Ndukwu et al. [33]:
where E is the overall energy consumed in cooling (kWh), ηd is the power efficiency of a diesel generator taken as 35%, kd is the heating value of diesel, taken as 10.08 kWh/L, and vd is the amount of diesel (L) consumed to produce the energy used to power the system.
Combining Equations (1) and (14), the volume of the diesel (vd) is deduced. Thus, the mass of CO2 mitigated per year is calculated as follows [32]:
kf is a constant given by Ndukwu et al. [35] as 2.63 kg/L.
For an electricity-powered cooling system, (Case 1) the CO2 is determined as follows [36]:
where EFCO2 is the country emission factor, which is 0.4392 kg of CO2/kWh for Nigeria.
One of the benefits of evaporative cooling is the atmospheric mitigation of carbon dioxide. Thus, to encourage the adoption of green energy in the country’s energy mix, the carbon emission can be quantified monetarily as earned carbon credit, as in Equation (17) [37]:
where $CO2 is the price of CO2 taken as 14.5 USD per ton [36], and is the mass of CO2 emissions (tons) per year [37].
2.6. Life Cycle Cost Assessment
This involves the present and future cost of all the components of the evaporative cooling system, the net present values, the internal rate of return, and payback time. A typical cost analysis of a typical tomato farm in Nigeria was deployed for the cost inventory, as presented in Table 6.
Table 6.
Typical farm production data for tomatoes in Nigeria.
2.6.1. Annualized Uniform Cost (AUC)
We first determine the annualized uniform cost (AC) of running each cooling and drying system as follows [38,39]:
where Crf is the fuel running cost of fan and pumps, which is zero for solar systems [39], and Cre is the chargeable energy cost for running the electrical components, given as [38]:
where t is the equipment running time, p is the total input power, and Ce is the chargeable cost of electricity in a year. This value is taken as zero since the system is off-grid [38]. Cc is the uniform cost of equipment, given as follows [38,39]:
The capital cost (Ccc) is determined as follows [34]:
P is the breakdown of all the various equipment component costs as presented in Table 4 for the cooling system.
is the maintenance cost given in present value as follows [34]:
where:
i is the interest rate, n is the number of years, and mce is the annual maintenance and repair cost (2.5% of initial equipment cost).
The battery is the major component requiring frequent replacement for the system. Assuming a year’s replacement time of the entire duration of 10 years for the system lifetime, the net replacement cost (Prc) is determined as follows [34]:
where R is the replacement cost.
The net junk value at the end of the service life of the evaporative cooler is given as follows [34]:
2.6.2. Net Present Value (NPV)
The net present value is determined as follows [40]:
where:
Xt is the net cash flow, d is the discount rate per year taken as 2.7%, t is the total period count, and n is the number of years.
2.6.3. Internal Rate of Return (IRR)
The internal rate of return value is determined as follows [40]:
The payback period (PBP) is determined as follows [41]:
where ASav is the average annual saving on energy costs. A unit cost of energy in Nigeria is projected at 88 NGN/kWh in 2023 without subsidy.
2.6.4. Levelized Cost of Energy
To understand the benefit of solar-powered evaporative cooling, it is useful to consider the total energy output produced by the system including that of the PV module in terms of net present value of cost produced per unit of energy utilized in its lifetime. This is termed levelized cost of energy (LCOE), given as follows [24]:
where:
P is the capital cost, if is the inflation rate, d is the discount rate (2% of NPV), and n is the number of years.
Eo is power produced in the first year, and is the degradation rate of the solar PV module (0.05%).
2.7. Experimental Procedure
2.7.1. Pad Preparation
The evaporative cooling pad creates the environment required for exhaust air humidification, which provides the heat transfer dynamics. This lowers the exhaust air temperature and improves its humidity, which is required for vegetable cooling and preservation. Thus, the used biomass cooling pad materials, made up of polyurethane foam and wood shavings, were sourced from polyurethane waste from local furniture makers and timber processors. The selection of wood shavings and polyurethane foam as cooling pads in evaporative cooling was influenced by their favorable thermal properties. Wood shavings offer high specific heat capacity, porosity, and moderate thermal conductivity, allowing for efficient heat transfer and water absorption, as well as allowing air to pass through, which is one of the requirements for cooling pads. On the other hand, polyurethane foam boasts high porosity and water absorption, enabling effective heat dissipation through evaporation. Therefore, the thermo-physical properties of these materials leverage their synergistic effects, creating a cooling pad that excels at absorbing water and dissipating heat through moisture evaporation as the air flows through them. The cooling pads were processed by manually reducing their sizes to fit into the pad holder’s compartments, after which they were loaded into the cooling pad holder (Figure 5) at a thickness of 0.02 m. The pad holder with the cooling pad is slotted into position from the two sides of the first compartment of the housing, as described earlier.
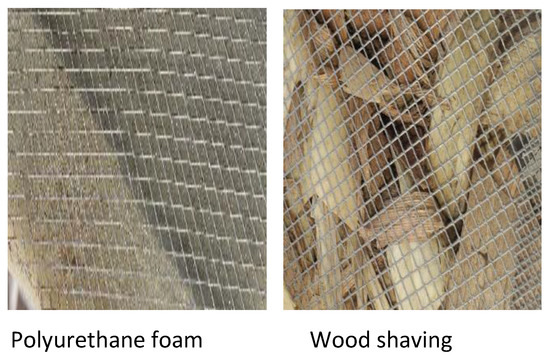
Figure 5.
Pad materials inside the galvanized iron net pad holder.
2.7.2. Operation Loop and Field Measurements
The evaporative cooler was placed under an open field shaded beside a papaya tree. This action was performed to reduce the direct action of solar radiation and expose the evaporative cooling system’s inlet air and water tank to a cool ambience. The water tank (20 L) was initially left open to allow the prevailing wind to passively cool the water for about 5 min before opening the water header linking the tank with the spray header to allow water to be delivered to the pads from the edges of the pads. From the edges, the water drains down the cooling pads by both gravity and capillary action until the pad is saturated, as the water pump recirculates the water continuously. Next, the fans were switched on to deliver the inlet air towards the cooling pads. The air absorbs moisture and transfers some of its heat to the water and pad material before exiting into the cooling chamber at a lower temperature and higher humidity. The temperature of the cooling chamber was allowed to stabilize for 1 h before adding 200 g of fluted pumpkin leaves into it. For each cooling batch, the evaporative cooler can also handle 2 kg of products like tomatoes, oranges, and other vegetables. The temperature and humidity sensors attached to the body of the EVC automatically record the cooling chamber temperature (±0.01 °C) and humidity (±0.01%) as well as the ambient conditions through the k-type thermocouple and project it to the LED screen. These data were collected at 1 h intervals for three days (20–23 October 2023 for no-load condition and 24–26 October 2023 for load condition) and used for analysis. Figure 6 shows the operational loop of the evaporative cooling system.
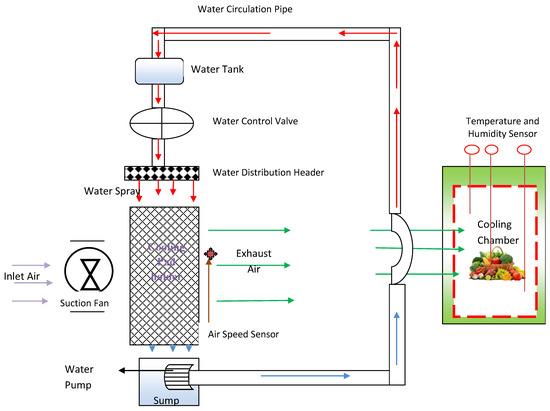
Figure 6.
Operational loop of the evaporative cooling system.
2.8. Experimental Uncertainty
The uncertainty (Ux) in measuring temperature, relative humidity, and cooling efficiency is calculated as [42]:
where w1, w2, and wn are the experimental uncertainties in the variables z1, z2, and zn. For temperature, relative humidity, and cooling efficiency, the calculated uncertainties for their measurements were ca ±0.124%, ±1.02%, and ±0.34%, respectively.
3. Results and Discussion
3.1. Influence of Cooling Pads on Transient Response of the EVC to Weather Conditions
This cooler was developed to remove field heat acquired by vegetables and fruits before harvest and lower their temperature before packaging or shipping. It was assumed that the cooler can cool about 243 kg of products per year in batches of 2 kg, holding up to 3 days before sales or shipping. It was also assumed that cooling starts immediately after harvest. However, the cooler was tested with wood shavings and polyurethane foam as wetting media simultaneously without products (no-load conditions) and with products (load conditions). The evolution of ambient and relative humidity for two different cooling scenarios with wood shavings and polyurethane foam as wetting media are shown in Figure 7a, Figure 7b, Figure 8a, and Figure 8b, respectively, for the experiment. The lower cooler temperature (Figure 7a and Figure 8a) and higher humidity (Figure 7b and Figure 8b) were achieved with medium-density polyurethane foam for both no-load and load conditions compared to wood shavings, respectively. This might be due to a combination of factors, including higher porosity and moisture distribution rate of polyurethane foam compared to wood shavings. Materials with higher porosity provide better water distribution, greater airflow rate, increased surface area due to higher porosity, and increased evaporation rate, thus providing higher latent heat exchange between moisture and inlet air. Evaporative cooling depends on the evaporation of moisture from the pads; therefore, materials that are more porous with higher moisture absorption rates will quickly provide a larger body of water that will enable more water to evaporate faster, resulting in greater heat transfer from the air to the moisture. Therefore, it can quickly take full advantage of the evaporative cooling process. It will also reduce the possibility of hotspots due to dry-out of the pad surface with better humidity control. Additionally, polyurethane foam has higher thermal conductivity than wood shavings, allowing a faster heat transfer rate and cooling of the inlet air. However, by this variable degree of cooling and humidification, the system presents two different temperature ranges that could be deployed for cooling or preserving different kinds of fruits and vegetables based on their temperature sensitivities. This depends on the knowledge of cooling load requirements for different fruits and vegetables. Wood shavings and polyurethane foam provided temperature depression ranges of 0.22 to 5.2 °C and 0.57 to 10.94 °C, respectively, of inlet dry-bulb temperature for the no-load condition, as shown in Figure 7a, with average values of 3.46 and 7.04 °C. The values were 0.79 to 4.7 °C and 1.22 to 9.88 °C, with average values of 3.09 and 7.0 °C for the same materials for loaded conditions, respectively, as shown in Figure 8a. These values of temperature drop for wood shavings are very low compared to those obtained by some researchers [14,15,16,17,43]; however, the value for polyurethane foam is within the range of values in the literature. For example, Olosunde et al. [14] obtained an exhaust temperature of 7.8 °C, while Saleh et al. [15] obtained an average temperature depression of 7 °C. Similarly, Mekonen et al. [16] presented a temperature drop of about 9 to 15 °C for a two-stage cooler. The average difference for temperature depression between wood shavings and polyurethane foam was significant (p < 0.05). However, wood shavings and polyurethane foam provided average humidity increases of 15.85 to 38.63% and 28.18 to 51.78%, respectively, of inlet air for the no-load condition over the trial period, as shown in Figure 7b, while the values were 29.39 to 35.7% and 47.22 to 53.5% for the same materials for loaded conditions, respectively, as shown in Figure 8b.
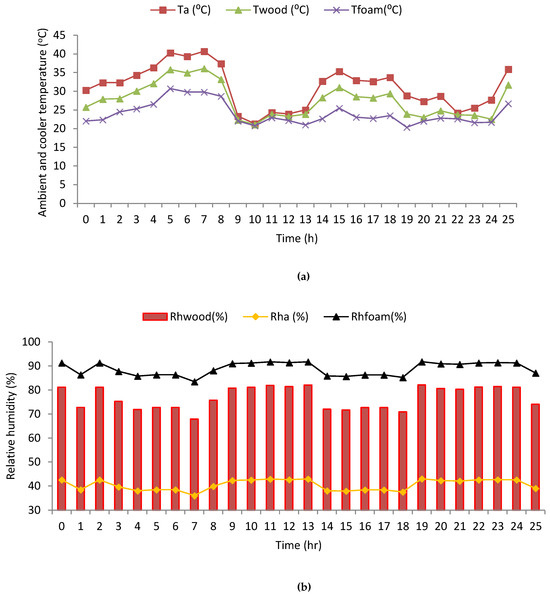
Figure 7.
(a) Ambient and cooler temperature under no load (20–23 October 2023) (b) Ambient and cooler relative humidity under no load (20–23 October 2023).
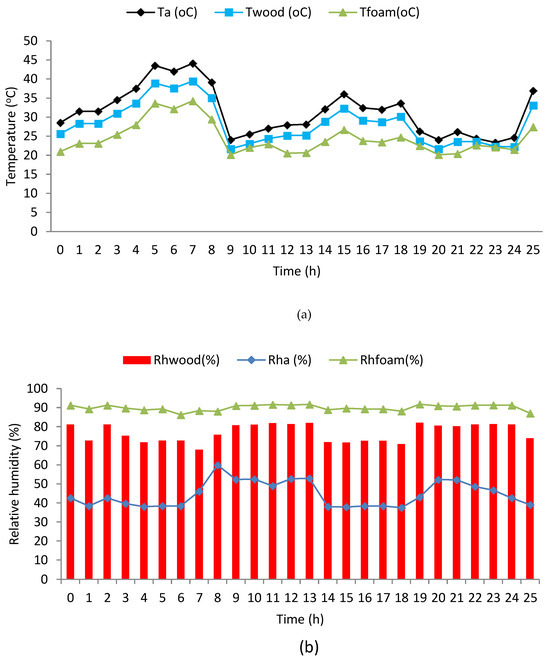
Figure 8.
(a) Average ambient and cooler temperature under load (24–26 October 2023) (b) Average ambient and cooler relative humidity under load (24–26 October 2023).
3.2. Performance Analysis of the EVC
The major purpose of this work was to lower the temperature of the product without using grid or diesel-powered systems, and thus the availability of solar energy provides an advantage. First, the solar PV module was sized based on the fan and water recirculation pump capacity to provide the desired cooling load to be removed. To supply the electric energy, a 250 W solar photovoltaic cell and a battery of 30 Ah were needed to run the cooler for 20 h per day. This energy was supplied by a single solar photovoltaic cell of 250 W capacity. Table 7 shows the energy consumption parameters of the solar-powered evaporative cooling system. Based on cooling demand, the evaporative cooler needed 711.75 kWh/year to produce the required cooling demand discussed above. However, this energy consumption produced different cooling capacities for the different cooling scenarios, as shown in Figure 9 and Figure 10, respectively, under no-load and loaded conditions. However, polyurethane foam produced higher cooling capacity than wood shavings in all cases due to its higher moisture absorption capacity compared to wood shavings, as stated earlier, which reflected in higher temperature reduction compared to wood shavings.
Table 7.
Cooling system parameters.
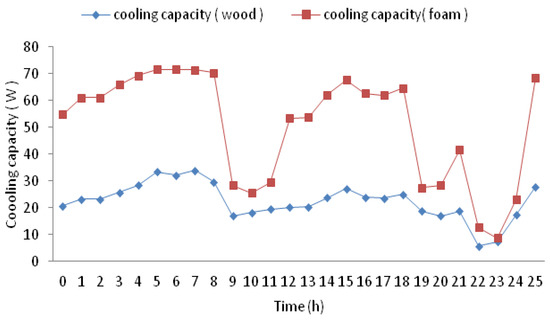
Figure 9.
Average cooling capacity under load (24–26 October 2023).
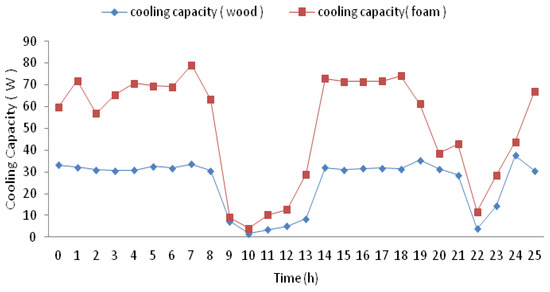
Figure 10.
Evolution of the cooling capacity under no load (20–23 October 2023).
Under load conditions, the cooling capacity ranged from 5.7 to 33.93 W for wood shavings, while it was 8.13 to 75.55 W for polyurethane foam. In contrast, these values ranged from 1.6 to 37.63 W and 4.1 to 79.18 W for wood shavings and polyurethane foam, respectively, under no-load conditions. This shows the greater cooling effect of polyurethane foam, which resulted in a cooling efficiency of 19.9 to 96.42% and 14.14 to 82.86% compared to 3.62 to 60% and 8.98 to 35.93% for wood shavings under no-load and load conditions, as shown in Figure 11 and Figure 12, respectively. These results suggest that polyurethane foam is a more effective material for cooling applications, with higher cooling capacity and efficiency compared to wood shavings. The performance of polyurethane foam is consistently better under both load and no-load conditions, making it a more reliable choice as a wetting medium for cooling applications.
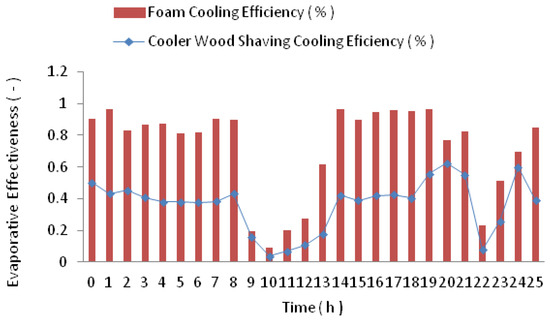
Figure 11.
Average cooling efficiency under no load (20–23 October 2023).
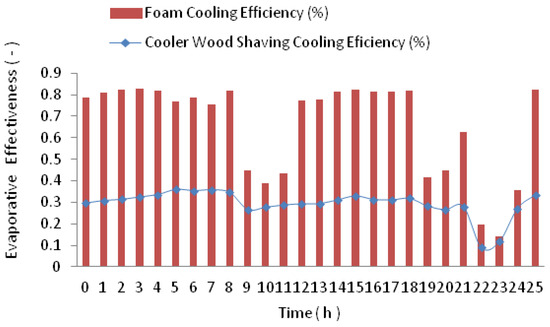
Figure 12.
Average cooling efficiency under load (24–26 October 2023).
The COP of the solar PV-powered evaporative cooler ranged from 2.37 to 22.92 for load conditions and 0.52 to 25.37 for no-load conditions for the two cooling pads, as shown in Figure 13 and Figure 14, respectively. However, polyurethane pads consistently showed a higher COP compared to wood shavings in all conditions. This value is higher than the COP of a solar PV-powered chiller, which was deduced as 0.6 to 0.72 at a temperature of 70 to 110 °C [35]. Grossman [43] also reported a COP of 0.7 to 1.7 for solar absorption refrigeration. These findings suggest that the solar PV-powered evaporative cooler using polyurethane pad has a high COP, indicating efficient cooling performance. The comparison with other solar-powered cooling systems highlights the potential of this technology. However, the variation in COP values across different studies may be due to differences in system design, operating conditions, and materials used. The higher ranges of COP values achieved in this research demonstrate the potential of solar-powered evaporative cooling systems for efficient cooling applications, particularly in situations where traditional vapor-compression systems may not be feasible. Further research and development can focus on optimizing system design and materials to achieve even higher COP values and improve the overall performance of these systems.
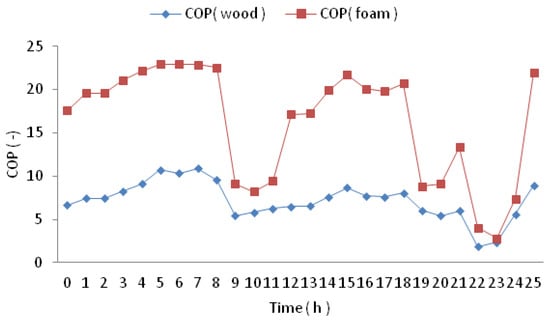
Figure 13.
Average COP under load (24–26 October 2023).
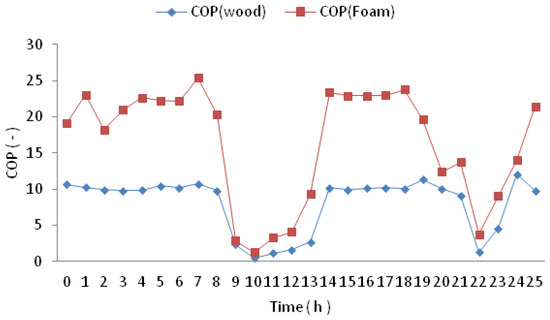
Figure 14.
COP under no load (20–23 October 2023).
3.3. Energy Metric Analysis
Table 8 shows the energy metrics for different cooling scenarios based on energy input and output for each case. The average electrical and thermal energy output and the embodied energy were used to calculate the energy payback time under different cooling scenarios. The average energy payback time was calculated as 1.13 to 2.18 years for all the cooling scenarios, with the polyurethane wetting pad having the lowest energy payback time. This showed that polyurethane utilized lower thermal energy compared to wood shavings to produce a higher amount of cooling, since the electrical energy output for all the cooling scenarios was assumed to be the same. Thus, they had a higher energy production factor of 2.4 compared to wood shavings, which was recorded as 2.3, as shown in Table 8. However, the life cycle energy conversion efficiency for a 15-year period for each cooling scenario was not significantly different (p < 0.05), as can be seen in Table 8, with an average value of 0.5. However, with a very low levelized cost of energy ranging from 36.72 to 38.26 NGN/kWh (0.043 to 0.045 USD/kWh), which is far below the value of grid-based subsidized energy system cost in Nigeria (67 NGN/kWh), a user who has invested in the solar PV evaporative cooler will have a better energy investment. It is worth mentioning that the levelized cost of energy (LCOE) metric has some limitations, including adopting a very simple approach that assumes fixed costs over time, ignoring the impact of environmental and social conditions that might affect lifespan and technology-specific limitations like neglecting improvements or degradation over time, and assuming fixed capacity factors. Additionally, LCOE does not account for location-specific differences in costs, resources, and policies and assumes a fixed cost of capital. The metric also has timeframe limitations, typically evaluating costs over a fixed period like 20 years, which may not capture long-term costs or benefits. Finally, the choice of discount rate can significantly impact LCOE results, and different rates may be more appropriate for different technologies or locations. However, despite these limitations, LCOE can be used as a starting point for cost evaluation and can then be complemented by other cost analyses for a more comprehensive cost analysis.
Table 8.
Energy payback time, LCOE, energy production factor, and life cycle conversion efficiency.
3.4. Greenhouse Gas Emissions
Globally, the major issue is cutting down greenhouse gas emissions as a result of non-renewable energy generation [45]. Thus, the benefit of the solar PV-powered cooler is its greenhouse gas mitigation potential. The result was presented over the lifetime of the small solar PV evaporative cooler, taking 15 years. The mass of CO2 mitigated was compared with diesel and grid-based electricity [46]. Equations (13) and (14) were used to calculate the mass of CO2 generated from diesel and grid-connected systems using Nigerian emission factors, respectively, while the earned carbon credit was calculated with Equation (15). Table 9 gives a breakdown of both the annual and lifetime CO2 mitigation potential of the system. These values were 5.25 tons for grid-connected electricity and 7.955 tons for diesel generators over the lifetime. In terms of energy input, this will translate to 0.492 kg mitigated per kWh for grid electricity and 0.75 kg per kWh for diesel generators if the solar PV evaporative cooler is used instead of grid-connected systems or a diesel generator. Considering the above results compared to the embodied energy of the solar PV module, the lifetime CO2 emission of the PV module [47,48] was calculated as 1.79 tons, which is considerably lower than that of diesel and grid-based electricity as presented in Table 9. Furthermore, this comparatively will also translate to earned carbon credits of NGN 65,059 (USD 71.56), NGN 98,576.49 (USD 108.43), and NGN 22,214.73 (USD 24.43) for grid electricity, diesel, and the solar PV module, respectively, across their lifetimes.
Table 9.
CO2 emission potentials for different energy scenarios.
3.5. Unit Cost Analysis
The analysis of cash flow and input assumptions is presented in Table 10. The cash flow analysis was conducted based on the production output cost of a typical farm in Nigeria presented in Table 6, assuming it adopted the evaporative cooling system to cool its product before sale. The payback period was deduced with Equation (25), relating to the annual cost of energy savings in Nigeria, if the cost of the cooler energy utilization is substituted with grid-based electricity cost with the project capital cost. The cost output generated includes the net present value, internal rate of return, and payback period for the small evaporative cooling system, as presented in Table 11. The annualized cost of the cooler is determined as NGN 251,919.2 (USD 277.11). The results showed a positive net present value and internal rate of return of 20.6% with a payback period of 2.4 years. This research involved a laboratory-sized evaporative cooling test bed, which was used for a small quantity of products. Thus, if the cooler is scaled up to cool a larger quantity of product, the internal rate of return will increase due to increased sales of a larger quantity of product. With investors recovering their initial investment in 2.4 years before financing, it is possible to lower the selling price of the products and still recover your investment.
Table 10.
Analysis of cash flow input assumptions for the year 2023, Nigerian case study.
Table 11.
Cost analysis results for cold storage.
4. Conclusions
The study on the techno-economic evaluation of a small twofold-chamber PV-powered evaporative cooling system for fruit and vegetable preservation was performed. The experimental evaporative cooler is a prototype that serves as a test bed, which can be scaled up to a larger scale. A comparative analysis of two cooling pads, including wood shavings and polyurethane foam, was presented. In terms of cooling efficiency, cooling capacity, COP, and energy payback time, the polyurethane foam presented better performance compared to wood shavings due to its higher moisture absorption capacity. Therefore, it is recommended as a better alternative cooling pad when exotic ones are not available. Moreover, the COP of the solar PV-powered evaporative cooler was higher than the COP of solar-powered mechanical chillers and ranged from 2.37 to 22.92 for load conditions and 0.52 to 25.37 for no-load conditions, thus showing lower energy consumption, higher efficiency, and lower operating cost. However, the cooling efficiency of 19.9 to 96.42% and 14.14 and 82.86% for polyurethane foam was achieved compared to 3.62 to 60% and 8.98 and 35.93% for wood shavings under no-load and load conditions. The average energy payback time was very short, ranging from 1.13 to 2.18 years for all the cooling scenarios, with the polyurethane wetting pad having the lowest energy payback time. The energy production factor of 2.4 for polyurethane foam compared to wood shavings, which was estimated at 2.3. However, the life cycle energy conversion efficiency for a 15-year period for each cooling scenario was not significantly different (p < 0.05). The net present value was positive, while the levelized cost of energy ranged from 36.72 to 38.26 NGN/kWh (0.043 to 0.045 USD/kWh), lower than the value obtained from the grid-based subsidized energy system cost in Nigeria (67 NGN/kWh). The avoidable CO2 emissions were estimated at 5.25 tons for grid-connected electricity, 7.955 tons for diesel generators, and 1.79 tons for solar modules over their lifetimes, which translate to earned carbon credits of NGN 65,059 (USD 71.56), NGN 98,576.49 (USD 108.43), and NGN 22,214.73 (USD 24.43) for grid electricity, diesel, and solar PV modules, respectively, over their lifetimes. The net present values were positive, with an IRR of 20.6% and a payback period of 2.4 years. In the future, the exergy sustainability analysis of the system will be carried out, and the heat and mass transfer simulation models presented.
Author Contributions
Conceptualization, M.C.N.; methodology, M.C.N. and F.A.; validation, M.C.N., I.E., G.U., E.O.S., P.E., G.A. and L.A.; data curation, M.C.N., P.O. and E.O.; resources, M.C.N., I.E., G.U., E.O.S., P.E., G.A., L.A. and L.O.; writing—original draft preparation, M.C.N., I.E., G.U. and F.A.; writing—review and editing, M.C.N., I.E. and F.A.; visualization, L.O. All authors have read and agreed to the published version of the manuscript.
Funding
This research received no external funding.
Data Availability Statement
Data will be made available on request.
Conflicts of Interest
The authors declare that they have no known competing financial interests or personal relationships that could have appeared to influence the work reported in this paper.
References
- Mogaji, T.S.; Olufemi, A.D.; Fapetu, O.P. Marketing performance and efficiency of evaporative preservation cooling system for fresh tomato marketing in Ondo State, Nigeria. Afr. J. Agric. Res. 2013, 8, 468–474. [Google Scholar] [CrossRef]
- Mogaji, T.S.; Fapetu, O.P. Development of an evaporative cooling system for the preservation of fresh vegetables. Afr. J. Food Sci. 2011, 5, 255–266. [Google Scholar]
- Sheahan, M.; Barrett, C.B. Food Loss and Waste in Sub Saharan Africa: A critical review. Food Policy 2017, 70, 1–12. [Google Scholar] [CrossRef] [PubMed]
- Boyette, M.D.; Wilson, L.G.; Estes, E.A. Postharvest Handling and Cooling of Fresh Fruits, Vegetables and Flowers for Small Farms; Leaflets 800-804; North Carolina Cooperative Extension: Alliance, NC, USA, 2010. [Google Scholar]
- Egu, N. PA-NPSP Productive Use Cold Storage Systems in Nigeria; IDIQ Contract No. 720-674-18-D-00003; Power Africa Expansion. 2022. Available online: https://pdf.usaid.gov/pdf_docs/PA00Z8X7.pdf?ref=activatorhq.com (accessed on 4 March 2024).
- Davies, P.A. A solar cooling system for greenhouse food production in hot climates. Sol. Energy 2005, 79, 661–668. [Google Scholar] [CrossRef]
- Dai, Y.J.; Sumathy, K. Theoretical study on a cross-flow direct evaporative cooler using honeycomb paper as packing material. Appl. Therm. Eng. 2002, 22, 1417–1430. [Google Scholar] [CrossRef]
- Bowman, N.; Lomasl, K.; Cook, M.; Eppel, H.; Ford, B.; Hewitt’, M.; Cucinella, M.; Francis, E.; Rodriguez, E.; Gonzalez, R.; et al. Application of passive downdraught evaporative cooling (PDEC) to non-domestic buildings. Renew. Energy 1997, 10, 191–196. [Google Scholar] [CrossRef]
- Jaber, S.; Ajib, S. Evaporative cooling as an efficient system in the Mediterranean region. Appl. Therm. Eng. 2011, 31, 2590–2596. [Google Scholar] [CrossRef]
- Ndukwu, M.C.; Manuwa, S.I. Review of research and application of evaporative cooling in the preservation of fresh agricultural produce. Int. J. Agric. Biol. Eng. 2014, 7, 85–102. [Google Scholar]
- Ndukwu, M.C.; Manuwa, S.I. A techno-economic assessment for the viability of some waste as cooling pads in an evaporative cooling system. Int. J. Agric. Biol. Eng. 2015, 8, 151–158. [Google Scholar] [CrossRef]
- Schulz, S.L. Evaporative Cooler Solar Retrofit Kit. U.S. Patent 6101716, 12 February 1998. [Google Scholar]
- Leggett, J. The Solar Century: The Past, Present and World-Changing Future of Solar Energy; Green Profile: London, UK, 2009. [Google Scholar]
- Olosunde, W.A.; Ademola KA And Daniel, I.O. Development of A Solar Powered Evaporative Cooling Storage System for Tropical Fruits and Vegetables. J. Food Process. Preserv. 2015, 40, 279–290. [Google Scholar] [CrossRef]
- Timothy, A.; Saleh, A.; Elijah, A.; Iliyah, A.; Fejuro, E. Evaluation of a solar-powered evaporative cooling system for smallholder producers. Niger. J. Sci. Res. 2020, 19, 1–10. [Google Scholar]
- Mekonen, T.N.; Delele, M.A.; Moll, S.W. Development and Testing of Solar Powered Evaporative Air-Cooling System with an Improved Performance. Cogent Eng. 2023, 10, 2178115. [Google Scholar] [CrossRef]
- Mansuri, S.M.; Sharma, P.K.; Samuel, D.V.K. Solar powered evaporative cooled storage structure for storage of fruits and vegetables. Indian J. Agric. Sci. 2016, 86, 916–922. [Google Scholar] [CrossRef]
- Ndukwu, M.C.; Ibeh, M.I.; Akpan, G.E.; Ugwu, E.; Akuwueke, L.; Oriaku, L.; Ihediwa, V.E.; Abam, F.I.; Wu, H.; Kalu, C.A.; et al. Analysis of the Influence of Outdoor Surface Heat Flux on the Inlet Water and the Exhaust Air Temperature of the Wetting Pad of a Direct Evaporative Cooling System. Appl. Therm. 2023, 226, 120292. [Google Scholar] [CrossRef]
- Ndukwu, M.C.; Ibeh, M.; Akpan, G.; Linus, O.; Abada, U.C.; Kalu, C.A.; Ben, A.E.; Mbanasor, J.; Wu, H. Heat transfer correlations and pressure drop dynamics of palm fibre wetting media for evaporative cooling at different air flow rates. Int. J. Refrig. 2023, 154, 268–280. [Google Scholar] [CrossRef]
- Basediya, A.; Samuel, D.V.K.; Beera, V. Evaporative cooling system for storage of fruits and vegetables—A review. J. Food Sci. Technol. 2013, 50, 429–442. [Google Scholar] [CrossRef] [PubMed]
- Ndukwu, M.C.; Simo-Tagne, M.; Inemesit, E.; Akpan, G.E.; Ibeh, M.I.; Igbojionu, D.O.; Tagne, A.T. The dynamics of respiratory heat load produced by orange using different biomass fibres as wetting materials in a direct evaporative cooling system. Biomass Convers. Biorefinery 2023, 14, 16049–16058. [Google Scholar] [CrossRef]
- Liu, W.H.; Hashim, H.; Lim, J.S.; Ho, C.S.; Klemeš, J.J.; Zamhuri, M.I.; Ho, W.S. Techno-economic assessment of different cooling systems for office buildings in tropical large cities considering on-site biogas utilization. J. Clean. Prod. 2018, 184, 774–787. [Google Scholar] [CrossRef]
- Candelise, C.; Winskel, M. Robert Gross Implications for CdTe and CIGS technologies production costs of indium and tellurium scarcity. Prog. Photovolt. Res. Appl. 2012, 20, 816–831. [Google Scholar] [CrossRef]
- Verma, J.; Dondapati, R.S. Techno-economic sizing analysis of solar PV system for Domestic Refrigerators. Energy Procedia 2017, 109, 286–292. [Google Scholar] [CrossRef]
- Opoku, R.; Anane, S.; Edwin, I.A.; Adaramola, M.S.; Seidu, R. Comparative techno-economic assessment of a converted DC refrigerator and a conventional AC refrigerator both powered by solar PV. Int. J. Refrig. 2016, 72, 1–11. [Google Scholar] [CrossRef]
- Ndukwu, M.C.; Manuwa, S.I.; Bennamoun, L.; Olukunle, O.J.; Abam, F.I. In-Situ Evolution of Heat and Mass Transfer Phenomena and Evaporative Water Losses of Three Agro-Waste Evaporative Cooling Pads: An Experimental and Modeling Study. Waste Biomass Valorization 2019, 10, 3185–3195. [Google Scholar] [CrossRef]
- Weather and Climate. Available online: https://weatherandclimate.com/nigeria (accessed on 6 December 2023).
- Palmer, J.D. Evaporative Cooling Design Guidelines Manual; NRG Engineering: Albuquerque, NW, USA, 2002. [Google Scholar]
- Singh, S.; Kumar, S. Solar drying for different test conditions: Proposed framework for estimation of specific energy consumption and CO emissions mitigation. Energy 2013, 51, 27–36. [Google Scholar] [CrossRef]
- Rajput, P.; Tiwari, G.N.; Sastry, O.S. Thermal modelling with experimental validation and economic analysis of monocrystalline silicon photovoltaic module on the basis of degradation study. Energy 2017, 120, 731–739. [Google Scholar] [CrossRef]
- Cherif, H.; Champenois, G.; Belhadj, J. Environmental life cycle analysis of a water pumping and desalination process powered by intermittent renewable energy sources. Renew. Sustain. Energy Rev. 2016, 59, 1504–1513. [Google Scholar] [CrossRef]
- Hilla, C.; Norton, A.; Dibdiakova, J. A comparison of the environmental impacts of different categories of insulation materials. Energy Build. 2018, 162, 12–20. [Google Scholar] [CrossRef]
- Azari, R.; Abbasabadi, N. Embodied energy of buildings: A review of data, methods, challenges, and research trends. Energy Build. 2018, 168, 225–235. [Google Scholar] [CrossRef]
- Rajputa, P.; Singh, Y.K.; Tiwari, G.N.; Sastry, O.S.; Dubey, S.; Pandey, K. Life cycle assessment of the 3.2 kW cadmium telluride (CdTe) photovoltaic system in a composite climate of India. Sol. Energy 2018, 159, 415–422. [Google Scholar] [CrossRef]
- Sadi, M.; Arabkoohsar, A. Techno-economic analysis of off-grid solar-driven cold storage systems for preventing the waste of agricultural products in hot and humid climates. J. Clean. Prod. 2020, 275, 124143. [Google Scholar] [CrossRef]
- Ndukwu, M.C.; Bennamoun, L.; Abam, F.I.; Eke, A.B.; Ukoha, D. Energy and exergy analysis of a solar dryer integrated with sodium sulfate decahydrate and sodium chloride as thermal storage medium. Renew. Energy 2017, 113, 1182–1192. [Google Scholar] [CrossRef]
- Sakaki, K.; Yamada, K. CO2 mitigation by new energy systems. Energy Convers Manag. 1997, 38, S655–S660. [Google Scholar] [CrossRef]
- Philip, N.; Duraipandi, S.; Sreekumar, A. Techno-economic analysis of greenhouse solar dryer for drying agricultural produce. Renew. Energy 2022, 199, 613–627. [Google Scholar] [CrossRef]
- Ndukwu, M.C.; Ibeh, M.; Okon, B.B.; Akpan, G.; Kalu, C.A.; Ekop, I.; Nwachukwu, C.C.; Abam, F.I.; Lamrani, B.; Simo-Tagne, M.; et al. Progressive review of solar drying studies of agricultural products with exergoeconomics and econo-market participation aspect. Clean. Environ. Syst. 2023, 9, 100120. [Google Scholar] [CrossRef]
- NPV Calculator (omnicalculator.com). Available online: https://www.omnicalculator.com/finance/net-present-value (accessed on 6 December 2023).
- Alic, E.; Das, M.; Akpinar, E.K. Design, manufacturing, numerical analysis and environmental effects of single-pass forced convection solar air collector. J. Clean. Prod. 2021, 311, 127518. [Google Scholar] [CrossRef]
- Argo, U.; Ubaidillah, B.D. Thin-Layer Drying of Cassava Chips in Multipurpose Convective Tray Dryer: Energy and Exergy Analyses. J. Mech. Sci. Technol. 2020, 34, 435–442. [Google Scholar] [CrossRef]
- Grossman, G. Solar-powered systems for cooling: Dehumidification and air conditioning. Sol. Energy 2002, 72, 53–62. [Google Scholar] [CrossRef]
- Yousef, M.S.; Hassan, H. Energy payback time, exergoeconomic and enviroeconomic analyses of using thermal energy storage system with a solar desalination system: An experimental study. J. Clean. Prod. 2020, 270, 122082. [Google Scholar] [CrossRef]
- Das, B.; Mondol, J.D.; Negi, S.; Pugsley, A.; Smyth, M. Experimental performance analysis of a novel sand coated and sand filled polycarbonate sheet based solar air collector. Renew. Energy 2021, 164, 990–1004. [Google Scholar] [CrossRef]
- Ould-Amrouche, O.; Rekioua, D.; Hamidat, A. Modelling Photovoltaic Water Pumping Systems and Evaluation of their CO2 Emissions Mitigation Potential. Appl. Energy 2010, 87, 3451–3459. [Google Scholar] [CrossRef]
- Baharwani, V.N.; Meena, A.; Dubey, U.; Brighu, J. Mathur, Life cycle analysis of solar PV system: A review. Int. J. Environ. Res. Dev. 2014, 4, 183–190. [Google Scholar]
- Eltawil, M.A.; Azam, M.M.; Alghannam, A.O. Energy analysis of hybrid solar tunnel dryer with PV system and solar collector for drying mint (MenthaViridis). J. Clean. Prod. 2018, 181, 352–364. [Google Scholar] [CrossRef]
- Chesi, A.; Ferrara, G.; Ferrari, L.; Tarani, F. Analysis of a solar-assisted vapour compression cooling system panel. Renew. Energy 2013, 49, 48–52. [Google Scholar] [CrossRef]
- Analysis of Performance Degradation of PV Modules. Available online: www.powermag.com/analysis-of-performance-degradation-of-pv-modules/ (accessed on 4 March 2024).
- Available online: https://tradingeconomics.com/nigeria/inflation-cpi (accessed on 4 March 2024).
- Available online: https://tradingeconomics.com/nigeria/personal-income-tax-rate (accessed on 4 March 2024).
- Available online: https://tradingeconomics.com/nigeria/interest-rate (accessed on 4 March 2024).
- Available online: https://harbourfronts.com/assets-salvage-value/ (accessed on 4 March 2024).
- Available online: https://nairametrics.com/2022/08/16/nigerias-central-bank-increases-interest-rates-on-savings-deposit-to-4-2/ (accessed on 4 March 2024).
Disclaimer/Publisher’s Note: The statements, opinions and data contained in all publications are solely those of the individual author(s) and contributor(s) and not of MDPI and/or the editor(s). MDPI and/or the editor(s) disclaim responsibility for any injury to people or property resulting from any ideas, methods, instructions or products referred to in the content. |
© 2024 by the authors. Licensee MDPI, Basel, Switzerland. This article is an open access article distributed under the terms and conditions of the Creative Commons Attribution (CC BY) license (https://creativecommons.org/licenses/by/4.0/).