Abstract
Satellite-derived evapotranspiration (ETa) products serve global applications, including drought monitoring and food security assessment. This study examines the applicability of ETa data from two distinct sources, aiming to analyze its correlation with crop yield (rice, maize, barley, soybean). Given the critical role of crop yield in economic and food security contexts, monthly and yearly satellite-derived ETa data were assessed for decision-makers, particularly in drought-prone and food-insecure regions. Utilizing QGIS, zonal statistics operations and time series graphs were employed to compare ETa with crop yield and ET anomaly. Data processing involved converting NRSC daily data to monthly and extracting single-pixel ET data using R Studio. Results reveal USGSFEWS as a more reliable ETa source, offering better accuracy and data continuity, especially during monsoon seasons. However, the correlation between crop yield and ETa ranged from 12% to 35%, while with ET anomaly, it ranged from 35% to 55%. Enhanced collection of satellite-based ETa and crop-yield data is imperative for informed decision-making in these regions. Despite limitations, ETa can moderately guide decisions regarding crop-yield management.
1. Introduction
When making macro-level decisions (like those involving the management of water and crops), particularly in rainfed agriculture, monitoring the geographical and temporal fluctuation of actual evapotranspiration of crops is helpful [1,2,3]. Variability in cropping is closely related to irregularity in rainfall in rainfed areas [4]. This type of research is critical for water-stressed areas because evapotranspiration is a major factor in drought and water-balance assessments [4,5,6,7]. Water managers require accurate information on the various types of crops grown in the command area to release water in the command area. Spatial data on water consumption in irrigated areas is critical for improving water productivity [8,9,10,11]. Evapotranspiration (ET) is a fundamental process of the hydrological cycle in which water evaporates from the land surface and transpires through the canopy cover [12,13]. Evapotranspiration (ET) is an important factor in increasing water productivity. To improve water productivity in the command area, precise monitoring of ET in a catchment is required.
Recent research has demonstrated the value of remotely sensed data in enhancing vegetation and drought monitoring for risk management [14,15,16,17]. Satellite-based remote sensing is essential for tracking crops on a smaller scale since it provides repeat coverage and spatially consistent measurements across a wide area. A drought’s onset, duration, and magnitude can all be detected using advanced satellite technology products with high temporal resolution. This is important information for risk management and food security. Various research has been carried out from time to time to prove the usability of remotely sensed satellite products [4,18,19]. The accuracy of the product varies from place to place depending on topography, cloud cover, and other climatic parameters of the area. Agriculture is one of the most important parts of a country’s economy and development. The prime objective of many government agencies and decision-makers is to establish an early-warning system for crop-yield production during extreme climatic conditions such as drought. Satellite data are expected to help agencies for countries with a wide variety of farming and crop production. Over the past few decades, several techniques and strategies for managing drought risk have been developed [20,21,22,23]. Satellite-based vegetation indices and evapotranspiration provide good methodologies for crop-yield estimations in the lack of measurements of ground truth data [24]. To address challenges with food production brought on by water shortages and drought, there is still a growing need to enhance, evaluate, and incorporate current satellite-derived products employing integrated remote sensing and ground observation of climate data [25]. Additionally, for enhancing drought preparedness and response, the creation of new systems that deliver fast, comprehensive spatial resolution drought information is crucial [26]. The vegetation drought response index (VegDRI) [26], Vegetation Outlook (VegOut) [27], and Atmosphere-Land Exchange Inverse (ALEXI) [28] are recent examples of cutting-edge drought monitoring techniques. According to [28,29,30,31], ET is a crucial variable to monitor and estimate crop yield and biomass for decision-makers interested in food security because of its dependence on land cover and soil moisture, as well as its direct relationship with carbon dioxide assimilation in plants.
ET is the result of the combined processes of soil moisture evaporation, plant transpiration, and water surface evaporation [32,33,34]. Because it expresses the exchange of mass and energy between the soil, water, and vegetation system and the atmosphere, ET is a significant and fundamental part of the hydrologic budget in the environmental system [35]. Evaporation and transpiration are the two sub-processes that make up ET. Open water bodies, plants, and bare land surfaces all experience evaporation. Soil moisture is extracted and moved through the biomass during transpiration. Since 2000, the operational simplified surface energy-balance (SSEBop) model has been used by the U.S. Geological Survey (USGS) Famine Early-Warning Systems Network (FEWSNET) to generate actual ET (ETa) data from the Moderate Resolution Imaging Spectroradiometer (MODIS) [36]. With special parameterization for operational applications, the SSEBop configuration is based on the simplified surface energy-balance (SSEB) technique [37,38]. Recently NRSC (National Remote Sensing Centre) adopted a surface energy-balance approach to produce daily actual evapotranspiration of India. The ETa can be used to compare the state of the vegetation today to extensive historical records. It may be possible to recognize vegetation stress in both time and space using this comparison [36]. In contrast to the same period historically, the ETa anomaly for a certain period, for instance, expresses the surplus or deficit of ETa. For the design, development, and monitoring of agricultural and environmental systems, FEWSNET (2014) emphasized that understanding the rate and amount of ETa for a specific region is crucial. ETa anomalies are assumed to represent a surplus or deficit in soil moisture during the non-growing season and (ii) a surplus or deficit in crop water use during the growing season, which is directly related to crop condition and biomass across the agricultural or rangeland areas. In light of the extensive historical record, positive ETa anomalies are therefore anticipated to show relatively higher biomass, while negative ETa anomalies show lower biomass.
Despite the widespread agreement that ETa products should be used to monitor droughts and evaluate food security, a thorough model study has not yet been conducted. Furthermore, there are few approaches available for analyzing drought and food security models. This research has concentrated on establishing a model evaluation method specifically suited to drought and food security models utilizing crop production data to fill these gaps. The goals of this research work are to (1) compare the usability of ETa products from two different sources and (2) study the relationship between crop yield and evapotranspiration products.
2. Materials and Methods
2.1. Study Area
The study area chosen for the research work is the Cauvery River basin. The Cauvery River basin spreads through four states: Karnataka, Kerala, Tamil Nadu, and a few parts of Puducherry. It is divided into ten sub-basins (Figure 1) draining an area of 85,626.23 Sq.km (India-WRIS website). Cauvery River basin lies between 75°27′ E to 79°54′ E east longitude and 10°9′ N to 13°30′ N north latitude, out of which 54% area lies in Tamil Nadu and Puducherry, 42% lies in Karnataka, and 4% lies in Kerala with maximum length of 560 km and maximum with of 245 km. It is bounded by Western Ghats on the west side, Eastern Ghats on the east side, Krishna Basin on the south, and Penner Basin on the north. The Western Ghats, the plateau of Mysore, and the Delta are the three major physiographic divisions of the basin. Cauvery River is one of the most important rivers of peninsular India, with a total length of approximately 800 km, and its highest elevation is 1341 m near the Kodagu district of Karnataka, which drains out into the Bay of Bengal. The basin has a total of 96 dams, 10 barrages, 16 weir/anicuts, and 24 powerhouses. It is an agriculture-oriented basin with 66.21% of the total area as agricultural land and 20.50% of the area as forest area. The basin experiences a tropical to sub-tropical climate. The mean annual rainfall in the basin is approximately 1075.23 mm, with the highest rainfall occurring in July and August. The average mean temperature of the basin ranges from 22.98 °C to 28.43 °C. The sub-basins of the Cauvery River are taken for detailed study and usability of evapotranspiration data from different sources.
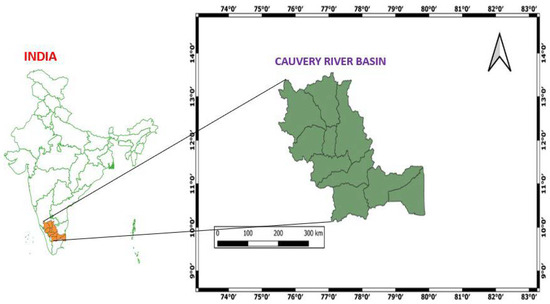
Figure 1.
Comprehensive location map detailing the Cauvery River basin, India.
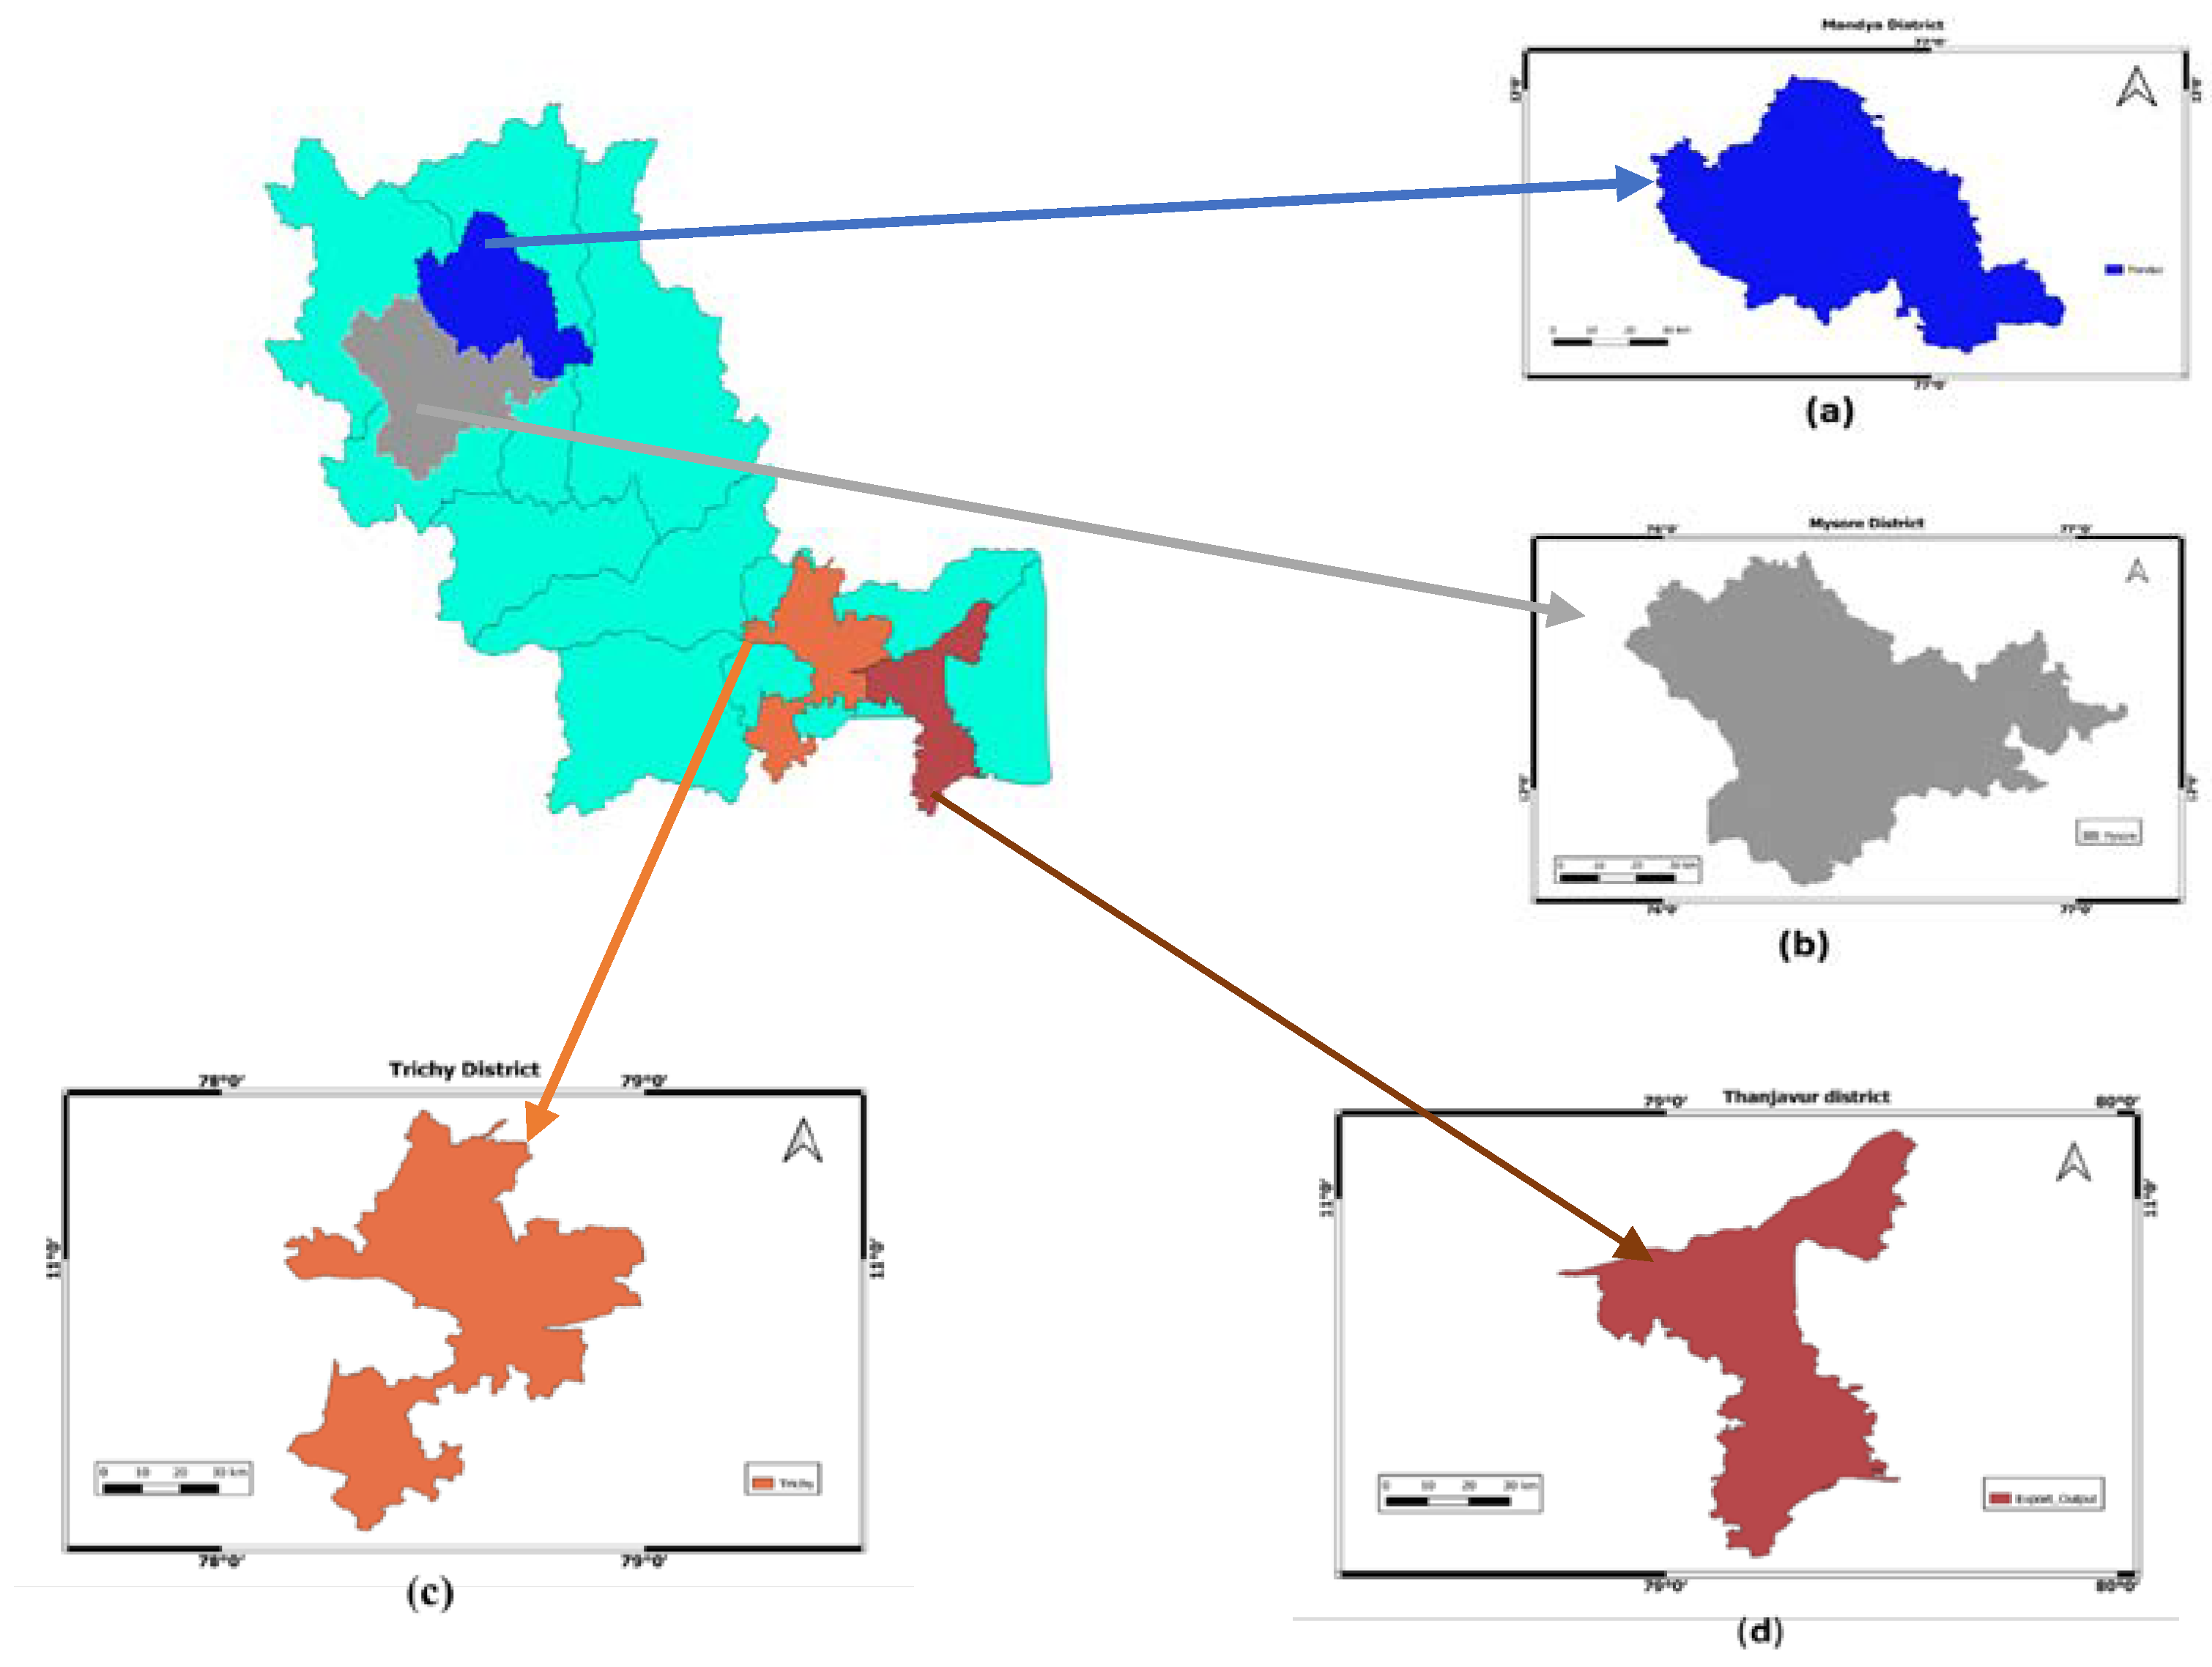
Four districts from the Cauvery River basin—Mandya, Mysore, Tiruchirappalli, and Thanjavur—have been taken to establish the relationship between ETa and crop yield (Figure 2). Mandya district lies in the upper Cauvery River basin. The boundary lies between 12°13′ to 13°04′ N north latitude and 76°19′ to 77°20′ E east longitude. The area of the Mandya district is 4,961 square kilometers. Mysore district also lies in the upper Cauvery River basin. It lies between 11°45′ N to 12°40′ N North latitude and 75°57′ E to 77°15′ E east latitude. Tiruchirappalli district lies in the lower Cauvery Basin. It lies between 10°48′ N to 11°07′ N North latitude and 78°45′ E to 79°33′ E east longitude. These four districts were chosen because of the availability of crop-yield data. All lie in the Cauvery River basin. Both upper and lower Cauvery could be studied, and more than 50% of the area comes under irrigated land (from LULC).

Figure 2.
Location map of (a) Mandya, (b) Mysore, (c) Trichy, (d) Thanjavur.
2.2. Data and Methodology
2.2.1. Crop-Yield Data
Crop-yield data were downloaded from the International Crop Research Institute for the Semi-Arid Tropics (ICRISAT) website in CSV format. District-wise crop-yield data of several crops like rice, sorghum, maize, finger millet, chickpea, pigeon pea, and sugarcane are available on this website.
2.2.2. ETa Model Description
In the present research work, ET is downloaded from two websites (NRSC and FEWS), and both follow the surface energy-balance approach. Evapotranspiration is generally estimated by two broad methods subsurface energy-balance approach and water-balance approach. The water-balance approach focuses on soil moisture modeling and finding the temporal distribution of water (rainfall) to meet crop demand. On the other hand, the subsurface energy-balance method focuses on land surface temperature (LST) which directly gives the amount of evaporated water from crops. The concept of LST is based on the fact that healthy and well-watered vegetation will show cooler LST as compared to unhealthy vegetation [37,38]. The main advantage of the energy-balance approach over the water-balance approach is that it does not require prior knowledge of crop calendar, nor does it require any knowledge of crop management systems in a particular area [36]. LST takes into account a few integrated parameters, such as the impact of water, disease, management practices, and other factors on crop conditions.
The energy-balance equation used for the estimation of ETa is shown below:
LE = Rn − G − H
In the above equation, LE = latent heat flux (energy consumed by evapotranspiration) (W/m2); Rn = net radiation at the surface (W/m2); G = ground heat flux (W/m2); H = sensible heat flux (W/m2).
The latent heat flux in the above equation reflects the residual left after the difference between the net radiation on the surface and the losses due to sensible heat flux (energy used to heat the air) and ground heat flux (energy stored in the ground) at the land surface. The ETa data used in the research work is based on the SSEBop model from FEWSNET [36], and the NRSC Bhuvan website directly solves the ET values without estimating the other energy-balance terms. The basic assumption in the SSEB model is that the temperature inconsistency between a bare-dry surface and atmosphere (dT) remains nearly constant from year to year for a given day and location under clear-sky conditions required for satellite observation and that the available clear-sky net radiation drives most of the surface balance (Rn). The ET fraction is calculated as:
where ETf is the ET proportion (0–1), and dT is a temperature difference between the hot and cold reference boundary conditions that are unique for each day and pixel, ranging between 5 and 25 °K depending on location and season, calculated using clear-sky radiation balancing calculations. Th denotes the temperature of a dry-bare (hot) surface (Th = Tc + dT); Tc indicates the cold/wet-vegetated surface, which is in equilibrium with the air temperature, i.e., all net radiation is utilized for latent heat flux. Tc is the surface temperature acquired from MODIS LST as a proportion of the maximum air temperature (obtained from gridded meteorological fields). The reference (“potential” ET, Eto), which is obtained by solving the Penman–Monteith equation [1,37,39,40,41] using weather parameters derived from model-assimilated global fields, is then used to estimate actual ET during a period of aggregation defined by the reference (“potential” ET, Eto). The monthly and seasonal totals are then calculated using the eight-day ETa estimates.
ETf = (Th − Ts)/dT
ETa = ETf × Eto
The ETa anomaly for a season in percent is calculated as:
ETa(%) = (ETac/ETam) × 100
Eta (%) is the anomaly percentage value, ETac is the current seasonal ETa value, and ETam is the median ETa value from 2000 to 2013. This ETa anomaly for a specific period is intended to show whether ETa is in surplus or deficit in comparison to previous periods. Eta anomalies represent soil moisture excess or deficiency during the non-vegetative stage (for agricultural or rangeland areas). Eta anomalies represent excess or deficit crop water use during the growing season, which is proportional to crop condition and biomass. When compared to the median value for the same period, positive ETa anomalies indicate higher-than-normal biomass, whereas negative ETa anomalies indicate lower biomass.
This method by [38] has been validated extensively against flux tower observations, water-balance ET, and MOD16 over a 14-year MODIS history over the Conterminous United States (CONUS), Africa, and Southeast Asia successfully that used the SSEBop ET to map water production and consumption zones in the Nile Basin. However, the accuracy of the ET derived from the SSEBop model varies depending on the accuracy of input parameters, such as weather data. Aside from the model’s limitations in complex terrain, the ET anomaly products may be useful for drought monitoring because the temporal variability is primarily driven by the LST and temperature.
2.2.3. Zonal Statistics for ETa
The downloaded ETa is in raster format, so the zonal statistics tool was used in QGIS software to extract the mean, minimum, and maximum ETa values of all ten sub-basins and four districts. A land use land cover map was used to extract ETa of irrigated and non-irrigated areas. For the correlation between crop yield and ETa, the mean value of ETa was extracted from each zone for all downloaded years. Hence, a database was built that contains zonal static mean for all years from 2003 to 2021 (for USGS FEWS) and from 2017 to 2021 (for NRSC). LULC was clipped according to sub-basins and districts with the help of available shape files. The clipped LULC was then used to execute the zonal statistics.
2.2.4. LULC Data
LULC was downloaded from the Bhuvan FTP server. It was classified into 18 different classes, namely built-up, Kharif, Rabi, Zaid, double/triple crops, current fallow, plantation, evergreen forest, deciduous forest, degraded/scrub forest, littoral swamp, grassland, shifting cultivation, wasteland, and waterbodies max, waterbodies min, and snow cover. Monitoring land use/cover changes is a significant task that is important for national planning and the identification of possible development regions with an emphasis on food security, as well as serving as a significant input to resource planning, hydrological modeling, and atmospheric modeling. Using AwiFS data, the national land use/land cover (LULC) mapping project plans to provide data on crop area after the conclusion of the Kharif and rabi seasons. Aggregated land use/cover data are created after each agricultural year and provided every year. Major land cover classes are represented by a 19-fold classification system that was chosen. For analysis, multi-temporal datasets have been precisely registered with a foundation layer. In plain areas, the registration accuracy has been kept at about 1 pixel level, while in steep areas, at 2–3 pixels level. As part of the mapping effort using sample ground truth, digital classification algorithms with a hybrid approach (see5 or MXL) have been applied.
A national-level LULC mapping project has been started as part of the NNRMS-DOS program, considering the necessity for spatial accounting and monitoring of Land Use/Land Cover (LULC) systems in India and the ability of the Resourcesat AwiFS sensor to meet these requirements. In some locations with persistent cloud cover issues during the ninth cycle, RISAT-1 CRS C-band HH and HV microwave data were also used. Along with rainfall patterns, the geographical distribution of crops over meteorological subdivisions is also derived and examined and a LULC raster map was produced. In some locations with persistent cloud cover issues during the ninth cycle, RISAT-1 CRS C-band HH and HV microwave data were also used. Along with rainfall patterns, the geographical distribution of crops over meteorological subdivisions is also derived and examined.
2.3. Methodology
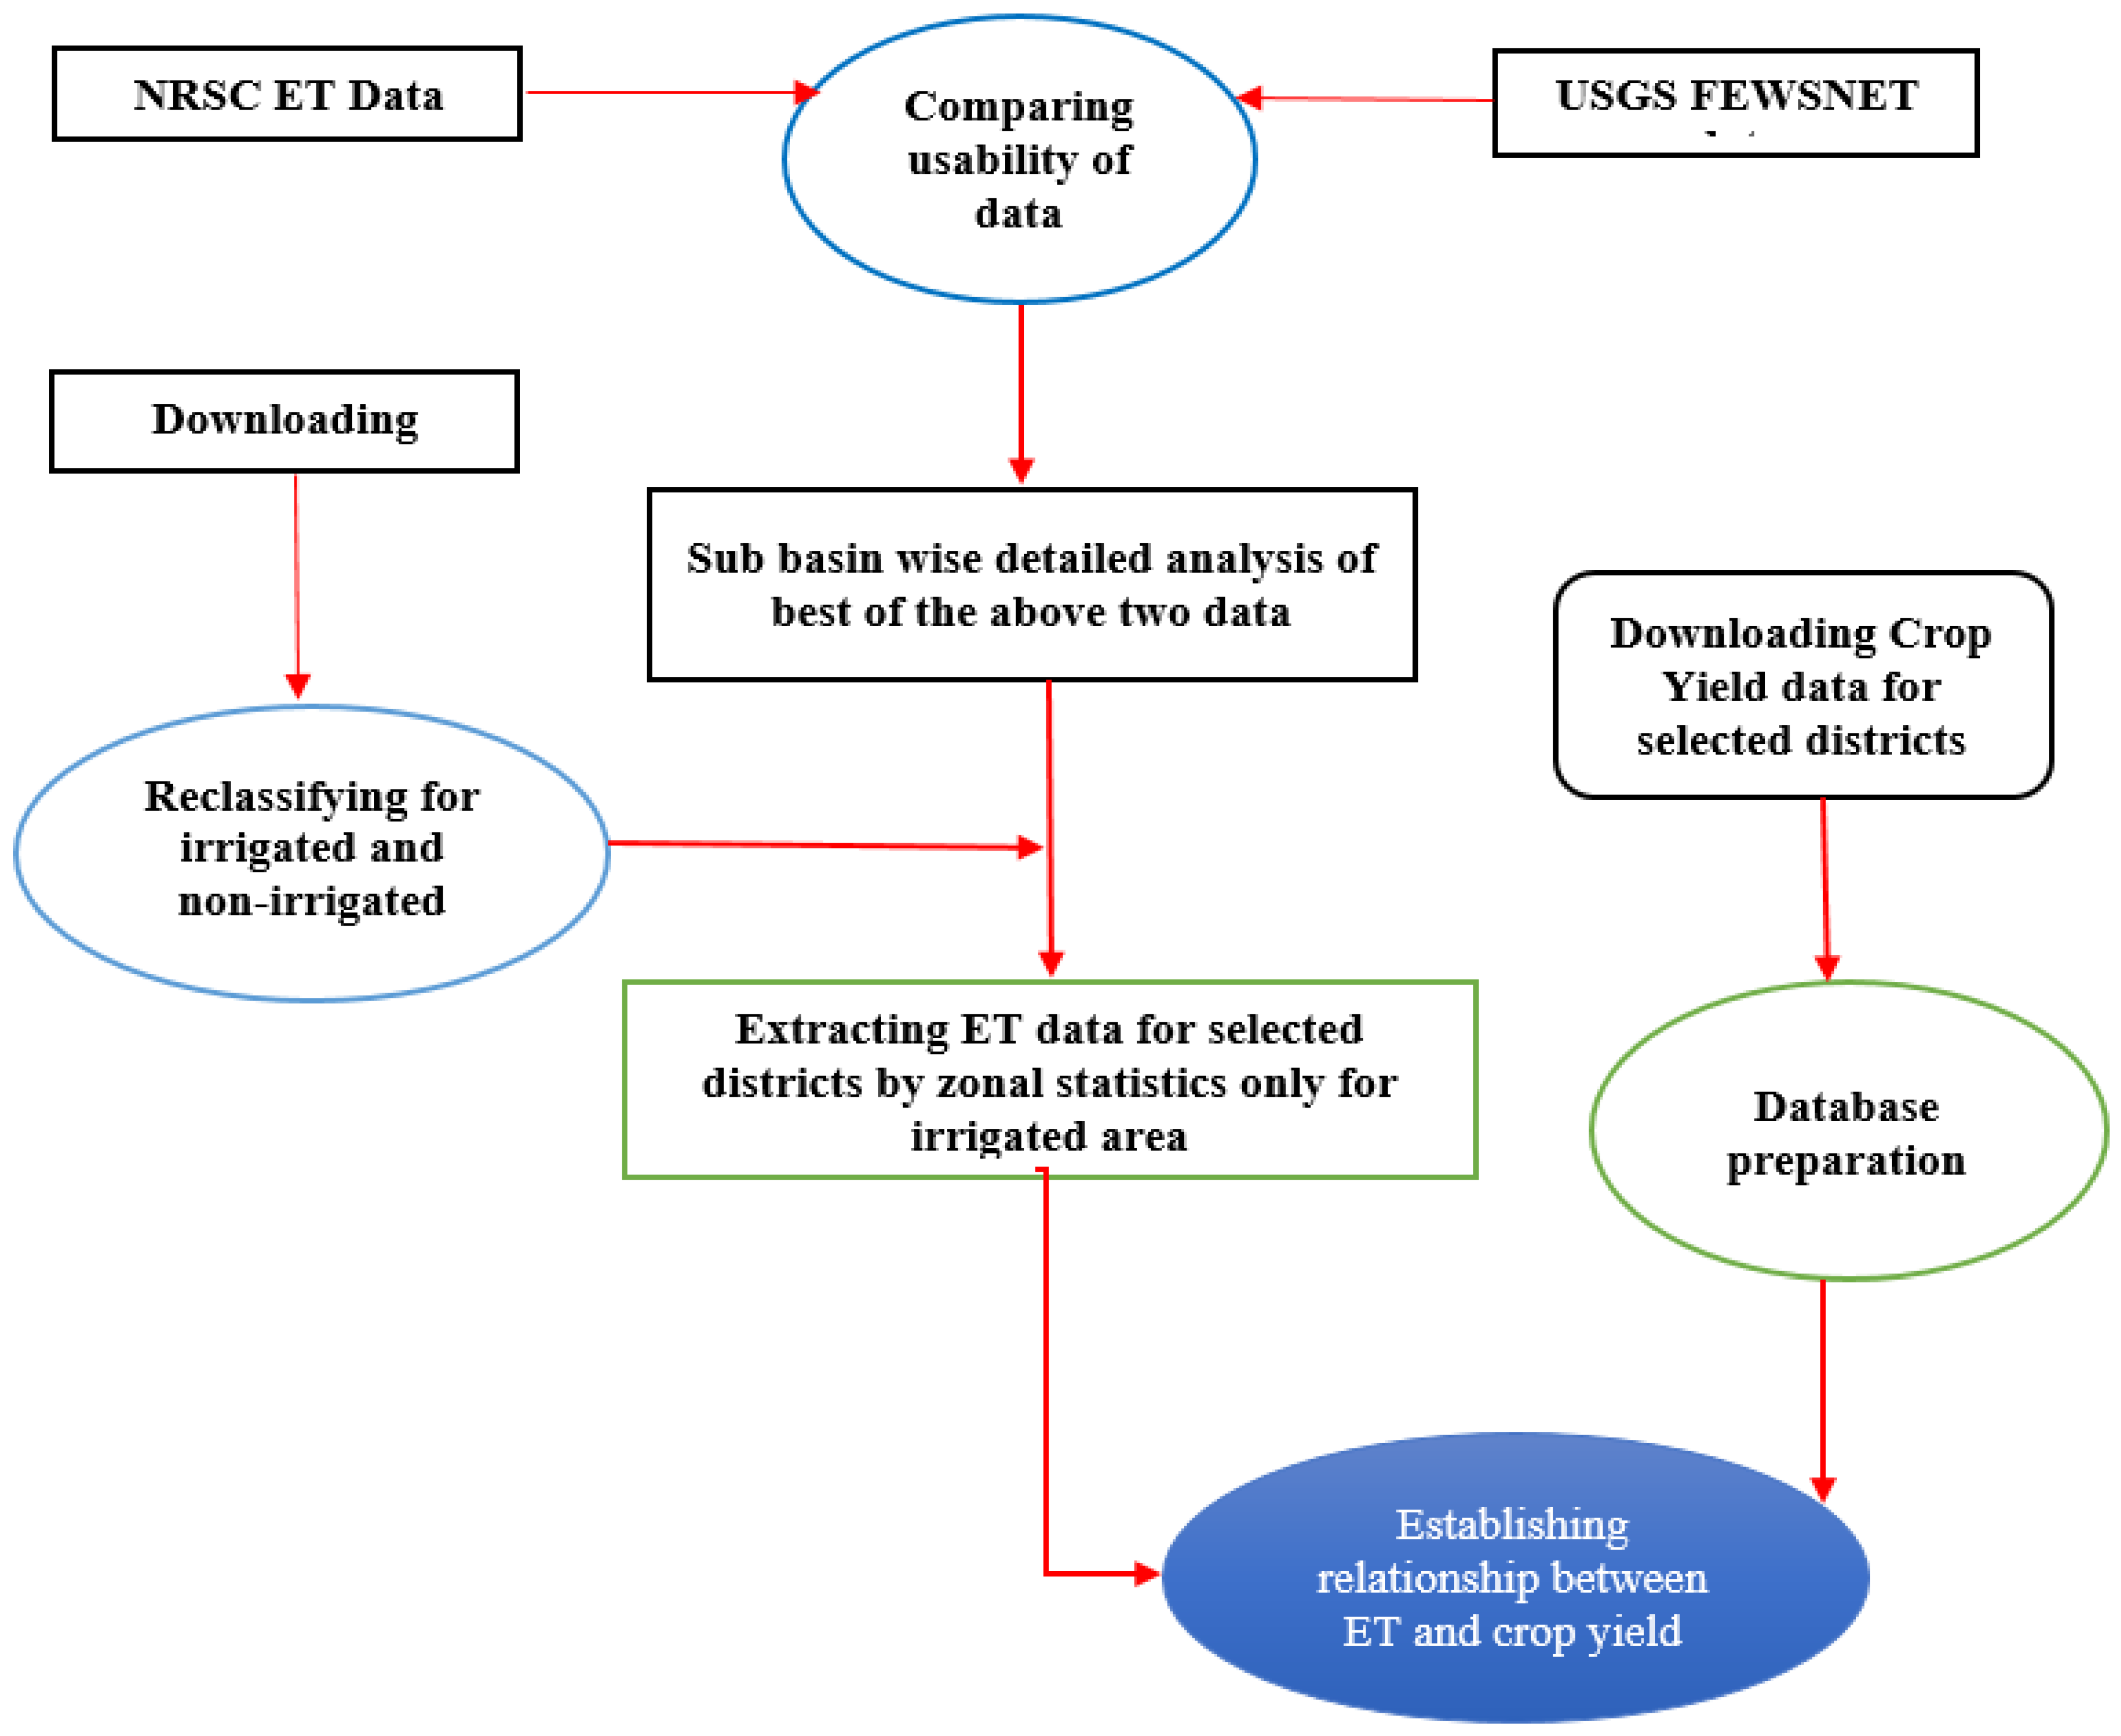
The flowchart of the methodology is depicted in Figure 3. ETa data used in this research work is downloaded from FEWSNET and Bhuvan NRSC website, which follows the SSEBop (Subsurface energy-balance approach) ETa algorithm. Bhuvan NRSC provides daily data, so daily data were stacked and changed into monthly data. Since NRSC data are available from 2019, so data from 2019 to 2021 were used to compare the usability of ETa. Cloud pixel data and no data were originally assigned as 65,534 and 65,535. To convert them to monthly data, these pixels were resampled, and a null value was assigned against them. Raster data were then added and converted to monthly data. For months for which all days’ (28/30/31) data were not available, the number of available days was added and then divided by the total number of available days and then multiplied by the number of days in that particular month, this process was carried out for every pixel of the study area. R studio was used in manipulating the raster and extracting ET data from a particular pixel to compare the usability of the above two evapotranspiration data sources.

Figure 3.
Visual representation illustrating the methodology flow for the Cauvery Basin.
2.3.1. LULC Reclassification
The downloaded LULC of 2018 to 2019 was reclassified into two broad categories i.e., irrigated area and non-irrigated area. Kharif crop, rabi crop, Zaid crop, double/triple crop, and current fallow lands were included in the irrigated area, whereas the rest of the classes were included in non-irrigated area. These classifications helped in extracting ETa data during zonal statistics for irrigated and non-irrigated areas separately. Irrigated-area ETa was further used to establish a relationship with crop yield. Reclassification was carried out in QGIS. Figure 4 shows the original and reclassified LULC.
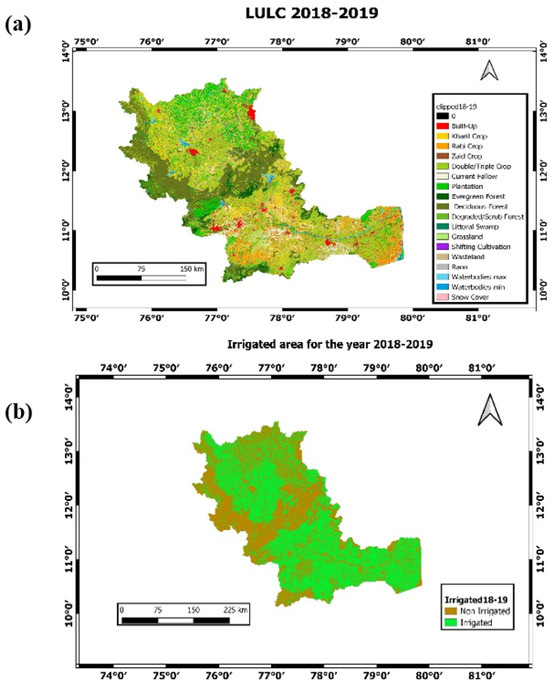
Figure 4.
(a) LULC of Cauvery River basin (b) Reclassified LULC for the Cauvery River basin.
2.3.2. Comparison of ET Data
Evapotranspiration data from both sources is compared by two methods: (1) single-pixel comparison and (2) sub-basin-wise comparison. In single-pixel comparison, one pixel was randomly chosen from the irrigated area of the lower Cauvery River basin, and ETa data were extracted from both the data sources (NRSC and FEWS) using R studio in Excel format. Daily ETa data NRSC was converted into monthly by dividing the summation of available data by the number of available days and multiplying by the total number of days in that particular month. A monthly data set was prepared of selected pixels from both the sources for the years 2019 to 2021 and a time series graph was plotted for the same to compare values of ETa. In sub-basin-wise comparison, the Cauvery River basin was divided into ten sub-basins and zonal statistics were done with the help of LULC for all ten sub-basins. Similar to the previous step, a monthly data set was prepared in Excel with irrigated and non-irrigated ETa values from 2019 to 2021, and values were compared for all ten sub-basins.
Following the above procedure, a conclusion was drawn regarding the usability of data, and then yearly data were downloaded from that particular website. A new data set was prepared for establishing a relationship between ETa and crop yield. Zonal statistics were done similarly for four districts, i.e., Mandya, Mysore, Tiruchirappalli, and Thanjavur. Irrigated-area ETa and ET anomaly were extracted, and the data set was prepared. The above four districts were chosen because of the availability of crop yield; all lie within the Cauvery River basin and the maximum area of all districts was agricultural area.
2.3.3. Relationship between ETa and Crop Yield
Simple linear regression was performed in Excel to find the value of R2 to establish a relationship between ETa and crop yield. Regression analysis is a set of statistical methods for estimating relationships between one or more independent variables and a dependent variable. It can be used to assess the strength of the relationship between variables and to forecast their future relationship. There are several types of regression analysis, including linear, multiple linear, and nonlinear. Simple linear and multiple linear models are the most common. Nonlinear regression analysis is commonly used for more complicated data sets with a nonlinear relationship between the dependent and independent variables. The simple linear regression analysis has the following equation.
where Y is the dependent variable (Crop yield in the present case), X is the dependent variable (evapotranspiration products in the present case), “a” is the intercept, b is the slope, and ∈ is residual error.
Y = a + bX + ∈
3. Results and Discussion
3.1. Reclassification
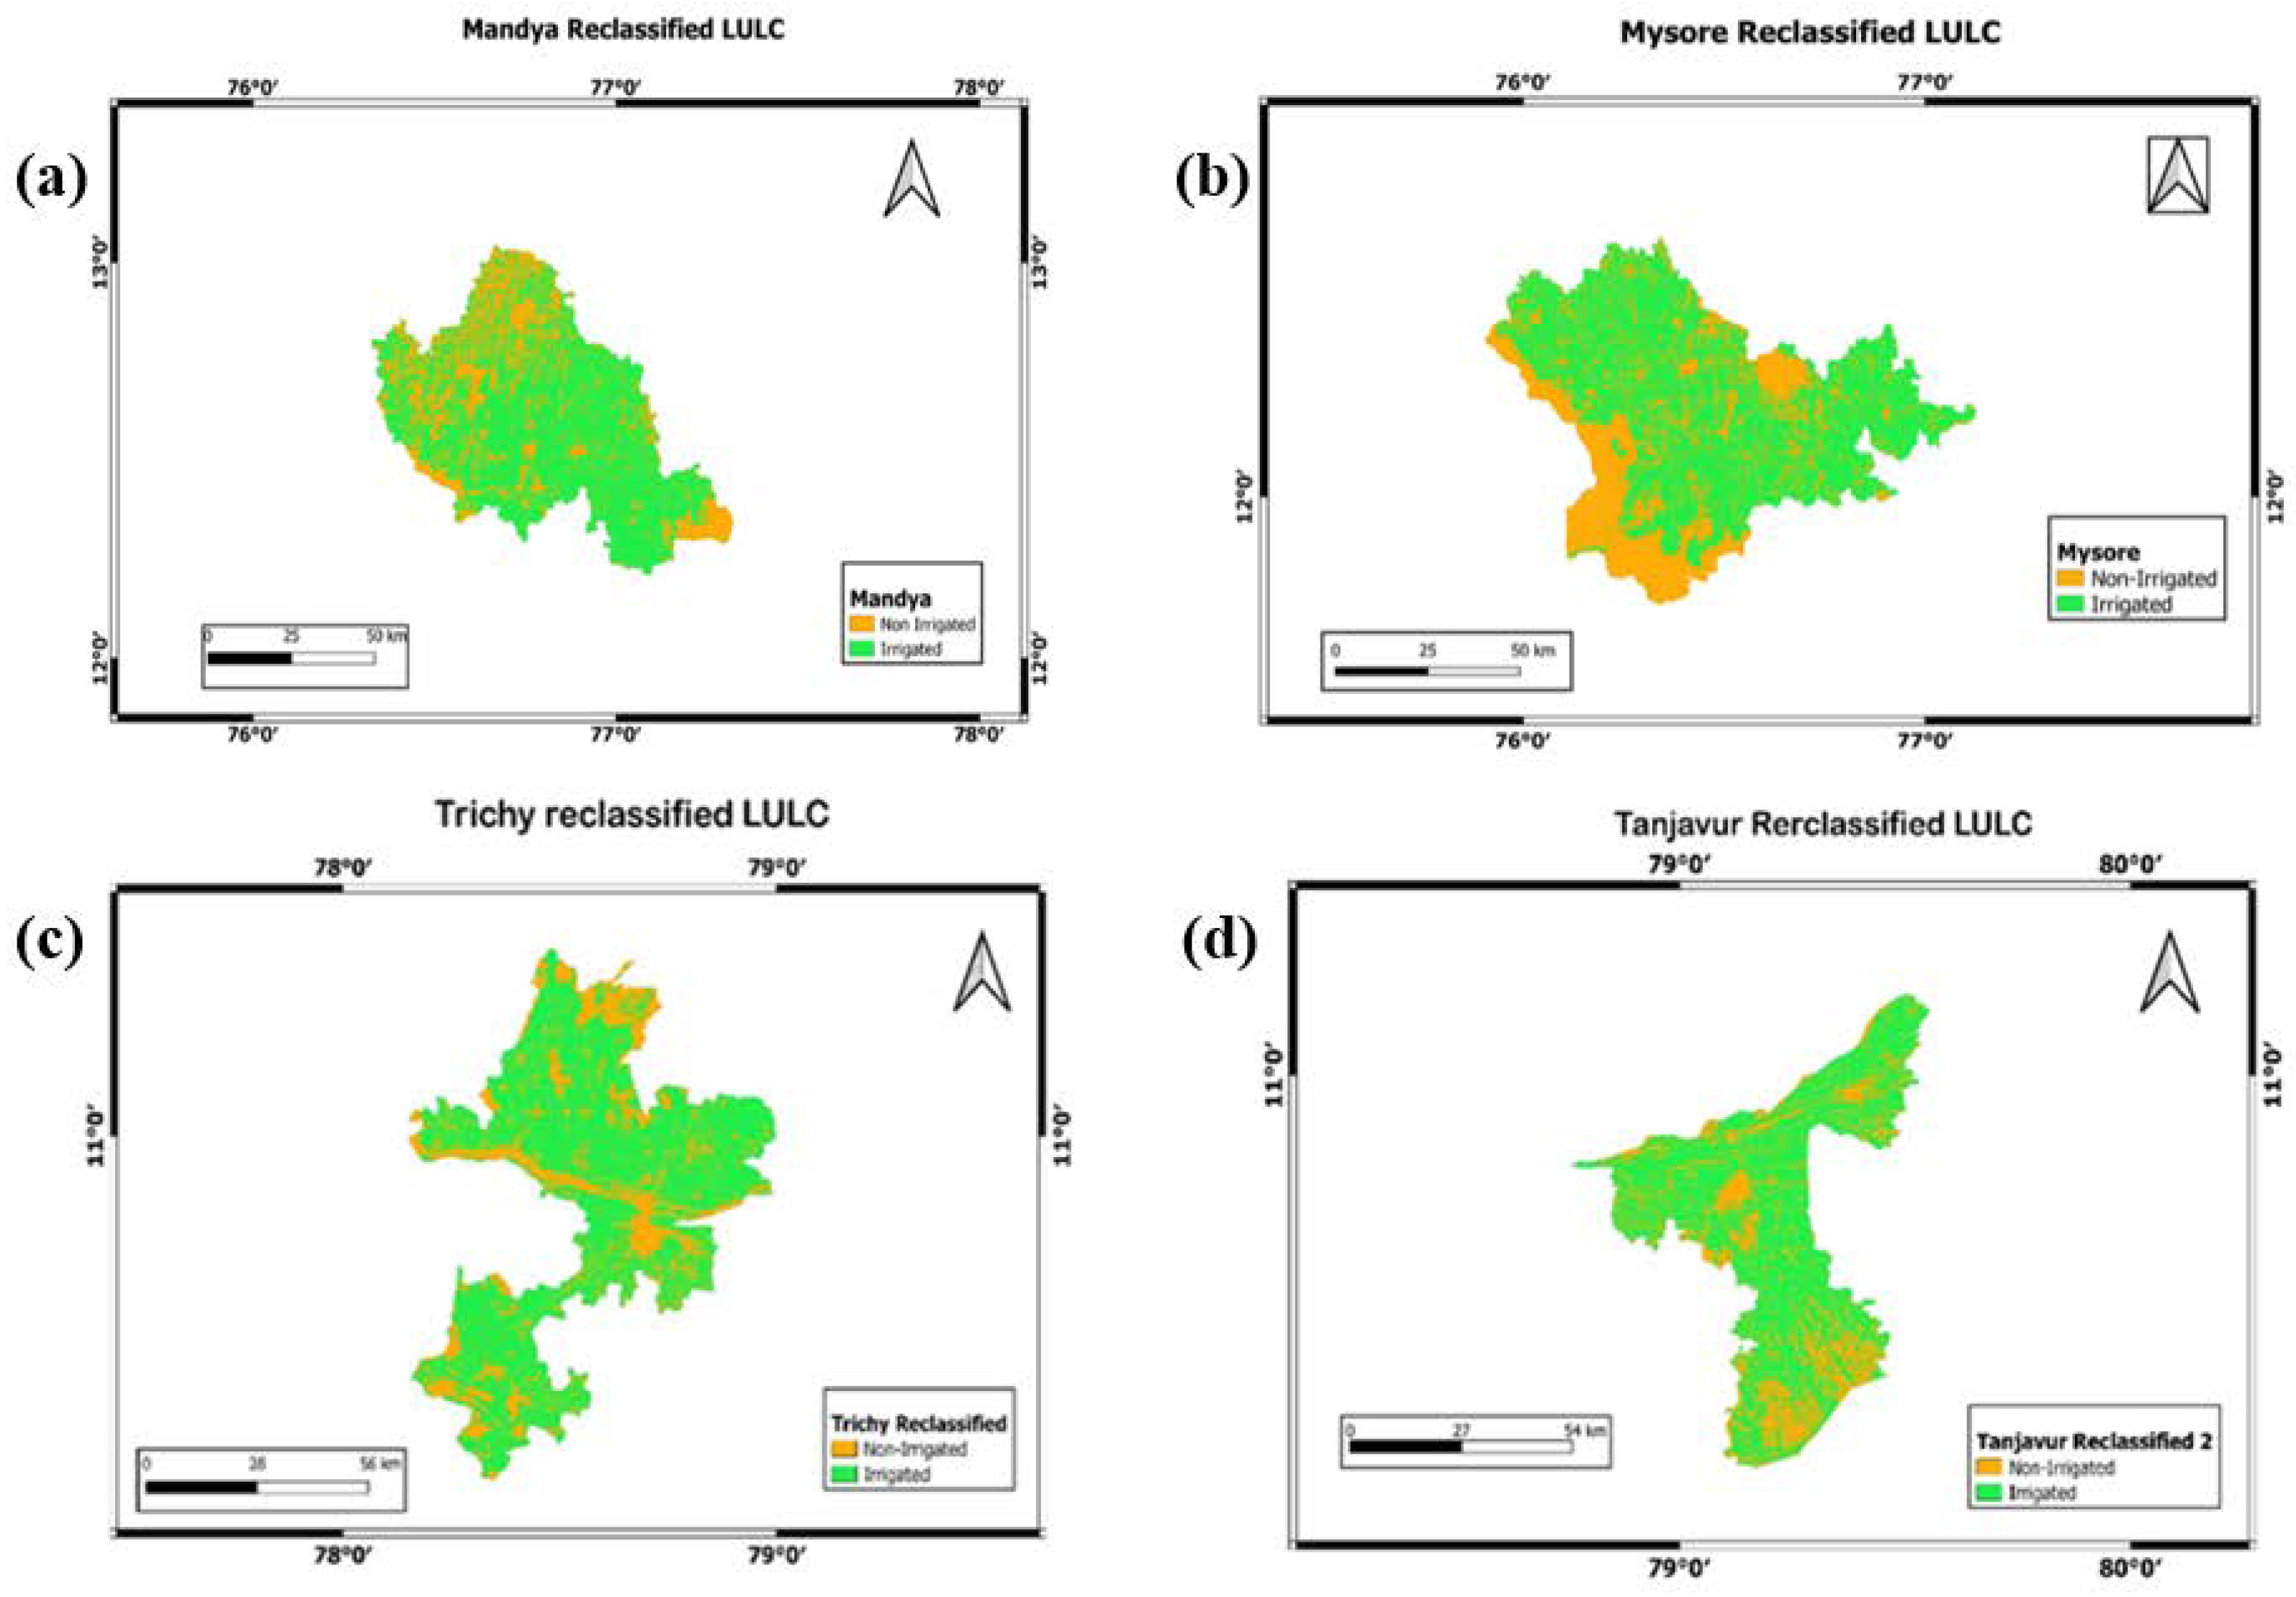
Non-irrigated pixels were assigned a value of 1, and irrigated pixels were assigned a value of 2. A total of 55.7% area of the Cauvery River basin turned out to be irrigated, and 46.28% area was non-irrigated (Figure 4a,b). Considering district-wise reclassified LULC, Mandya has approx. 32% non-irrigated area and 67% irrigated area (Figure 5a), Mysore has approx. 36% non-irrigated and 63% irrigated area (Figure 5b), Trichy has approx. 28% non-irrigated and 72% irrigated area (Figure 5c), whereas Thanjavur has 50% non-irrigated and 50% irrigated area (Figure 5d). These classifications helped in selecting the study area from the crop-yield ETa relationship.
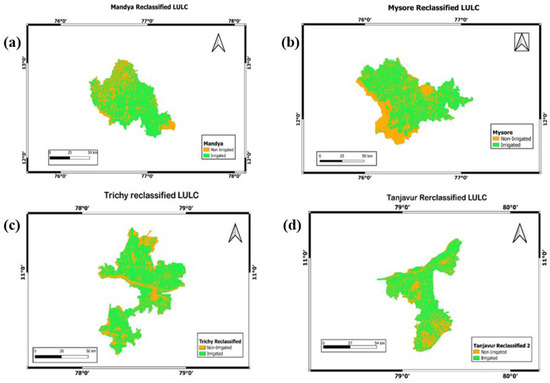
Figure 5.
Reclassified LULC of (a) Mandya, (b) Mysore, (c) Trichy, and (d) Thanjavur.
3.2. Data Usability
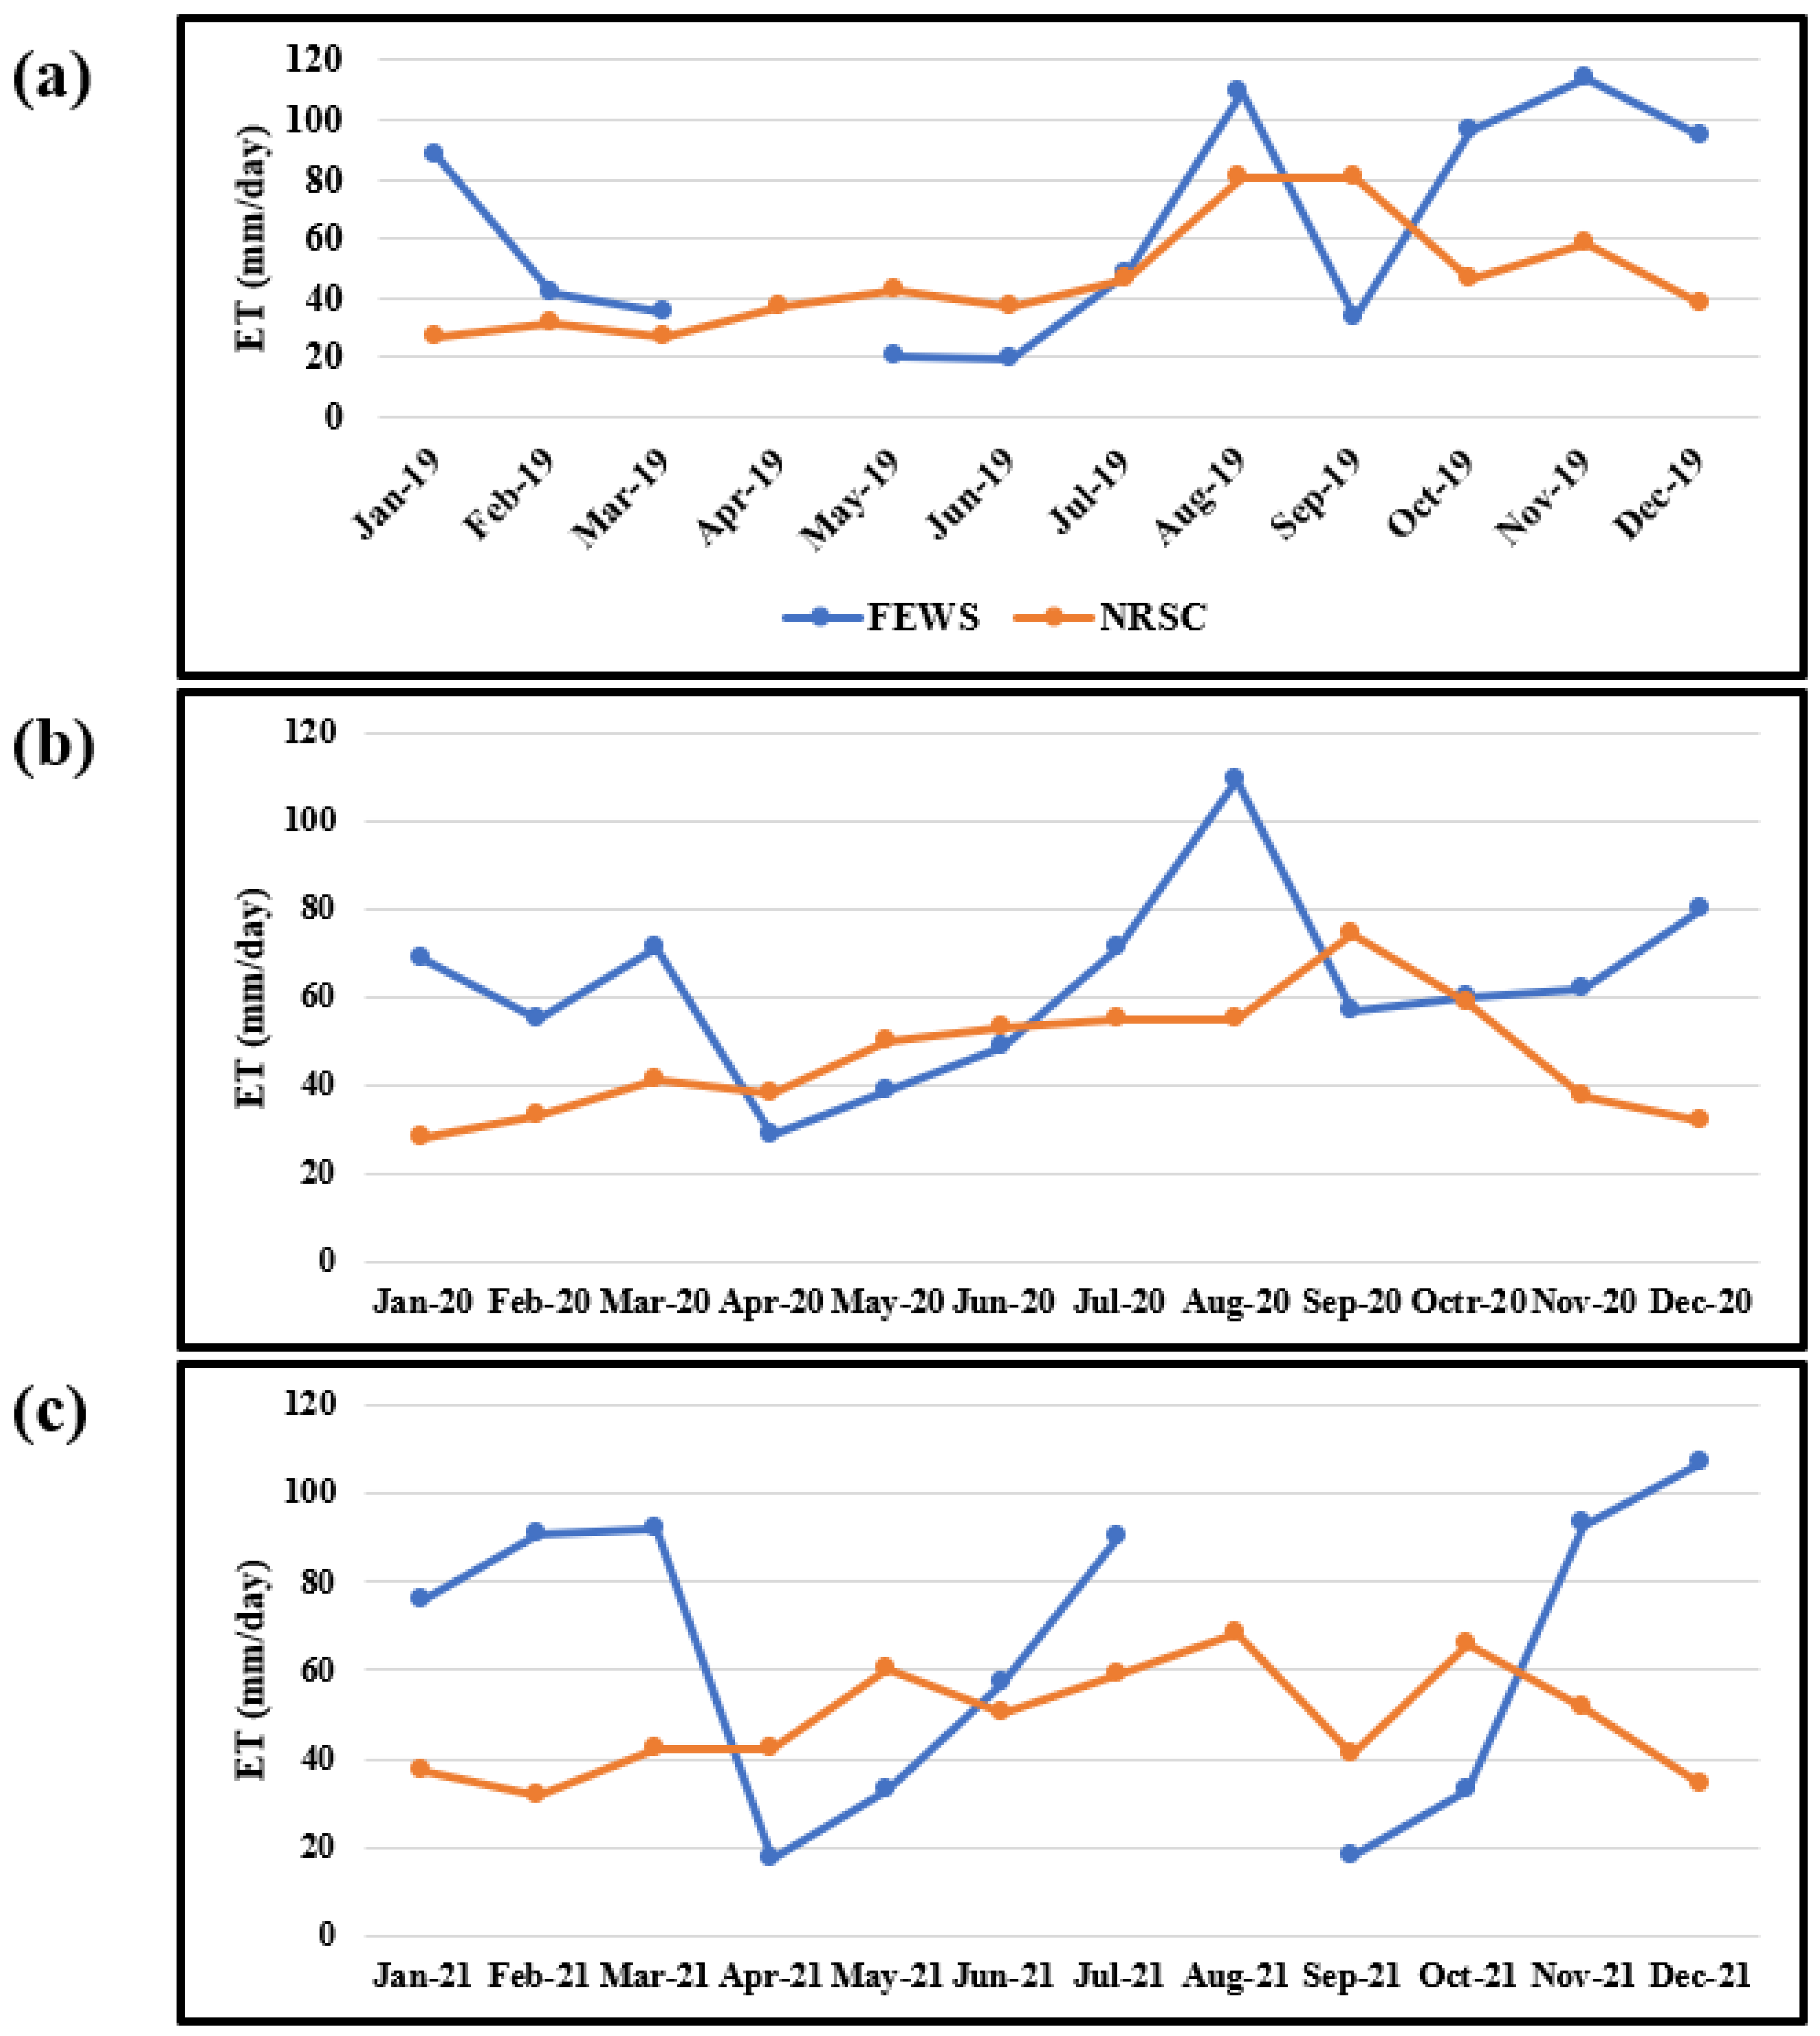
This study examined the usability of data sources for further study purposes. In the single-pixel comparison method, it was found that daily data were missing in the case of NRSC data, especially in the monsoon months of June, July, and August. Table 1 shows the number of days for which data are available for each year for critical monsoon months. Time series graphs were plotted for 2019, 2020, and 2021 (Figure 6a–c) for a single pixel, but conclusive results regarding usability were not drawn due to missing satellite data. A huge difference between the values of NRSC and FEWS data was observed. It might have occurred due to missing NRSC data and the conversion of daily data to monthly data. Since the conversion method of NRSC daily data includes dividing by the number of available days and multiplying by the total number of days in a month, for a few months, fewer data are available, and for those months, monthly data might be inaccurate. Daily data are much more useful for detailed analysis, but a lack of continuity can cause drastic changes in outputs.

Table 1.
Compilation and utilization of National Remote Sensing Centre (NRSC) fata for key months of significance.
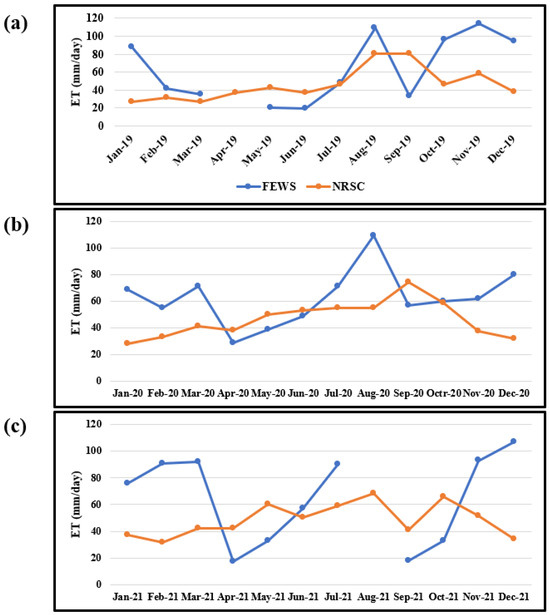
Figure 6.
Comparison plots illustrating NRSC and FEWS data for the years (a) 2019, (b) 2020, and (c) 2021.
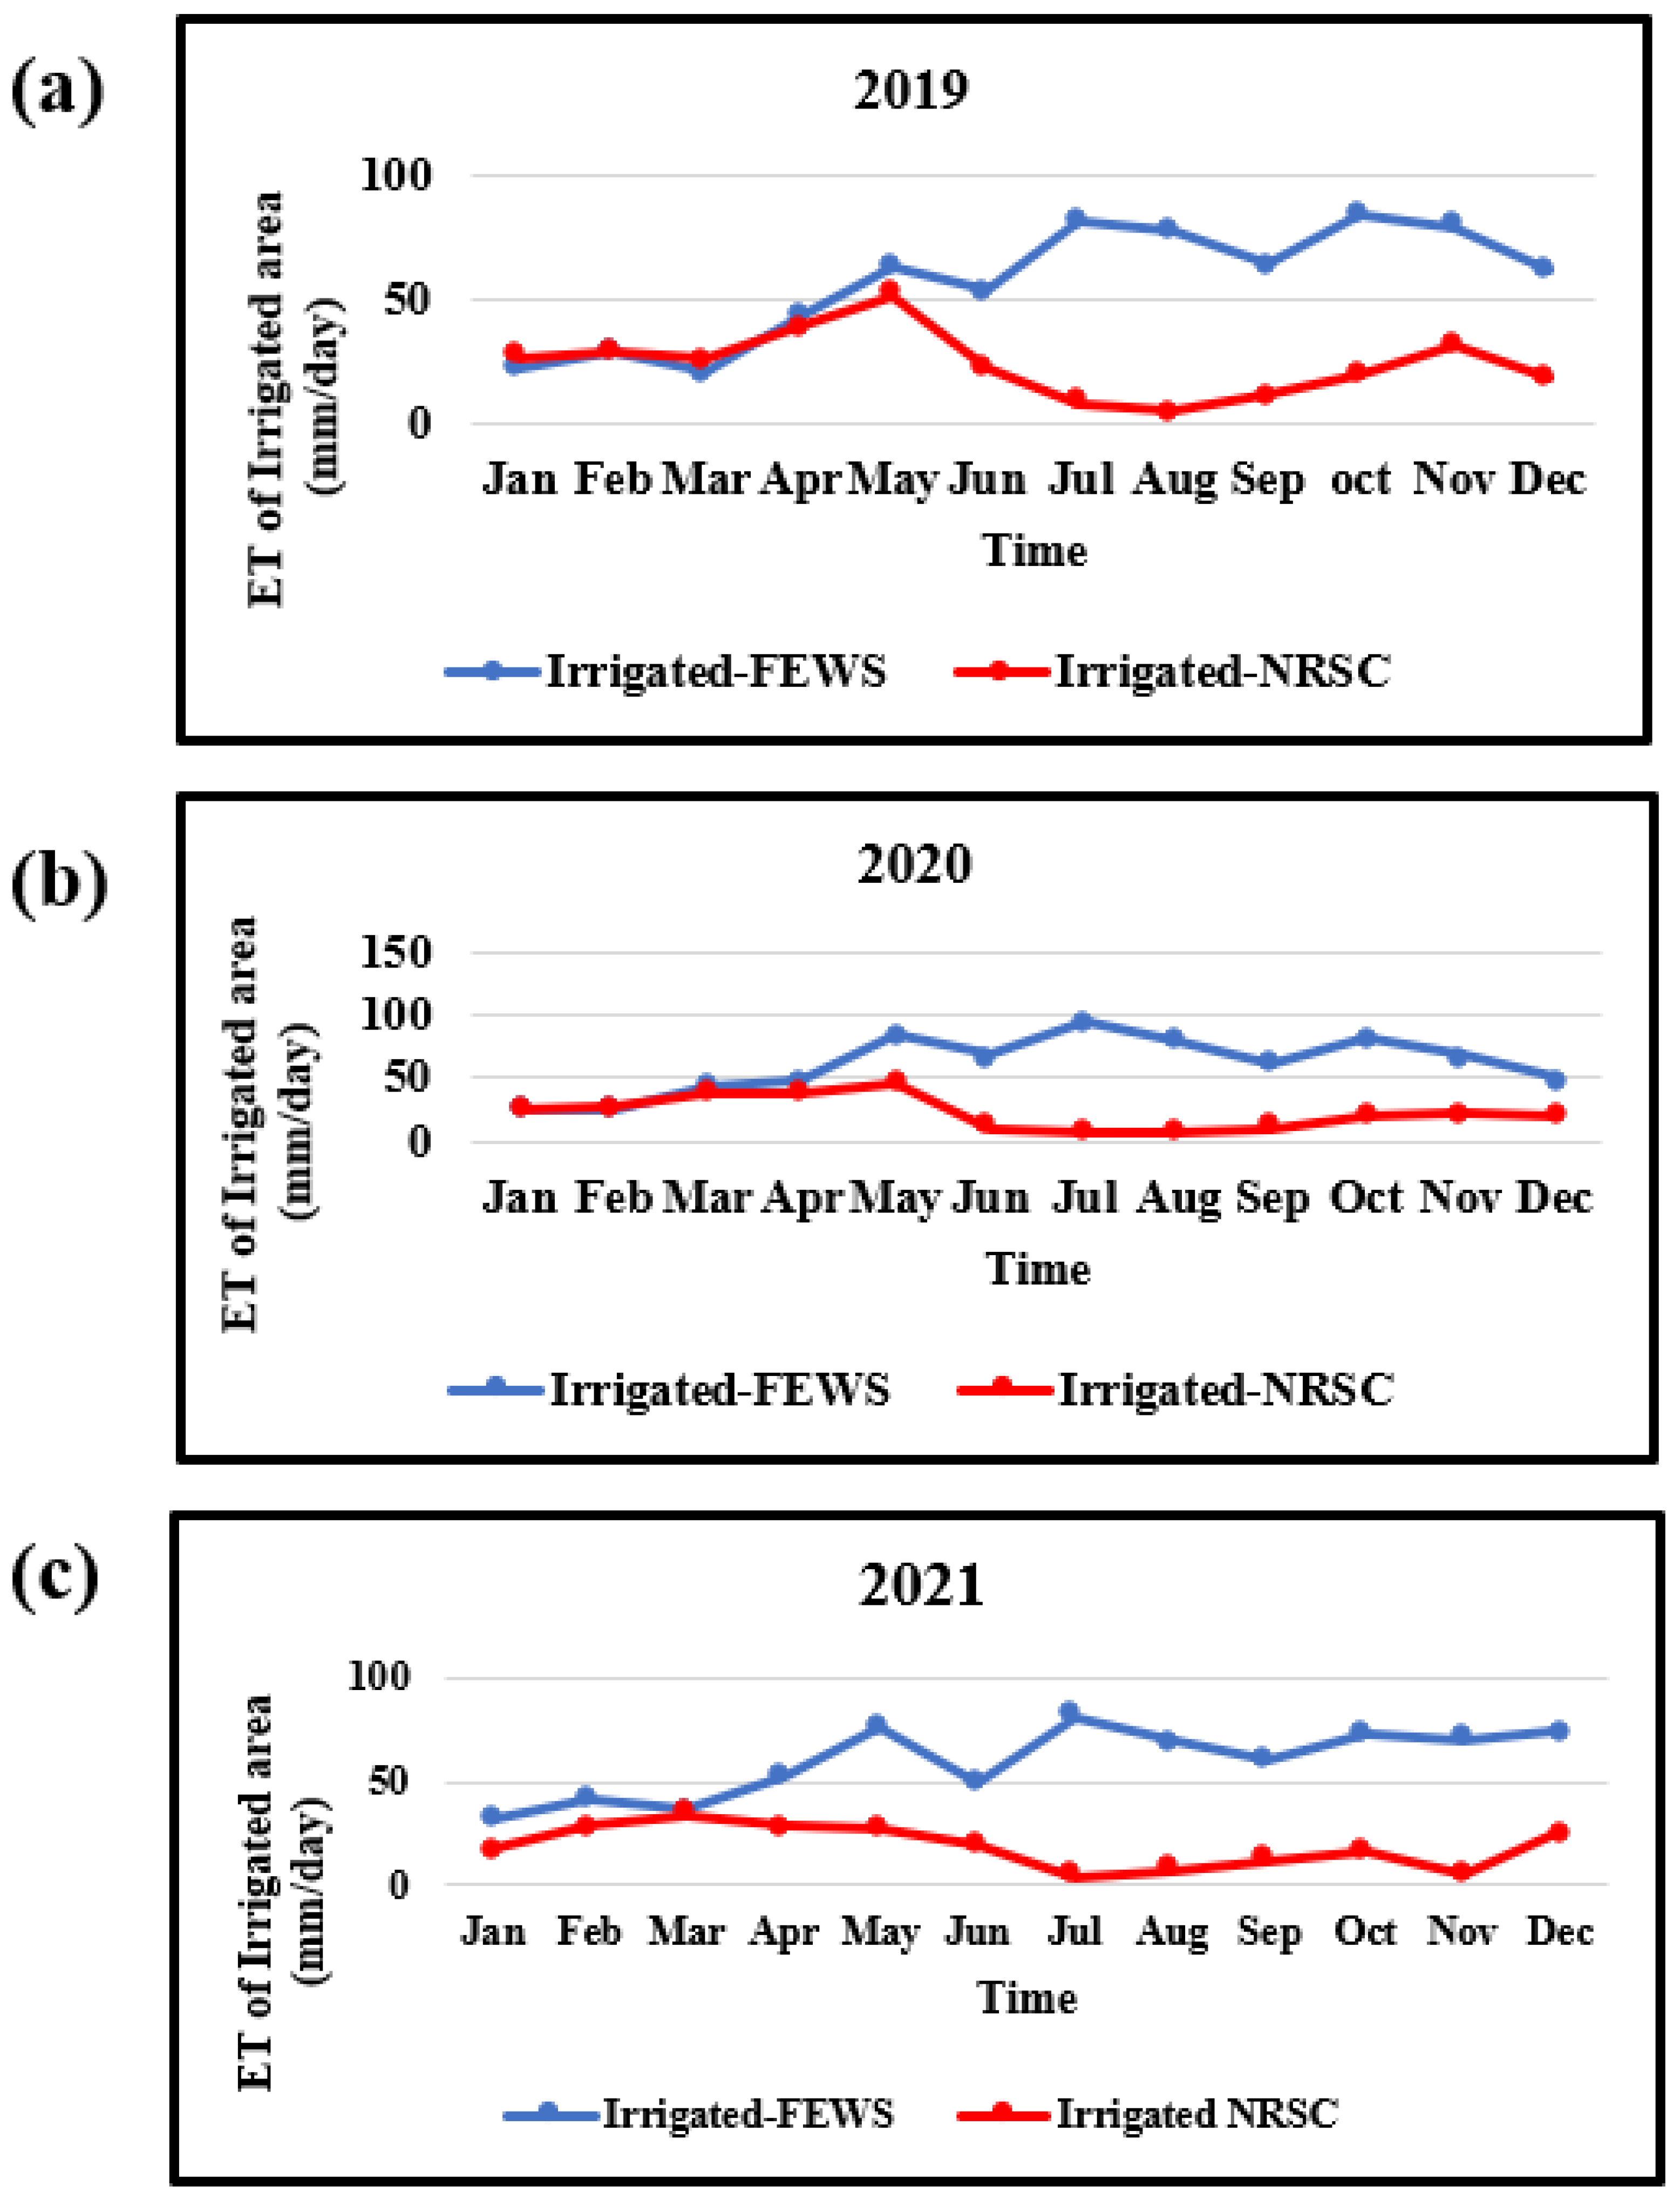
Since a proper conclusion was not drawn from the pixel method, a sub-basin-wise comparison method was carried out. From all ten sub-basins, ETa was extracted (via zonal statistics), and irrigated-area values were compared in graphical format. A sample of one of the ten sub-basins (sub-basin 1) is shown in Figure 7a–c. Although NRSC data were very promising, FEWS data turned out to be more usable due to their availability in all seasons. In crop-growing seasons, FEWS data showed comparatively higher ETa values as compared to NRSC data. For 2019, a total of 681.6 mm irrigated-area ETa was observed from FEWS data, and 288.4 mm was observed from NRSC data. For 2020, a total of 730.8 mm irrigated ETa was observed from FEWS data, and 274 mm was observed for NRSC data and from 2021, a total of 719.1 mm was observed for FEWS data, and 225.1 was observed for NRSC data, which is comparatively low considering the size of the sub-basin. From the seamless continuity of data, it can be concluded that FEWS data are more usable compared to NRSC data. Hence, for further analysis, FEWS yearly data were used.
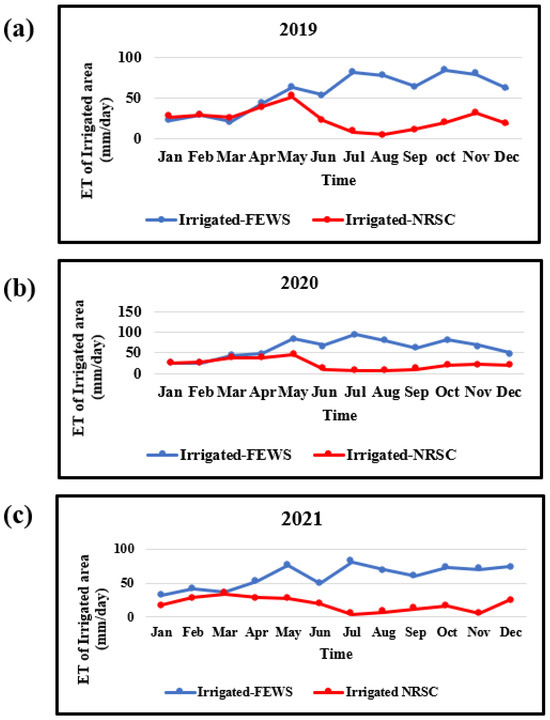
Figure 7.
Irrigated ET for sub-basin 1 for year (a) 2019, (b) 2020, and (c) 2021.
Out of all ten sub-basins, the 10th basin, which lies in the lower Cauvery River, had the highest annual evapotranspiration of 1168.3 mm in 2019, 1334.7 mm in 2020, and 1277.4 mm in 2021, whereas the third basin, which lies in upper Cauvery River basin, has the lowest evapotranspiration of 567.6 mm in 2019, 579.1 mm in 2020, and 551.1 mm in 2021. Once FEWS data were finalized, yearly data were downloaded from them, and a relationship with crop yield was established. In the above analysis, evapotranspiration of irrigated areas was taken because further research work is focused on crop yield. Hence, irrigated-area ETa must be crosschecked for accurate results.
3.3. Establishing Relationship between Crop Yield and Evapotranspiration
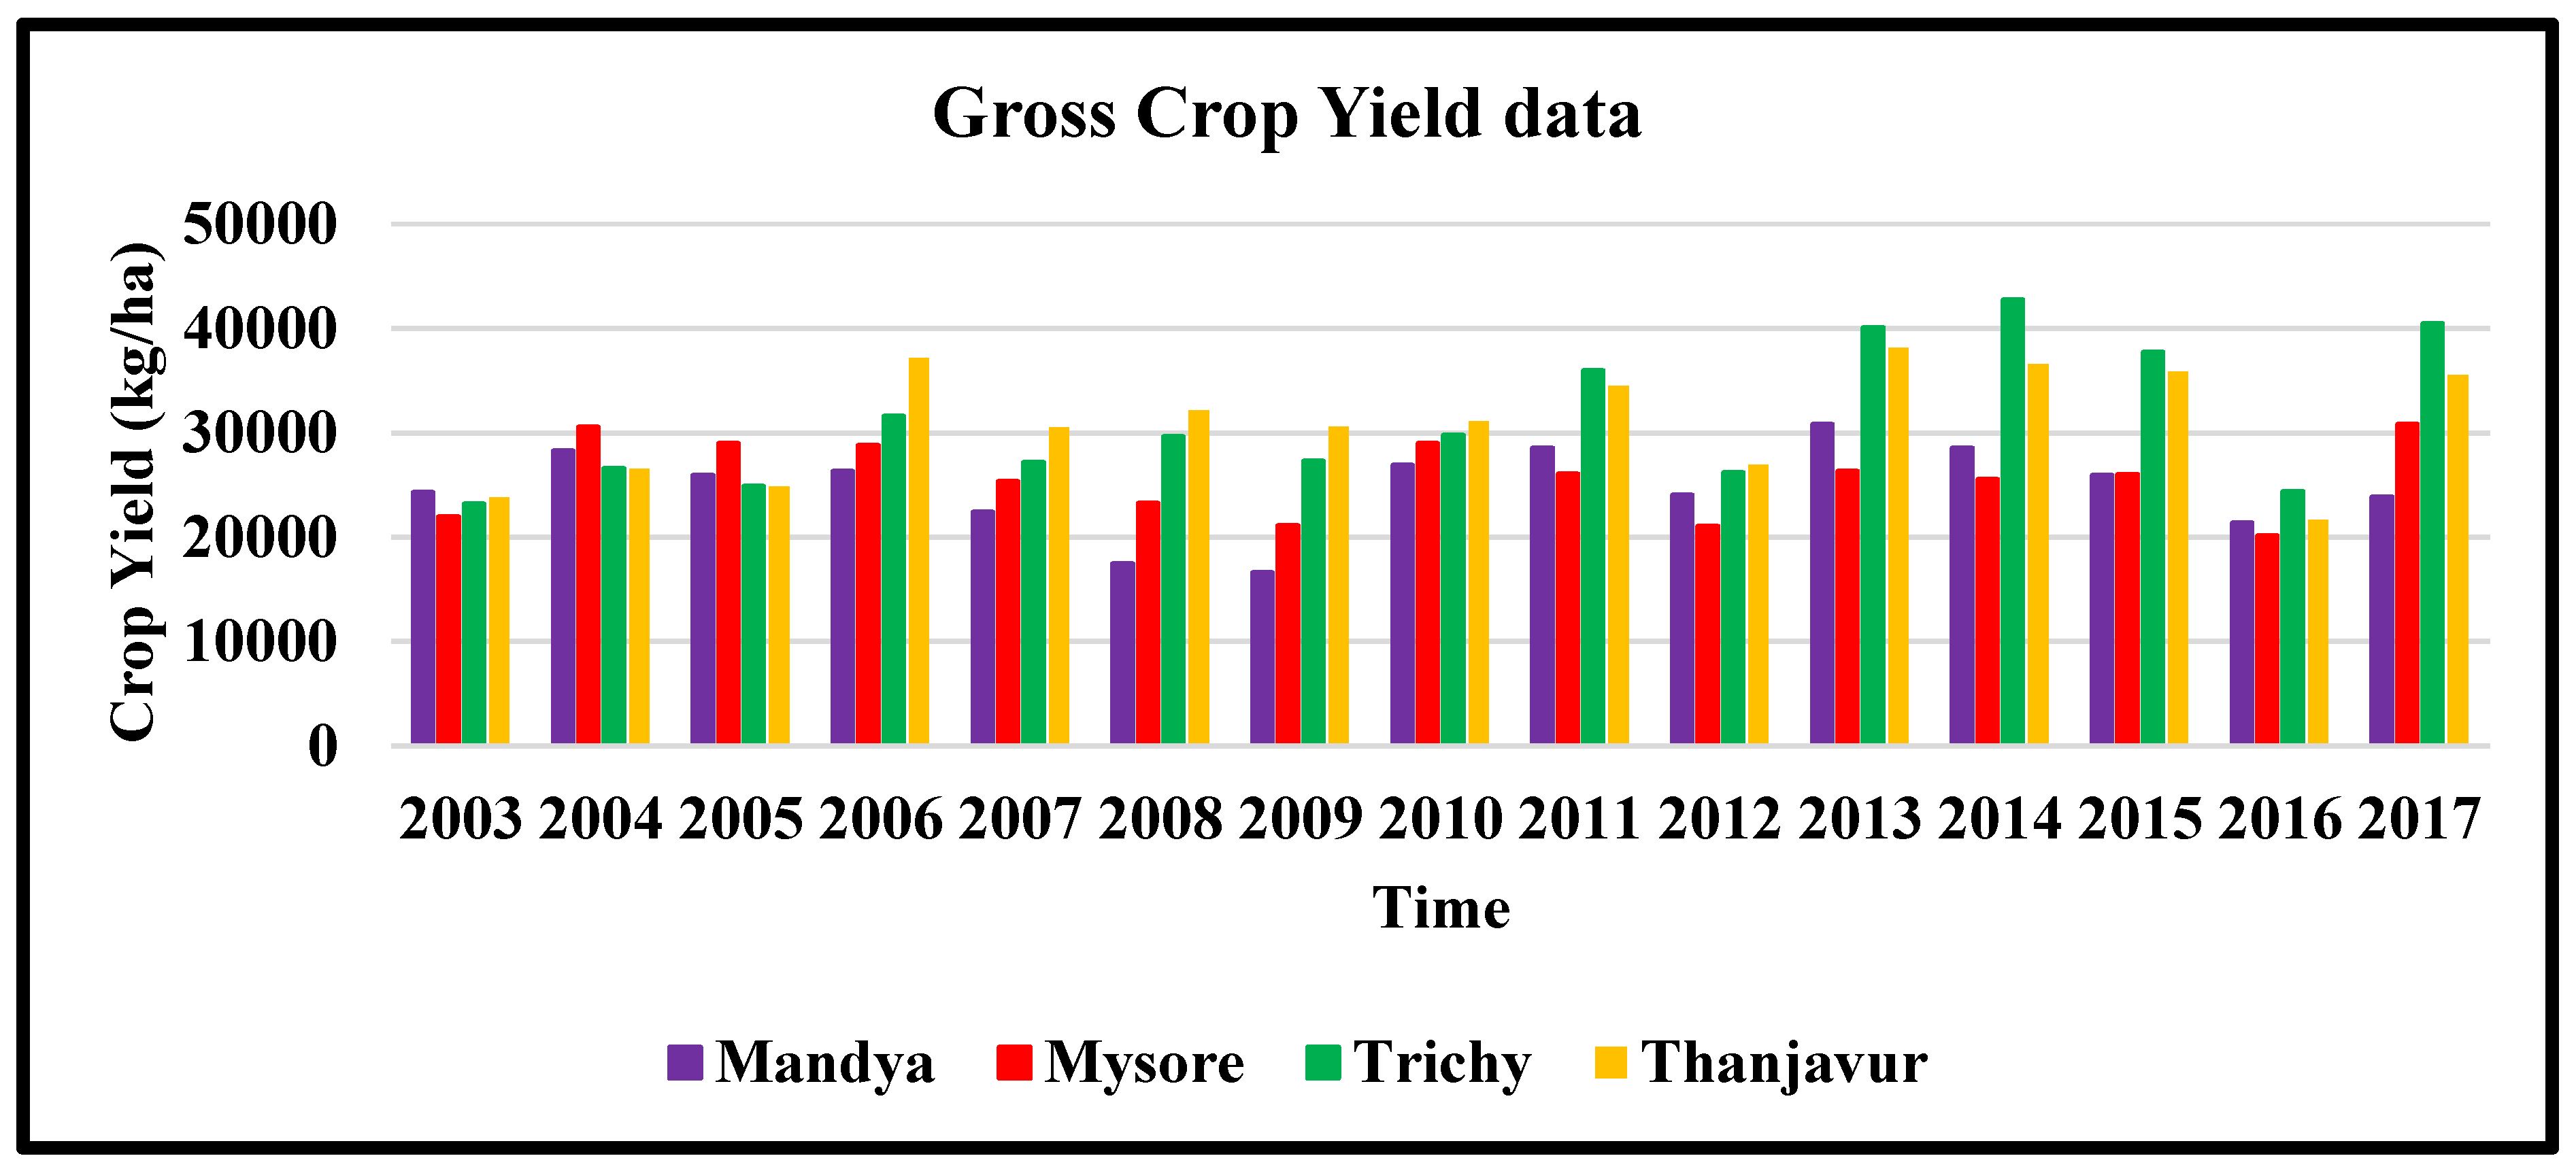
After finalizing the data source, yearly actual evapotranspiration and evapotranspiration anomaly data were downloaded from the USGS FEWS website for further research. Analysis was carried out on four different districts of the Cauvery River basin, i.e., Mysore, Mandya, Tiruchirappalli, and Thanjavur mean ETa extracted after zonal statistics for 15 years (2003–2017) of all four districts are shown in Table 2. The assessment of the crop-yield statistics in the Cauvery River basin revealed a steady rise in yearly output, suggesting a long-term rising tendency (Figure 8). The combined remotely sensed data and water–carbon couple model with crop-growth simulation models for the period 2001 to 2018 indicates wheat water productivity with a significantly increased trend [4]. The impact of climate variability and changing cropping patterns on ET and yield demonstrated that accurate ET estimation helps in managing water resources and predicting yields, highlighting the importance of integrating ET data in agricultural management [5]. Machine-learning models using ground-based data, satellite-derived ET, and vegetation indices indicated that incorporating ET data significantly improves the accuracy of yield predictions [24].
Table 2.
Values of ETa across all four districts of Mandya, Mysore, Tiruchirappalli, and Thanjavur in the Cauvery Basin.
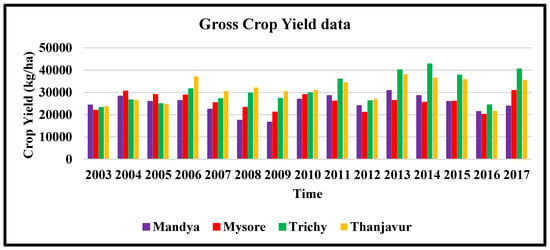
Figure 8.
Variation of Crop Yield of all four districts.
This potential improvement in output may result from better farm-management practices, such as the application of fertilizer and pesticides and the development of more efficient farming techniques through agricultural extension. Crop yield and ETa products of each district were arranged in an order, and the R2 value was found using regression analysis. Results showed a moderate correlation (12 < R2 < 56). Table 3 shows the respective correlation values between actual evapotranspiration of irrigated areas and crop yield of all districts, whereas Table 3 shows the correlation between evapotranspiration anomaly and crop yield of all districts.
Table 3.
Correlation between ET products and Crop Yield.
ET anomaly showed a better correlation than ETa because the low or high value of anomaly depends upon the biomass produced, which directly depends upon the crop yield in irrigated areas. The results showed that different zones have different correlations with ET products. A few zones showed good correlation, whereas a few showed moderate values. Results of the analysis indicated that Mandya district crop yield has a 34.04% correlation with actual evapotranspiration, with a 55% correlation with ET anomaly. Mysore district crop yield showed a 19.27% correlation with ETa, with a 41.8% correlation with ET anomaly. The Trichy district showed crop yield has a 25.58% correlation with ETa, with a 30.21% correlation with ET anomaly, and the Thanjavur district crop yield showed a 12.36% correlation with ETa with a 35.17% correlation with ET anomaly. It was assumed that the ETa model could be influenced by the elevation heterogeneity of the zones [31]. Based on this assumption, the effects of elevation on the correlation coefficients of ETa and crop-yield data were investigated. Hence, more research and investigation are needed for a better explanation of the variation of R2 value with the change in area.
4. Summary and Conclusions
This study investigated the relationship between evapotranspiration and crop yield in the Cauvery Basin of India. The basin has limited field observations, and hence, remote-sensing-based energy-balance simulation results were extensively used. The seasonal ETa model and products predicted potential yield in the main cereal-growing zones with a relatively high degree of accuracy. The correlation between crop yield and ETa for selected districts within the Cauvery River basin was between 12 to 35%, and the correlation between crop yield and ET anomaly was between 35 to 55%. However, several factors and potential errors could have an impact on the study’s findings. One of the most important factors is the data quality of ETa and crop yields, which includes poor (realistically inaccurate) and missing data, as well as biases/errors in the estimating methods. The ETa model has a flaw in its estimation of actual evapotranspiration. Significant errors may occur, for example, as a result of a bias in the use of a constant pre-defined differential temperature between the hot/dry and cold/wet boundary conditions for each pixel [31]. The ICRISAT estimate of crop-yield data were the only “ground observation” used in this study. Despite efforts to improve crop-yield estimation in India, the analyses in this study revealed that cereal-yield estimates for districts differed significantly from neighboring zones. On the other hand, it is widely acknowledged that farming practices such as land preparation, seeding timing, and crop and water management have a significant impact on cereal and other crop yields [42]. Future research may incorporate these factors to improve the relationship and applicability of ETa products in crop-yield estimation. Moreover, the lack of crop-yield data for many districts in the Cauvery River basin limited the study’s analyses and may have introduced errors in the results. Besides that, the crop-yield data were only for the last 15 years. With long records of historical crop-yield data, the results of this study are expected to improve significantly. Crop-yield data availability in high-resolution raster format would have produced better results since raw Excel data failed to show the pixel-wise variability of crop yield. In conclusion, studies relating to evapotranspiration and crop water demand to crop yield for the present and future climate-change conditions are crucial at field and sub-basin scales for this basin.
Author Contributions
Conceptualization, V.R.K. and V.S.; Data curation, A.A., V.R.K. and V.S.; Formal analysis, A.A.; Investigation, A.A., V.R.K. and V.S.; Methodology, A.A., V.R.K. and V.S.; Software, A.A.; Visualization, A.A., V.R.K. and V.S.; Writing—original draft, A.A.; Writing—review and editing., A.A., V.R.K. and V.S.; Project administration, V.R.K. and V.S.; Resources, A.A., V.R.K. and V.S.; Software, V.S. and V.R.K.; Supervision, V.S. and V.R.K.; Validation, A.A., V.R.K. and V.S.; Visualization, A.A., V.R.K. and V.S. All authors have read and agreed to the published version of the manuscript.
Funding
The corresponding author was funded by the United States India Educational Foundation as Fulbright–Nehru senior scholar.
Data Availability Statement
Simulated and post-processed model results are illustrated in Figures, and Tables will be available upon request.
Acknowledgments
The corresponding author’s (V. Sridhar) effort was funded in part by the Virginia Agricultural Experiment Station (Blacksburg) and through the Hatch Program of the National Institute of Food and Agriculture at the United States Department of Agriculture (Washington, DC).
Conflicts of Interest
The authors declare no conflicts of interest.
References
- Allen, R.G.; Pereira, L.S.; Raes, D.; Smith, M. Crop Evapotranspiration—Guidelines for Computing Crop Water Requirements—FAO Irrigation and Drainage Paper 56; FAO: Rome, Italy, 1999; pp. 27–41. Available online: https://www.fao.org/3/x0490e/x0490e00.htm (accessed on 10 January 2022).
- Allen, R.G.; Pereira, L.S.; Smith, M.; Raes, D.; Wright, J.L.L. FAO-56 dual crop coefficient method for estimating evaporation from soil and application extensions. J. Irrig. Drain. Eng. 2005, 131, 2–13. [Google Scholar] [CrossRef]
- Brutsaert, W.; Parlange, M.B. Hydrologic cycle explains the evaporation paradox. Nature 1998, 396, 30. [Google Scholar] [CrossRef]
- Wang, X.; Lei, H.; Li, J.; Huo, Z.; Zhang, Y.; Qu, Y. Estimating evapotranspiration and yield of wheat and maize croplands through a remote sensing-based model. Agric. Water Manag. 2023, 282, 108294. [Google Scholar] [CrossRef]
- Xue, J.; Huo, Z.; Kisekka, I. Assessing impacts of climate variability and changing cropping patterns on regional evapotranspiration, yield and water productivity in California’s San Joaquin watershed. Agric. Water Manag. 2021, 250, 106852. [Google Scholar] [CrossRef]
- Sehgal, V.; Sridhar, V. Watershed-scale retrospective drought analysis and seasonal forecasting using multi-layer, high-resolution simulated soil moisture for Southeastern U.S. Weather Clim. Extrem. 2019, 23, 100191. [Google Scholar] [CrossRef]
- Gowda, P.H.; Chavez, J.L.; Colaizzi, P.D.; Evett, S.R.; Howell, T.A.; Tolk, J.A. ET mapping for agricultural water management: Present status and challenges. Irrigat. Sci. 2008, 26, 223–237. [Google Scholar] [CrossRef]
- Irmak, S. Maize response to different subsurface drip irrigation management strategies: Yield, production functions, basal and crop evapotranspiration. Agric. Water Manag. 2024, 300, 108927. [Google Scholar] [CrossRef]
- Srivastava, A.; Sahoo, B.; Raghuwanshi, N.S.; Singh, R. Evaluation of Variable Infiltration Capacity model and MODIS-Terra satellite-derived grid-scale evapotranspiration estimates in a river basin with tropical monsoon-type climatology. J. Irrig. Drain. Eng. 2017, 143, 04017028. [Google Scholar] [CrossRef]
- Jaksa, W.T.; Sridhar, V.; Huntington, J.L.; Khanal, M. Evaluation of the Complementary Relationship using Noah Land Surface Model and North American Regional Reanalysis (NARR) Data to Estimate Evapotranspiration in Semiarid Ecosystems. J. Hydrometeorol. 2013, 14, 345–359. [Google Scholar] [CrossRef]
- Jaksa, W.T.A.; Sridhar, V. Effect of irrigation in simulating long-term evapotranspiration climatology in a human-dominated river basin system. Agric. For. Meteorol. 2015, 200, 109–118. [Google Scholar] [CrossRef]
- Crago, R.; Crowley, R. Complementary relationships for near-instantaneous evaporation. J. Hydrol. 2005, 300, 199–211. [Google Scholar] [CrossRef]
- Sridhar, V.; Elliott, R.L.; Chen, F. Scaling effects on modeled surface energy balance components using the Noah Land Surface Model. J. Hydrol. 2003, 280, 105–123. [Google Scholar] [CrossRef]
- Wang, Y.; Xu, X.; Huang, L.; Yang, G.; Fan, L.; Wei, P.; Chen, G. An improved CASA model for estimating winter wheat yield from remote sensing images. Remote Sens. 2019, 11, 1088. [Google Scholar] [CrossRef]
- Tadesse, T.; Demisse, G.B.; Zaitchik, B.; Dinku, T. Satellite-based hybrid drought monitoring tool for prediction of vegetation condition in Eastern Africa: A case study for Ethiopia. Water Resour. Res. 2014, 50, 2176–2190. [Google Scholar] [CrossRef]
- Lee, S.-H.; Lee, J.-H.; Kim, B.-Y. Estimation of turbulent sensible heat and momentum fluxes over a heterogeneous urban area using a large aperture scintillometer. Adv. Atmos. Sci. 2015, 32, 1092. [Google Scholar] [CrossRef]
- Rathod, P.; Manekar, M. Estimation of Pan Evaporation and Actual Evapotranspiration Using GIS and Remote Sensing. In Development of Water Resources in India; Garg, V., Singh, V., Raj, V., Eds.; Water Science and Technology Library; Springer: Cham, Switzerland, 2017; Volume 75. [Google Scholar] [CrossRef]
- Trezza, R. Evapotranspiration Using a Satellite-Based Surface Energy Balance with Standardized Ground Control; Utah State University: Logan, UT, USA, 2002; Volume 715, Available online: https://digitalcommons.usu.edu/etd/715 (accessed on 10 January 2022).
- Xiong, Y.; Zhao, S.; Yin, J.; Li, C.; Qiu, G. Effects of evapotranspiration on regional land surface temperature in an arid oasis based on thermal remote sensing. IEEE Geosci. Remote Sens. Lett. 2016, 13, 1885–1889. [Google Scholar] [CrossRef]
- Sharma, A.; Sen, S. Droughts risk management strategies and determinants of preparedness: Insights from Madhya Pradesh, India. Nat. Hazards 2022, 114, 2243–2281. [Google Scholar] [CrossRef]
- Zhao, X.; Xia, H.; Pan, L.; Song, H.; Niu, W.; Wang, R.; Li, R.; Bian, X.; Guo, Y.; Qin, Y. Drought monitoring over Yellow River basin from 2003–2019 using reconstructed MODIS land surface temperature in Google Earth Engine. Remote Sens. 2021, 13, 3748. [Google Scholar] [CrossRef]
- Dirmeyer, P.A. Vegetation stress feedback mechanism in midlatitude drought. J. Clim. 1994, 7, 1463–1483. [Google Scholar] [CrossRef]
- Tadesse, T.; Haile, G.; Knutson, C.; Wardlow, B.D. Building integrated drought monitoring and food security systems in sub-Saharan Africa. U. N. Nat. Res. 2008, 32, 303–316. [Google Scholar]
- Jahromi, M.N.; Zand-Parsa, S.; Razzaghi, F.; Jamshidi, S.; Didari, S.; Doosthosseini, A.; Pourghasemi, H.R. Developing machine learning models for wheat yield prediction using ground-based data, satellite-based actual evapotranspiration and vegetation indices. Eur. J. Agron. 2023, 146, 126820. [Google Scholar] [CrossRef]
- Vicente-Serrano, S.M.; Beguería, S.; Eklundh, L.; Gimeno, G.; Weston, D.; Kenawy, A.E.; López-Moreno, J.I.; Nieto, R.; Ayenew, T.; Konte, D.; et al. Challenges for drought mitigation in Africa: The potential use of geospatial data and drought information systems. Appl. Geogr. 2012, 34, 471–486. [Google Scholar] [CrossRef]
- Brown, J.F.; Wardlow, B.D.; Tadesse, T.; Hayes, M.J.; Reed, B.C. The Vegetation Drought Response Index (VegDRI): A new integrated approach for monitoring drought stress in vegetation. GISci. Remote Sens. 2008, 45, 16–46. [Google Scholar] [CrossRef]
- Tadesse, T.; Wardlow, B.D.; Hayes, M.J.; Svoboda, M.D.; Brown, J.F. The vegetation condition outlook (VegOut): A new method for predicting vegetation seasonal greenness. GISci. Remote Sens. 2010, 47, 25–52. [Google Scholar] [CrossRef]
- Anderson, M.C.; Norman, J.M.; Mecikalski, J.R.; Otkin, J.P.; Kustas, W.P. A climatological study of evapotranspiration and moisture stress across the continental U.S. based on thermal remote sensing: I. Model formulation. J. Geophy. Res. 2007, 112, 117. [Google Scholar] [CrossRef]
- Baburao, K.; Kilic, A.; Hubbard, K. Estimating Crop Coefficients Using Remote Sensing-Based Vegetation Index. Remote Sens. 2013, 5, 1588–1602. [Google Scholar] [CrossRef]
- Bastiaanssen, W.G.M.; Noordman, E.J.M.; Pelgrum, H.; Davids, G.; Thoreson, B.P.; Allen, R.G. SEBAL model with remotely sensed data to improve water-resources management under actual field conditions. J. Irrig. Drain. Eng. 2005, 131, 85–93. [Google Scholar] [CrossRef]
- Senay, G.B.; Budde, M.E.; Verdin, J.P. Enhancing the simplified surface energy balance (SSEB) approach for estimating landscape ET: Validation with the METRIC model. Agric. Water Manag. 2011, 98, 606–618. [Google Scholar] [CrossRef]
- Sridhar, V.; Hubbard, K.G.; Wedin, D.A. Assessment of soil moisture dynamics of the Nebraska Sandhills using Long-Term measurements and a hydrology model. J. Irrig. Drain. Eng. 2006, 132, 463–473. [Google Scholar] [CrossRef]
- Sridhar, V.; Wedin, D.A. Hydrological behavior of Grasslands of the Sandhills: Water and Energy Balance Assessment from Measurements, Treatments and Modeling. Ecohydrology 2009, 2, 195–212. [Google Scholar] [CrossRef]
- Kumar, U.; Rashmi; Chatterjee, C.; Raghuwanshi, N.S. Comparative Evaluation of Simplified Surface Energy Balance Index-Based Actual ET against Lysimeter Data in a Tropical River Basin. Sustainability 2021, 13, 13786. [Google Scholar] [CrossRef]
- Seneviratne, S.I.; Corti, T.; Davin, E.L.; Hirschi, M.; Jaeger, E.B.; Lehner, I.; Orlowsky, B.; Teuling, A.J. Investigating soil moisture–climate interactions in a changing climate: A review. Earth Sci. Rev. 2010, 99, 125–161. [Google Scholar] [CrossRef]
- Senay, G.B.; Bohms, S.; Singh, R.K.; Gowda, P.H.; Velpuri, N.M.; Alemu, H.; Verdin, J.P. Operational evapotranspiration mapping using remote sensing and weather datasets: A new parameterization for the SSEB approach. J. Am. Water Res. Assoc. 2013, 49, 577–591. [Google Scholar] [CrossRef]
- Senay, G.B.; Budde, M.; Verdin, J.P.; Melesse, A.M. A coupled remote sensing and simplified surface energy balance approach to estimate actual evapotranspiration from irrigated fields. Sensors 2007, 7, 979–1000. [Google Scholar] [CrossRef]
- Senay, G.B.; Kagone, S.; Velpuri, M.N. Operational Global Actual Evapotranspiration: Development, Evaluation, and Dissemination. Sensors 2020, 8, 1915. [Google Scholar] [CrossRef] [PubMed]
- Savoca, M.E.; Senay, G.B.; Maupin, M.A.; Kenny, J.F.; Perry, C.A. Actual Evapotranspiration Modeling Using the Operational Simplified Surface Energy Balance (SSEBop) Approach: U.S. Geological Survey Scientific Investigations Report; US Geological Survey: Reston, VR, USA, 2013; Volume 2013–5126, p. 16. Available online: https://pubs.usgs.gov/sir/2013/5126 (accessed on 10 January 2022).
- Chanapathi, T.; Thatikonda, S.; Keesara, R.V.; Ponguru, N. Assessment of water resources and crop yield under future climate scenarios: A case study in a Warangal district of Telangana, India. J. Earth Syst. Sci. 2020, 129, 20. [Google Scholar] [CrossRef]
- Qin, N.; Lu, Q.; Fu, G.; Wang, J.; Fei, K.; Gao, L. Assessing the drought impact on sugarcane yield based on crop water requirements and standardized precipitation evapotranspiration index. Agric. Water Manag. 2023, 275, 108037. [Google Scholar] [CrossRef]
- Pretty, J.; Toulmin, C.; Williams, S. Sustainable intensification in African agriculture. Int. J. Agric. Sustain. 2011, 9, 5–24. [Google Scholar] [CrossRef]


Disclaimer/Publisher’s Note: The statements, opinions and data contained in all publications are solely those of the individual author(s) and contributor(s) and not of MDPI and/or the editor(s). MDPI and/or the editor(s) disclaim responsibility for any injury to people or property resulting from any ideas, methods, instructions or products referred to in the content. |
© 2024 by the authors. Licensee MDPI, Basel, Switzerland. This article is an open access article distributed under the terms and conditions of the Creative Commons Attribution (CC BY) license (https://creativecommons.org/licenses/by/4.0/).