Article

Subsoiler Tool with Bio-Inspired Attack Edge for Reducing Draft Force during Soil Tillage

by
Francisco Garibaldi-Márquez
1,
Ernesto Martínez-Reyes
1,
Cornelio Morales-Morales
2,*,
Lenin Ramos-Cantú
3,*,
Mirna Castro-Bello
4 and
Armida González-Lorence
2
1
Instituto Nacional de Investigaciones Forestales, Agrícolas y Pecuarias, Campo Experimental Pabellón, Pabellon de Arteaga 20670, Aguascalientes, Mexico
2
Tecnológico Nacional de México, Instituto Tecnológico de San Juan del Río, San Juan del Rio 76800, Queretaro, Mexico
3
División Académica de Ingeniería y Arquitectura, Universidad Juárez Autónoma de Tabasco, Cunduacan 86690, Tabasco, Mexico
4
Tecnológico Nacional de México, Instituto Tecnológico de Chilpancingo, Chilpancingo 39090, Guerrero, Mexico
*
Authors to whom correspondence should be addressed.
AgriEngineering 2024, 6(3), 2678-2693; https://doi.org/10.3390/agriengineering6030156
Submission received: 17 May 2024 / Revised: 27 June 2024 / Accepted: 4 July 2024 / Published: 5 August 2024
(This article belongs to the Section Agricultural Mechanization and Machinery)

Abstract

:
To alleviate soil compaction, subsoiling practices using subsoiler implements are commonly implemented. However, subsoiler bodies are subjected to great draft forces because they work deep in the soil. Therefore, to contribute to draft force reduction, in this work, a bio-inspired attack edge for a subsoiler body based on the internal and external contour lines of the claws of the Mexican ground squirrel (Spermophilus mexicanus) is proposed. As a first step, computational fluid dynamic (CFD) modeling was used to select the best bionic subsoiler (BS) according to the draft force requirements. Then, the BS was fabricated and field-evaluated, and its real draft force during tillage was contrasted with those of a curve subsoiler (CS) and a straight subsoiler (SS). The field evaluation demonstrated that the BS demands, on average, 12.37 % and 22.25 % less draft force than the CS and SS, respectively. Additionally, the BS was better at entering the soil since its mean tillage depths were 24.86 % and 5.73 % higher than those of the SS and CS geometries, respectively. Therefore, it was found that modeling the attacking edge of a subsoiler body after the Mexican ground squirrel clearly reduced the draft force during tillage.

1. Introduction

Agricultural soil compaction decreases productivity. This mechanical phenomenon is mainly triggered by the constant traffic of machinery over crop fields due to cultural practices such as harvesting and weeding, among others [1]. Additionally, this phenomenon is more likely to occur with the transit of machinery on wet soil and soil with poor organic matter content [2]. Also, conventional tillage (CT) promotes soil compaction below the tillage layer since CT is usually implemented using moldboard plows or disc plows [3], which always cut the soil at constant and shallow depths [4]. This sort of tillage leaves the deep soil layers undisrupted, promoting the formation of a plow pan (a soil layer with high bulk density and low porosity). Compacted soils are resistant to infiltration and, therefore, retain water; further, compaction reduces the proliferation of crop roots, leading to decreased crop yield.
Subsoiling practices are commonly implemented to alleviate soil compaction in crop fields. Through these practices, the soil is cut vertically at depths between 0.3 m and 0.5 m [5]: deep enough to break up the plow pan. Consequently, crop roots grow more freely into the subsoil and absorb nutrients and water [1]. In this way, outstanding results in terms of increasing crop yields via the implementation of subsoiling have been documented. For instance, de Campos et al. [6] reported that the yield of sugar cane stalk rose to 15.3 % under a modified deep strip-tillage system (MDT) compared to CT. In the work by Zhang et al. [7], an average improvement of 36.2 % for corn grain yield was found for a deep-tillage system compared to conventional rototill tillage. In another work, Brezinščak et al. [8] observed that subsoiling significantly increased the harvest index of maize in comparison to CT or minimal tillage. However, despite the benefits of subsoiling, subsoiler tools usually demand a great deal of drawbar force because they work deep in the soil, move a substantial volume of soil, and interact with the plow pan [9].
It has been documented that the geometric shape of subsoiler tools is one of the major factors related to the energy requirement for tillage [10,11]. Early studies suggested that curved subsoilers require less draft force than that required by straight shapes and inclined straight shapes [12]. This behavior was also supported by Smith and Williford [13], in which the authors analyzed the draft force needs of parabolic, straight, and triplex subsoiler bodies. They reported that the parabolic subsoiler required 11 to 16% less draft force than the straight and triplex subsoilers. In contrast, Raper [11] et al. found that an angle-shaped tool required less draft force than a curved-shank subsoiler. In this way, the authors of early studies had to fabricate the tools before their characterization when proposing possible improvements to their geometry, which made the experiments expensive. Then, the use of computational software such as the finite element method (FEM), the discrete element method (DEM), and computational fluid dynamics (CFD) became available to support the study of tillage tools. Allowing modeling of the soil–tool interaction has made it possible to approximate the behavior that the tools would exhibit during real tillage [1,14]. Therefore, computational modeling has supported designers in choosing better subsoiler geometries before their fabrication.
In the design of subsoiler tools, the geometries that will be implemented must be carefully considered in order to significantly reduce the traction forces to which the tools will be subjected. For this reason, some designers have probed deeper into the analysis of the rake profile, the geometry of the lateral sides of the tool, and the texture of the surface of the tool; this has allowed for improvements in aerodynamics and reductions in soil adhesion over the tool surfaces. Some of the related works have been bio-inspired by analyses of animal limbs or other organs. For example, in Tong et al. [15], the texture of the shell of the beetle (Copris ochus) was found to have potential for reducing soil–tool friction and also the wear of the material of the tool. In another work, Guo et al. [16] used the FEM to model diverse subsoiler geometries that were inspired by the inside contour line of the claws of the field mouse (Citellus dauricus); lower resistance during soil cutting was reported. A similar study was carried out by Zhang et al. [17]; they extracted the upper surface outline of the claw of the house mouse (Mus musculus) for modeling subsoiler bodies by using the DEM. The authors reported a reduction in tillage resistance in the range of 8.5 % to 38.2 % compared to that for a a parabolic-geometry subsoiler. Finally, Song et al. [10] evaluated a bionic subsoiler inspired by a mole’s claws for the breaking and disturbance of the plow pan. A field test showed that the subsoiler effectively improved the looseness of the plow pan and reduced the energy demand.
The claws of digging animals have evolved according to the specific soil characteristics of their habitats, such as in the case of the Mexican ground squirrel (Spermophilus mexicanus). This squirrel species inhabits grasslands across the semiarid states of Mexico and prefers to create its burrows on non-rocky land. Its principal burrows are usually 60 to 80 mm in diameter and can reach a depth of 125 mm. In additional to its main burrow, this squirrel digs other holes in the ground daily in order to deceive its predators; therefore, this squirrel species is well adapted for digging [18]. In this sense, tillage implements should also be designed according to the edaphic properties of a region. Therefore, with the intent of reducing the drawbar force required during tillage, in this work, a bionic subsoiler (BS) is proposed, for which the attack profile is bio-inspired by the claws of the aforementioned squirrel species. For this, CFD models were used to predict the draft force of the BS. Then, the superior bionic geometry was fabricated and tested in real field environments. To report the findings, the remainder of this work is organized as follows. Section 2 describes the procedures usedfor the geometry development and test. The findings are given in Section 3, and in Section 4, this work is concluded.

2. Materials and Methods

This section presents the procedure for designing the bionic subsoiler bodies and evaluating the best geometry in an authentic field. Section 2.1 describes the extraction of the curve lines from the claws of the Mexican ground squirrel (Spermophilus mexicanus). The steps of estimating the draft force of the bionic subsoiler using numerical modeling are shown in Section 2.2. Finally, the estimation of the draft under field conditions is described in Section 2.3.

2.1. Bionic Attack-Edge of Subsoiler Bodies

To conduct this study, six Mexican ground squirrel (Spermophilus mexicanus) specimens were captured by wildlife management specialists. Figure 1a shows a sample individual of this squirrel species. Subsequently, the curves of the internal and external profiles of the central claw were determined. This procedure was performed by capturing lateral images using a Moticam camera 2300 (TSSP10P0382G) attached to the lens of a Motic stereoscope (SMZ-143). Then, the images were analyzed in Autocad 2012 as follows. First, a Cartesian plane was drawn, with an origin at the tip of each claw’s profile. Second, the claw’s profiles were carefully aligned to an angle β = 27 with respect to the abscissa and a tangent line to the profile, as shown in Figure 1b. Angle β was used for subsequent bionic subsoiler design, and its magnitude was defined based on the findings of Godwin and Spoor [19], who reported that subsoilers should be fabricated with a low rake angle to reduce draft force and achieve good penetration, but not lower than 22 . 5 , which is the soil–metal friction angle. Third, the coordinates of several points located along the internal and external profiles of the claws were extracted. In addition, the F/D ratio of the curves was also registered, where F is the maximum frontal length, and D is the maximum vertical length. Finally, the equations of the better-fitting curve to the set of Cartesian coordinates were obtained. In total, twelve equations were derived; six correspond to the internal contour lines, and six correspond to the external contour lines of the claws.
The equation that describes the curve of the claws (red line in Figure 1b) may be approximated by a polynomial of degree “n” as f ( x ) = a 0 + a 1 x + a 2 x 2 + + a n x n , n Z . Nevertheless, to better understand how the curve behaves, the curvature “ κ ” of each curve was also calculated according to Yates’ equation [20] as follows:
κ = f ( x ) 1 + ( f ( x ) ) 2 3 2
where f ( x ) is the first derivative and f ( x ) is the second derivative of the equations.
Thereafter, 3D CAD models were created. Six bionic subsoilers were designed using the internal contour lines of the claws (BS–I), and six bionic subsoilers were designed using the external contour lines of the claws (BS–E). Figure 1c shows an example of this process. It is worth mentioning that these bionic curves were scaled up to the real sizes of the shanks. Also, a commercial tip was drawn and connected to the shank for evaluating the CAD models in equal conditions.

2.2. Numerical Modeling

A numerical analysis based on CFD was used to evaluate which CAD bionic subsoiler might require lower draft force during tillage before fabrication. According to Karmakar and Kushwaha [21], the dynamic tillage process can be analyzed by considering the soil a visco-plastic material. That is, the soil is considered a non-Newtonian fluid. This sort of fluids acts like a rigid body when the magnitude of an external shear stress applied to it does not exceed the yield stress of the material. However, when this shear stress is greater than the yield stress, the material flows as a fluid [22,23]. Consequently, in the soil–tillage tool interaction, the soil is considered a flow of material, and the tillage tool is an obstacle to the flow. During tillage, the soil does not fail until the shear stress induced by the tillage tool exceeds the yield stress; after this point has been reached, a visco-plastic flow of soil occurs. At this stage, the drag pressure is the parameter that allows estimating the force applied to the tillage tool, which could be related to the force demanded by tractors’ drawbars for operation [24].

2.2.1. Governing Equations

The numerical simulation based on CFD permits investigating particle movement within certain systems through the equation of conservation of mass, whereas fields of stress distribution and velocity can be investigated through the equation of momentum conservation [23]. Hence, the soil–tillage tool flow interaction can be studied using the Navier–Stokes equations, involving no-Newtonian parameters. In this way, assuming that the mass is conserved in a control volume, then the continuity equation is expressed as follows
ρ t + x i ( ρ u i ) = 0
where ρ is the density of the fluid ( kg / m 3 ), t is time ( s ), x i is the directional displacement of the fluid ( m ), and u i is the velocity of the fluid ( m / s ).
By considering soil to be an incompressible, continuous medium with a single phase and of constant density ρ , which includes porosity, Equation (2) can be reduced to the following expression:
x i ( ρ u i ) = 0
On the other hand, by taking Newton’s second law into account, the acceleration of a fluid element and the net force that acts on it can be related in the equation of momentum conservation as follows
ρ D u i D t = ρ g P x i + τ i j x j
where D / D t is the function of the substantial or total derivative, g is the acceleration of gravity ( m / s 2 ), P is the hydrostatic pressure, and τ i j is the shear stress tensor ( Pa ).
The substantial derivative is a function of both temporal and spatial changes, expressed as follows:
D u i D t = u i t + u j u i x j
Above, Equation (5) indicates that the acceleration of the fluid element is balanced by the gravitational force, pressure, and viscous stress. In this way, parameters such as the draft force, pressure, and soil failure due to visco-plastic deformation, which are aspects of the dynamic soil–tillage tool interaction, can be addressed using the fluid flow method.
Then, the shear stress tensor in the momentum equation is equivalent to the constitutive relation of a Bingham plastic fluid, expressed as
τ i j = τ y + μ γ ˙ , for | τ i j | > τ y
γ ˙ = 0 , for | τ i j | τ y
where τ i j is the shear stress ( Pa ), τ y is the yield stress, μ the absolute viscosity ( Pa s ), and γ ˙ is the shear rate ( 1 / s ).

2.2.2. Modeling, Boundary Conditions and Soil Parameters

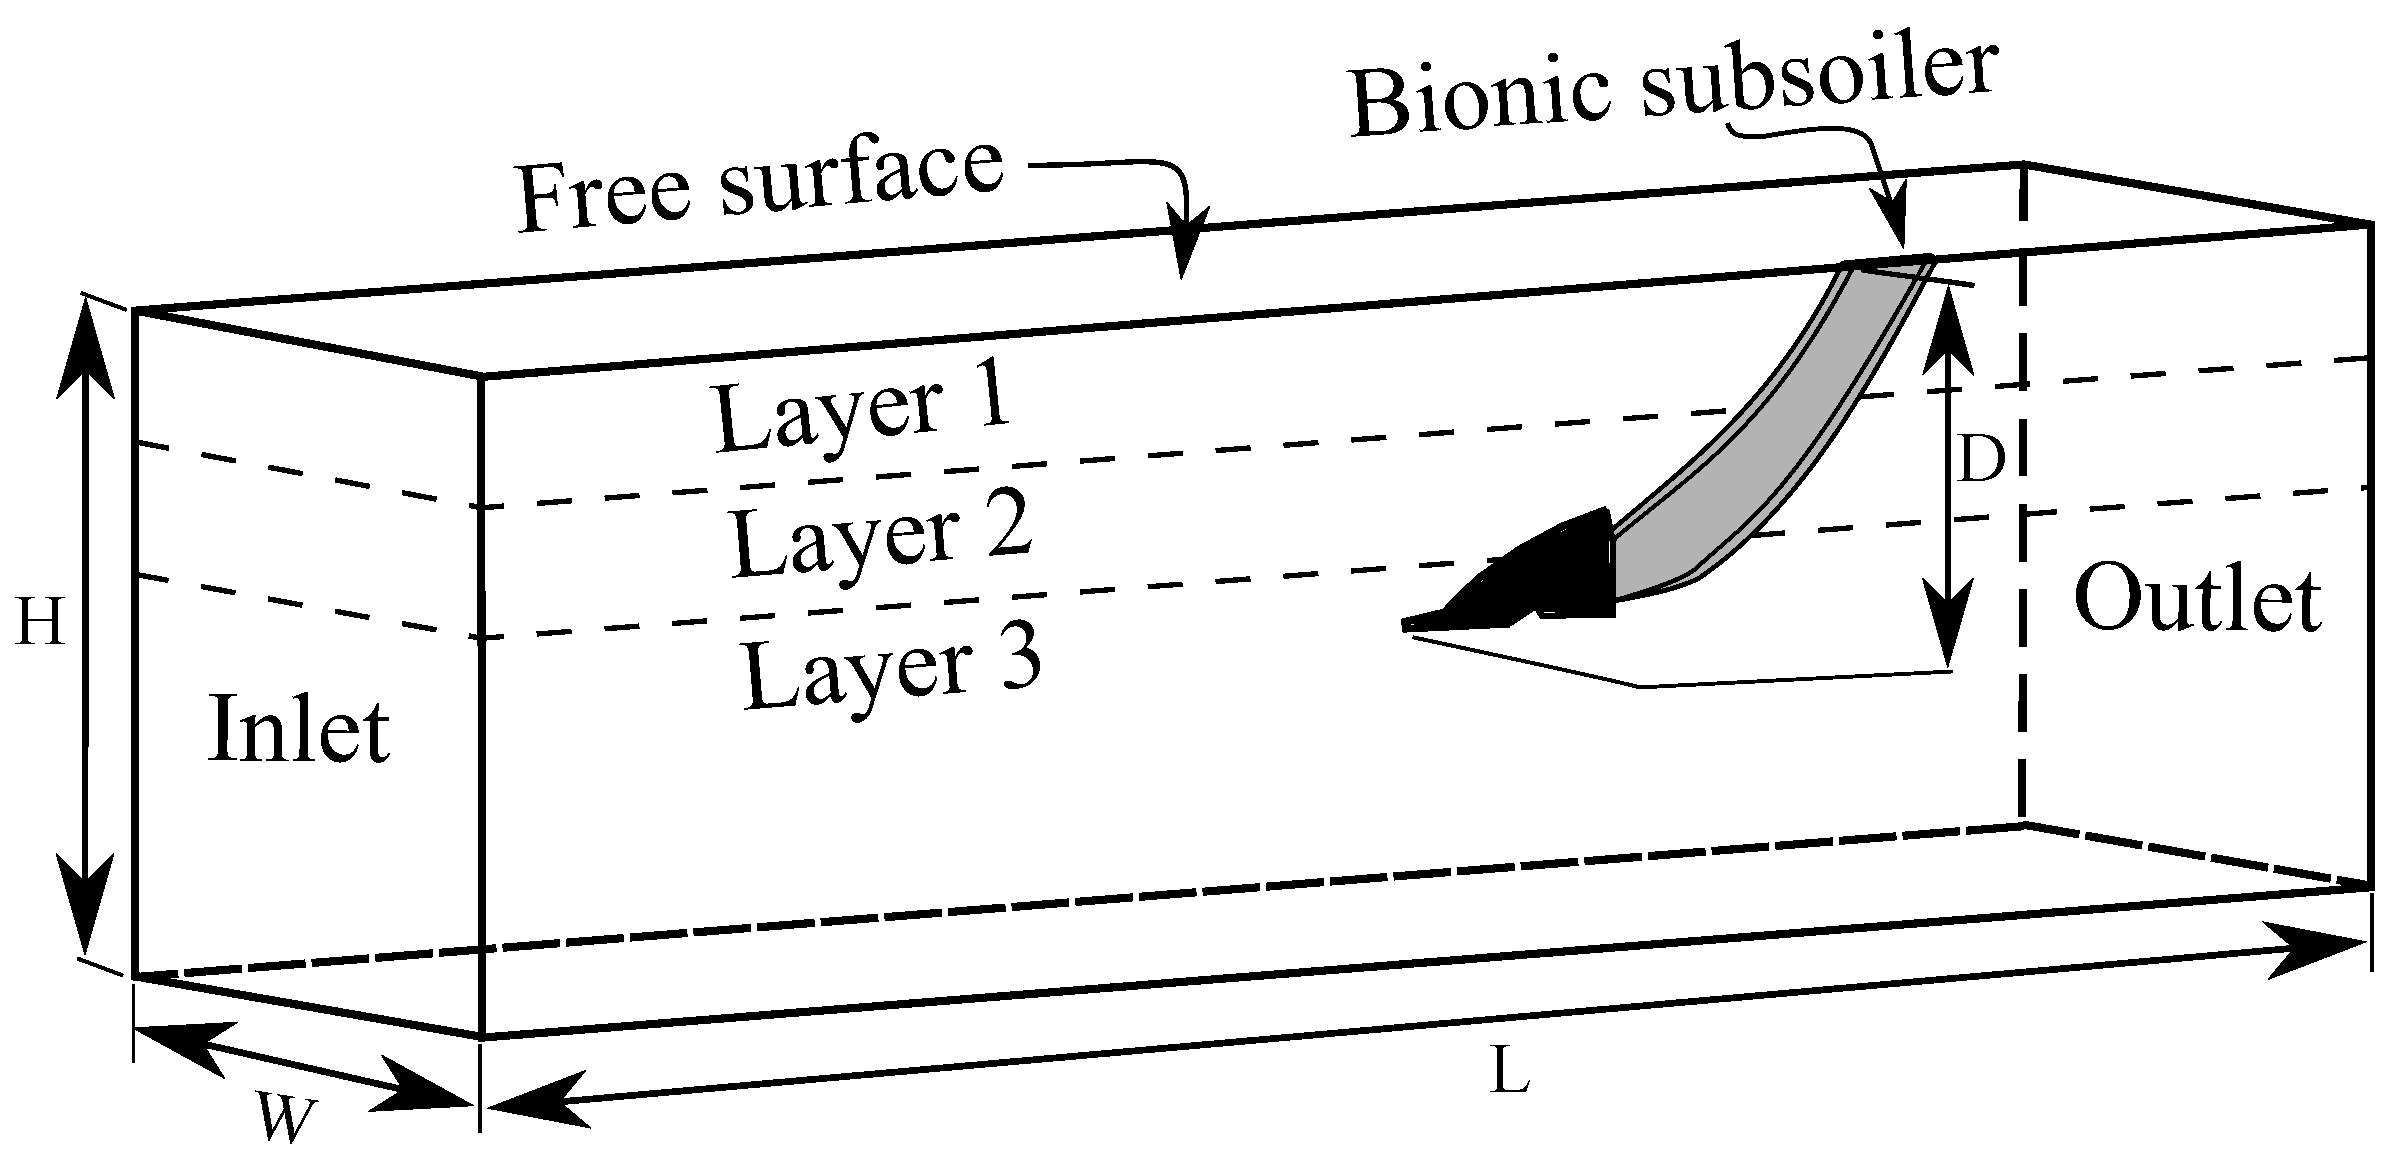
The control volume method was used for the numerical modeling of the BS. The implementation was performed in ANSYS Fluent 14.0. For this purpose, a rectangular axisymmetric soil-tool model was proposed, subdivided into three layers, where the soil was represented as a flow field of a Bingham visco-plastic material. The subsoiler was set as fixed, functioning as an obstacle to the flow (Figure 2). The dimensions of the flow field were 3 m in length (L), 0.75 m in width (W), and 0.8 m in height (H). The thickness of layer 1 and layer 2 was 0.15 m each, and it was 0.5 m for layer 3. The tip of the subsoiler was located at L/2, and the working depth (D) was set to 0.4 m.
The inlet velocities of the flow were 0.42 m/s (1.5 km/h), 0.83 m/s (3 km/h), and 1.25 m/s (4.5 km/h), and the outlet velocity was determined by the pressure. Furthermore, the interaction of the soil with the lateral sides and bottom walls was fixed (no-slip walls). The top surface was configured as a free surface at atmospheric pressure so that the soil could deform freely. Finally, the slippage of the flow in the surfaces of the tool was permitted.
The soil parameters (bulk density, moisture, cone index, yield stress, and viscosity) for numerical modeling were determined on ground located at Instituto Nacional de Investigaciones Forestales, Agrícolas y Pecuarias—Campo Experimental Pabellón (INIFAP-CEPAB), Aguascalientes, Mexico (22°11′ N, 102°20′ W). They were estimated in three soil physical layers with thicknesses of 0–0.15 m, 0.15–0.30 m, and 0.30–0.45 m. To estimate each parameter, six soil samples from the main diagonal portion of the ground were acquired, with a total of 12 samples from each soil layer.
The bulk density was estimated through the core method [25], as follows:
ρ b = M d V s
where ρ b is the soil bulk density ( kg / m 3 ), M d is the weight of the dry soil sample ( kg ), and V s is the volume of the dry soil sample ( m 3 ).
The same soil samples used for estimating the bulk density were also utilized to calculate the soil moisture content using the following expression:
W c = M w M d M d
where W c is the soil moisture content (%), and M w is the weight of the wet soil sample.
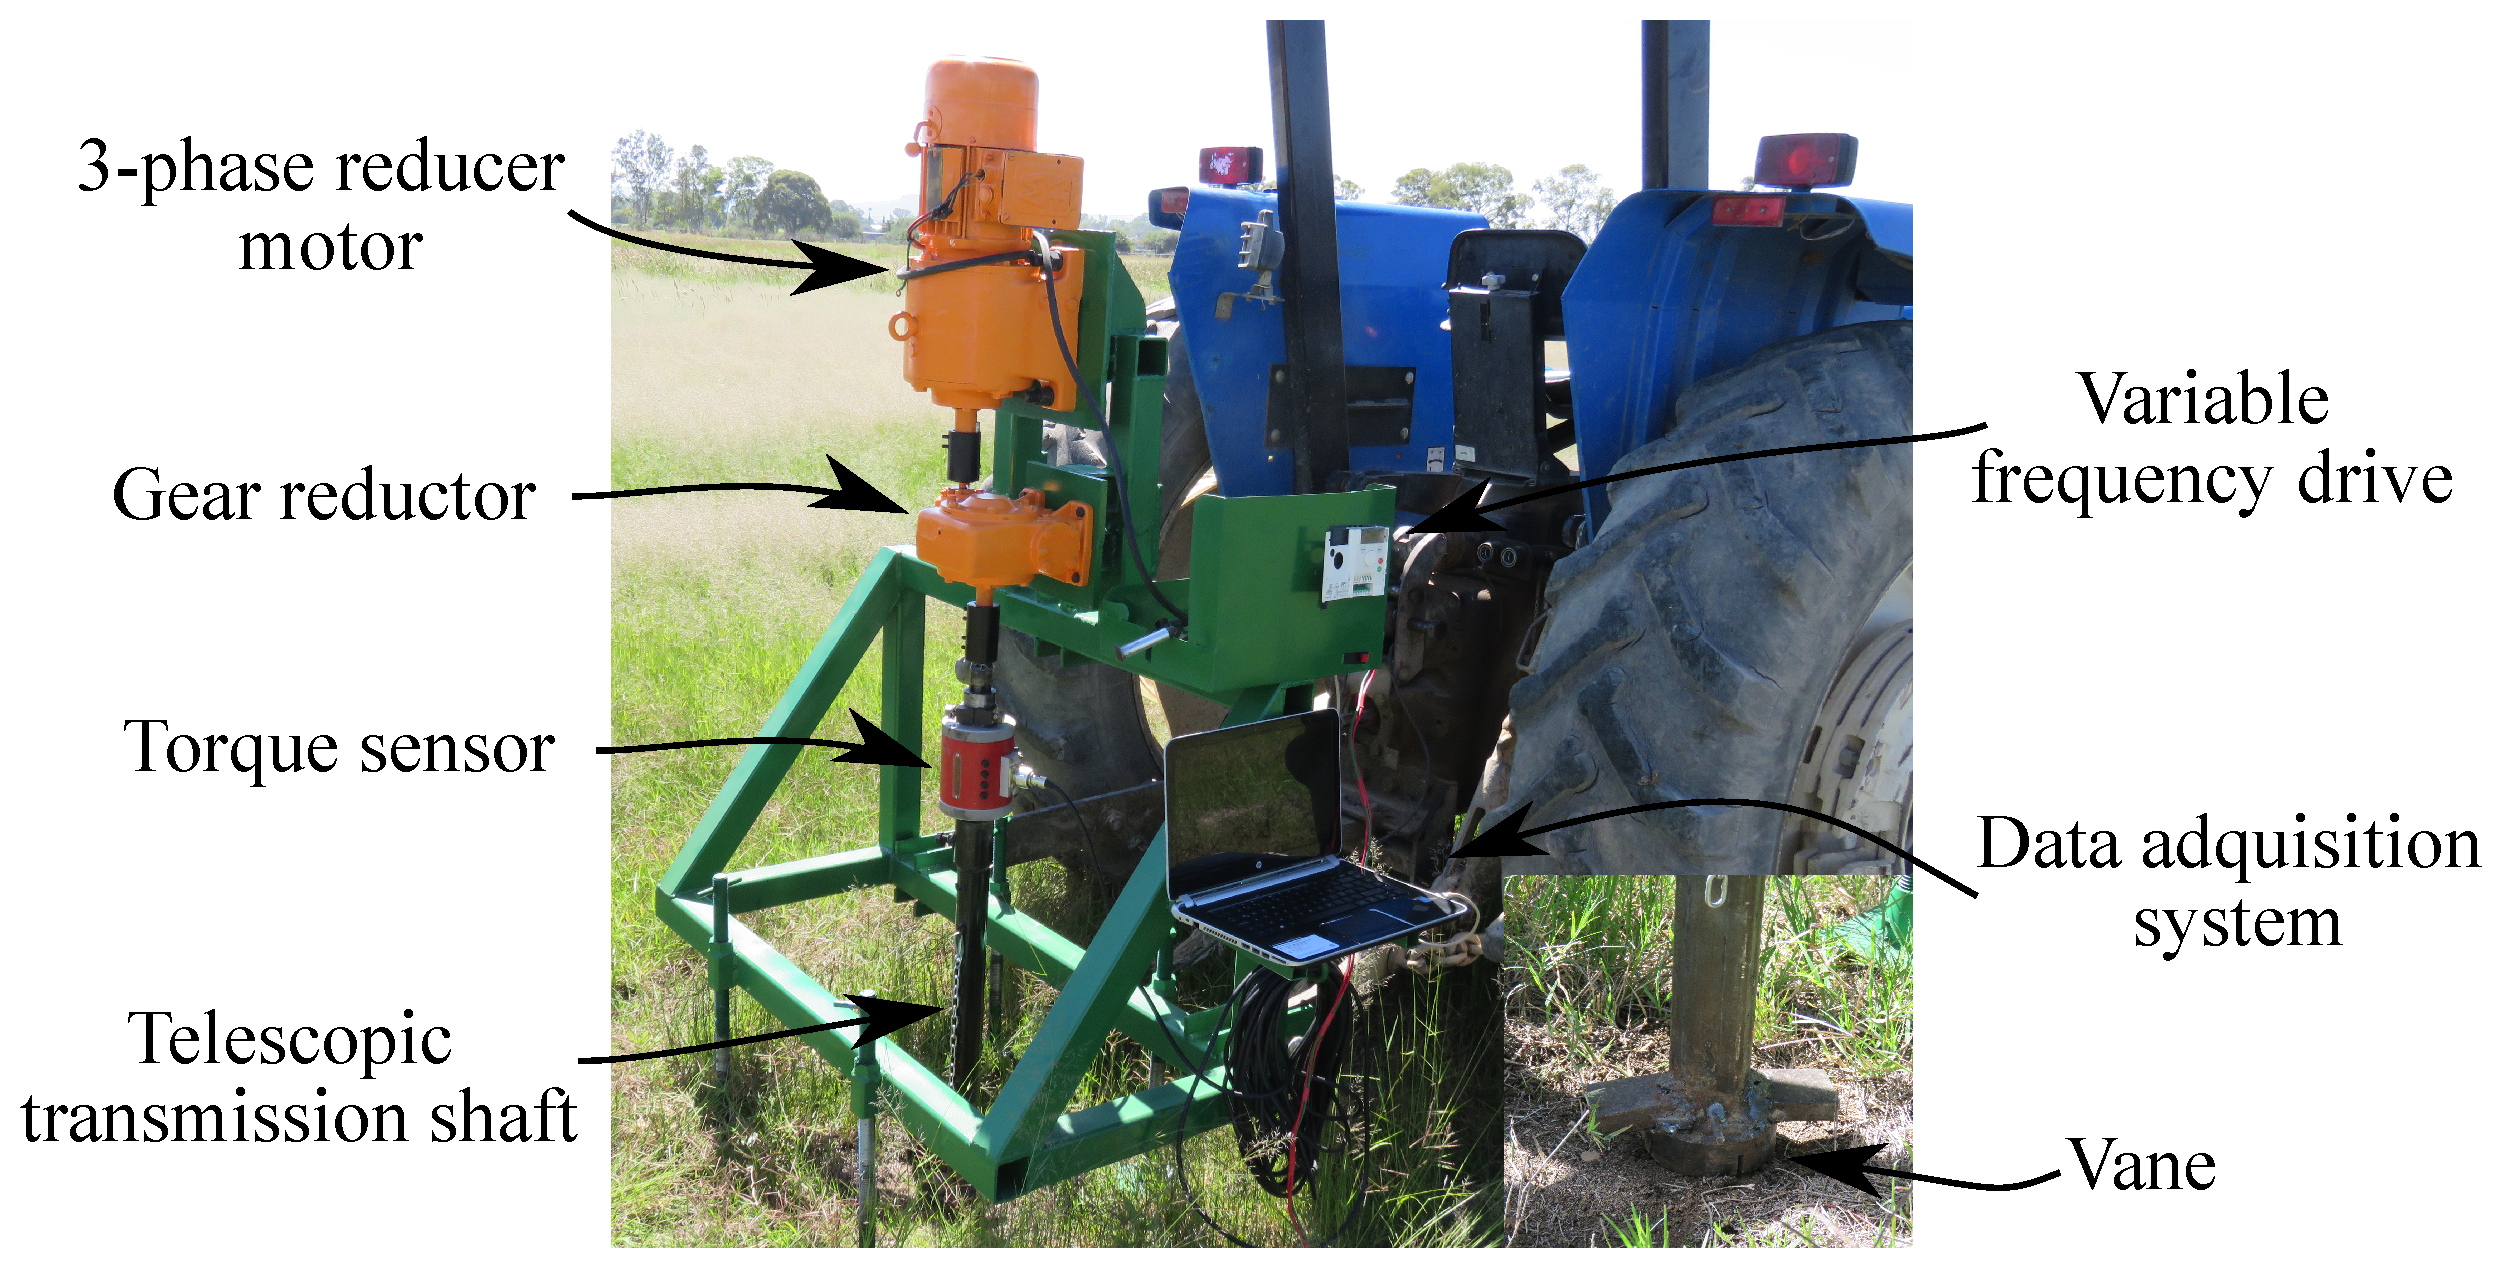
The code index of each layer was determined by utilizing a dynamic cone penetrometer, which was developed under ASTM D6951. Finally, both the yield stress and viscosity were estimated via a torsional soil rheometer for in situ operation; this instrument was developed at the Mechanization department of INIFAP-CEPAB (Figure 3). All the computed parameters from these three soil physical layers were used as inputs for the corresponding layers of the numerical model.

2.3. Field Estimation of the Draft Force

The BS that showed lower horizontal reaction force in the numerical model was fabricated. As already mentioned, a commercial tip was attached to the shank. Additionally, the BS performance was contrasted with that of a curved subsoiler (CS) and a straight shank subsoiler (SS), which have commercial geometries. Therefore, the same sort of tip was also installed in the CS and the SS to create equal conditions for the field evaluation. Subsequently, the subsoiler bodies were individually attached in a three-point hitch chassis.

Field Experiment

A split-plot arrangement in a randomized complete block design with three replications was proposed to investigate the effect of the tillage tools (BS, CS, and SS) and working speeds (2.7, 4.0, and 5.8 km/h) on the drawbar force requirement (kN) and tillage depth (cm). In each block, the main-plot factor was the tillage tool, and the sub-plot factor was the working speed. The experimental unit consisted of a 100 m long tool pass, and each tool pass was three meters apart from the previous one.
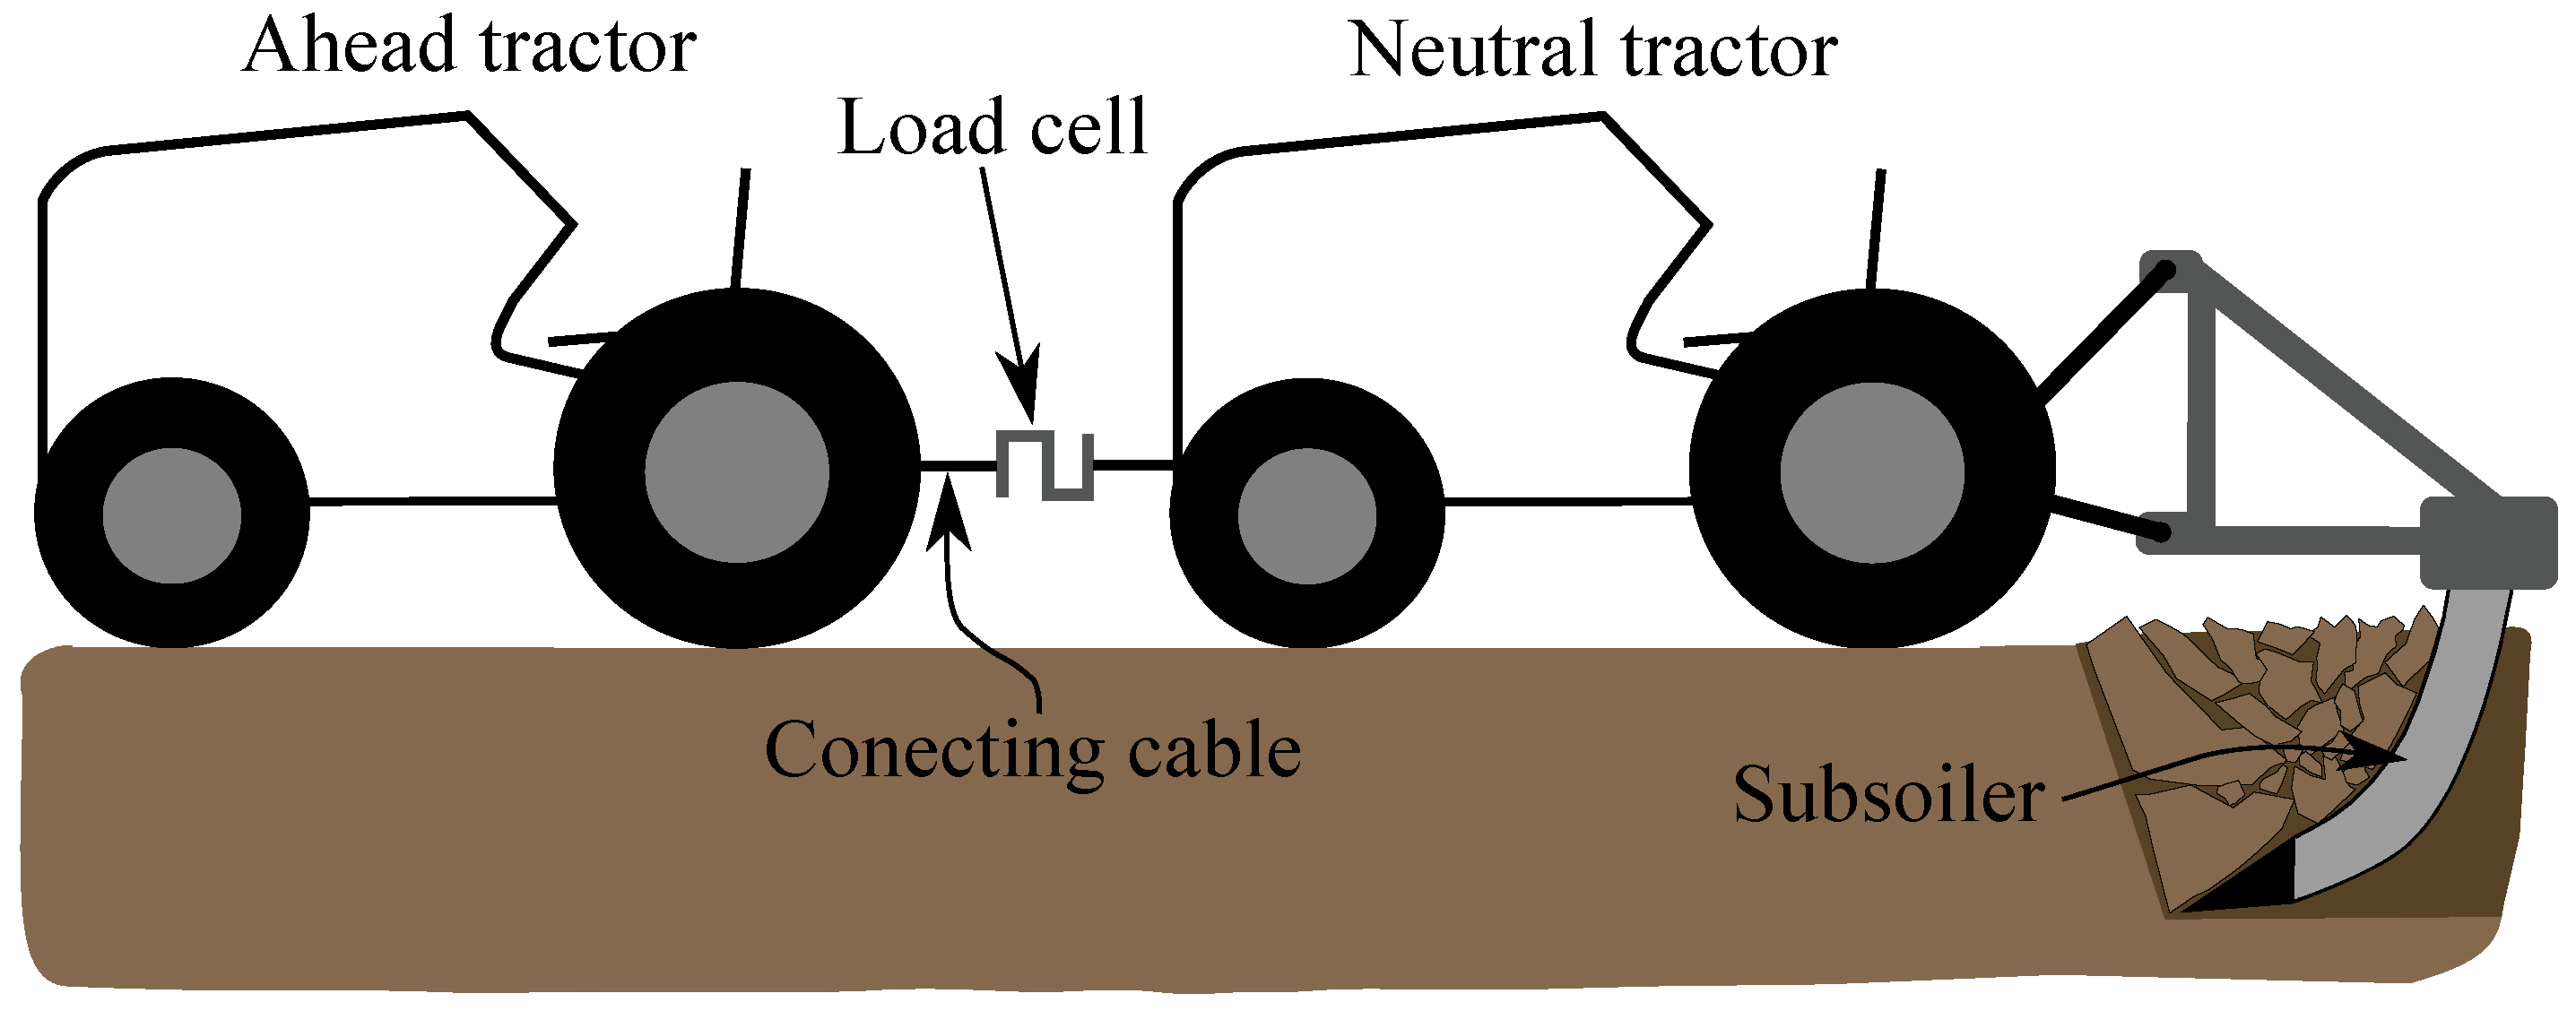
Prior to the experimental test, the bulk density, the moisture content, and the cone index of the arable layers of soil 0–0.10 m, 0.10–0.20 m, 0.20–0.30 m, and 0.30–0.40 m deep were freshly estimated, following the aforementioned methodologies. The draft force was estimated using a previously calibrated Novatech load cell (F204) with a maximum load capacity of 49 kN. The tools were employed using a New Holland (5610) tractor, which can generate 80 hp, and a John Deere (5415) tractor, with 77 hp. The arrangement of the tractors was as shown in Figure 4. The tool was attached to the New Holland tractor, whose gear position was configured to neutral. The John Deere tractor worked as an ahead tractor, which pulled the neutral tractor. The load cell was collocated among the two tractors connected by a cable. The output voltage from the load cell was stored in an SD card using Arduino. The working speeds of the tractors were configured by previous trials on the gear positions of the John Deere tractor. Therefore, the draft force of each subsoiler geometry was computed by subtracting the force applied when the subsoilers were in the working position and while hovering.
The data were subjected to an analysis of variance and Tukey’s multiple comparison test ( p 0.05 ) under a split-plot arrangement in a randomized complete block design. For all analyses, R software (3.6.2) was used.

3. Results and Discussion

In this section, the design of the BS, whose attack-edge profile was inspired by the claws of the Mexican ground squirrel, is presented in Section 3.1. Then, Section 3.2 gives the forecast horizontal force from the numerical modeling of the bionic subsoilers. Finally, the draft behavior of the fabricated BS under real soil tillage conditions is revealed in Section 3.3.

3.1. Bionic Subsoiler Body

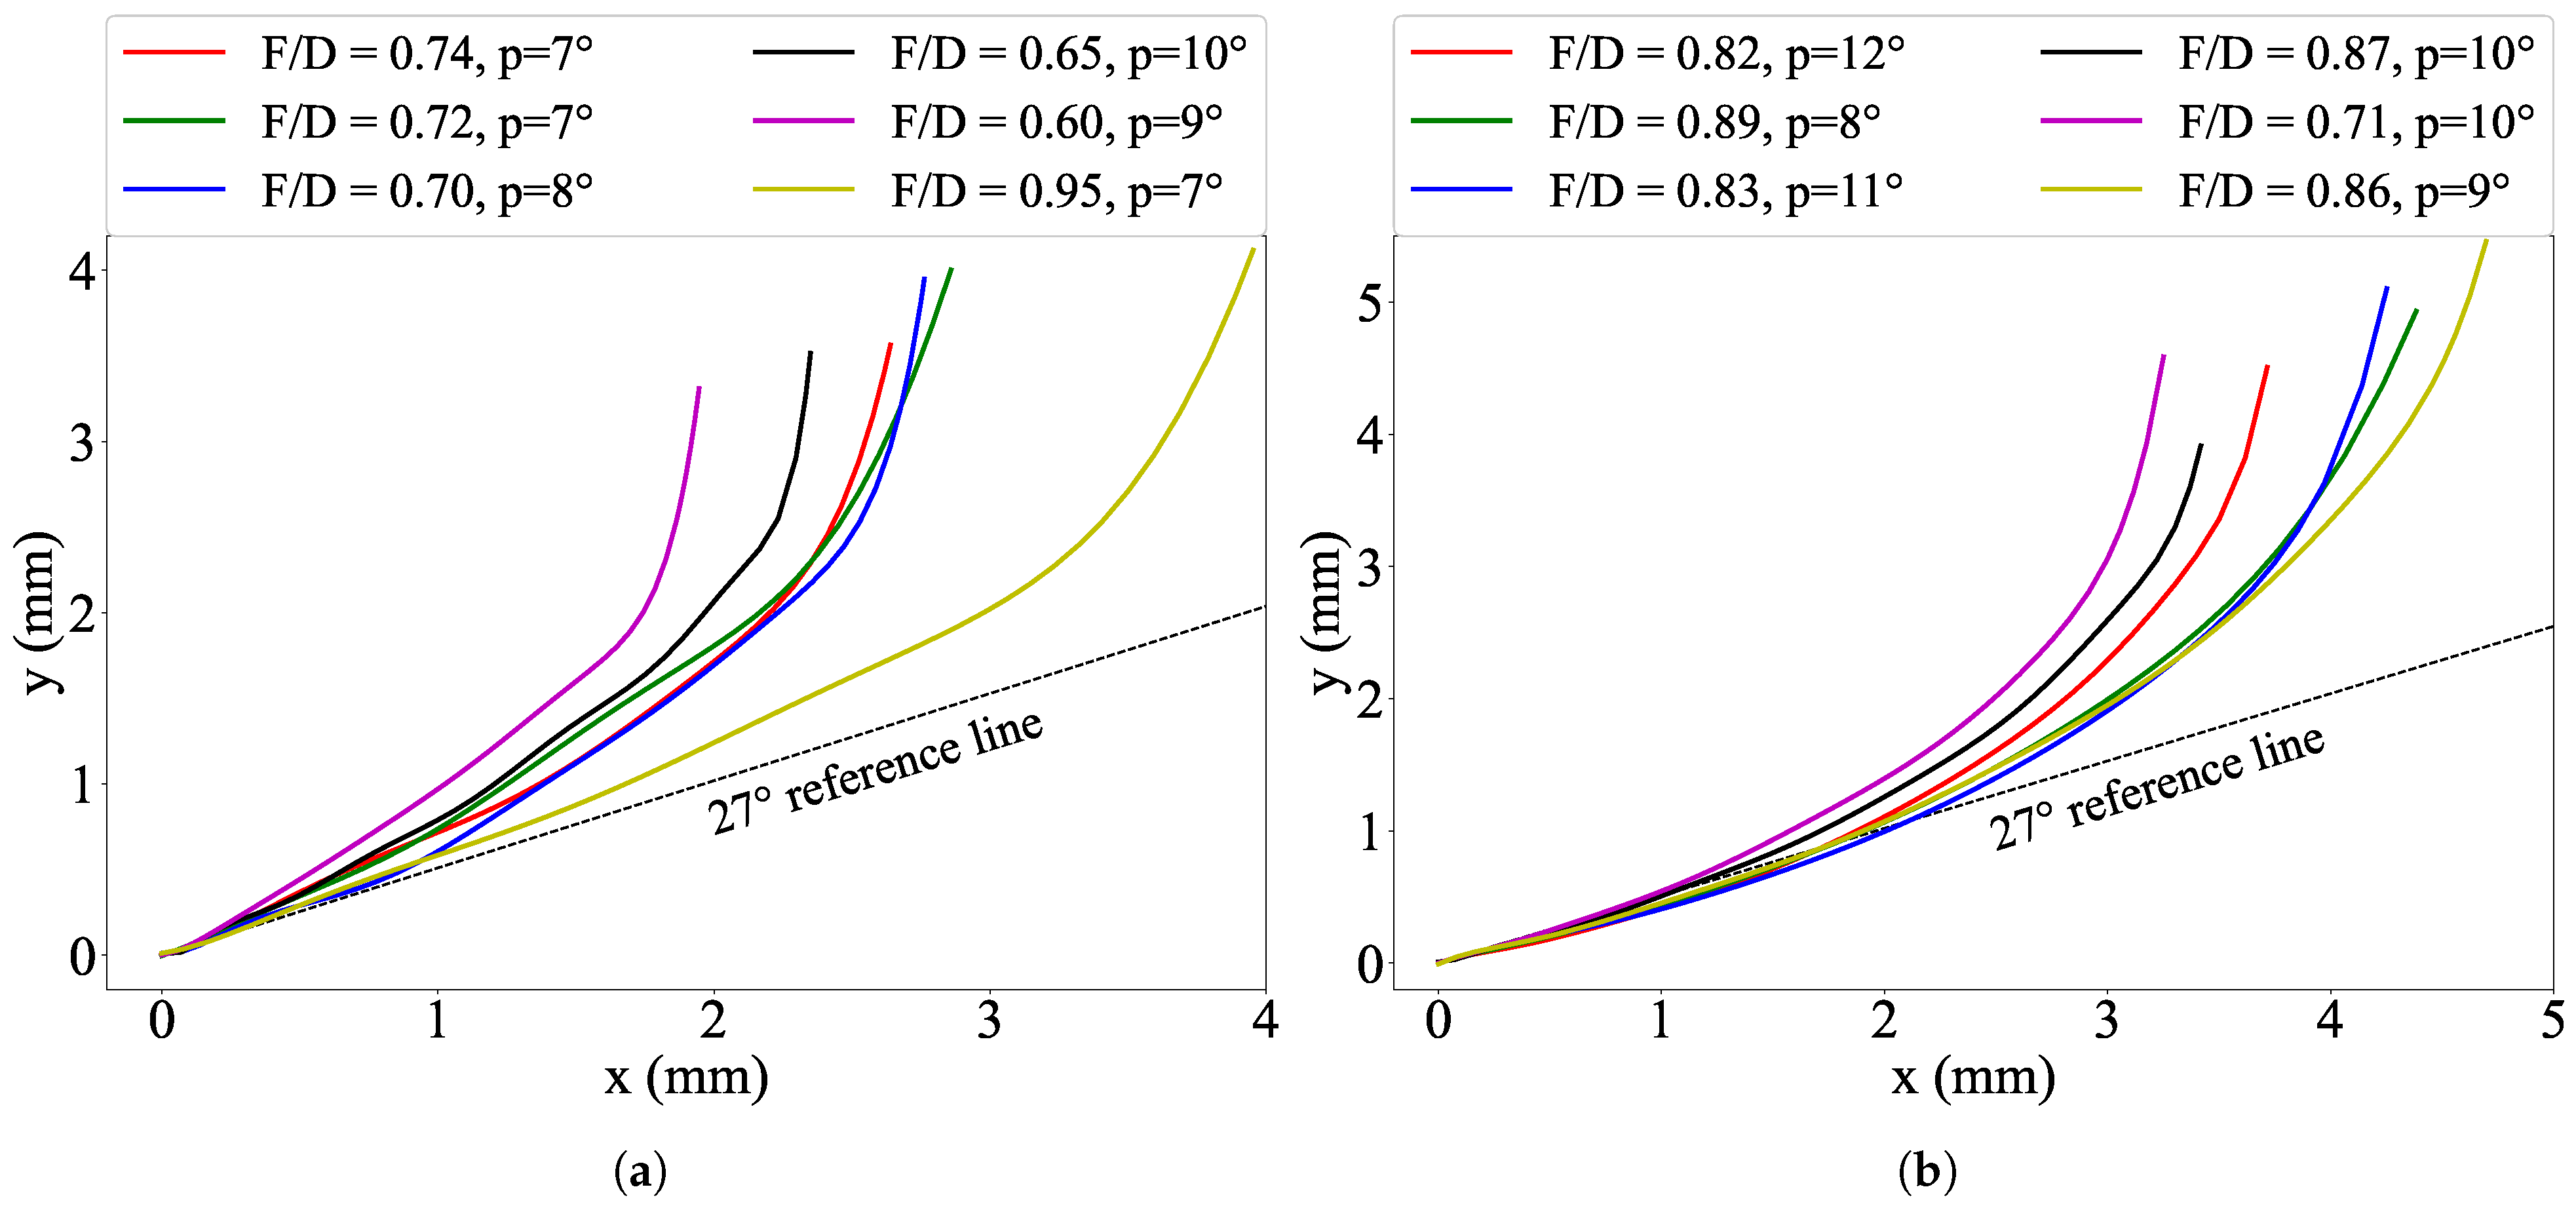
The fitting curves of the internal and external contour lines of the claws are shown in Figure 5. A reference line 27 oriented with respect to the abscissa axis was traced to allow a broad appreciation of the curves. Also, the F/D ratio and the degrees of the equations (p) that describe each fitting curve are given. As observed, in all the cases, for the internal and external curves, the F/D ratio is less than one, which indicates that the vertical length (D) is always of greater magnitude than the frontal length (F) for the specific orientation in which the claws were originally positioned. In accordance with the curve equations, n = 7 is the minor polynomial degree obtained for the internal curves, whereas n = 10 is the maximum polynomial degree. The equations for the external curves are from degree eight to degree ten. The coefficients of the equations belonging to the internal and external curves can be observed in Table A1 and Table A2, respectively, of Appendix A.
Figure 5 shows how the slopes ( f ( x , y ) ) for both the internal and external fitting curves change with the increments in both the x and y magnitudes. Nonetheless, it can be clearly observed that the slope for the internal curves changes more rapidly near the origin than that of the external curves (Figure 5a), which is clearly due to a wearing phenomenon due to the soil–claw interaction, as the internal edges of claws are the sides squirrels use for digging. In contrast, as Figure 5b depicts, the slope of the external fitting curves varies smoothly with the increment in the magnitude of x and y. To understand better each internal and external bionic fitting curve, Figure 6 shows the behavior of its corresponding curvature κ . Curvature “ κ ” indicates the instantaneous direction of a curve with respect to a straight line, and this curvature has already been described. In this way, Figure 6b shows that the internal fitting curves are straight lines, and then they abruptly turn the direction, creating a sharp bend, which indicates that the claws have rough contour curves, as their corresponding curvature κ indicates. The curvature κ for the external fitting curves indicates that they also oscillate (Figure 6b). However, the direction of the curvature for these fitting curves seems to describe moderate bends, except for the curvature of the fitting curve described as F/D = 0.87, which turns sharply when x is of small magnitude. The amplitude of the curvatures for the external fitting curves suggested that they are smooth contour curves.
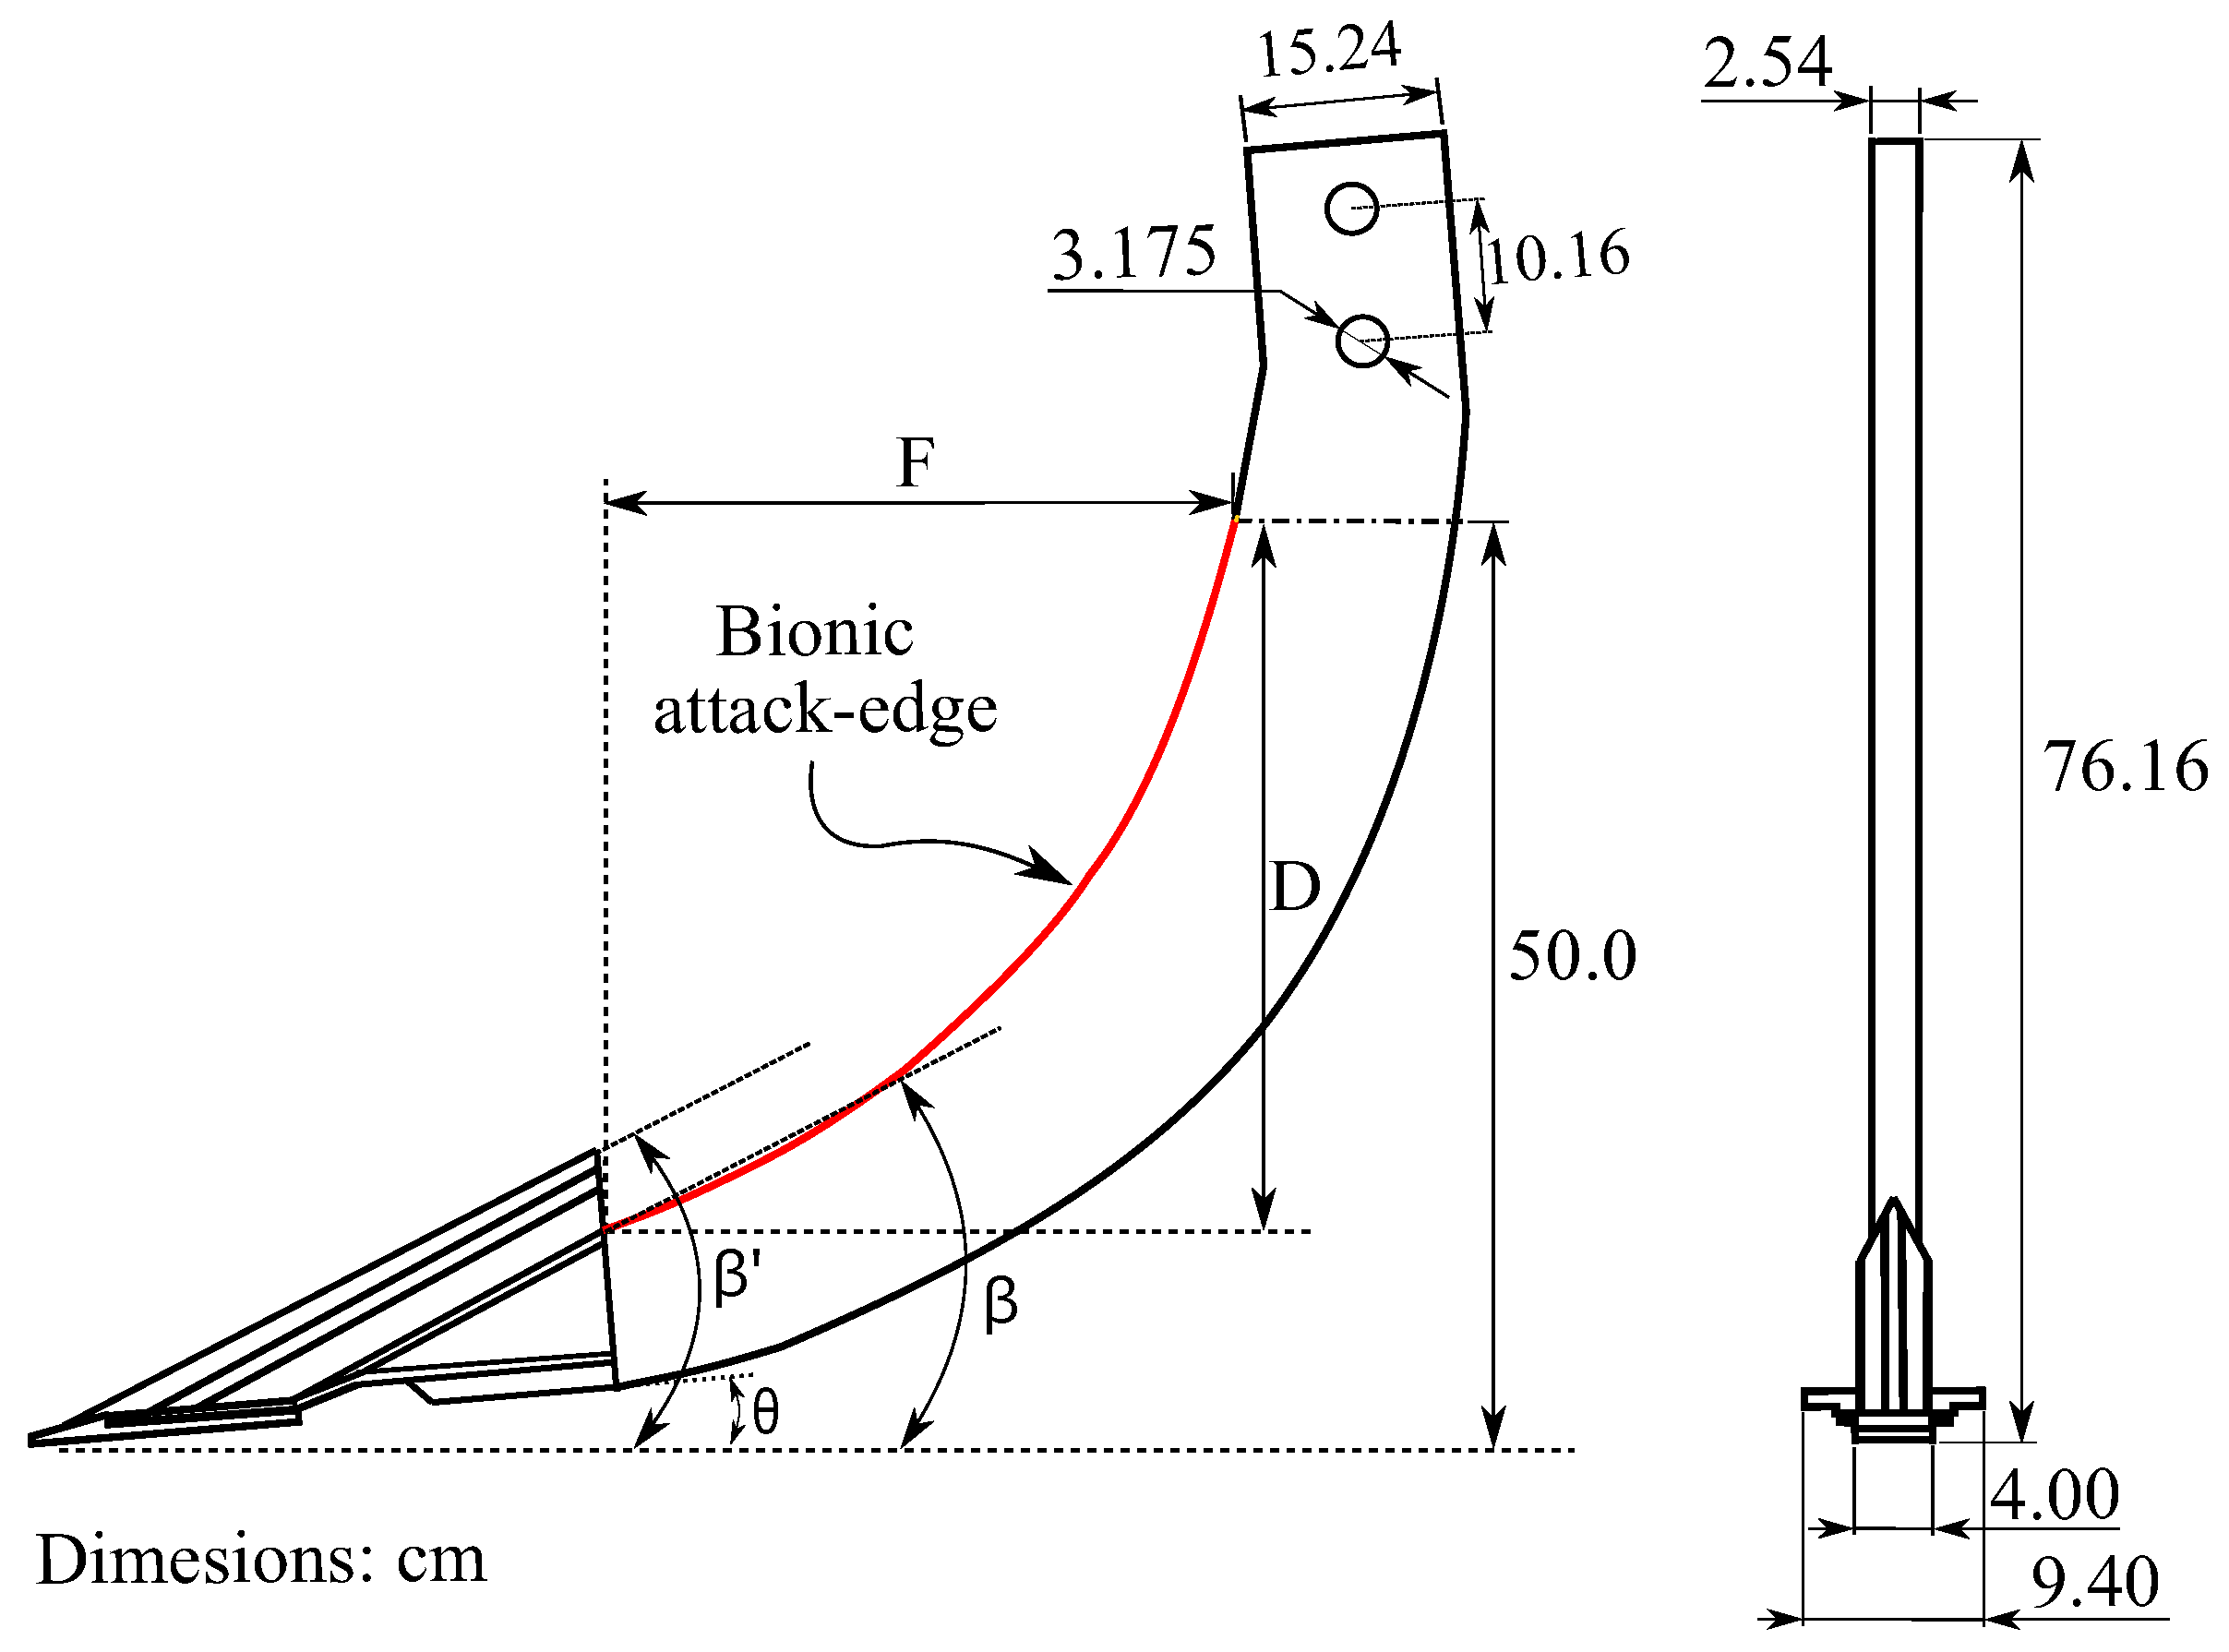
After extracting the fitting curves from the internal and external contour edges of the claws, six BS–I and six BS–E were drawn. The principal dimensions of the drawing are shown in Figure 7. The bionic curves, as shown, were placed on the attack-edge side of the subsoiler shank. This side of the subsoiler, in addition to other parameters, is the region in which the tool interacts most with the soil. In this manner, a subsoiler’s shape governs a great percentage of the draft force required by tractors. As already mentioned, each CAD model has been drawn with a commercial tip, which is not under study in this work. Then, the maximum tillage dimension of the tools was set as 0.50 m so that they could interact with the deep soil layers, with the plow pan layer being among them. The bionic curves were extracted when they were oriented at a β angle of 27 . Thus, the tip of the subsoiler was similarly oriented ( β = 27 ). This is because reduced attack angles on tillage tools reduce a tractor’s draft force demands and facilitate the tools penetration into the soil [26].

3.2. Draft Force Determined via Numerical Modeling

The soil from which the parameters for the numerical modeling of the bionic subsoilers were determined was characterized as sandy loam texture (55.24% sand, 26% silt, and 18.76% clay). Table 1 summarizes the magnitude of the parameters obtained from the three physical layers of soil: 0–0.15 m, 0.15–0.30 m, and 0.30–0.45 m. As observed, the bulk density and moisture content are of approximately the same magnitude in the three layers. Nonetheless, the magnitude of the cone index, which indicates the compaction of the soil, increased as the soil layers became deeper. In such a manner, the cone index of the middle layer (0.15–0.30 m) and the bottom layer (0.30–0.45 m) were 47.74 % and 55.77 % higher than the top layer, respectively. The significant difference between the first and third layers could be attributed to the presence of a plow pan layer, which is a consequence of agricultural machinery traffic. Concerning the yield stress, it was basically of the same magnitude for the first and second layers. However, for the third layer, it was on average 15% higher than it was for the first two layers. Finally, the viscosity of the soil also increased as the depth of the soil layers increased. This variable was 39.62% and 57.16% superior for the second and third layers, respectively, compared to the first layer. This behavior indicates that as the soil layers deepen, the magnitude of both the shear stress and time increase before the soil starts to behave like a fluid.
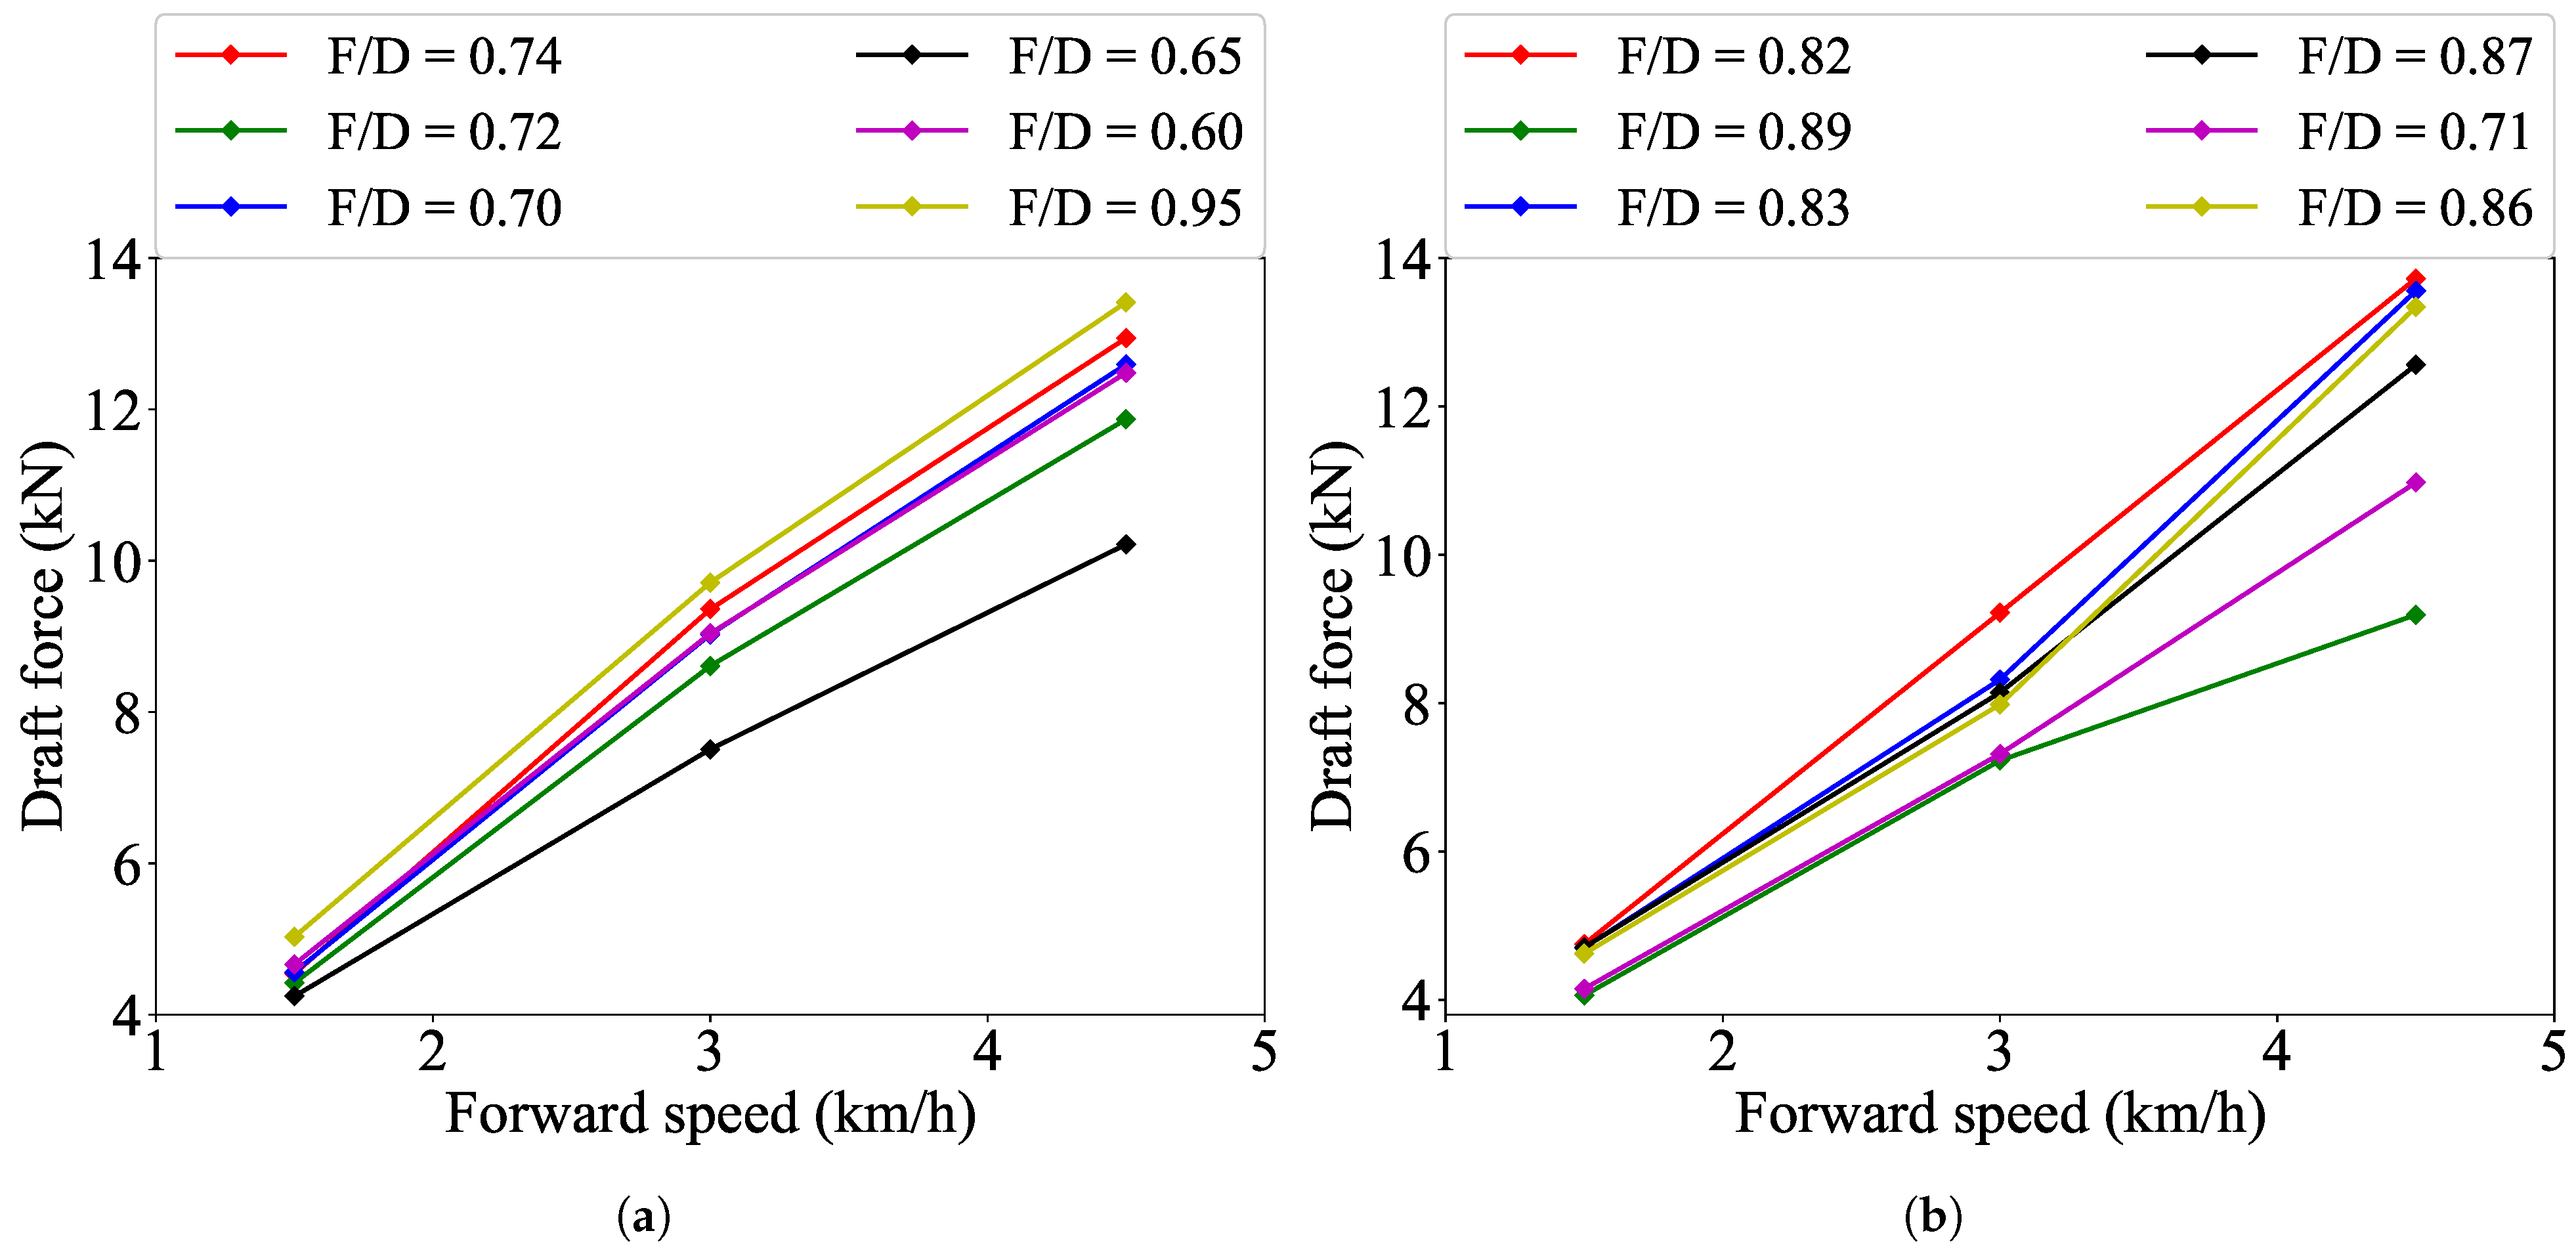
Figure 8 shows the draft force predicted via numerical modeling for each BS. It can be noticed that this variable increased as the forward speed also increased for both BS groups, the BS–I (Figure 8a) and the BS–E (Figure 8b). This kind of behavior has also been reported in other numerical modeling experiments [27] and can basically be attributed to the increment in the pressure of the soil over the tool surfaces. It is also evident that at the first velocity (1.5 km/h), the difference between the maximum and the minimum draft force is an average of 1 kN for both groups, BS–I and BS–E. Nonetheless, at the second (3.0 km/h) and third (4.5 km/h) velocities, the difference between the maximum and the minimum draft force for the two BS groups increases by an average of 22.2% and 28.5%, respectively. Thus, the BS with an F/D ratio equal to 0.65 from the BS–I group exhibited the lowest draft force (7.50 kN), at 3 km/h. In the case of the BS–E group, the BSs that showed the lowest magnitude at this velocity were those with F/D = 0.71 and F/D = 0.89, with 7.31 kN and 7.23 kN, respectively. Analyzing the draft force of the BS at 4.5 km/h, again, the same BS with an F/D = 0.65 from the BS–I group was the one that exhibited the lower draft force (10.22 kN), but even this magnitude was inferior to that for the BS with an F/D ratio equal to 0.71 from the BS–E group (10.97 kN) at the same velocity. Nevertheless, the BS that had an F/D ratio of 0.89 from the BS–E group was manifested an even lower draft force (9.2 kN) at 4.5km/h. Additionally, this BS (F/D = 0.89) exhibited the lowest draft force magnitude in each of the three modeled velocities from among all the BSs. Furthermore, the draft force of this BS (F/D = 0.89) is clearly different from the rest of the bodies at the higher velocities. Low draft force requirement is the desired characteristic for vertical tillage tools. Therefore, the BS with an F/D ratio equal to 0.89 from the BS–E group showed better behavior in the numerical modeling, and its bionic attack curve is described by Equation (10).
f ( x ) = 0.000157 + 0.5223 x 0.6567 x 2 + 1.244 x 3 1.064 x 4 + 0.5075 x 5 0.1353 x 6 + 0.0188 x 7 0.001048 x 8

3.3. Draft Force in the Real Field Experiment

The superior BS suggested by numerical modeling was fabricated using A36 steel, whose principal dimensions were previously shown in Figure 7. The draft force requirements for this BS under real soil tillage conditions were contrasted with those for the geometries of CS and SS. Frontal views of the three evaluated subsoilers are shown in Figure 9.
As mentioned, the load cell used to estimate the field draft force of the three subsoilers was previously calibrated. Figure 10 shows the fitting line and its equation for the observations (force vs. mV). The load cell outputs were registered as follows: during the charging procedure, that is, every time a mass was added, and during the discharge, every time a mass was removed. As a result, the equation indicates that 1mV of output from the load cell represents 4108.64 N of force.
The soil parameters on the day of the experimental test are shown in Table 2. The bulk density of the first three layers was 1373 kg/m3 on average, and these are the common layers the CT usually disturbs. In the bottom layer (0.30–0.40 m), this variable barely increased, rising by 2.14% on average, compared to that for the previous three layers. Nonetheless, in general, the moisture content of the soil diminished with respect to the values used for the numerical modeling. The soil was drier on the top layer, and the moisture increased as the layers became deeper. This effect is associated with the fact that the sun’s rays fell straight onto the soil surface since it did not have green cover (vegetation). Consequently, due to the moisture content, the cone index increased a little as the soil layers were deeper, as shown in Table 1. The magnitude of this variable also increased as the soil layers became deeper. The looser layer was the top one, as its cone index indicates. Then, the soil became tighter, as the cone indices of the second, third, and bottom layers were 44.25%, 10.77%, and 6.73% higher than those for the top, second, and third layers, respectively.
The broad behavior of the draft force requirements of the BS, the CS, and the SS geometries under the three configured working velocities is shown in Figure 11. The draft force required by the three subsoilers increased as the working velocity increased, following the same pattern. In this way, the increment rate of the draft from 2.7 km/h to 4.0 km/h was higher than the increment rate from 4.0 km/h to 5.8 km/h of forward speed for the three geometries, which was imputed to the pressure increment over the tool surfaces. Generally, the better geometry was the BS, then the CS, and finally the SS, as its draft values at each velocity indicate.
The statistical analysis shows significant differences ( p 0.05 ) with the increase in tillage depth among the subsoiler geometries (see Table 3). However, no differences were observed for this variable among the working velocities. The BS was better at cutting the soil; it penetrated 24.86% deeper than the SS and 5.73% deeper than the CS. The drier the soil conditions, the greater the magnitude of shear stress needed to penetrate the soil, which might explain why the tools did not penetrate deep enough into the soil. Nonetheless, the BS might have interacted with the plow pan layer, because it reached a depth of more than 0.32 m.
Regarding the draft force, significant differences ( p 0.05 ) were also observed among the factors subsoiler, forward velocity, and interaction. Table 4 summarizes the draft force response, in which simple factor effects are also reported to better ascertain the comportment of the tools.
As already mentioned, the draft force variable was found to be different ( p 0.05 ) for the three subsoilers. The BS required less draft force, whereas the SS needed the most draft force for cutting the soil. Thus, the BS required, on average, 12.37% less draft force than the CS and 22.25% less draft force than the SS. Regarding the draft force with respect to the working speed, it was found to be statistically equal for 4.0 km/h and for 5.8 km/h; however, it differed for 2.7 km/h of forward velocity. The interaction subsoiler-speed offers a narrow understanding of the draft. This shows that the draft of the BS was statistically equal ( p 0.05 ) at the three forward velocities and is only similar to the CS at 2.7 km/h. Additionally, the draft of the CS at 4.0 km/h and 5.8 km/h was equal to that of the SS at 2.7 km/h. Even the draft of the CS at 5.8 km/h was similar to that of the SS at 4.0 and 5.8 km/h. Therefore, although the BS and the CS geometry seem similar to each other, it was found that modeling the attack-edge of the subsoiler after the claws of the Mexican ground squirrel clearly reduced the draft requirement for agricultural soil tillage.
Our proposed BS, operating at a maximum evaluated velocity of 5.8 km/h, reduced the average draft force by 15.7% compared to the CS. In Zhang et al. [28]’s work, an 8.43% maximum draft force difference was found between a curved traditional tine and a bionic tool inspired by the head of a sandfish (Scincus scincus) when both tools were operated at 4.32 km/h and a tillage depth of 0.30 m. Similarly, Song et al. [10] reported an 11.76% draft force reduction between a bionic subsoiler inspired by moles’ claws and a standard curved subsoiler when evaluated at 6.48 km/h and a tillage depth of 0.30 m. Additionally, Wang et al. [29] proposed a cicada-inspired subsoiling tool, which was compared to a conventional subsoiling tool using the DEM. The derived models indicated that operating them at a forward velocity of 5.8 km/h resulted in a draft force difference of 12.31%. These results are consistent with our findings, suggesting that the bionic curvature proposed in our work is a viable alternative for designing subsoiling tools to reduce draft force for soil tillage.

4. Conclusions

In this work, subsoiler geometries whose main attack edge was inspired by the internal and external contour lines of the claws of the Mexican ground squirrel (Spermophilus mexicanus) are proposed. The draft force of the proposed BS geometries was estimated by using CFD numerical modeling. Afterward, the BS that showed the lower draft force requirement in the numerical modeling was fabricated and field-evaluated and also contrasted with a CS and an SS. The numerical modeling showed that the BS whose attack edge was based on that from the external contour line of a claw required the lower draft force. Afterward, the field evaluation demonstrated that the BS demanded (on average) 12.37% and 22.25% less draft force than the CS and the SS, respectively. Additionally, the BS was better at entering the soil since its mean tillage depths were 24.86% and 5.73% higher than those for the SS and CS geometries. Therefore, this work has shown that modeling the attack edge of a subsoiler after the Mexican ground squirrel clearly reduced the draft force requirements during tillage. As future work, we will use the improved BS geometry to fabricate tillage implements with more subsoiler bodies, allowing the equipment to increase the width of the disrupted area in one pass of a tractor. Additionally, we are planning to use the BS to unify the practices of vertical tillage and soil surface conditioning into a single piece of equipment.

Author Contributions

Conceptualization, numerical modeling, and writing of the original draft, F.G.-M.; supervision and editing of the manuscript, E.M.-R.; provision of significant suggestions for the study, C.M.-M.; field experiment performance, L.R.-C.; statistical analysis, M.C.-B.; editing of the manuscript and performance of the field experiment, A.G.-L. All authors have read and agreed to the published version of the manuscript.

Funding

The research leading to these results received funding from the Instituto Nacional de Investigaciones Forestales, Agrícolas y Pecuarias (INIFAP), under Grant Agreement No. 1239633129.

Data Availability Statement

All data generated and analyzed during this study are included in this published article.

Conflicts of Interest

The authors declare no conflicts of interest.

Appendix A. Internal and External Equations of the Fitting Contour Lines of the Claws

Table A1 and Table A2 provide the internal and external claws’ edge equations, respectively. They have the form f ( x ) = a 0 + a 1 x + a 2 x 2 + + a n x n .
Table A1. Equation coefficients of internal claws’ edges.
Coeff. σ
0.740.720.700.650.600.95
a 0 0.001564 0.003451 0.01202 0.006821 0.001524 0.01127
a 1 0.4621 0.5282 0.3369 1.015 0.1802 0.2024
a 2 1.049 1.302 7.445 24.02 5.344 1.534
a 3 0.9178 3.62 22.97 131.7 19.03 2.352
a 4 0.6504 4.547 34.47 374 39.12 1.709
a 5 1.297 2.675 27.85 616 47.62 0.6215
a 6 0.6167 0.7336 12.5 621.5 34.09 0.1091
a 7 0.09623 0.0749 2.942 389.3 13.46 0.007219
a 8 0.2834 147.6 2.451
a 9 31.01 0.1049
a 10 2.77
Table A2. Equation coefficients of external claws’ edges.
Coeff. σ
0.820.890.830.870.710.86
a 0 0.0007596 0.000157 0.0003696 0.007386 0.001726 0.008072
a 1 0.5737 0.5223 0.4935 0.01767 0.64 0.822
a 2 1.459 0.6567 0.2052 4.871 1.592 2.24
a 3 3.095 1.244 2.096 19.26 5.935 4.885
a 4 1.109 1.064 4.631 38.67 10.84 5.383
a 5 5.13 0.5075 5.093 44.43 11.29 3.415
a 6 9.807 0.1353 3.339 31.1 6.927 1.289
a 7 8.764 0.0188 1.382 13.49 2.492 0.2859
a 8 4.683 0.001048 0.3642 3.538 0.4949 0.3436
a 9 1.574 0.05902 0.514 0.04525 0.001725
a 10 0.3275 0.005332 0.03175 0.0009132
a 11 0.03859 0.0002035
a 12 0.001972

References

  1. Tong, J.; Jiang, A.H.; Wang, Y.M.; Ma, Y.H.; Li, J.W.; Sun, J.Y. Tillage force and disturbance characteristics of different geometric-shaped sub-soilers via DEM. Adv. Manuf. 2020, 8, 392–404. [Google Scholar] [CrossRef]
  2. Tim Chamen, W.C.; Moxey, A.P.; Towers, W.; Balana, B.; Hallett, P.D. Mitigating arable soil compaction: A review and analysis of available cost and benefit data. Soil Tillage Res. 2015, 146, 10–25. [Google Scholar] [CrossRef]
  3. Acquah, K.; Chen, Y. Soil Compaction from Wheel Traffic under Three Tillage Systems. Agriculture 2022, 12, 219. [Google Scholar] [CrossRef]
  4. Hakansson, I.; Reeder, R.C. Subsoil compaction by vehicles with high axle load—Extent, persistence and crop response. Soil Tillage Res. 1994, 29, 277–304. [Google Scholar] [CrossRef]
  5. Raper, R.L.; Reeves, D.W.; Shaw, J.N.; van Santen, E.; Mask, P.L. Using site specific subsoiling to minimize draft and optimize corn yields. Trans. ASAE 2005, 48, 2047–2052. [Google Scholar] [CrossRef]
  6. de Campos, M.; Rossato, O.B.; Marasca, I.; Martello, J.M.; de Siqueira, G.F.; Garcia, C.P.; Rossetto, R.; Calonego, J.C.; Cantarella, H.; Crusciol, C.A.C. Deep tilling and localized liming improve soil chemical fertility and sugarcane yield in clayey soils. Soil Tillage Res. 2022, 222, 10542. [Google Scholar] [CrossRef]
  7. Zhang, X.; Liu, Z.; Shao, X.; Kong, Y.; Lyu, Y.; Wang, Y. Deep tillage improves the grain yield and nitrogen use efficiency of maize (Zea mays L.) under a wide–narrow row alternative system in northeast china. Int. J. Plant Prod. 2022, 16, 63–76. [Google Scholar] [CrossRef]
  8. Brezinščak, L.; Kontek, K.; Bogunović, I.; Horvat, D. Impact of conservation tillage on grain yield and yield components of maize in north-west Croatia. Agric. Conspec. Sci. 2022, 87, 103–109. [Google Scholar]
  9. Aday, S.H.; AL-Haliphy, A.R.; Majeed, H. Field study for a modified subsoiler draft requirement in a heavy soil. Iraqi J. Agric. 2004, 9, 155–166. [Google Scholar]
  10. Song, W.; Jiang, X.; Li, L.; Jin, T. Increasing the width of disturbance of plough pan with bionic inspired subsoilers. Soil Tillage Res. 2022, 220, 105356. [Google Scholar] [CrossRef]
  11. Raper, R.L. Subsoiler shapes for site-specific tillage. Trans. ASAE 2005, 21, 25–30. [Google Scholar] [CrossRef]
  12. Nichols, M.L.; Reaves, C.A. Soil reaction to subsoiling equipment. Agric. Eng. 1958, 39, 340–343. [Google Scholar]
  13. Smith, L.A.; Williford, J.L. Power requirements of conventional, triplex, and parabolic subsoilers. Trans. ASAE 1988, 31, 1685–1688. [Google Scholar] [CrossRef]
  14. Mollazade, K.; Jafari, A.; Ebrahimi, E. Application of dynamical analysis to choose best subsoiler’s shape using ANSYS. N. Y. Sci. J. 2010, 3, 93–100. [Google Scholar]
  15. Tong, J.; Sun, J.; Chen, D.; Zhang, S. Geometrical features and wettability of drug beetles and potential biomimetic engineering applications in tillage implements. Soil Tillage Res. 2005, 80, 1–12. [Google Scholar] [CrossRef]
  16. Guo, Z.; Zhou, Z.; Zhang, Y.; Li, Z. Bionic optimization research of soil cultivating component design. Sci. China Ser. E Tech. Sci. 2009, 52, 955–965. [Google Scholar] [CrossRef]
  17. Zhang, J.; Tong, J.; Ma, Y. Simulation of bionic anti-drag subsoiler with exponential curve feature using discrete element method. Appl. Mech. Mater. 2014, 461, 461–543. [Google Scholar] [CrossRef]
  18. Young, C.J.; Jones, J. Spermophilus mexicanus. Mamm. Species 1982, 164, 1–4. [Google Scholar] [CrossRef]
  19. Godwin, R.J.; Spoor, G. Soil failure with narrow tines. J. Agric. Eng. Res. 1977, 22, 213–228. [Google Scholar] [CrossRef]
  20. Yates, R.C. A Handbook on Curves and Their Properties; J.W. Edwards: Ann Arbor, MI, USA, 1947. [Google Scholar]
  21. Karmakar, S.; Kushwaha, R.L. Dynamic modeling of soil-tool interaction: An overview from a fluid flow perspective. J. Terramech. 2006, 43, 411–425. [Google Scholar] [CrossRef]
  22. El-Borhamy, M. Numerical study of the stationary generalized viscoplastic fluid flows. Alex. Eng. J. 2018, 57, 2007–2018. [Google Scholar] [CrossRef]
  23. Zhu, L.; Ge, J.R.; Cheng, X.; Peng, S.S.; Qi, Y.Y.; Zhang, S.W.; Zhu, D.Q. Modeling of share/soil interaction of a horizontally reversible plow using computational fluid dynamics. J. Terramech. 2017, 72, 1–8. [Google Scholar] [CrossRef]
  24. Karmakar, S.; Kushwaha, R.L.; Lague, C. Numerical modeling of soil stress and pressure distribution on a flat tillage tool using computational fluid dynamics. Biosyst. Eng. 2007, 97, 407–414. [Google Scholar] [CrossRef]
  25. Al-Shammary, A.A.G.; Kouzani, A.; Kaynak, A.; Khoo, S.; Norton, M.; Gates, W. Soil bulk density estimation methods: A review. Pedosphere 2018, 28, 581–596. [Google Scholar] [CrossRef]
  26. Godwin, R.J. A review of the effect of implement geometry on soil failure and implement forces. Soil Tillage 2007, 97, 331–340. [Google Scholar] [CrossRef]
  27. Karmakar, S.; Ashrafizadeh, S.R.; Kushwaha, R.L. Experimental validation of computational fluid dynamics modeling for narrow tillage tool draft. J. Terramech. 2009, 46, 277–283. [Google Scholar] [CrossRef]
  28. Zhang, Z.; Gan, S.; Zuo, G.; Tong, J. Bionic design and performance experiment of Sandfish head inspired subsoiler tine. Trans. Chin. Soc. Agric. Mach. 2021, 52, 33–42. [Google Scholar]
  29. Wang, X.; Du, R.; Geng, L.; Zhou, H.; Ji, J. Performance Evaluation of a Cicada-Inspired Subsoiling Tool Using DEM Simulations. Biomimetics 2024, 9, 25. [Google Scholar] [CrossRef]
Figure 1. Development process of the subsoiler with bio-inspired attack-edge. (a) Spermophilus mexicanus specimen, (b) internal curve of the claw, and (c) subsoiler body illustration.
Agriengineering 06 00156 g001
Figure 2. Concept of the soil–tool control volume used to forecast the draft force requirements of the bionic subsoilers under study.
Agriengineering 06 00156 g002
Figure 3. Torsional rheometer for in situ determination of soil visco-plastic parameters. Vane dimensions have been standardized to ASTM D2573-72.
Agriengineering 06 00156 g003
Figure 4. Tractor–tool configuration for field measurement of the draft force required by the subsoilers.
Agriengineering 06 00156 g004
Figure 5. Fitting curves of the (a) internal and (b) external contour lines from the studied claws of the Mexican ground squirrel.
Agriengineering 06 00156 g005
Figure 6. Curvature behavior of the (a) internal and (b) external fitting curves of the claws.
Agriengineering 06 00156 g006
Figure 7. Main dimensions of subsoiler tool provided with bionic attack-edge.
Agriengineering 06 00156 g007
Figure 8. Predicted draft force via numerical modeling. (a) BS–I group and (b) BS–E group.
Agriengineering 06 00156 g008
Figure 9. Subsoiler geometries evaluated under real soil tillage conditions. (a) BS, (b) CS, and (c) SS.
Agriengineering 06 00156 g009
Figure 10. Fitting line and equation from the Novatech load cell calibration.
Agriengineering 06 00156 g010
Figure 11. Experimental draft forces of the subsoiler bodies at three forward velocities.
Agriengineering 06 00156 g011
Table 1. Soil parameters used for the numerical modeling of soil–bionic tool interaction.
Soil Layer (m)Bulk Density ( kg / m 3 )Moisture Content (%)Cone Index (kPa)Yield Stress (kPa)Viscosity (kPa s)
0–0.151380 14.0 673.97 59.66 56.56
0.15–0.301360 14.55 1289.73 60.29 93.68
0.30–0.451390 14.32 1523.75 70.56 132.03
Table 2. Soil parameters estimated on the day of the field experiment.
Soil Layer (m)Bulk Density ( kg / m 3 )Moisture Content (%)Cone Index (kPa)
0–0.101378 10.67 726.17
0.10–0.201363 11.24 1302.45
0.20–0.301387 12.85 1459.61
0.30–0.401403 14.11 1564.89
Table 3. Tillage depth of the subsoiler geometries.
SubsoilerTillage Depth (m)
SS0.2412 c 1
CS0.3026 b
BS0.3210 a
1 Means that do not share a letter within each column are significantly different (Tukey, p 0.05 ).
Table 4. Draft force as a function of the subsoiler tools and forward speed.
SubsoilerDraft Force (kN)
SS 15.5629 a 1
CS 13.8070 b
BS 12.0990 c
Speed (km/h)Draft force (kN)
2.7 12.8332 b
4.0 14.1916 a
5.8 14.4441 a
Subsoiler × Speed (km/h)Draft force (kN)
SS—2.7 14.7724 b
SS—4.0 15.9094 a
SS—5.8 16.0069 a
CS—2.7 12.2366 c
CS—4.0 14.3587 b
CS—5.8 14.8257 ab
BS—2.7 11.4906 c
BS—4.0 12.3067 c
BS—5.8 12.4997 c
1 Means that do not share a letter within each column are significantly different (Tukey, p 0.05 ).
Disclaimer/Publisher’s Note: The statements, opinions and data contained in all publications are solely those of the individual author(s) and contributor(s) and not of MDPI and/or the editor(s). MDPI and/or the editor(s) disclaim responsibility for any injury to people or property resulting from any ideas, methods, instructions or products referred to in the content.