
Application of Fluorescence Spectroscopy for Early Detection of Fungal Infection of Winter Wheat Grains

 , , and
Abstract
:1. Introduction
2. Materials and Methods
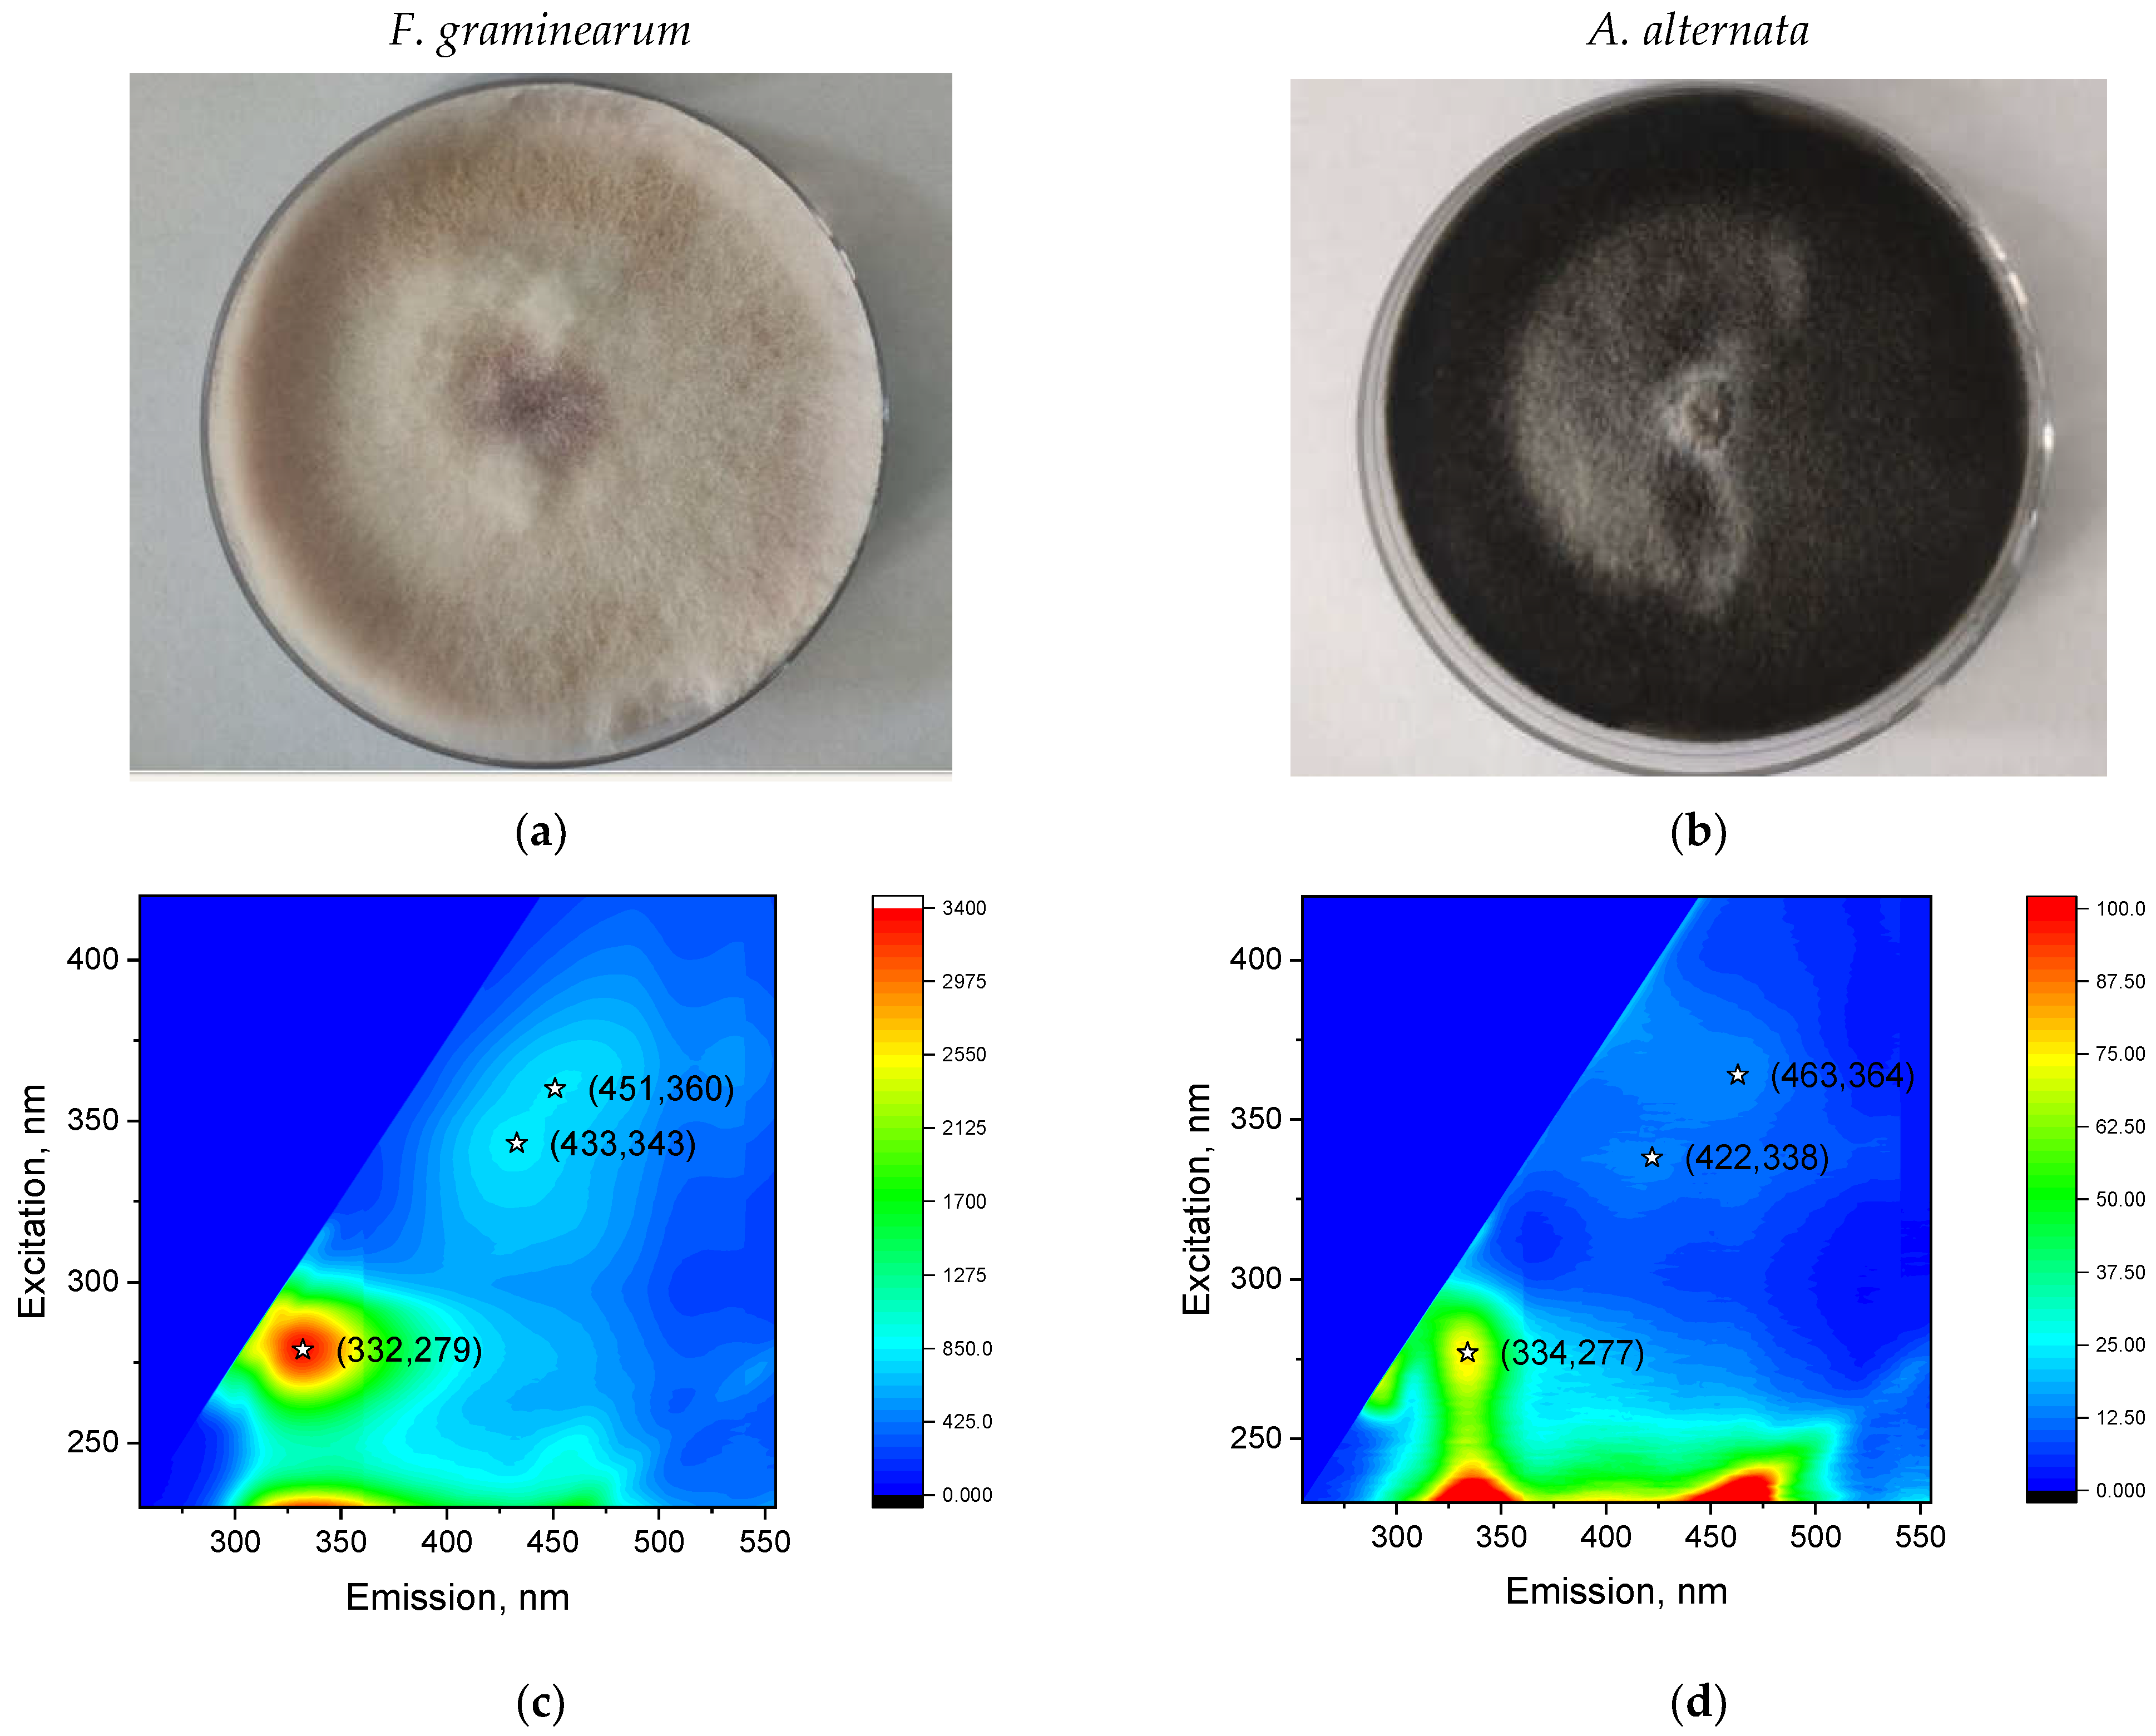
2.1. Preparation of Fusarium graminearum and Alternaria alternata Cultures
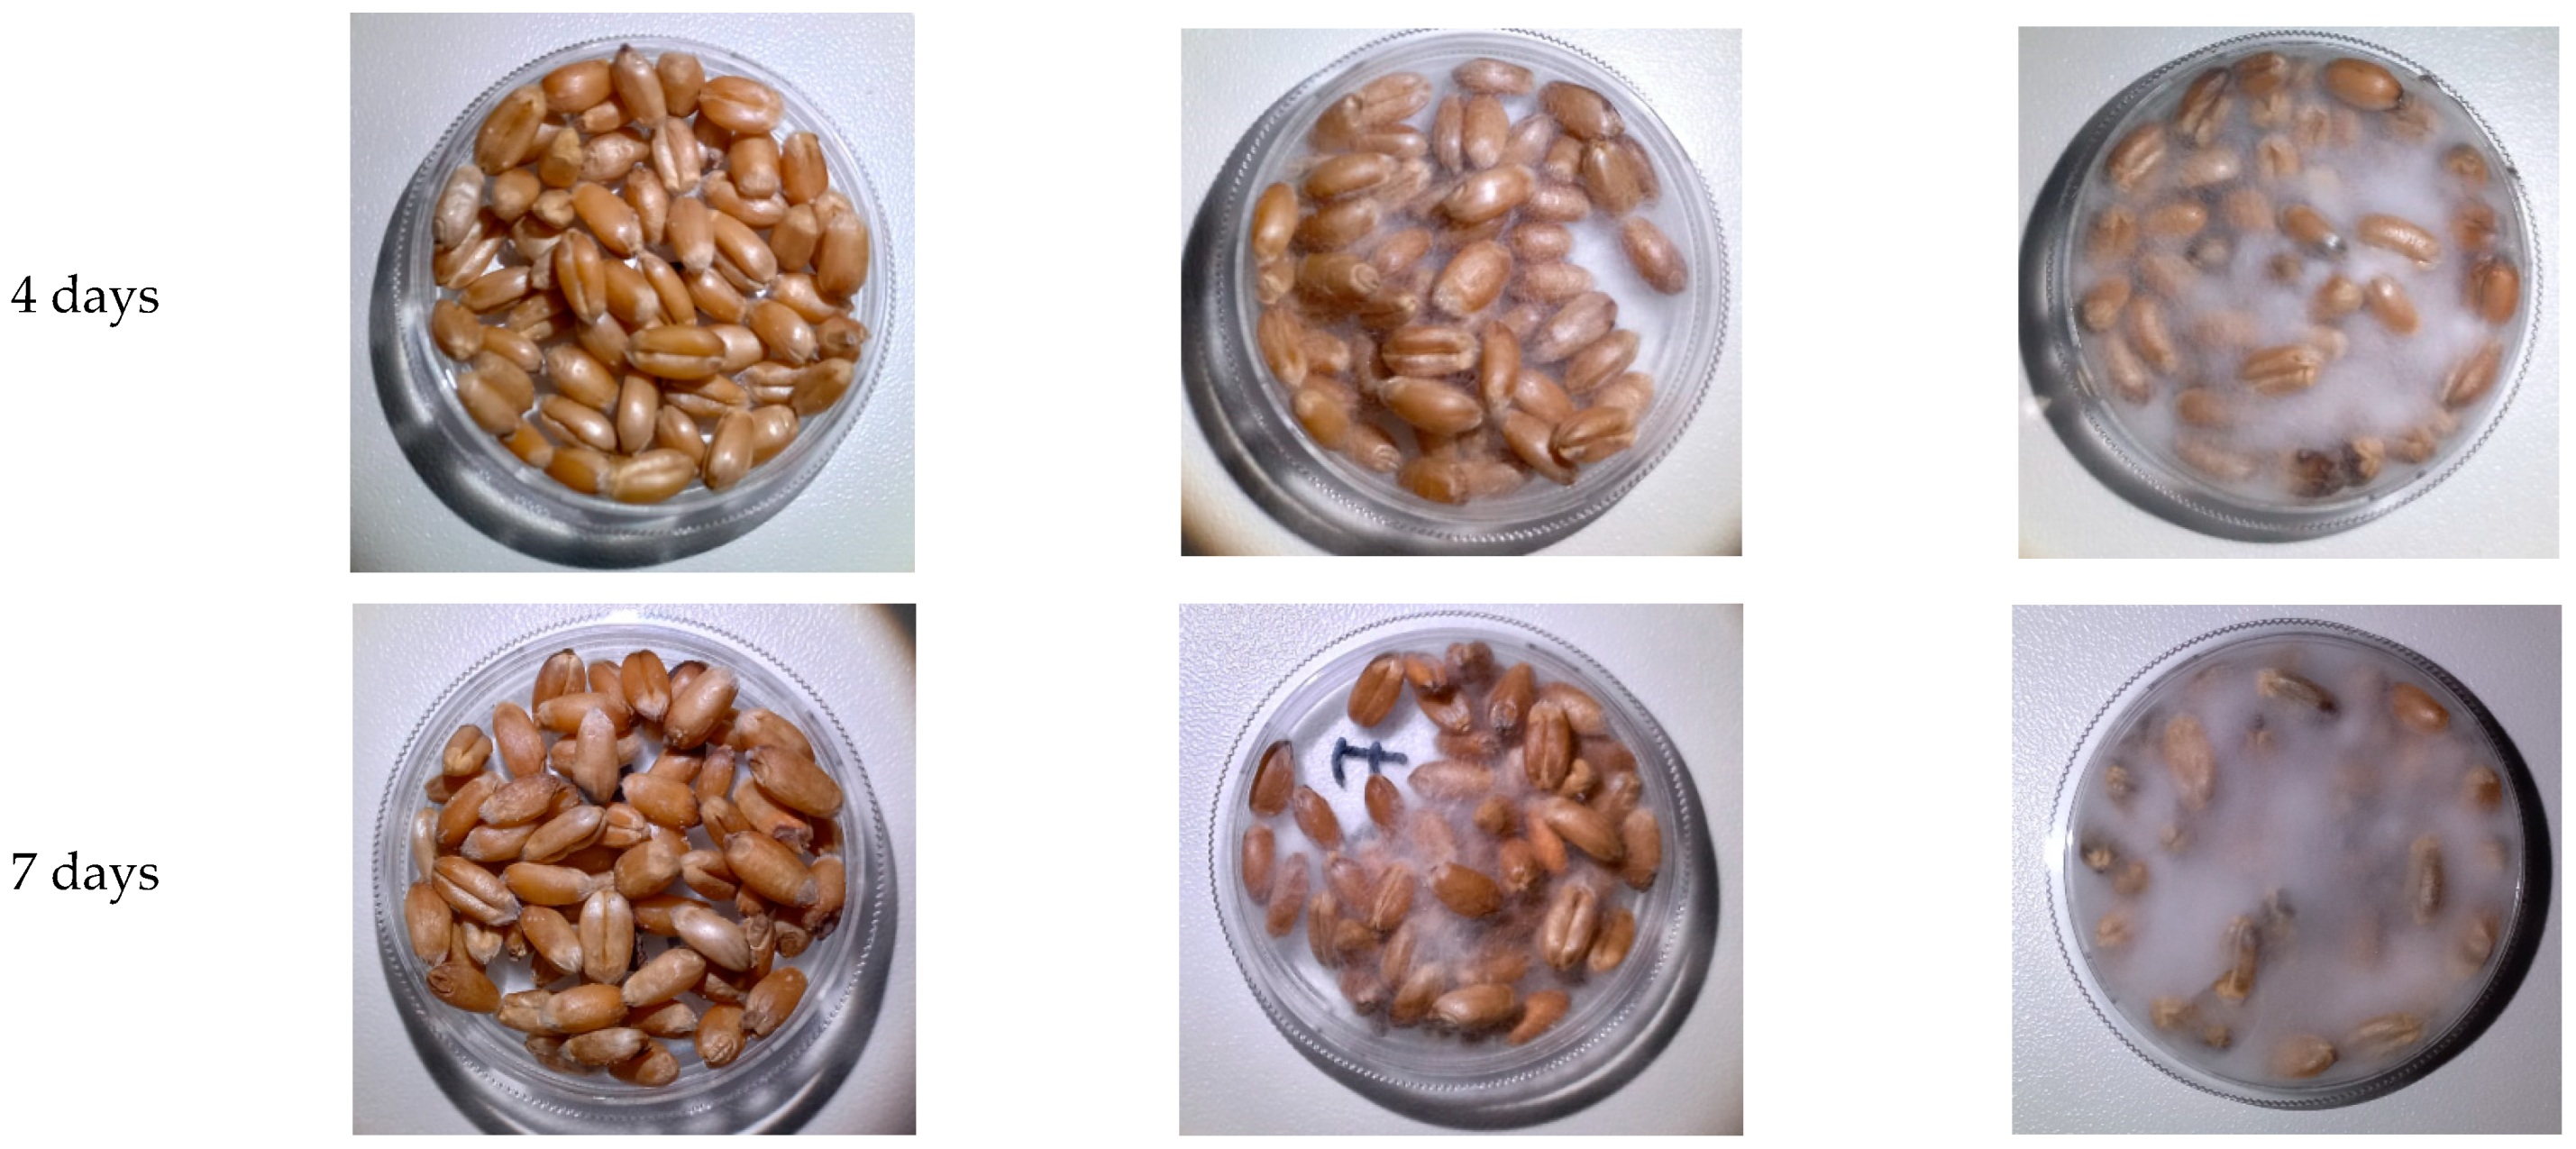
2.2. Inoculation of Wheat Grains
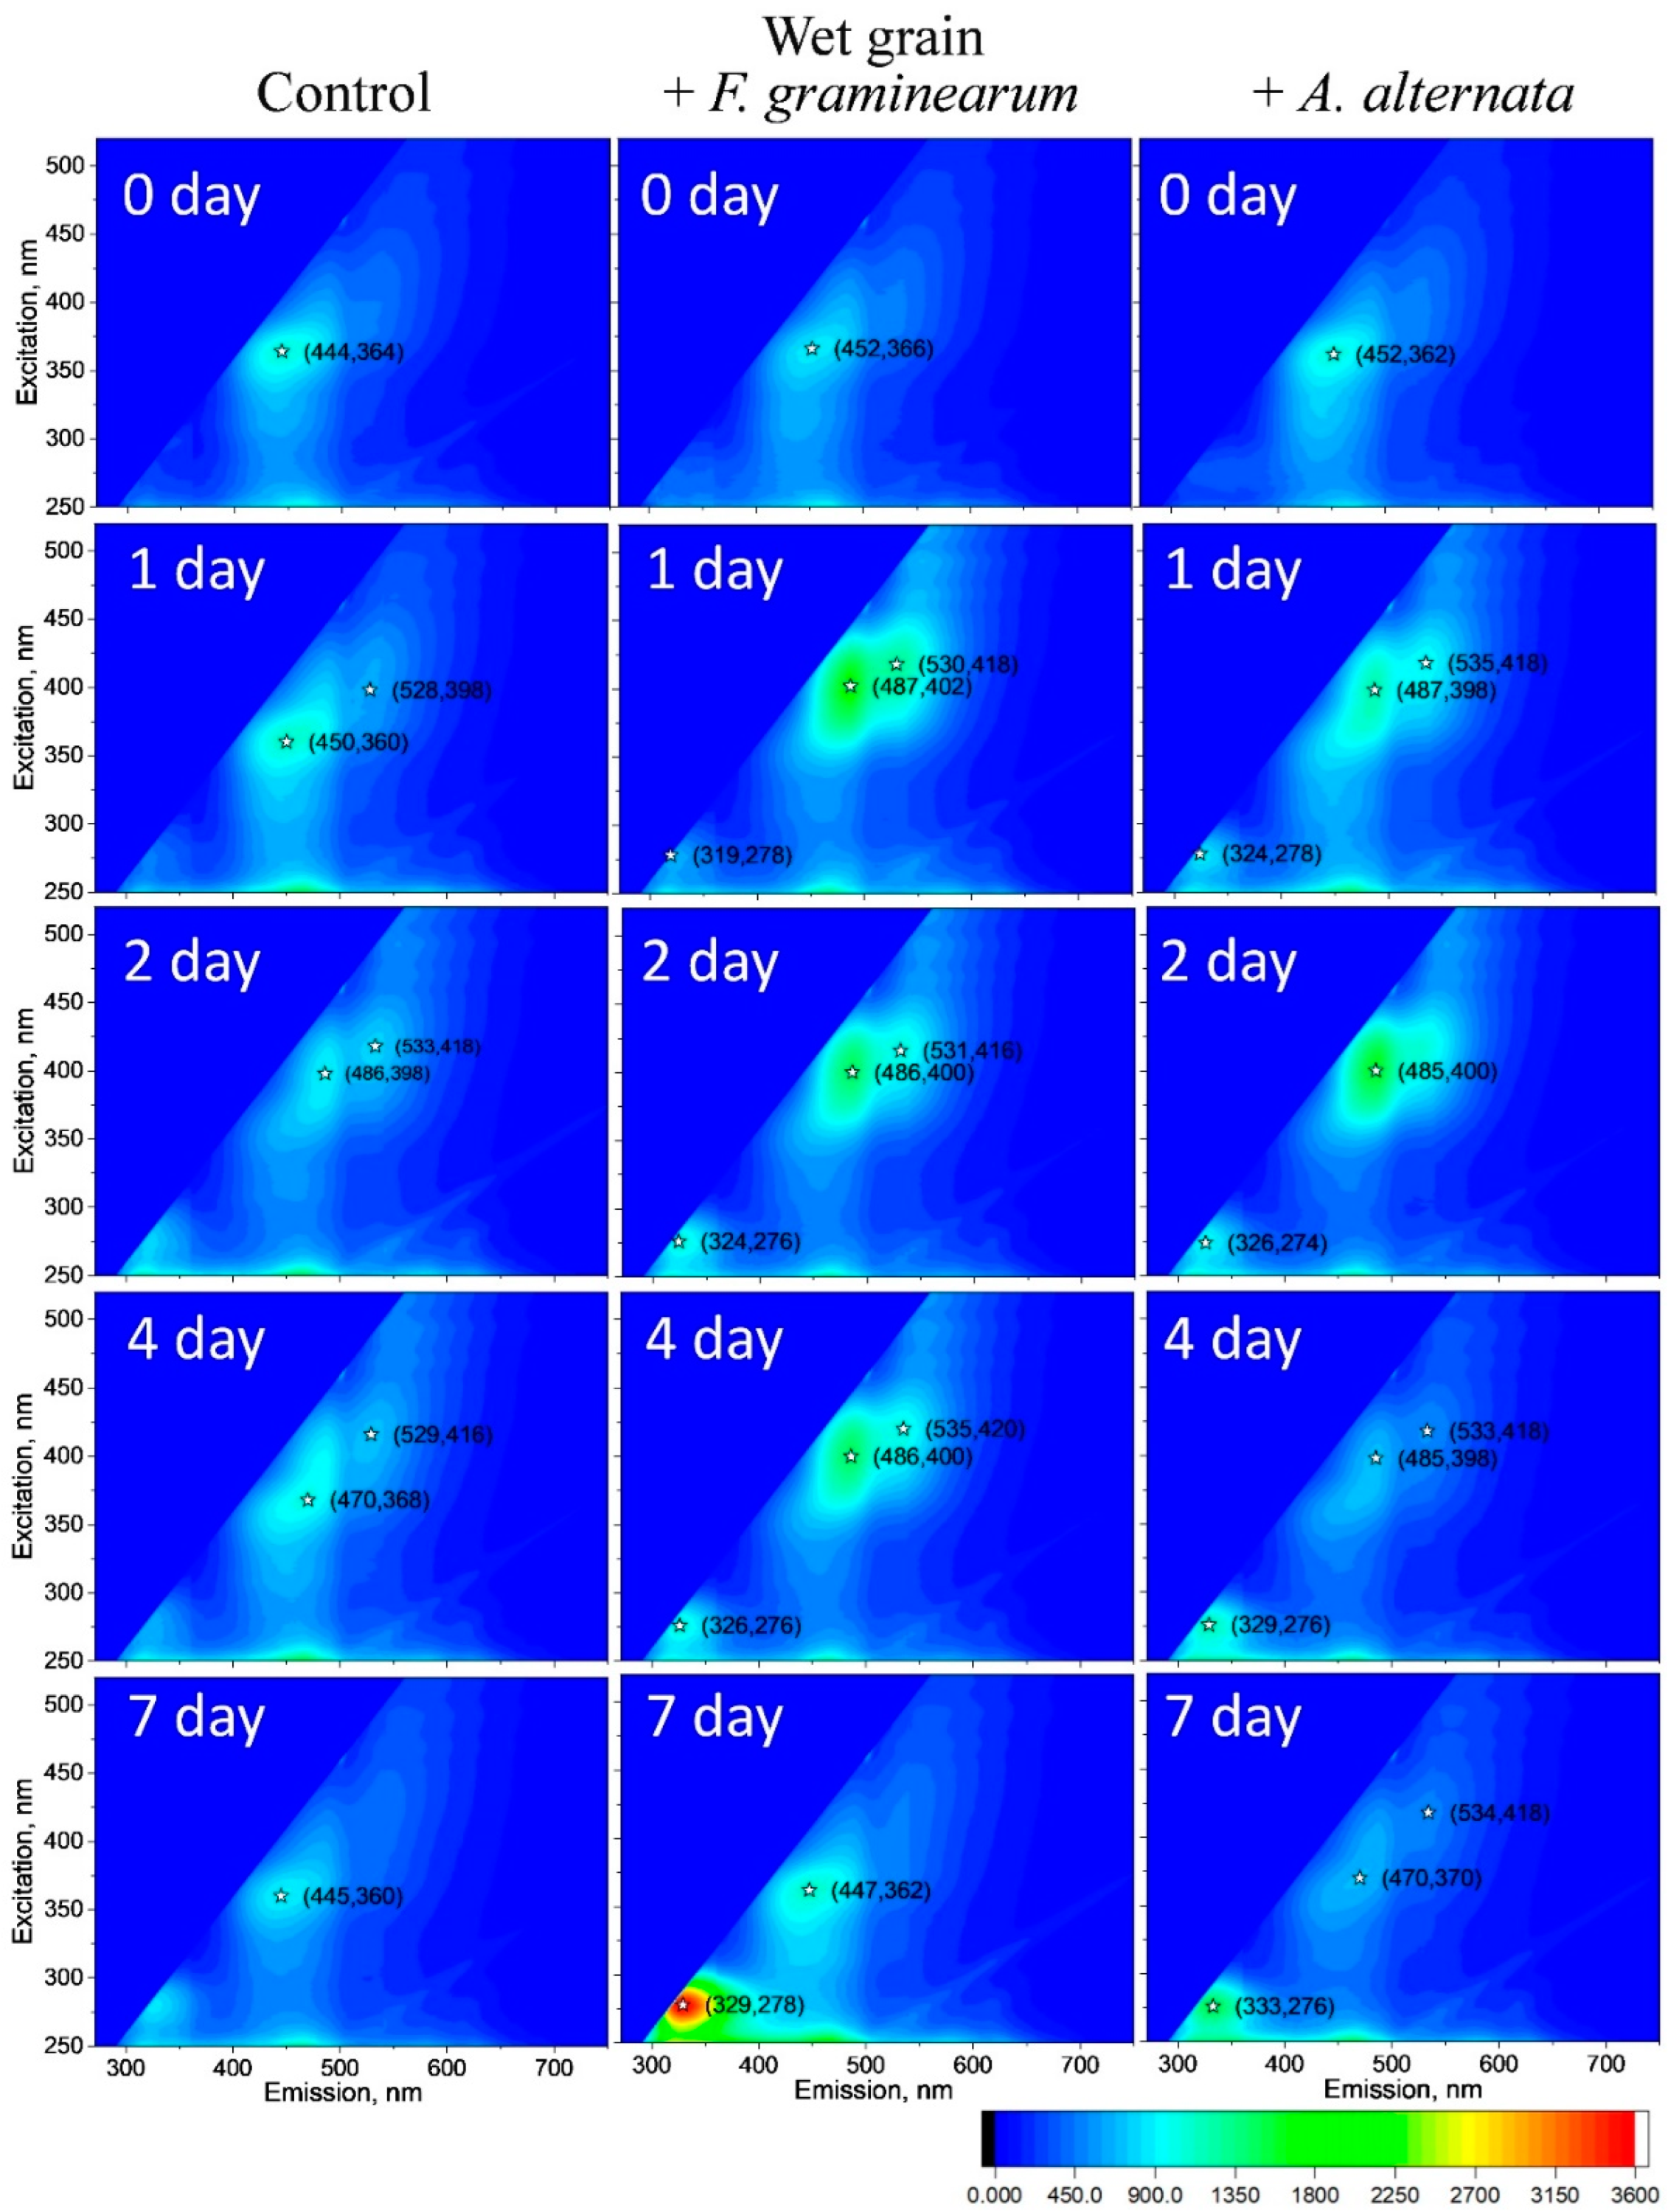
2.3. Measurement of Fluorescence of Control and Infected Grains and F. graminearum and A. alternata Cultures
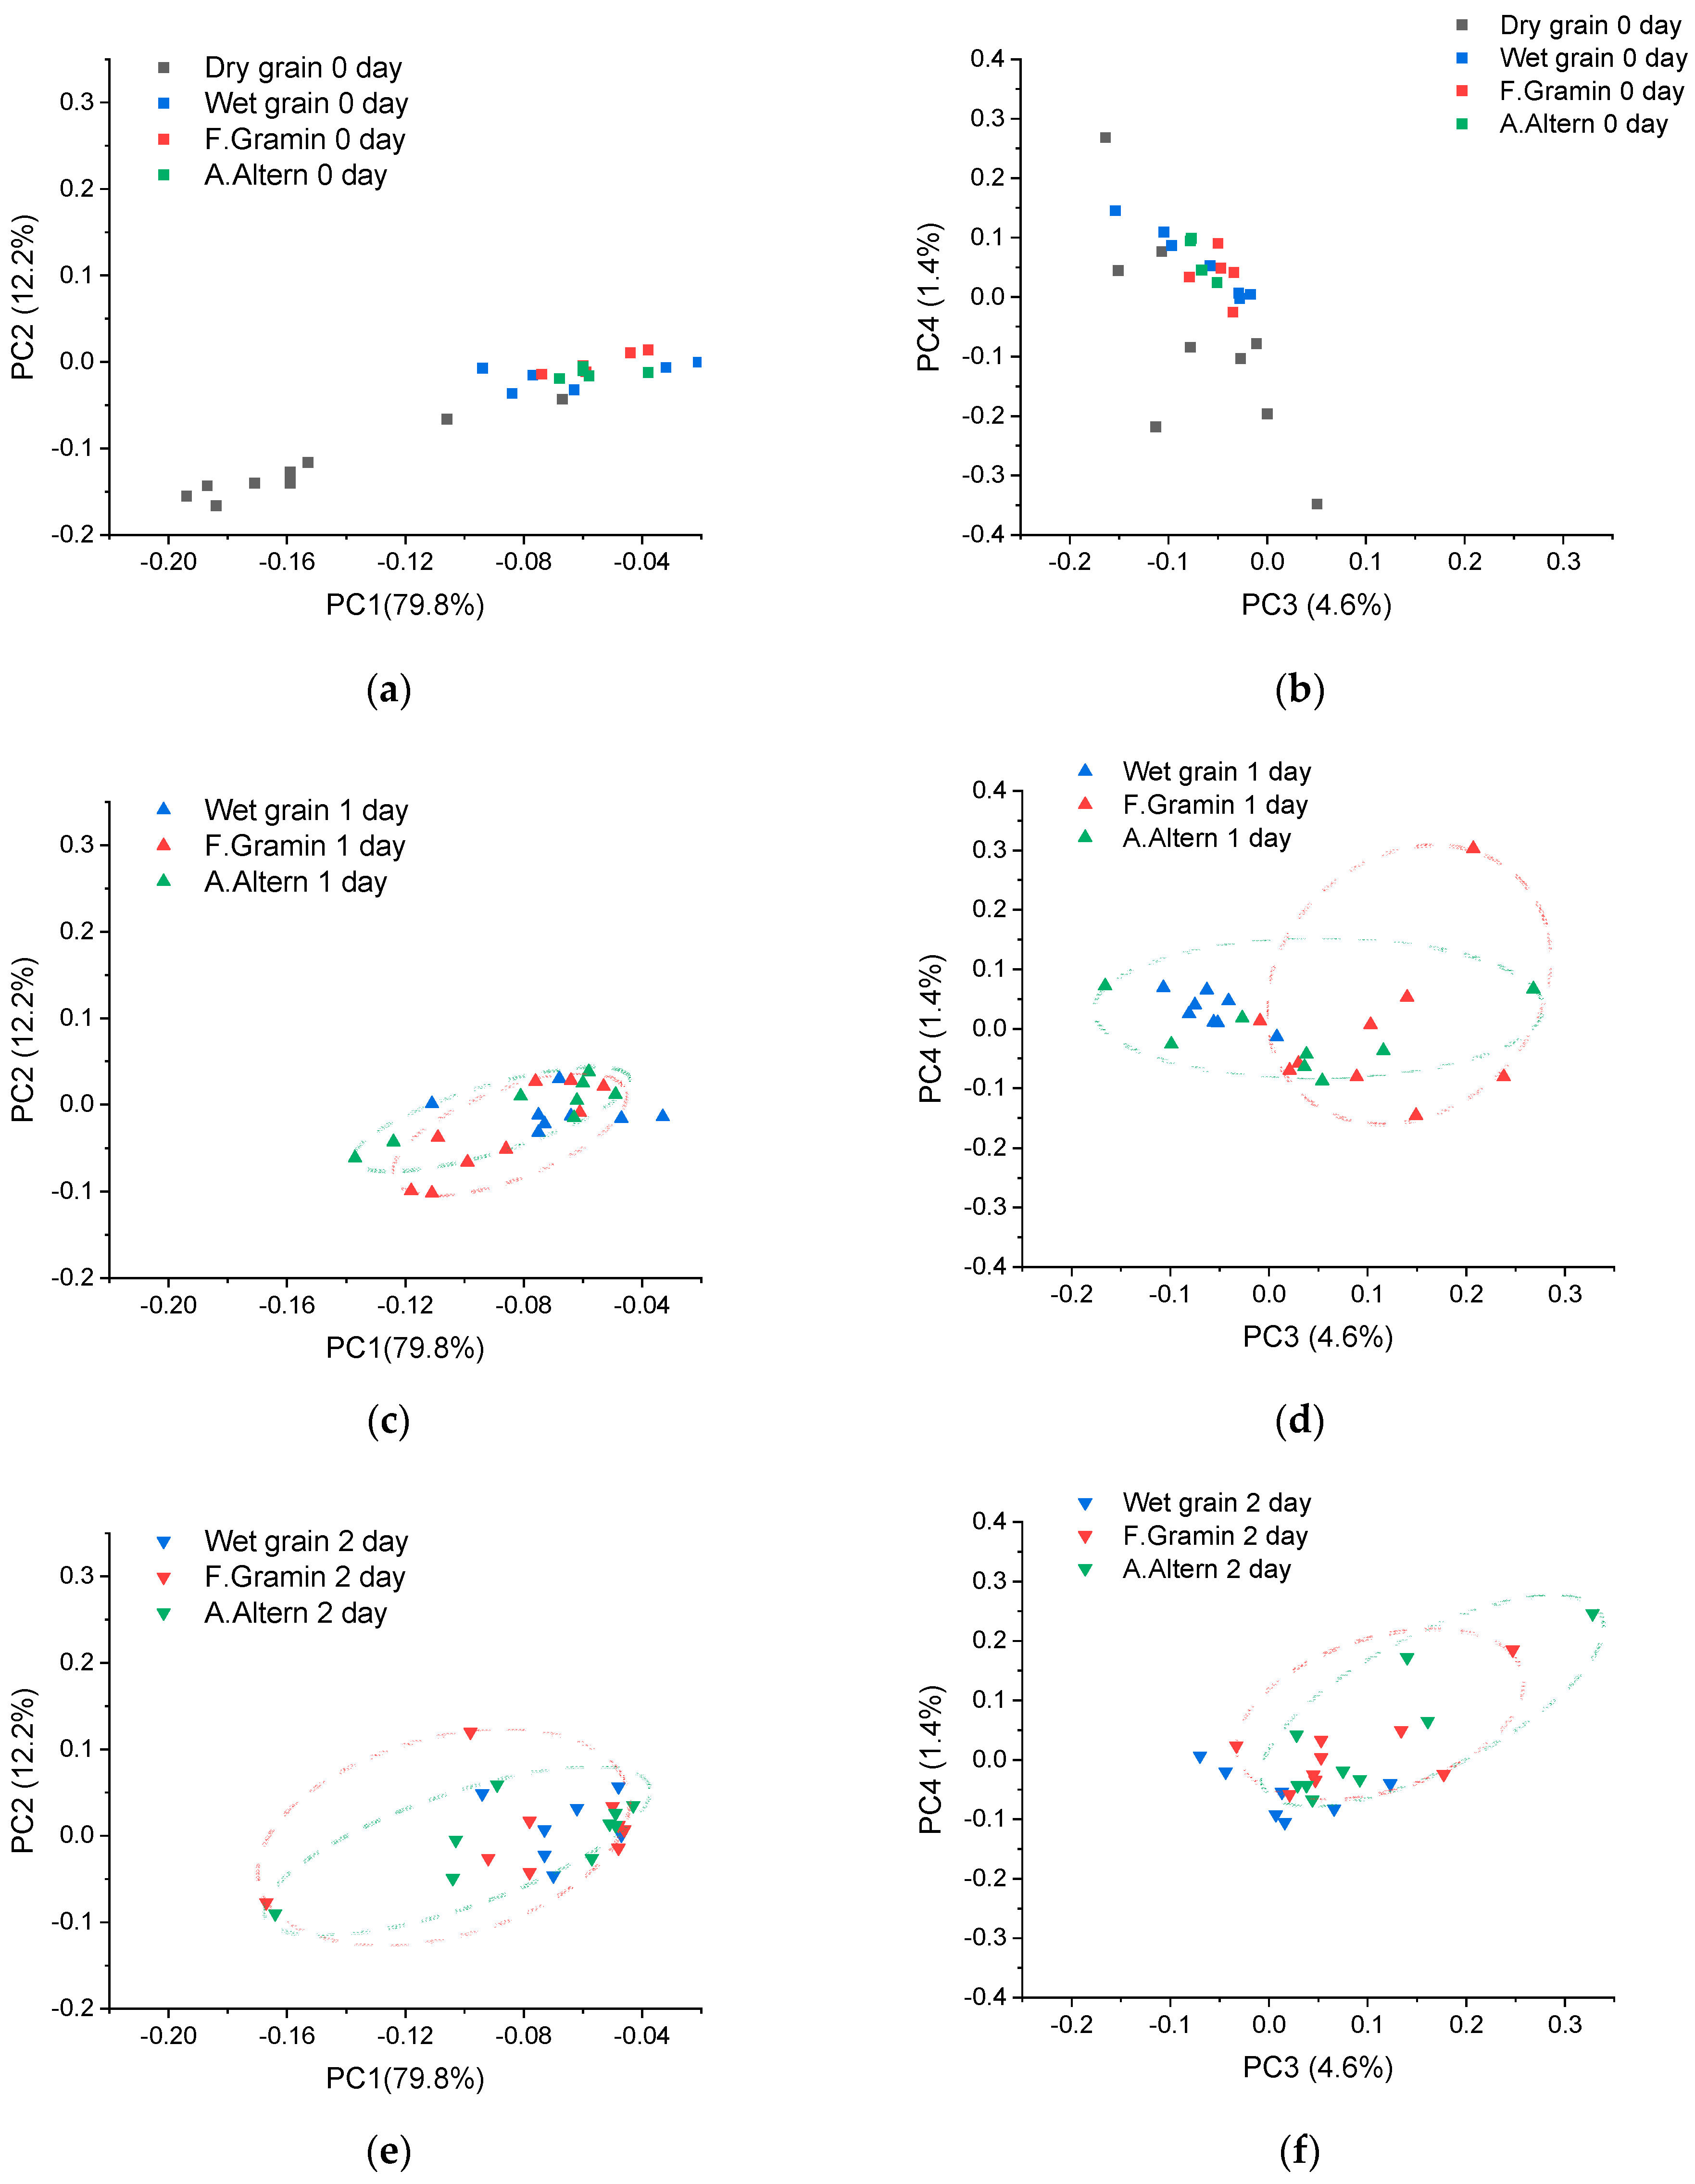
2.4. Principal Component Analysis
2.5. Finding the Peaks of the Emission–Excitation Matrix
3. Results
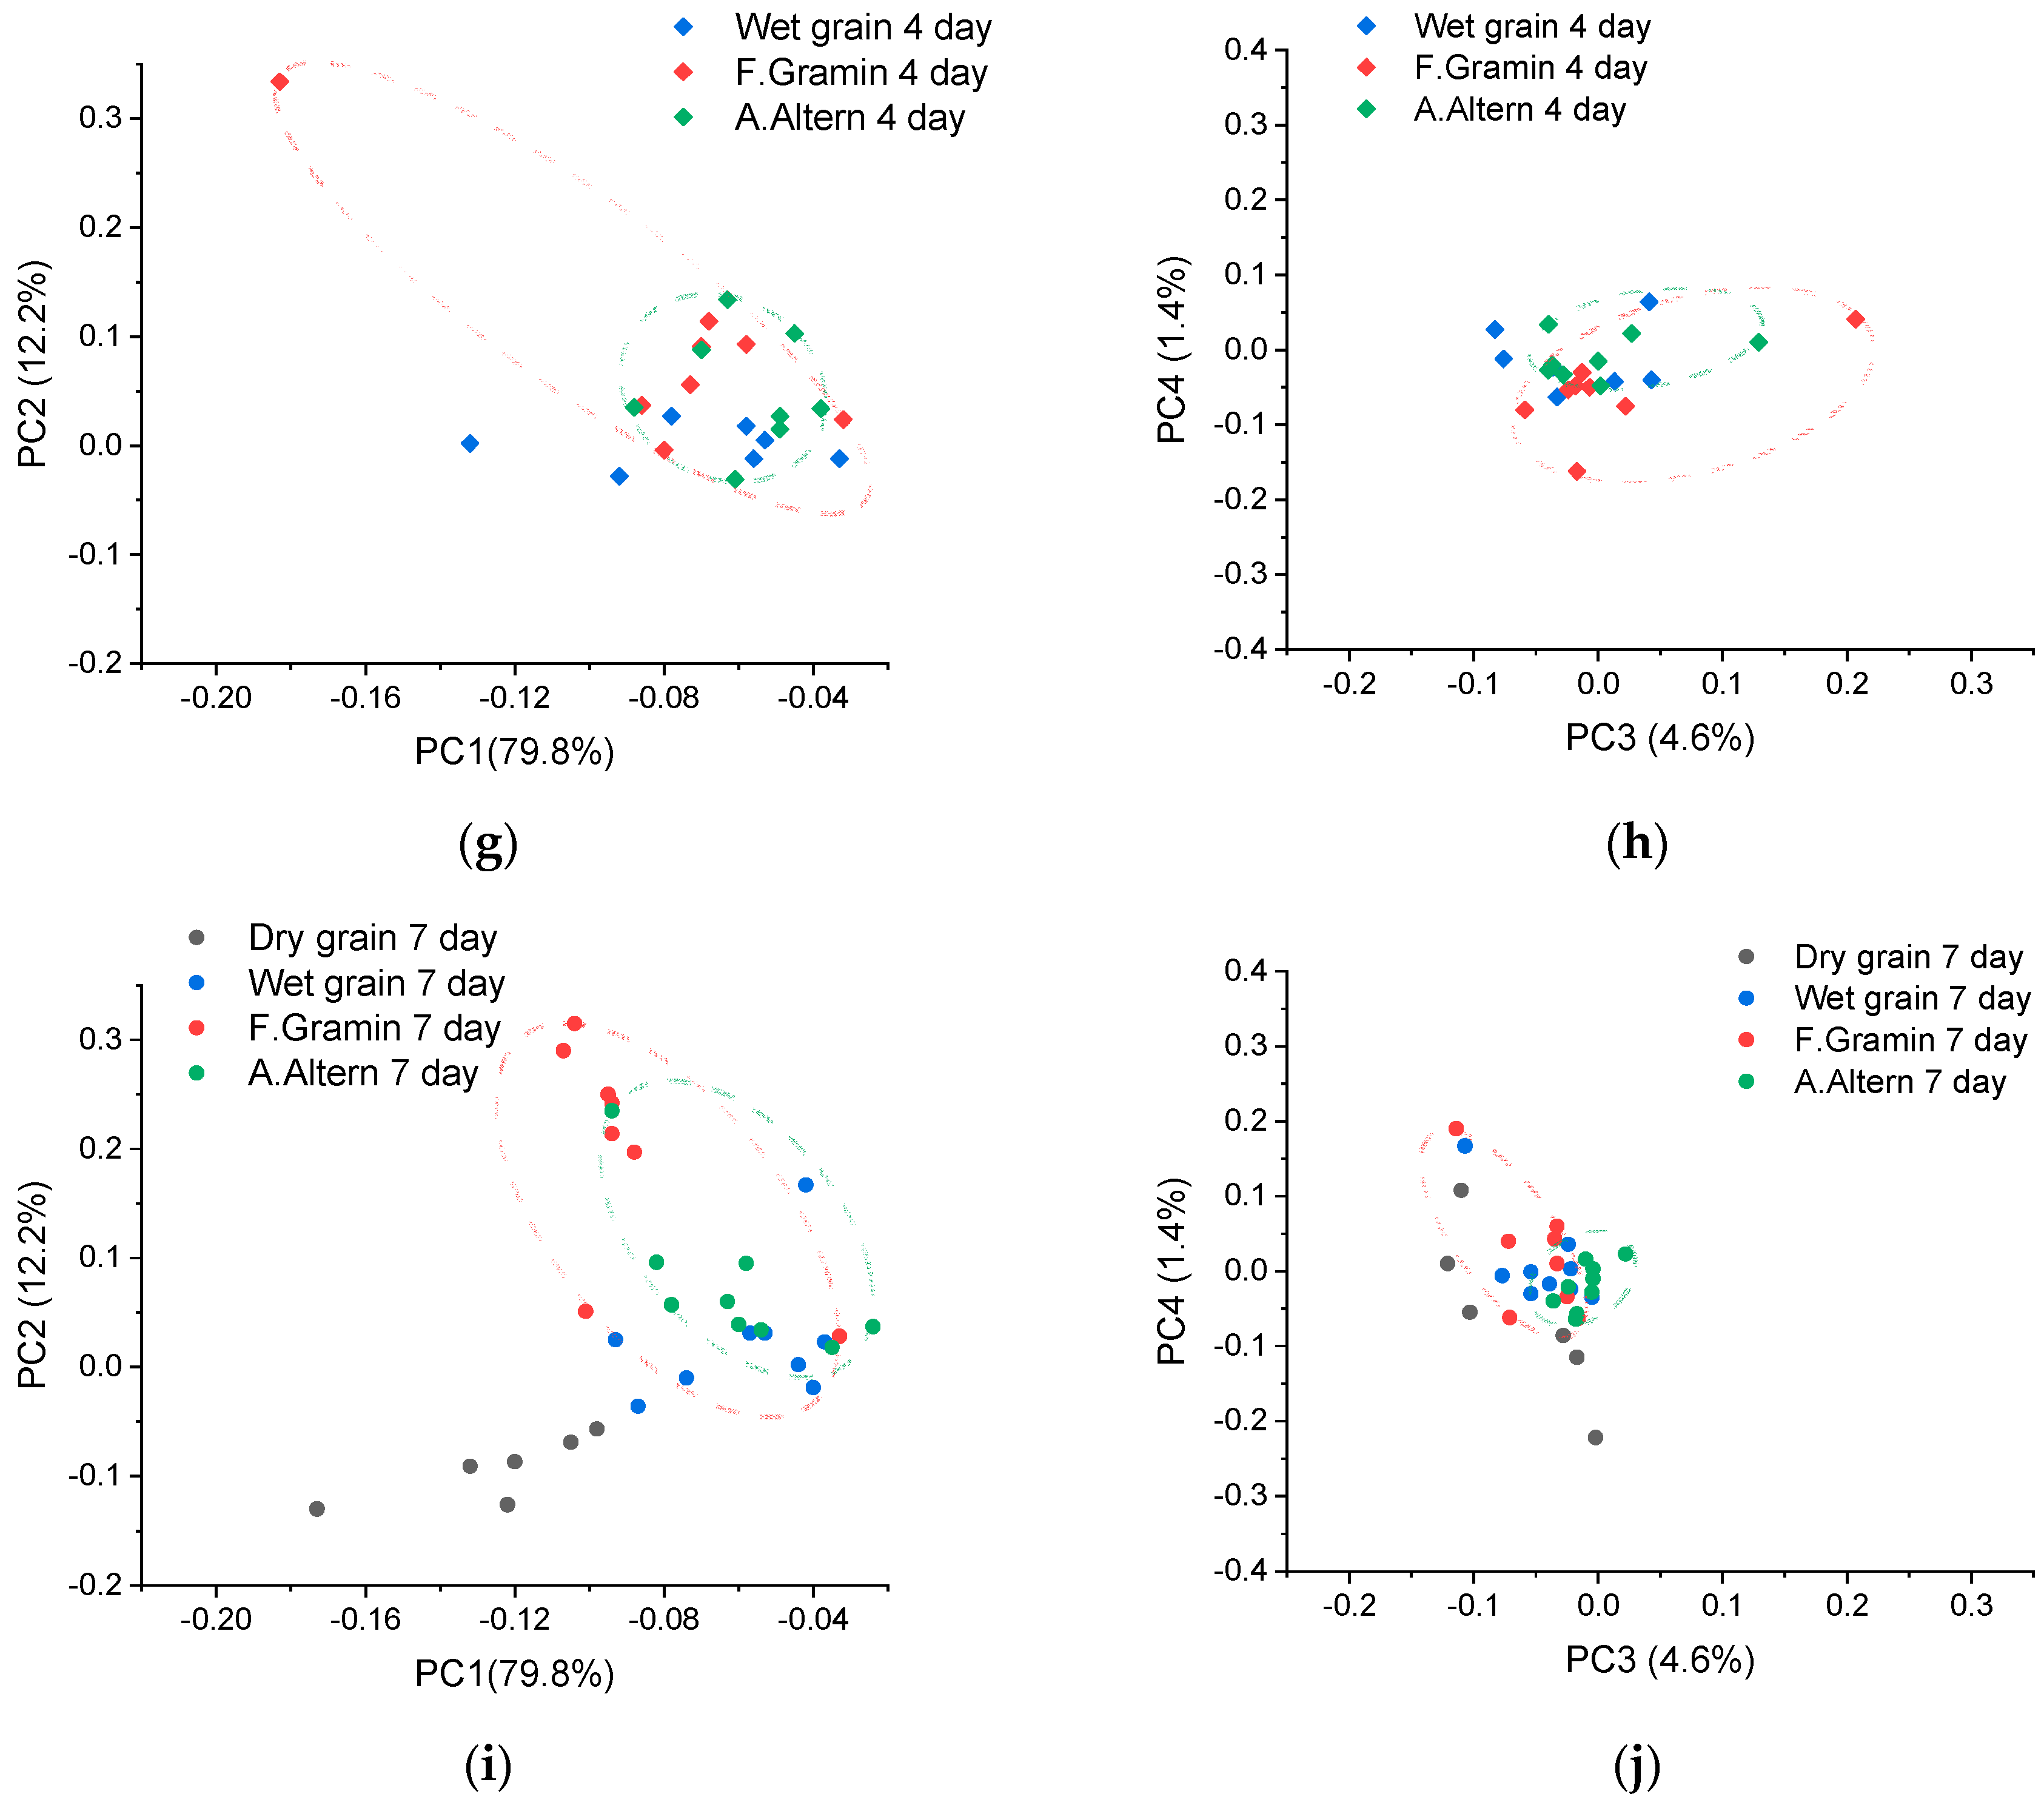
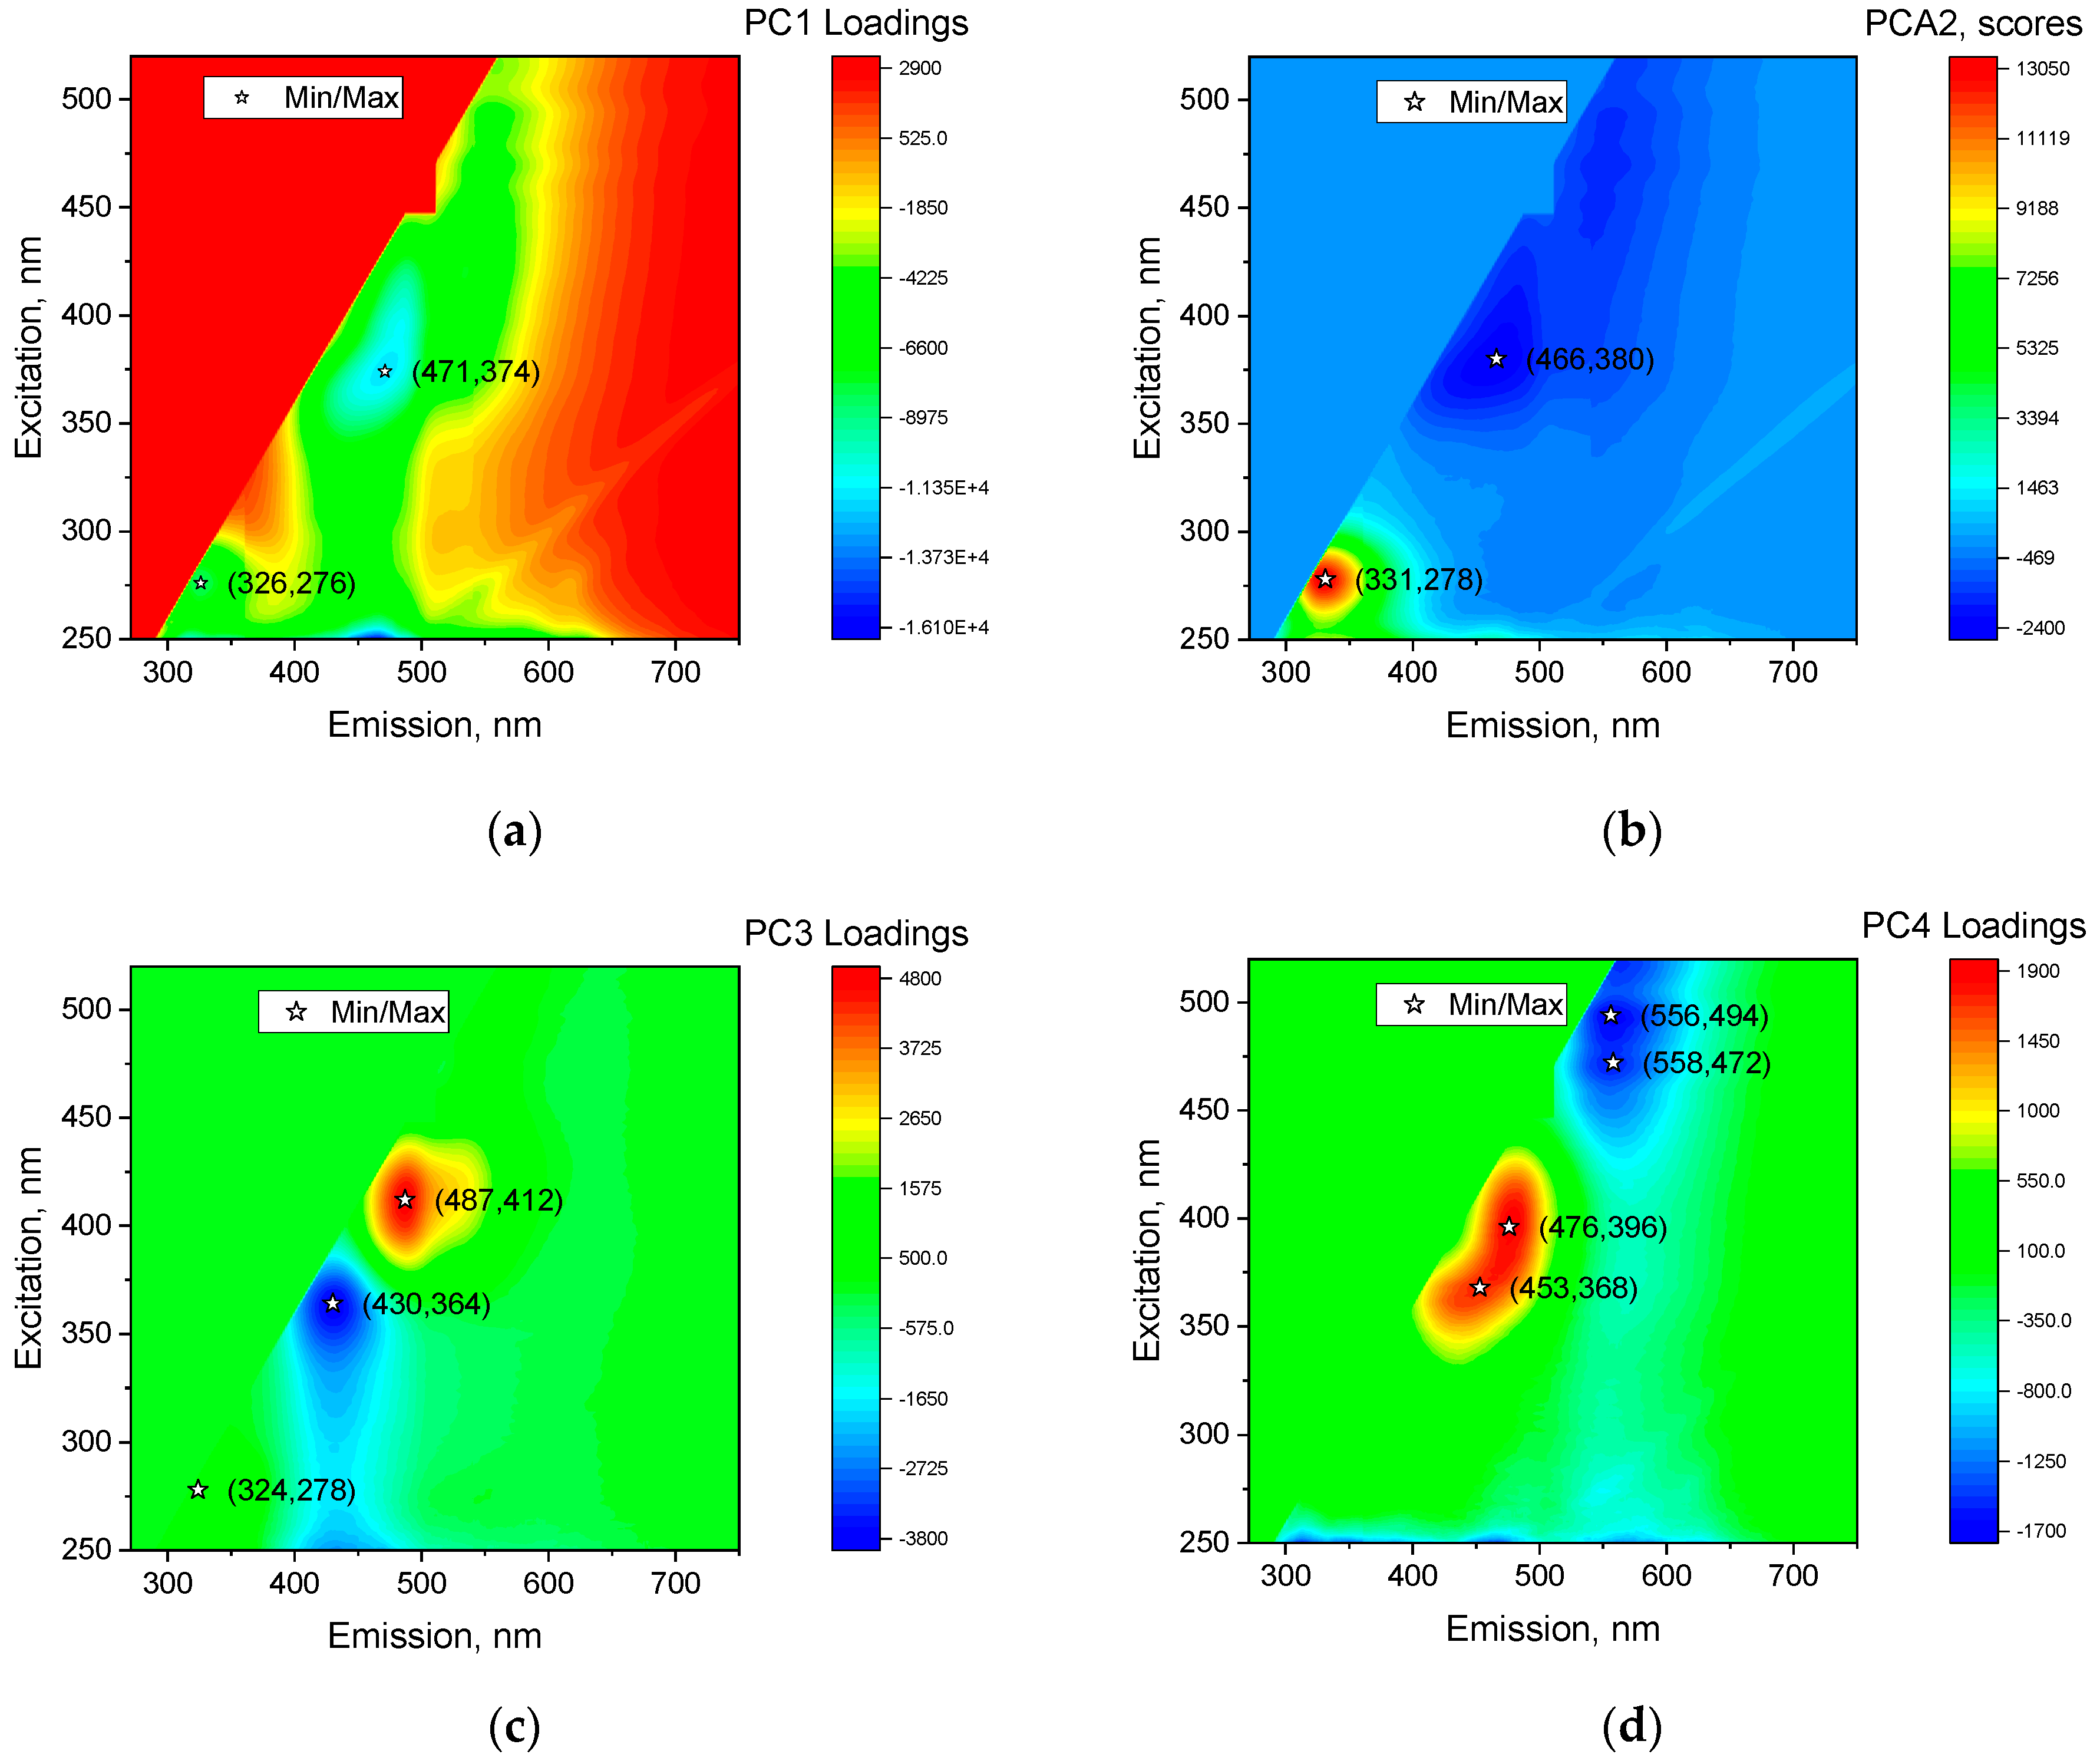
3.1. Principal Component Analysis
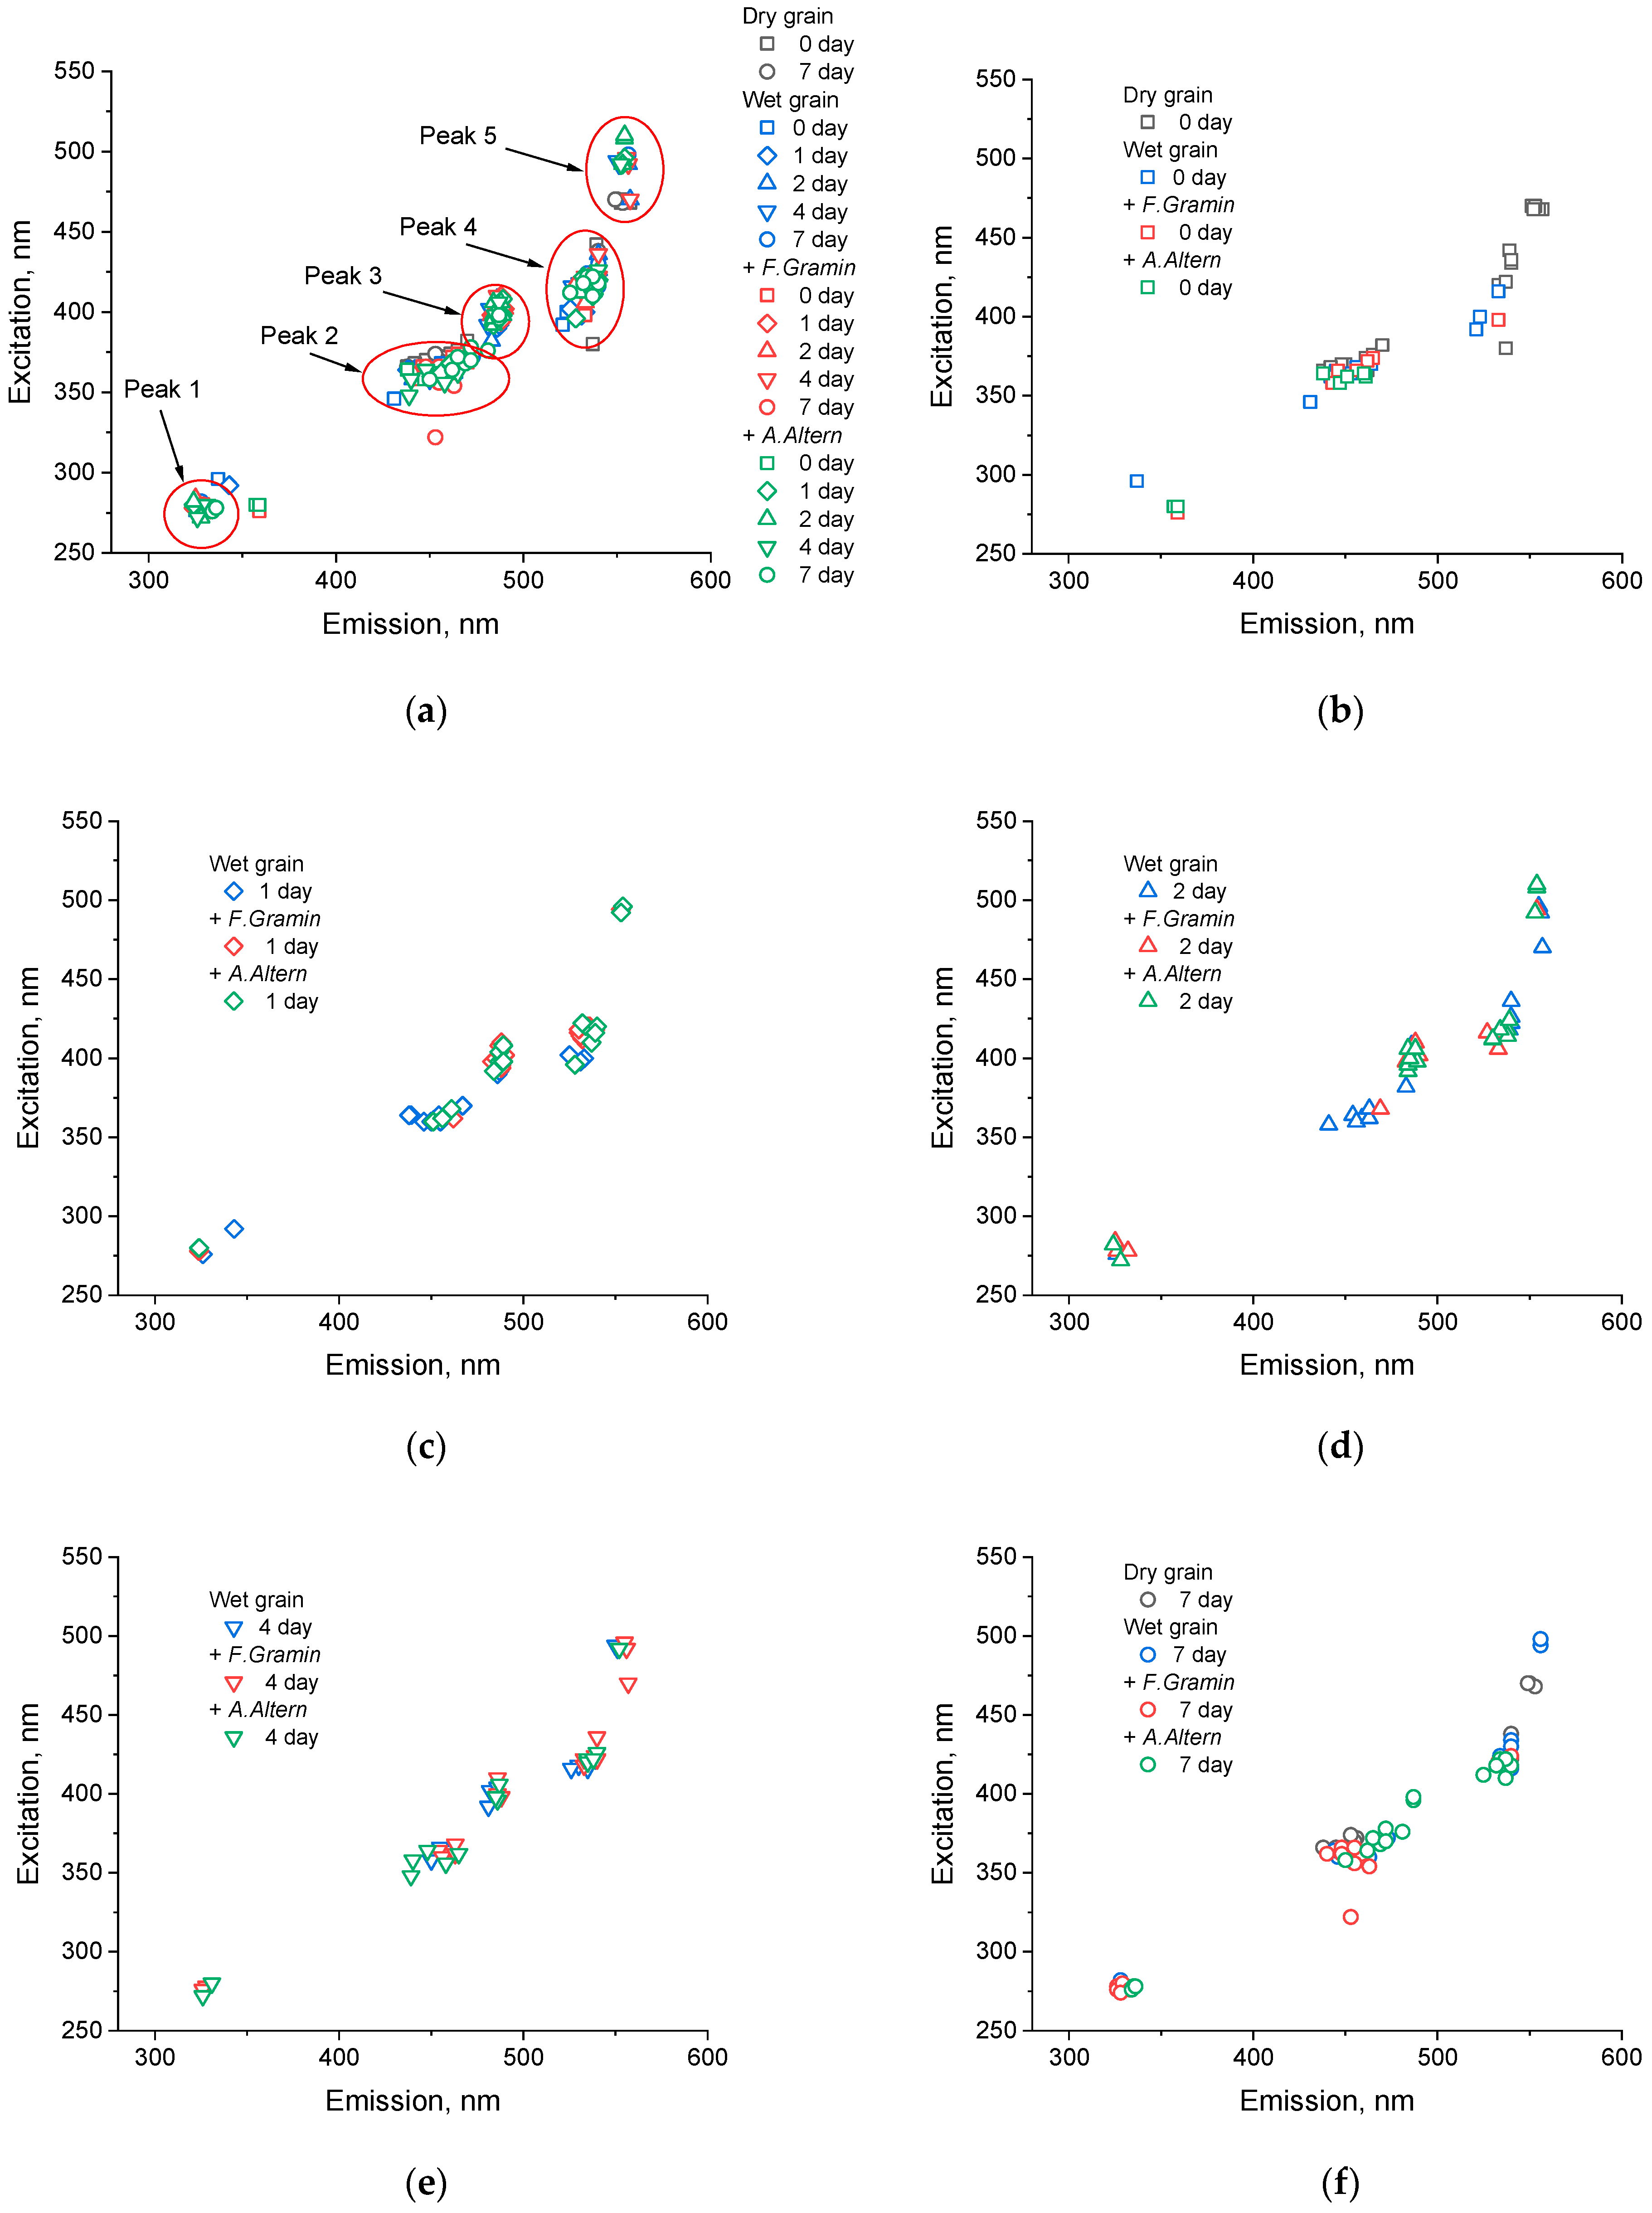
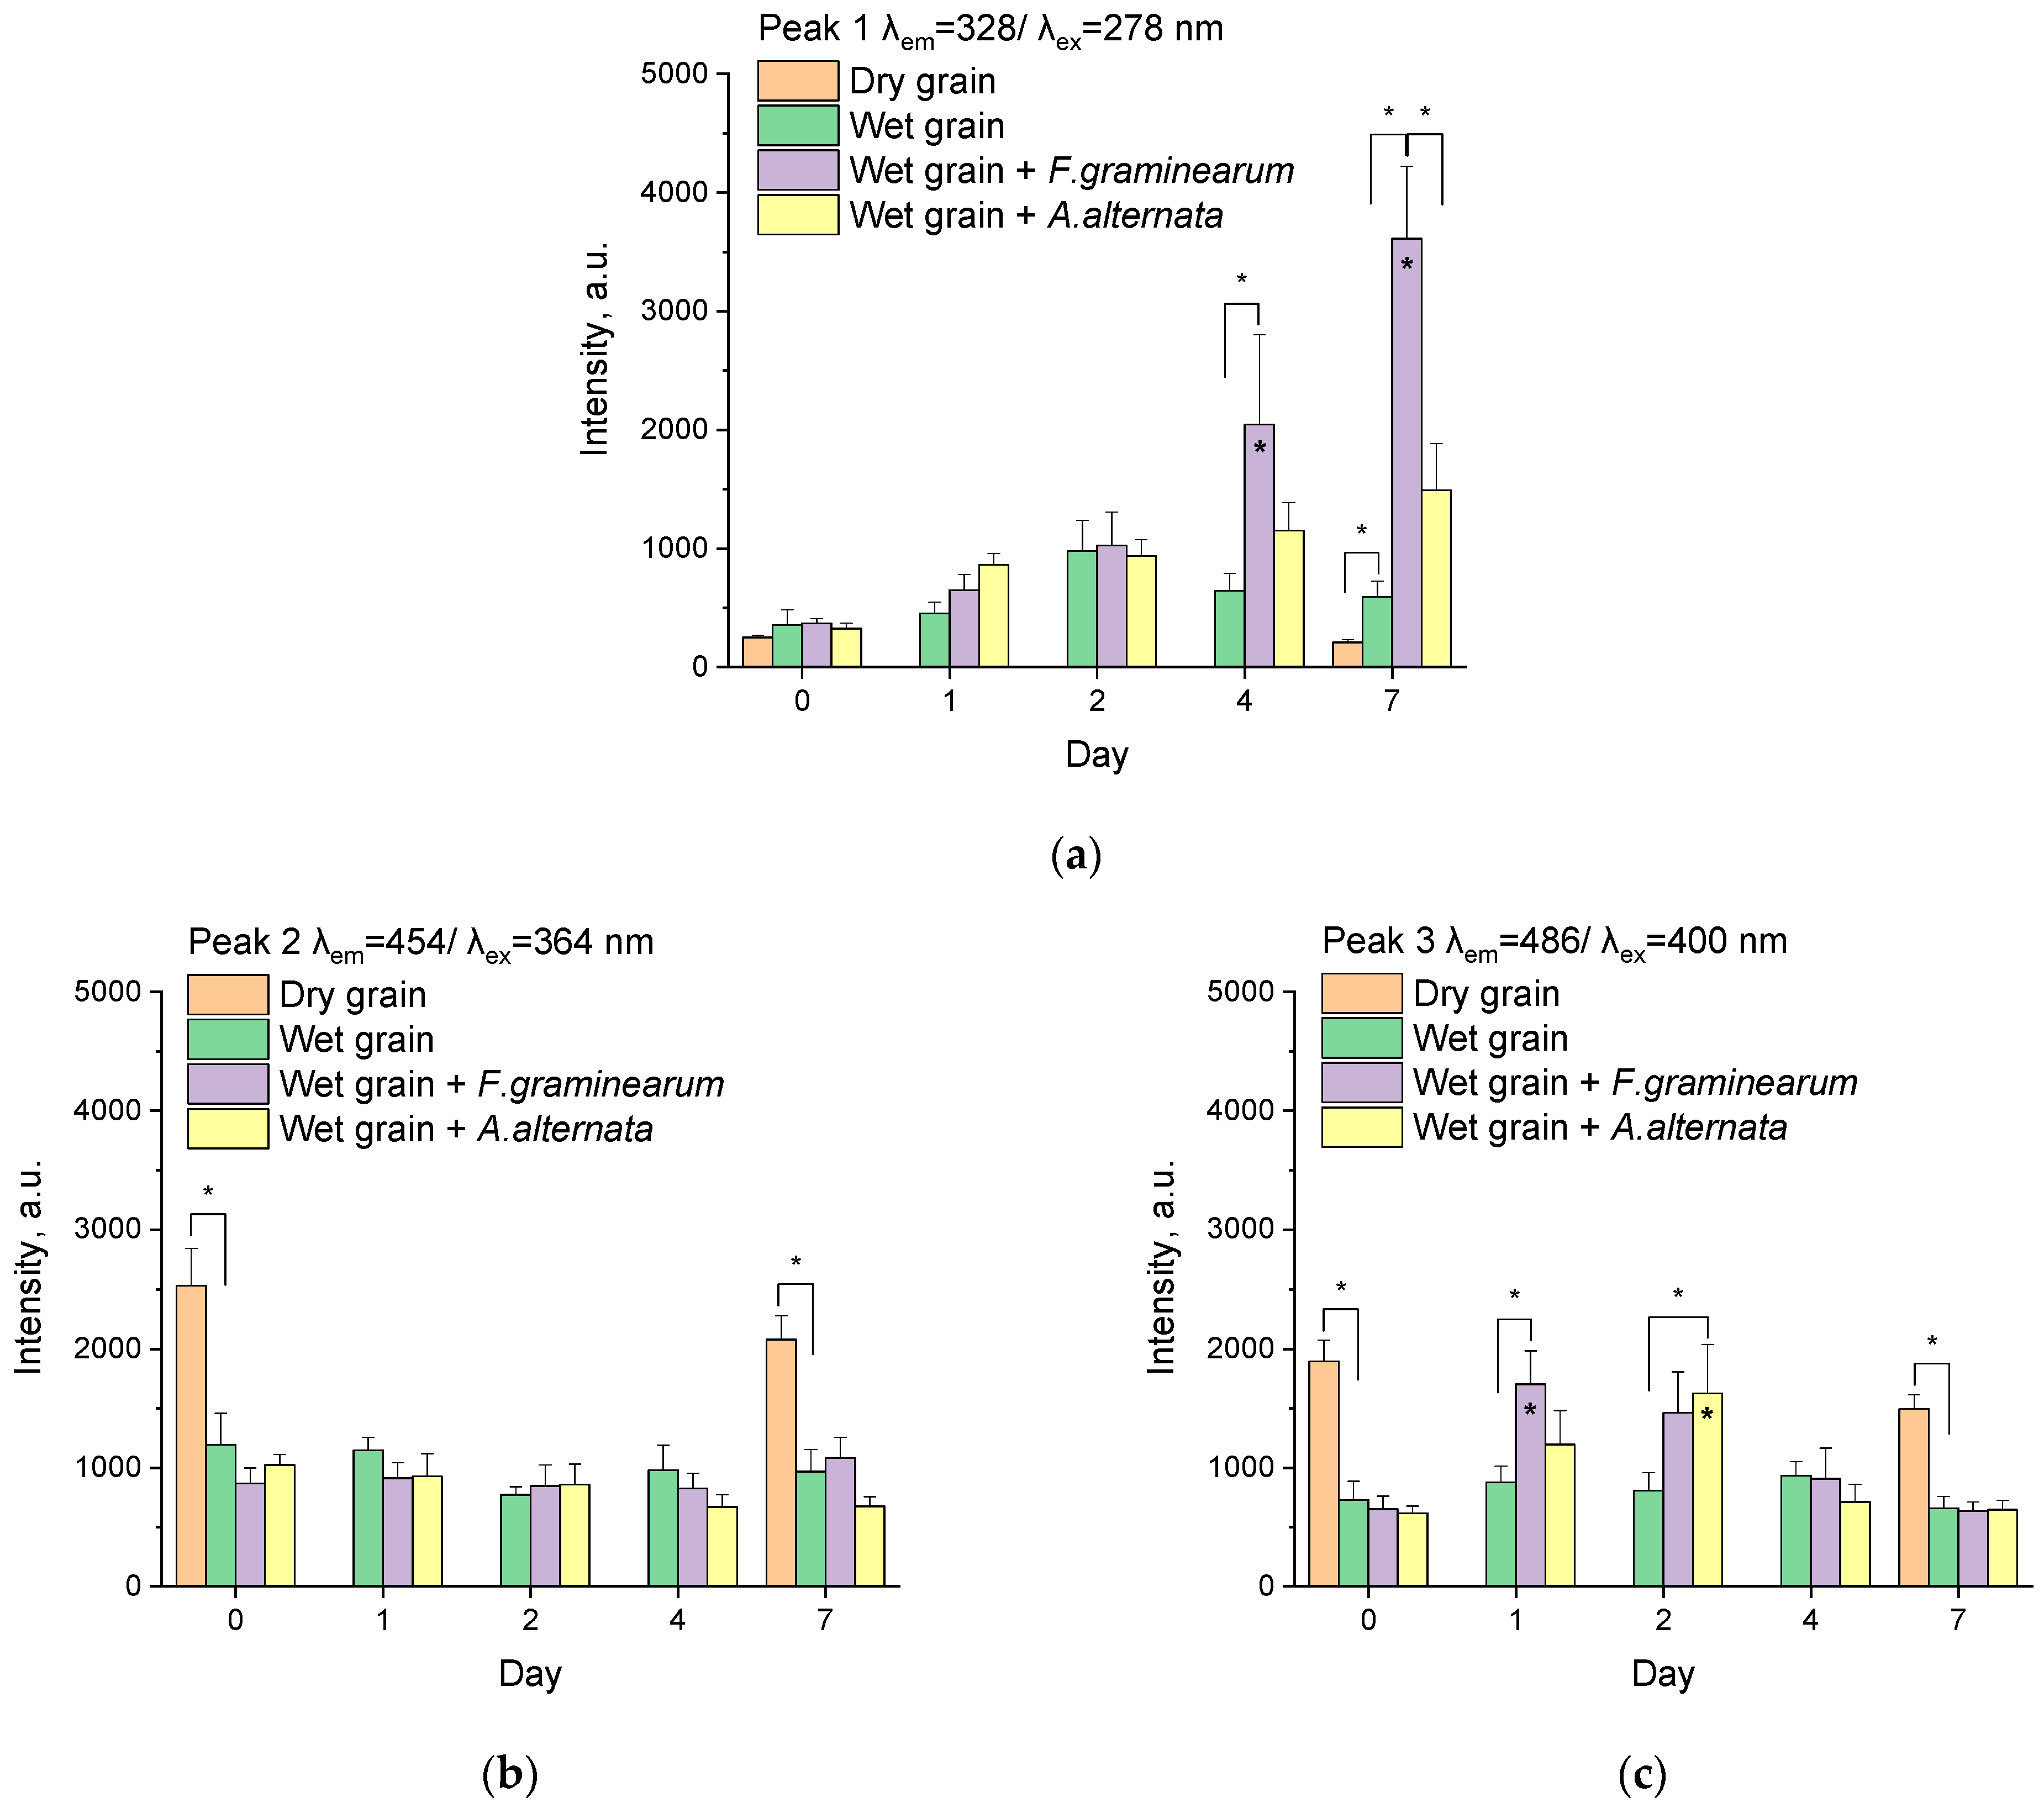
3.2. Analysis of Peaks
3.2.1. Peak 1
3.2.2. Peak 2
3.2.3. Peak 3
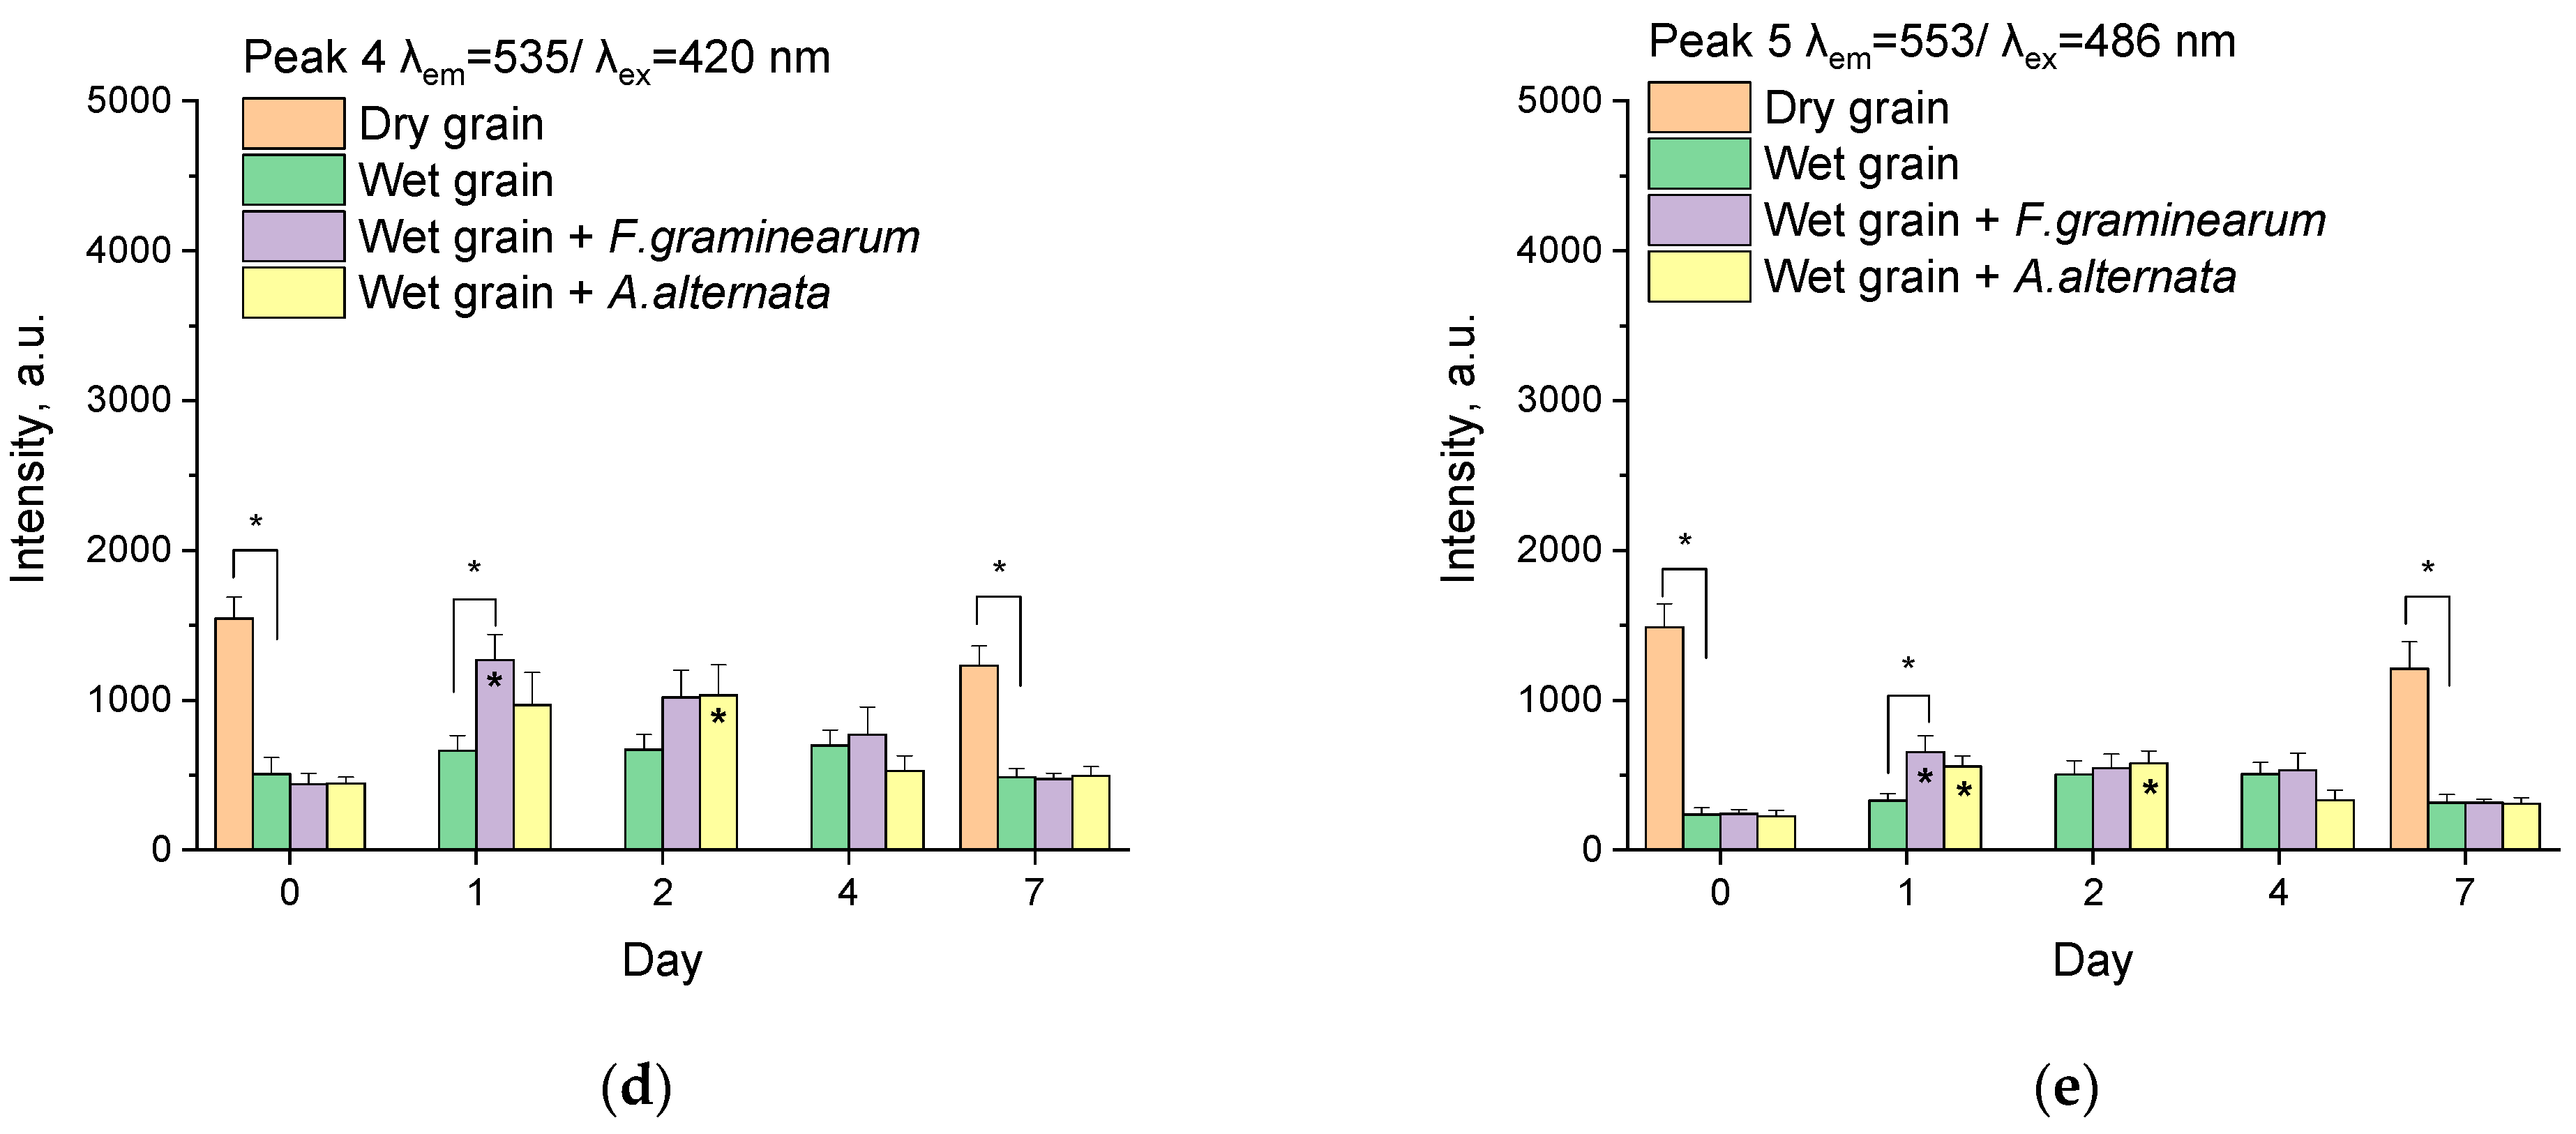
3.2.4. Peak 4
3.2.5. Peak 5

| Number and Center of the Peaks (λex/λem, nm) | Substances | Maximum of λex/λem for Substances, nm | References |
|---|---|---|---|
| 1 (328/278) | Amino acids, proteins | 282–363/255–295 | [8,66] |
| Lignin | 360/280 | [52] | |
| 2 (455/364) | Phenolic acids (hydroxycinnamic), ferulic acids, coumaric acids | 410–460/340–380 | [8,59,60,61,62] |
| Pteridine compounds (folic acid, neopterin etc.) | 373–458/331–361 | [8,63,64] | |
| Chitin | 450–458/254, 305, 370–373 | [8] | |
| 413/335 | [67,68,69] | ||
| Coumarin | 455/280 and 340 | [8] | |
| Chlorogenic acid | 430–440/320–330 | [70] | |
| NADPH, NADH | 440–480/330–380 | [8,55,56] | |
| Cellulose | 410–460/330–340 | [8,66] | |
| Lignin | 419–458/282, 331–345 | [62,66] | |
| Suberin | 450–460/355 | [62] | |
| Lipofuscin | 460–670/345–490 | [71,72,73] | |
| Flavonoids | 440–610/365 | [57,62,65] | |
| Alkaloids | 410–600/360–380 | [57,58,74] | |
| Sporopollein | 400–650/300–550 | [57,58,75] | |
| Terpenoids | 400–725/250–395 | [57,58] | |
| Mycotoxins (deoxynivalenol, nivalenol, zearalenone, and alternariol) | 398–465/295–393 | [76,77,78,79,80,81] | |
| Metabolites (quinones) | 430–480/270–400 | [82,83] | |
| 3 (486/400) | Sporopollenin, cutin, suberin, lignin | 400–650/300–550 | [57,58,75,84] |
| Lipofuscin | 430–670/340–490 | [72,73] | |
| Terpenoids | 400–725/250–395 | [57,58] | |
| Metabolites (quinones) | 430–480/270–400 | [82,83] | |
| 4 (536/420) | Flavins (riboflavin, FAD, FMN) | 540/360–445 | [8,56,85] |
| Carotenoids | 520–560/400–500 | [57,65] | |
| Sporopollenin | 400–650/300–550 | [57,58,75] | |
| Melanin | 543–548/469–471 | [86] | |
| Phospholipids | 540,560/436 | [87] | |
| Lipofuscin | 430–670/340–490 | [72,73] | |
| Terpenoids | 400–725/250–395 | [57,58] | |
| 5 (553/486) | Some lignin and/or cuticle compounds | 590 and 540/488 | [53] |
| Flavonoids | 540–550/488 | [52] | |
| Lignin | 530–560/488 | [52] | |
| Tannins | 500–650/488 | [52] | |
| Sporopollenin | 400–650/300–550 | [57,58,75] | |
| Melanin | 543–548/469–471 | [86] | |
| Phospholipids | 540,560/436 | [87] | |
| Lipofuscin | 430–670/340–490 | [72,73] |
4. Discussion
5. Conclusions
Supplementary Materials
Author Contributions
Funding
Data Availability Statement
Conflicts of Interest
References
- Gudkov, S.V.; Sarimov, R.M.; Astashev, M.E.e.; Pishchalnikov, R.Y.; Yanykin, D.V.; Simakin, A.V.; Shkirin, A.V.; Serov, D.A.; Konchekov, E.M.; Ogly, G. Modern physical methods and technologies in agriculture. Phys. Uspekhi 2024, 67, 194–210. [Google Scholar] [CrossRef]
- Kremneva, O.Y.; Danilov, R.Y.; Sereda, I.; Tutubalina, O.; Pachkin, A.; Zimin, M. Spectral characteristics of winter wheat varieties depending on the development degree of Pyrenophora tritici-repentis. Precis. Agric. 2023, 24, 830–852. [Google Scholar] [CrossRef]
- Graeff, S.; Link, J.; Claupein, W. Identification of powdery mildew (Erysiphe graminis sp. tritici) and take-all disease (Gaeumannomyces graminis sp. tritici) in wheat (Triticum aestivum L.) by means of leaf reflectance measurements. Open Life Sci. 2006, 1, 275–288. [Google Scholar] [CrossRef]
- Gudkov, S.V.; Matveeva, T.A.; Sarimov, R.M.; Simakin, A.V.; Stepanova, E.V.; Moskovskiy, M.N.; Dorokhov, A.S.; Izmailov, A.Y. Optical methods for the detection of plant pathogens and diseases. Agriengineering 2023, 5, 1789–1812. [Google Scholar] [CrossRef]
- Pankin, D.; Povolotckaia, A.; Borisov, E.; Povolotskiy, A.; Borzenko, S.; Gulyaev, A.; Gerasimenko, S.; Dorochov, A.; Khamuev, V.; Moskovskiy, M. Investigation of Spectroscopic Peculiarities of Ergot-Infected Winter Wheat Grains. Foods 2023, 12, 3426. [Google Scholar] [CrossRef]
- Egging, V.; Nguyen, J.; Kurouski, D. Detection and identification of fungal infections in intact wheat and sorghum grain using a hand-held Raman spectrometer. Anal. Chem. 2018, 90, 8616–8621. [Google Scholar] [CrossRef] [PubMed]
- Moskovskiy, M.N.; Sibirev, A.V.; Gulyaev, A.A.; Gerasimenko, S.A.; Borzenko, S.I.; Godyaeva, M.M.; Noy, O.V.; Nagaev, E.I.; Matveeva, T.A.; Sarimov, R.M. Raman spectroscopy enables non-invasive identification of mycotoxins p. Fusarium of winter wheat seeds. Photonics 2021, 8, 587. [Google Scholar] [CrossRef]
- Pan, Y.-L. Detection and characterization of biological and other organic-carbon aerosol particles in atmosphere using fluorescence. J. Quant. Spectrosc. Radiat. Transf. 2015, 150, 12–35. [Google Scholar] [CrossRef]
- Paskhin, M.O.; Yanykin, D.V.; Gudkov, S.V. Current approaches to light conversion for controlled environment agricultural applications: A review. Horticulturae 2022, 8, 885. [Google Scholar] [CrossRef]
- Zhou, C.; Mao, J.; Zhao, H.; Rao, Z.; Zhang, B. Monitoring and predicting Fusarium wilt disease in cucumbers based on quantitative analysis of kinetic imaging of chlorophyll fluorescence. Appl. Opt. 2020, 59, 9118–9125. [Google Scholar] [CrossRef] [PubMed]
- Pavicic, M.; Mouhu, K.; Hautsalo, J.; Jacobson, D.; Jalli, M.; Himanen, K. Image-based time series analysis to establish differential disease progression for two Fusarium head blight pathogens in oat spikelets with variable resistance. Front. Plant Sci. 2023, 14, 1126717. [Google Scholar] [CrossRef] [PubMed]
- Knaus, H.; Blab, G.A.; van Veluw, G.J.; Gerritsen, H.C.; Wösten, H.A. Label-free fluorescence microscopy in fungi. Fungal Biol. Rev. 2013, 27, 60–66. [Google Scholar] [CrossRef]
- Christiansen, J.V.; Isbrandt, T.; Petersen, C.; Sondergaard, T.E.; Nielsen, M.R.; Pedersen, T.B.; Sørensen, J.L.; Larsen, T.O.; Frisvad, J.C. Fungal quinones: Diversity, producers, and applications of quinones from Aspergillus, Penicillium, Talaromyces, Fusarium, and Arthrinium. Appl. Microbiol. Biotechnol. 2021, 105, 8157–8193. [Google Scholar] [CrossRef]
- Jha, Y. Differential fungal metabolite accumulation in response to abiotic and biotic stresses. In Fungal Secondary Metabolites; Elsevier: Amsterdam, The Netherlands, 2024; pp. 457–467. [Google Scholar]
- Fedoseeva, E.; Patsaeva, S.; Stom, D.; Terekhova, V. Excitation-dependent fluorescence helps to indicate fungal contamination of aquatic environments and to differentiate filamentous fungi. Photonics 2022, 9, 692. [Google Scholar] [CrossRef]
- Corcel, M.; Devaux, M.-F.; Guillon, F.; Barron, C. Comparison of UV and visible autofluorescence of wheat grain tissues in macroscopic images of cross-sections and particles. Comput. Electron. Agric. 2016, 127, 281–288. [Google Scholar] [CrossRef]
- Zeković, I.; Lenhardt, L.; Dramićanin, T.; Dramićanin, M.D. Classification of intact cereal flours by front-face synchronous fluorescence spectroscopy. Food Anal. Methods 2012, 5, 1205–1213. [Google Scholar] [CrossRef]
- Ram, M.; Seitz, L.M.; Dowell, F.E. Natural fluorescence of red and white wheat kernels. Cereal Chem. 2004, 81, 244–248. [Google Scholar] [CrossRef]
- Matveyeva, T.A.; Sarimov, R.M.; Simakin, A.V.; Astashev, M.E.; Burmistrov, D.E.; Lednev, V.N.; Sdvizhenskii, P.A.; Grishin, M.Y.; Pershin, S.M.; Chilingaryan, N.O. Using fluorescence spectroscopy to detect rot in fruit and vegetable crops. Appl. Sci. 2022, 12, 3391. [Google Scholar] [CrossRef]
- Sarimov, R.M.; Lednev, V.N.; Sibirev, A.V.; Gudkov, S.V. The use of fluorescence spectra for the detection of scab and rot in fruit and vegetable crops. Front. Phys. 2021, 8, 640887. [Google Scholar] [CrossRef]
- Ashurov, M.K.; Ashurov, E.M.; Astashev, M.E.; Baimler, I.V.; Gudkov, S.V.; Konchekov, E.M.; Lednev, V.N.; Lukina, N.A.; Matveeva, T.A.; Markendudis, A.G. Development of an environmentally friendly technology for the treatment of aqueous solutions with high-purity plasma for the cultivation of cotton, wheat and strawberries. ChemEngineering 2022, 6, 91. [Google Scholar] [CrossRef]
- Mandal, S.; Cramer, C.S. Comparing visual and image analysis techniques to quantify fusarium basal rot severity in mature onion bulbs. Horticulturae 2021, 7, 156. [Google Scholar] [CrossRef]
- Bashilov, A.M.; Efremenkov, I.Y.; Belyakov, M.V.; Lavrov, A.V.; Gulyaev, A.A.; Gerasimenko, S.A.; Borzenko, S.I.; Boyko, A.A. Determination of Main spectral and luminescent characteristics of winter wheat seeds infected with pathogenic microflora. Photonics 2021, 8, 494. [Google Scholar] [CrossRef]
- Bartolić, D.; Mutavdžić, D.; Carstensen, J.M.; Stanković, S.; Nikolić, M.; Krstović, S.; Radotić, K. Fluorescence spectroscopy and multispectral imaging for fingerprinting of aflatoxin-B1 contaminated (Zea mays L.) seeds: A preliminary study. Sci. Rep. 2022, 12, 4849. [Google Scholar] [CrossRef] [PubMed]
- Chavez, R.A.; Opit, G.; Opoku, B.; Stasiewicz, M.J. Spectral kernel sorting based on high-risk visual features associated with mycotoxin contamination reduces aflatoxin and fumonisin contamination in maize from Ghana. Food Control 2023, 151, 109788. [Google Scholar] [CrossRef]
- Qu, M.; Tian, S.; Yu, H.; Liu, D.; Zhang, C.; He, Y.; Cheng, F. Single-kernel classification of deoxynivalenol and zearalenone contaminated maize based on visible light imaging under ultraviolet light excitation combined with polarized light imaging. Food Control 2023, 144, 109354. [Google Scholar] [CrossRef]
- Rathna Priya, T.; Manickavasagan, A. Characterising corn grain using infrared imaging and spectroscopic techniques: A review. J. Food Meas. Charact. 2021, 15, 3234–3249. [Google Scholar] [CrossRef]
- Smeesters, L.; Kuntzel, T.; Thienpont, H.; Guilbert, L. Handheld fluorescence spectrometer enabling sensitive aflatoxin detection in maize. Toxins 2023, 15, 361. [Google Scholar] [CrossRef]
- Yao, H.; Zhu, F.; Kincaid, R.; Hruska, Z.; Rajasekaran, K. A Low-Cost, Portable Device for Detecting and Sorting Aflatoxin-Contaminated Maize Kernels. Toxins 2023, 15, 197. [Google Scholar] [CrossRef]
- Gu, S.; Chen, W.; Wang, Z.; Wang, J. Rapid determination of potential aflatoxigenic fungi contamination on peanut kernels during storage by data fusion of HS-GC-IMS and fluorescence spectroscopy. Postharvest Biol. Technol. 2021, 171, 111361. [Google Scholar] [CrossRef]
- Wu, Q.; Xu, H. Design and development of an on-line fluorescence spectroscopy system for detection of aflatoxin in pistachio nuts. Postharvest Biol. Technol. 2020, 159, 111016. [Google Scholar] [CrossRef]
- Bertani, F.; Businaro, L.; Gambacorta, L.; Mencattini, A.; Brenda, D.; Di Giuseppe, D.; De Ninno, A.; Solfrizzo, M.; Martinelli, E.; Gerardino, A. Optical detection of aflatoxins B in grained almonds using fluorescence spectroscopy and machine learning algorithms. Food Control 2020, 112, 107073. [Google Scholar] [CrossRef]
- Turksoy, S.; Kabak, B. Determination of aflatoxins and ochratoxin A in wheat from different regions of Turkey by HPLC with fluorescence detection. Acta Aliment. 2020, 49, 118–124. [Google Scholar] [CrossRef]
- Almoujahed, M.B.; Rangarajan, A.K.; Whetton, R.L.; Vincke, D.; Eylenbosch, D.; Vermeulen, P.; Mouazen, A.M. Non-destructive detection of fusarium head blight in wheat kernels and flour using visible near-infrared and mid-infrared spectroscopy. Chemom. Intell. Lab. Syst. 2024, 245, 105050. [Google Scholar] [CrossRef]
- Francesconi, S.; Harfouche, A.; Maesano, M.; Balestra, G.M. UAV-based thermal, RGB imaging and gene expression analysis allowed detection of Fusarium head blight and gave new insights into the physiological responses to the disease in durum wheat. Front. Plant Sci. 2021, 12, 628575. [Google Scholar] [CrossRef]
- Zhang, D.; Wang, Z.; Jin, N.; Gu, C.; Chen, Y.; Huang, Y. Evaluation of efficacy of fungicides for control of wheat fusarium head blight based on digital imaging. IEEE Access 2020, 8, 109876–109890. [Google Scholar] [CrossRef]
- Liang, K.; Huang, J.; He, R.; Wang, Q.; Chai, Y.; Shen, M. Comparison of Vis-NIR and SWIR hyperspectral imaging for the non-destructive detection of DON levels in Fusarium head blight wheat kernels and wheat flour. Infrared Phys. Technol. 2020, 106, 103281. [Google Scholar] [CrossRef]
- Nadimi, M.; Brown, J.; Morrison, J.; Paliwal, J. Examination of wheat kernels for the presence of Fusarium damage and mycotoxins using near-infrared hyperspectral imaging. Meas. Food 2021, 4, 100011. [Google Scholar] [CrossRef]
- Rangarajan, A.K.; Whetton, R.L.; Mouazen, A.M. Detection of fusarium head blight in wheat using hyperspectral data and deep learning. Expert Syst. Appl. 2022, 208, 118240. [Google Scholar] [CrossRef]
- Rieker, M.E.; Lutz, M.A.; El-Hasan, A.; Thomas, S.; Voegele, R.T. Hyperspectral Imaging and Selected Biological Control Agents for the Management of Fusarium Head Blight in Spring Wheat. Plants 2023, 12, 3534. [Google Scholar] [CrossRef]
- Vincke, D.; Eylenbosch, D.; Jacquemin, G.; Chandelier, A.; Pierna, J.A.F.; Stevens, F.; Baeten, V.; Mercatoris, B.; Vermeulen, P. Near infrared hyperspectral imaging method to assess Fusarium Head Blight infection on winter wheat ears. Microchem. J. 2023, 191, 108812. [Google Scholar] [CrossRef]
- Zhang, D.; Wang, Q.; Lin, F.; Yin, X.; Gu, C.; Qiao, H. Development and evaluation of a new spectral disease index to detect wheat fusarium head blight using hyperspectral imaging. Sensors 2020, 20, 2260. [Google Scholar] [CrossRef]
- Jia, B.; Wang, W.; Ni, X.; Chu, X.; Yoon, S.; Lawrence, K. Detection of mycotoxins and toxigenic fungi in cereal grains using vibrational spectroscopic techniques: A review. World Mycotoxin J. 2020, 13, 163–178. [Google Scholar] [CrossRef]
- Guillossou, R.; Le Roux, J.; Goffin, A.; Mailler, R.; Varrault, G.; Vulliet, E.; Morlay, C.; Nauleau, F.; Guérin, S.; Rocher, V. Fluorescence excitation/emission matrices as a tool to monitor the removal of organic micropollutants from wastewater effluents by adsorption onto activated carbon. Water Res. 2021, 190, 116749. [Google Scholar] [CrossRef]
- Jutaporn, P.; Armstrong, M.; Coronell, O. Assessment of C-DBP and N-DBP formation potential and its reduction by MIEX® DOC and MIEX® GOLD resins using fluorescence spectroscopy and parallel factor analysis. Water Res. 2020, 172, 115460. [Google Scholar] [CrossRef]
- Omanović, D.; Marcinek, S.; Santinelli, C. TreatEEM—A software tool for the interpretation of fluorescence excitation-emission matrices (EEMs) of dissolved organic matter in natural waters. Water 2023, 15, 2214. [Google Scholar] [CrossRef]
- Shi, W.; Zhuang, W.-E.; Hur, J.; Yang, L. Monitoring dissolved organic matter in wastewater and drinking water treatments using spectroscopic analysis and ultra-high resolution mass spectrometry. Water Res. 2021, 188, 116406. [Google Scholar] [CrossRef]
- Pandey, S.C.; Pande, V.; Sati, D.; Samant, M. Advanced Microbial Techniques in Agriculture, Environment, and Health Management; Elsevier: Amsterdam, The Netherlands, 2023. [Google Scholar]
- Brereton, R.G. Introduction to multivariate calibration in analytical chemistry. Analyst 2000, 125, 2125–2154. [Google Scholar] [CrossRef]
- Lakowicz, J.R. Principles of Fluorescence Spectroscopy; Springer: Berlin/Heidelberg, Germany, 2006. [Google Scholar]
- Jameson, D.M. Introduction to Fluorescence; Taylor & Francis: Abingdon, UK, 2014. [Google Scholar]
- Donaldson, L. Autofluorescence in plants. Molecules 2020, 25, 2393. [Google Scholar] [CrossRef] [PubMed]
- Ghaffari, M.; Chateigner-Boutin, A.-L.; Guillon, F.; Devaux, M.-F.; Abdollahi, H.; Duponchel, L. Multi-excitation hyperspectral autofluorescence imaging for the exploration of biological samples. Anal. Chim. Acta 2019, 1062, 47–59. [Google Scholar] [CrossRef]
- García-Plazaola, J.I.; Fernández-Marín, B.; Duke, S.O.; Hernández, A.; López-Arbeloa, F.; Becerril, J.M. Autofluorescence: Biological functions and technical applications. Plant Sci. 2015, 236, 136–145. [Google Scholar] [CrossRef]
- Georgakoudi, I.; Jacobson, B.C.; Muller, M.G.; Sheets, E.E.; Badizadegan, K.; Carr-Locke, D.L.; Crum, C.P.; Boone, C.W.; Dasari, R.R.; Van Dam, J. NAD (P) H and collagen as in vivo quantitative fluorescent biomarkers of epithelial precancerous changes. Cancer Res. 2002, 62, 682–687. [Google Scholar]
- Croce, A.C.; Bottiroli, G. Autofluorescence spectroscopy for monitoring metabolism in animal cells and tissues. In Histochemistry of Single Molecules: Methods in Molecular Biology; Humana Press: New York, NY, USA, 2017; pp. 15–43. [Google Scholar]
- Roshchina, V.V. Autofluorescence of plant secreting cells as a biosensor and bioindicator reaction. J. Fluoresc. 2003, 13, 403–420. [Google Scholar] [CrossRef]
- Roshchina, V.V.; Yashin, V.A.; Kononov, A.V. Autofluorescence of developing plant vegetative microspores studied by confocal microscopy and microspectrofluorimetry. J. Fluoresc. 2004, 14, 745–750. [Google Scholar] [CrossRef] [PubMed]
- Fulcher, R.; O’brien, T.; Lee, J. Studies on the aleurone layer I. Oonventional and fluorescence microscopy of the cell wall with emphasis on phenol-carbohydrate complexes in wheat. Aust. J. Biol. Sci. 1972, 25, 23–34. [Google Scholar] [CrossRef]
- Saadi, A.; Lempereur, I.; Sharonov, S.; Autran, J.; Manfait, M. Spatial distribution of phenolic materials in durum wheat grain as probed by confocal fluorescence spectral imaging. J. Cereal Sci. 1998, 28, 107–114. [Google Scholar] [CrossRef]
- Beaugrand, J.; Crônier, D.; Thiebeau, P.; Schreiber, L.; Debeire, P.; Chabbert, B. Structure, chemical composition, and xylanase degradation of external layers isolated from developing wheat grain. J. Agric. Food Chem. 2004, 52, 7108–7117. [Google Scholar] [CrossRef]
- Donaldson, L.; Williams, N. Imaging and spectroscopy of natural fluorophores in pine needles. Plants 2018, 7, 10. [Google Scholar] [CrossRef]
- Kopczynski, K.; Kwasny, M.; Mierczyk, Z.; Zawadzki, Z. Laser Induced Fluorescence System for Detection of Biological Agents: European Project FABIOLA; SPIE: Bellingham, WA, USA, 2005; Volume 5954. [Google Scholar]
- Dalterio, R.; Nelson, W.; Britt, D.; Sperry, J.; Tanguay, J.; Suib, S. The steady-state and decay characteristics of primary fluorescence from live bacteria. Appl. Spectrosc. 1987, 41, 234–241. [Google Scholar] [CrossRef]
- Roshchina, V.; Mel’nikova, E. Pollen chemosensitivity to ozone and peroxides. Russ. J. Plant Physiol. 2001, 48, 74–83. [Google Scholar] [CrossRef]
- Pöhlker, C.; Huffman, J.A.; Pöschl, U. Autofluorescence of atmospheric bioaerosols–fluorescent biomolecules and potential interferences. Atmos. Meas. Tech. Discuss. 2011, 4, 5857–5933. [Google Scholar] [CrossRef]
- Bonfante-Fasolo, P.; Faccio, A.; Perotto, S.; Schubert, A. Correlation between chitin distribution and cell wall morphology in the mycorrhizal fungus Glomus versiforme. Mycol. Res. 1990, 94, 157–165. [Google Scholar] [CrossRef]
- Vierheiling, H.; Böckenhoff, A.; Knoblauch, M.; Juge, C.; Van Bel, A.J.; Grundler, F.; Piche, Y.; Wyss, U. In vivo observations of the arbuscular mycorrhizal fungus Glomus mosseae in roots by confocal laser scanning microscopy. Mycol. Res. 1999, 103, 311–314. [Google Scholar] [CrossRef]
- Dreyer, B.; Morte, A.; Pérez-Gilabert, M.; Honrubia, M. Autofluorescence detection of arbuscular mycorrhizal fungal structures in palm roots: An underestimated experimental method. Mycol. Res. 2006, 110, 887–897. [Google Scholar] [CrossRef] [PubMed]
- Morales, F.; Cartelat, A.; Álvarez-Fernández, A.; Moya, I.; Cerovic, Z.G. Time-resolved spectral studies of blue− green fluorescence of artichoke (Cynara cardunculus L. var. scolymus) leaves: Identification of chlorogenic acid as one of the major fluorophores and age-mediated changes. J. Agric. Food Chem. 2005, 53, 9668–9678. [Google Scholar] [CrossRef] [PubMed]
- Billinton, N.; Knight, A.W. Seeing the Wood through the Trees: A Review of Techniques for Distinguishing Green Fluorescent Protein from Endogenous Autofluorescence. Anal. Biochem. 2001, 291, 175–197. [Google Scholar] [CrossRef] [PubMed]
- Eldred, G.E.; Miller, G.V.; Stark, W.S.; Feeney-Burns, L. Lipofuscin: Resolution of discrepant fluorescence data. Science 1982, 216, 757–759. [Google Scholar] [CrossRef]
- Andersson, H.; Baechi, T.; Hoechl, M.; Richter, C. Autofluorescence of living cells. J. Microsc. 1998, 191, 1–7. [Google Scholar] [CrossRef]
- Roshchina, V.a.V. Fluorescing World of Plant Secreting Cells; CRC Press: Boca Raton, FL, USA, 2008. [Google Scholar]
- Roshchina, V.; Mel’nikova, E.; Kovaleva, L. Changes in fluorescence during development of the male gametophyte. Russ. J. Plant Physiol. 1997, 44, 36–44. [Google Scholar]
- Faisal, Z.; Fliszár-Nyúl, E.; Dellafiora, L.; Galaverna, G.; Dall’Asta, C.; Lemli, B.; Kunsági-Máté, S.; Szente, L.; Poór, M. Interaction of zearalenone-14-sulfate with cyclodextrins and the removal of the modified mycotoxin from aqueous solution by beta-cyclodextrin bead polymer. J. Mol. Liq. 2020, 310, 113236. [Google Scholar] [CrossRef]
- Scafuri, B.; Varriale, A.; Facchiano, A.; D’Auria, S.; Raggi, M.E.; Marabotti, A. Binding of mycotoxins to proteins involved in neuronal plasticity: A combined in silico/wet investigation. Sci. Rep. 2017, 7, 15156. [Google Scholar] [CrossRef]
- Duan, N.; Li, C.; Song, M.; Ren, K.; Wang, Z.; Wu, S. Deoxynivalenol fluorescence aptasensor based on AuCu bimetallic nanoclusters and MoS2. Microchim. Acta 2022, 189, 296. [Google Scholar] [CrossRef] [PubMed]
- Wang, C.; Fu, X.; Zhou, Y.; Fu, F. Deoxynivalenol Detection beyond the Limit in Wheat Flour Based on the Fluorescence Hyperspectral Imaging Technique. Foods 2024, 13, 897. [Google Scholar] [CrossRef]
- Fliszár-Nyúl, E.; Lemli, B.; Kunsági-Máté, S.; Szente, L.; Poór, M. Interactions of mycotoxin alternariol with cyclodextrins and its removal from aqueous solution by beta-cyclodextrin bead polymer. Biomolecules 2019, 9, 428. [Google Scholar] [CrossRef] [PubMed]
- Fliszár-Nyúl, E.; Lemli, B.; Kunsági-Máté, S.; Poór, M. Effects of microenvironmental changes on the fluorescence signal of alternariol: Magnesium induces strong enhancement in the fluorescence of the mycotoxin. Int. J. Mol. Sci. 2021, 22, 8692. [Google Scholar] [CrossRef]
- Khundzhua, D.; Patsaeva, S.; Terekhova, V.; Yuzhakov, V. Spectral characterization of fungal metabolites in aqueous medium with humus substances. J. Spectrosc. 2013, 2013, 538608. [Google Scholar] [CrossRef]
- Cory, R.M.; McKnight, D.M. Fluorescence Spectroscopy Reveals Ubiquitous Presence of Oxidized and Reduced Quinones in Dissolved Organic Matter. Environ. Sci. Technol. 2005, 39, 8142–8149. [Google Scholar] [CrossRef]
- Berg, R.H.; Beachy, R.N. Fluorescent protein applications in plants. Methods Cell Biol. 2008, 85, 153–177. [Google Scholar]
- Chance, B.; Schoener, B.; Oshino, R.; Itshak, F.; Nakase, Y. Oxidation-reduction ratio studies of mitochondria in freeze-trapped samples. NADH and flavoprotein fluorescence signals. J. Biol. Chem. 1979, 254, 4764–4771. [Google Scholar] [CrossRef]
- Kayatz, P.; Thumann, G.; Luther, T.T.; Jordan, J.F.; Bartz–Schmidt, K.U.; Esser, P.J.; Schraermeyer, U. Oxidation causes melanin fluorescence. Investig. Ophthalmol. Vis. Sci. 2001, 42, 241–246. [Google Scholar]
- Ramanujam, N. Fluorescence spectroscopy of neoplastic and non-neoplastic tissues. Neoplasia 2000, 2, 89–117. [Google Scholar] [CrossRef]
- Lang, M.; Stober, F.; Lichtenthaler, H. Fluorescence emission spectra of plant leaves and plant constituents. Radiat. Environ. Biophys. 1991, 30, 333–347. [Google Scholar] [CrossRef]
- Lichtenthaler, H.K.; Schweiger, J. Cell wall bound ferulic acid, the major substance of the blue-green fluorescence emission of plants. J. Plant Physiol. 1998, 152, 272–282. [Google Scholar] [CrossRef]
- Symons, S.; Dexter, J. Aleurone and pericarp fluorescence as estimators of mill stream refinement for various Canadian wheat classes. J. Cereal Sci. 1996, 23, 73–83. [Google Scholar] [CrossRef]
- Vermerris, W.; Nicholson, R. Phenolic Compound Biochemistry; Springer Science & Business Media: Berlin/Heidelberg, Germany, 2007. [Google Scholar]
- Buschmann, C.; Langsdorf, G.; Lichtenthaler, H. Imaging of the blue, green, and red fluorescence emission of plants: An overview. Photosynthetica 2000, 38, 483–491. [Google Scholar] [CrossRef]
- Ndolo, V.; Beta, T. Types and Distribution of Phenolic Compounds in Grains. In Cereal Grain-Based Functional Foods: Carbohydrate and Phytochemical Components, Beta, T., Camire, M.E., Eds.; The Royal Society of Chemistry: London, UK, 2018. [Google Scholar] [CrossRef]
- Galland, M.; Boutet-Mercey, S.; Lounifi, I.; Godin, B.; Balzergue, S.; Grandjean, O.; Morin, H.; Perreau, F.; Debeaujon, I.; Rajjou, L. Compartmentation and dynamics of flavone metabolism in dry and germinated rice seeds. Plant Cell Physiol. 2014, 55, 1646–1659. [Google Scholar] [CrossRef]
- Zandomeneghi, M. Fluorescence of cereal flours. J. Agric. Food Chem. 1999, 47, 878–882. [Google Scholar] [CrossRef]
- Chateigner-Boutin, A.-L.; Lapierre, C.; Alvarado, C.; Yoshinaga, A.; Barron, C.; Bouchet, B.; Bakan, B.; Saulnier, L.; Devaux, M.-F.; Girousse, C.; et al. Ferulate and lignin cross-links increase in cell walls of wheat grain outer layers during late development. Plant Sci. 2018, 276, 199–207. [Google Scholar] [CrossRef] [PubMed]
- Lagashetti, A.C.; Dufossé, L.; Singh, S.K.; Singh, P.N. Fungal pigments and their prospects in different industries. Microorganisms 2019, 7, 604. [Google Scholar] [CrossRef]
- Fredlund, E.; Gidlund, A.; Pettersson, H.; Olsen, M.; Börjesson, T. Real-time PCR detection of Fusarium species in Swedish oats and correlation to T-2 and HT-2 toxin content. World Mycotoxin J. 2010, 3, 77–88. [Google Scholar] [CrossRef]
- Pan, Y.-L.; Hill, S.C.; Pinnick, R.G.; House, J.M.; Flagan, R.C.; Chang, R.K. Dual-excitation-wavelength fluorescence spectra and elastic scattering for differentiation of single airborne pollen and fungal particles. Atmos. Environ. 2011, 45, 1555–1563. [Google Scholar] [CrossRef]
- Raimondi, V.; Palombi, L.; Cecchi, G.; Lognoli, D.; Trambusti, M.; Gomoiu, I. Remote detection of laser-induced autofluorescence on pure cultures of fungal and bacterial strains and their analysis with multivariate techniques. Opt. Commun. 2007, 273, 219–225. [Google Scholar] [CrossRef]
- Raimondi, V.; Agati, G.; Cecchi, G.; Gomoiu, I.; Lognoli, D.; Palombi, L. In vivo real-time recording of UV-induced changes in the autofluorescence of a melanin-containing fungus using a micro-spectrofluorimeter and a low-cost webcam. Opt. Express 2009, 17, 22735–22746. [Google Scholar] [CrossRef]
- König, K.; Berns, M.W.; Tromberg, B.J. Time-resolved and steady-state fluorescence measurements of β-nicotinamide adenine dinucleotide-alcohol dehydrogenase complex during UVA exposure. J. Photochem. Photobiol. B Biol. 1997, 37, 91–95. [Google Scholar] [CrossRef]
- Ganzlin, M.; Marose, S.; Lu, X.; Hitzmann, B.; Scheper, T.; Rinas, U. In situ multi-wavelength fluorescence spectroscopy as effective tool to simultaneously monitor spore germination, metabolic activity and quantitative protein production in recombinant Aspergillus niger fed-batch cultures. J. Biotechnol. 2007, 132, 461–468. [Google Scholar] [CrossRef] [PubMed]
- Marose, S.; Lindemann, C.; Scheper, T. Two-dimensional fluorescence spectroscopy: A new tool for on-line bioprocess monitoring. Biotechnol. Prog. 1998, 14, 63–74. [Google Scholar] [CrossRef] [PubMed]
- Kabir, M.P.; Ouedraogo, D.; Orozco-Gonzalez, Y.; Gadda, G.; Gozem, S. Alternative strategy for spectral tuning of flavin-binding fluorescent proteins. J. Phys. Chem. B 2023, 127, 1301–1311. [Google Scholar] [CrossRef]
- Sandra, R.P.-S.; Gabriela, S.S.; Jazmina, C.R.A.; Helen, F.L.; Rita, C.R.G. Production of Melanin Pigment by Fungi and Its Biotechnological Applications. In Melanin; Miroslav, B., Ed.; IntechOpen: Rijeka, Croatia, 2017. [Google Scholar] [CrossRef]
- Gao, J.; Wenderoth, M.; Doppler, M.; Schuhmacher, R.; Marko, D.; Fischer, R. Fungal melanin biosynthesis pathway as source for fungal toxins. MBio 2022, 13, e00219–e00222. [Google Scholar] [CrossRef] [PubMed]
- Cambaza, E. Comprehensive description of Fusarium graminearum pigments and related compounds. Foods 2018, 7, 165. [Google Scholar] [CrossRef]
- Ryabova, N.; Tupolskikh, T.; Serdyuk, V.; Gordeeva, N. Analysis of infection with fungi of the genus Fusarium seed and vegetative organs of crops. E3S Web Conf. 2021, 273, 01019. [Google Scholar] [CrossRef]
- Ávalos Cordero, F.J.; Pardo Medina, J.; Parra Rivero, O.; Ruger Herreros, M.M.; Rodríguez Ortiz, L.R.; Hornero Méndez, D. Carotenoid Biosynthesis in Fusarium. J. Fungi 2017, 3, 39. [Google Scholar] [CrossRef]
- Leslie, J.F.; Moretti, A.; Mesterházy, Á.; Ameye, M.; Audenaert, K.; Singh, P.K.; Richard-Forget, F.; Chulze, S.N.; Ponte, E.M.D.; Chala, A. Key global actions for mycotoxin management in wheat and other small grains. Toxins 2021, 13, 725. [Google Scholar] [CrossRef] [PubMed]
- Janaviciene, S.; Venslovas, E.; Kadziene, G.; Matelioniene, N.; Berzina, Z.; Bartkevics, V.; Suproniene, S. Diversity of mycotoxins produced by Fusarium strains infecting weeds. Toxins 2023, 15, 420. [Google Scholar] [CrossRef]
- Alisaac, E.; Mahlein, A.-K. Fusarium head blight on wheat: Biology, modern detection and diagnosis and integrated disease management. Toxins 2023, 15, 192. [Google Scholar] [CrossRef] [PubMed]
- Yao, H.; Hruska, Z.; Kincaid, R.; Brown, R.L.; Bhatnagar, D.; Cleveland, T.E. Detecting maize inoculated with toxigenic and atoxigenic fungal strains with fluorescence hyperspectral imagery. Biosyst. Eng. 2013, 115, 125–135. [Google Scholar] [CrossRef]
- Wu, C.H.; Warren, H.L. Natural Autofluorescence in Fungi, and its Correlation With Viability. Mycologia 1984, 76, 1049–1058. [Google Scholar] [CrossRef]


Disclaimer/Publisher’s Note: The statements, opinions and data contained in all publications are solely those of the individual author(s) and contributor(s) and not of MDPI and/or the editor(s). MDPI and/or the editor(s) disclaim responsibility for any injury to people or property resulting from any ideas, methods, instructions or products referred to in the content. |
© 2024 by the authors. Licensee MDPI, Basel, Switzerland. This article is an open access article distributed under the terms and conditions of the Creative Commons Attribution (CC BY) license (https://creativecommons.org/licenses/by/4.0/).
Share and Cite
Matveeva, T.A.; Sarimov, R.M.; Persidskaya, O.K.; Andreevskaya, V.M.; Semenova, N.A.; Gudkov, S.V. Application of Fluorescence Spectroscopy for Early Detection of Fungal Infection of Winter Wheat Grains. AgriEngineering 2024, 6, 3137-3158. https://doi.org/10.3390/agriengineering6030179
Matveeva TA, Sarimov RM, Persidskaya OK, Andreevskaya VM, Semenova NA, Gudkov SV. Application of Fluorescence Spectroscopy for Early Detection of Fungal Infection of Winter Wheat Grains. AgriEngineering. 2024; 6(3):3137-3158. https://doi.org/10.3390/agriengineering6030179
Chicago/Turabian StyleMatveeva, Tatiana A., Ruslan M. Sarimov, Olga K. Persidskaya, Veronika M. Andreevskaya, Natalia A. Semenova, and Sergey V. Gudkov. 2024. "Application of Fluorescence Spectroscopy for Early Detection of Fungal Infection of Winter Wheat Grains" AgriEngineering 6, no. 3: 3137-3158. https://doi.org/10.3390/agriengineering6030179