Article

Variable-Rate Irrigation in Diversified Vegetable Crops: System Development and Evaluation

by
Thalissa Oliveira Pires Magalhães
1,
Marinaldo Ferreira Pinto
2,
Marcus Vinícius Morais de Oliveira
2 and
Daniel Fonseca de Carvalho
2,*
1
Postgraduate Program in Water Resources, Federal University of Lavras—UFLA, Lavras 37203-202, MG, Brazil
2
Department of Engineering, Institute of Technology, Federal Rural University of Rio de Janeiro, Seropédica 23897-045, RJ, Brazil
*
Author to whom correspondence should be addressed.
AgriEngineering 2024, 6(3), 3227-3241; https://doi.org/10.3390/agriengineering6030184
Submission received: 19 July 2024 / Revised: 26 August 2024 / Accepted: 2 September 2024 / Published: 6 September 2024
(This article belongs to the Section Agricultural Irrigation Systems)

Abstract

:
Diversified cropping systems offer an alternative to sustainable agriculture, but they present high spatial variability. This study aims to develop and evaluate an automated irrigation system and a variable-rate water application for areas with diversified vegetable crops. The prototype comprises a mobile drip line, a winding reel, and an electronic control system. The drip line irrigates plants individually, with irrigation depths along the beds controlled by the displacement speed and between beds by adjusting the timing of electrical pulses to activate the water flow control valves. To evaluate the drip line, irrigation depths were defined for different crops, followed by performance assessments, which included evaluating the uniformity (Christiansen’s Uniformity Coefficient—CUC) of the line under constant and variable rates. A hydraulic evaluation of the system was also carried out, as well as the calculation of the potential irrigable area. The drip line showed CUC ≥96% for depths under a constant rate and 95% for depths under a variable rate. The application efficiency reached 93.4% for a degree of suitability of 83%, considering variable depths along and between beds. The potential irrigable area obtained was 360 m2 day−1. The developed drip line effectively meets the spatial variability of crop water requirements in diversified cropping systems by adopting the variable-rate irrigation technique. The control of irrigation depth through valve activation via electrical pulses allows for the application of variable depths between the beds.

1. Introduction

Diversified cropping systems have emerged as a sustainable alternative to monoculture. They offer advantages such as stabilizing yield and lower environmental costs [1], increased soil fertility, pest control, and production stability [2]. Additionally, they provide benefits in terms of ecosystem services and biodiversity production [3] and enhance food security by better use of irrigated areas fostered by crop rotation or intercropping. Species diversification in horticulture production is often employed to minimize production risks and uncertainties, although it can increase system complexity due to interactions between crops [4].
Crops require water in response to their physiological characteristics and interaction with the environment [5]. In conditions of low rainfall availability, the use of irrigation techniques becomes essential for the development of agriculture, minimizing the risks of the activity [6] and increasing crop productivity [7], in addition to promoting an important role in the agricultural and ecosystem sustainability [8].
Sprinkler irrigation systems have been the most used technique in horticultural crops, which generally have higher added value and are often grown in relatively small production units [9]. However, ensuring the even distribution of water poses challenges for irrigation management in areas with diversified crops and/or crops at varying stages of development [10], which are characterized by high spatial variability in water needs. Furthermore, the spatial variability of soil characteristics may contribute to the need for variable rate water application [11]. According to [12], the diversity and number of crop rotations per growing season increase the complexity of management, given the unique requirements for nutrients and water.
Variable rate irrigation is presented as an alternative to fulfill crop water needs, considering the spatio-temporal variability of the field [13]. Despite the technology being fully developed, it is used in mechanized sprinkler irrigation systems [14], and it is employed among large farmers [15], as it does not meet the technical and technological requirements of small rural properties.
In addition to other technological tools, irrigation automation is a determining factor for diversified horticulture system management and operation, considering labor reduction in irrigation system operations, allowing farmers more time for other activities [16]. Automating these environments can enhance the efficiency of water and electricity use [17,18]. Furthermore, night irrigation, combined with a reduced volume of water applied, can significantly lower electricity costs. Considering the increase in global food demand, resulting in the expansion of cultivated areas and the amount of water used for irrigation [15], adopting diversified systems with automated management techniques can contribute to enhancing food security and irrigation water efficiency.
The lack of technologies that combine automated micro-irrigation systems with the capacity to apply water at spatially varied rates, aiming to meet the demands of diversified environments, suggests the development of systems with these characteristics, contributing effectively to the management and operation practices of irrigation systems in diversified systems. Taking this into consideration, this study aims to develop and evaluate an automatic drip irrigation system with variable rate application according to the spatial variability of crop water needs in diversified horticulture production environments.

2. Materials and Methods

The project was developed at the Hydraulics and Irrigation Laboratory at the Federal Rural University of Rio de Janeiro, Brazil, and comprised three stages: (a) constructing the drip line, (b) electronic communication system, and (c) performance evaluation of the irrigation system. The irrigation system consists of a mobile drip line, flexible hose, reel, and an electromechanical system to use in the field.
The drip line was constructed out of PVC (polyvinyl chloride) and metallic materials, with a maximum length of six meters. It was divided into four irrigation sections to simultaneously serve four 1.2-m-wide beds or six 1.0-m-wide beds. The water intake of the drip line is supplied using a 13 mm flexible hose connected to a hose reel, and it includes a 120 mesh screen filter and a pressure gauge. After the water intake, the line has a 32 mm PVC main line that supplies four derivation lines, each controlled by a solenoid valve (PGV-100, Hunter, San Marcos, Califórnia, EUA), which regulates the water application rate independently for each bed. Each derivation line has three lateral lines installed 50 cm from the ground surface, each comprising four emitters (PCJ-LCNL, Netafim, Telavive, Israel) with a nominal flow rate of 4.0 L h−1 and an operating pressure of 100 kPa.
To meet the spatial variability of crop water needs between beds, the drip line applies water individually to each bed, as well as variable rates along the bed length if the crop water changes. Water depths between beds can be adjusted by the ratio between the water depths of each bed and the maximum depth among them (Equation (1)). These rates are regulated using the pulse activation technique of the solenoid valves, while the adjustment along the beds is made by the line’s displacement speed, which is automatically calculated by the electronic control center. This calculation is based on the flow rate of the lateral lines, the spacing between them, and the required rate in the bed with the highest demand at the position to be irrigated (Equation (2)).
l r i = l i l max
v = Q e × l max
where:
lr(i)—Fraction of the maximum rate corresponding to bed i (dimensionless);
l(i)—Gross depth corresponding to bed i (mm);
lmax—Maximum water depth among the four beds at that point (mm);
v—Displacement speed (m s−1);
Q—Flow rate of the lateral line (m3 s−1);
e—Spacing between lateral lines (m);
and l max —Maximum water depth to be applied (m).
The adjustment of the fraction of the maximum rate in each bed is carried out by the activation time, which is the duration that each valve will remain open within the total pulse time of 30 s. This time is determined by the calibration curve (Equation (3)), obtained through testing, which will be described later. The activation time and displacement speed of the drip line are recalculated whenever changes occur in the required rate in the beds. The position of the line is calculated every 1 s according to Equation (4).
t a i = 30 1.054 l r 0.2567
d t = d t 1 + v × Δ t
where:
t a i —Activation time in the valve corresponding to bed i (s);
l r —Fraction of the maximum rate corresponding to bed i (dimensionless);
d t —Current position (m);
v —Speed input into the card (m s−1);
and Δ t — Interval between readings (s).
The reel mechanism moves the drip line, allowing half of the required depth to be applied on the way out and half on the way back. The outward movement of the line to the end of the bed occurs by winding the flexible hose, while the inward movement is facilitated by winding an 8 mm nylon rope fixed to the center of the drip line in the opposite direction of the flexible hose. This rope passes through a fixed pulley at the end of the bed. The winding and releasing processes of the hose and the rope occur in opposite directions, meaning when one is winding, the other is unwinding.
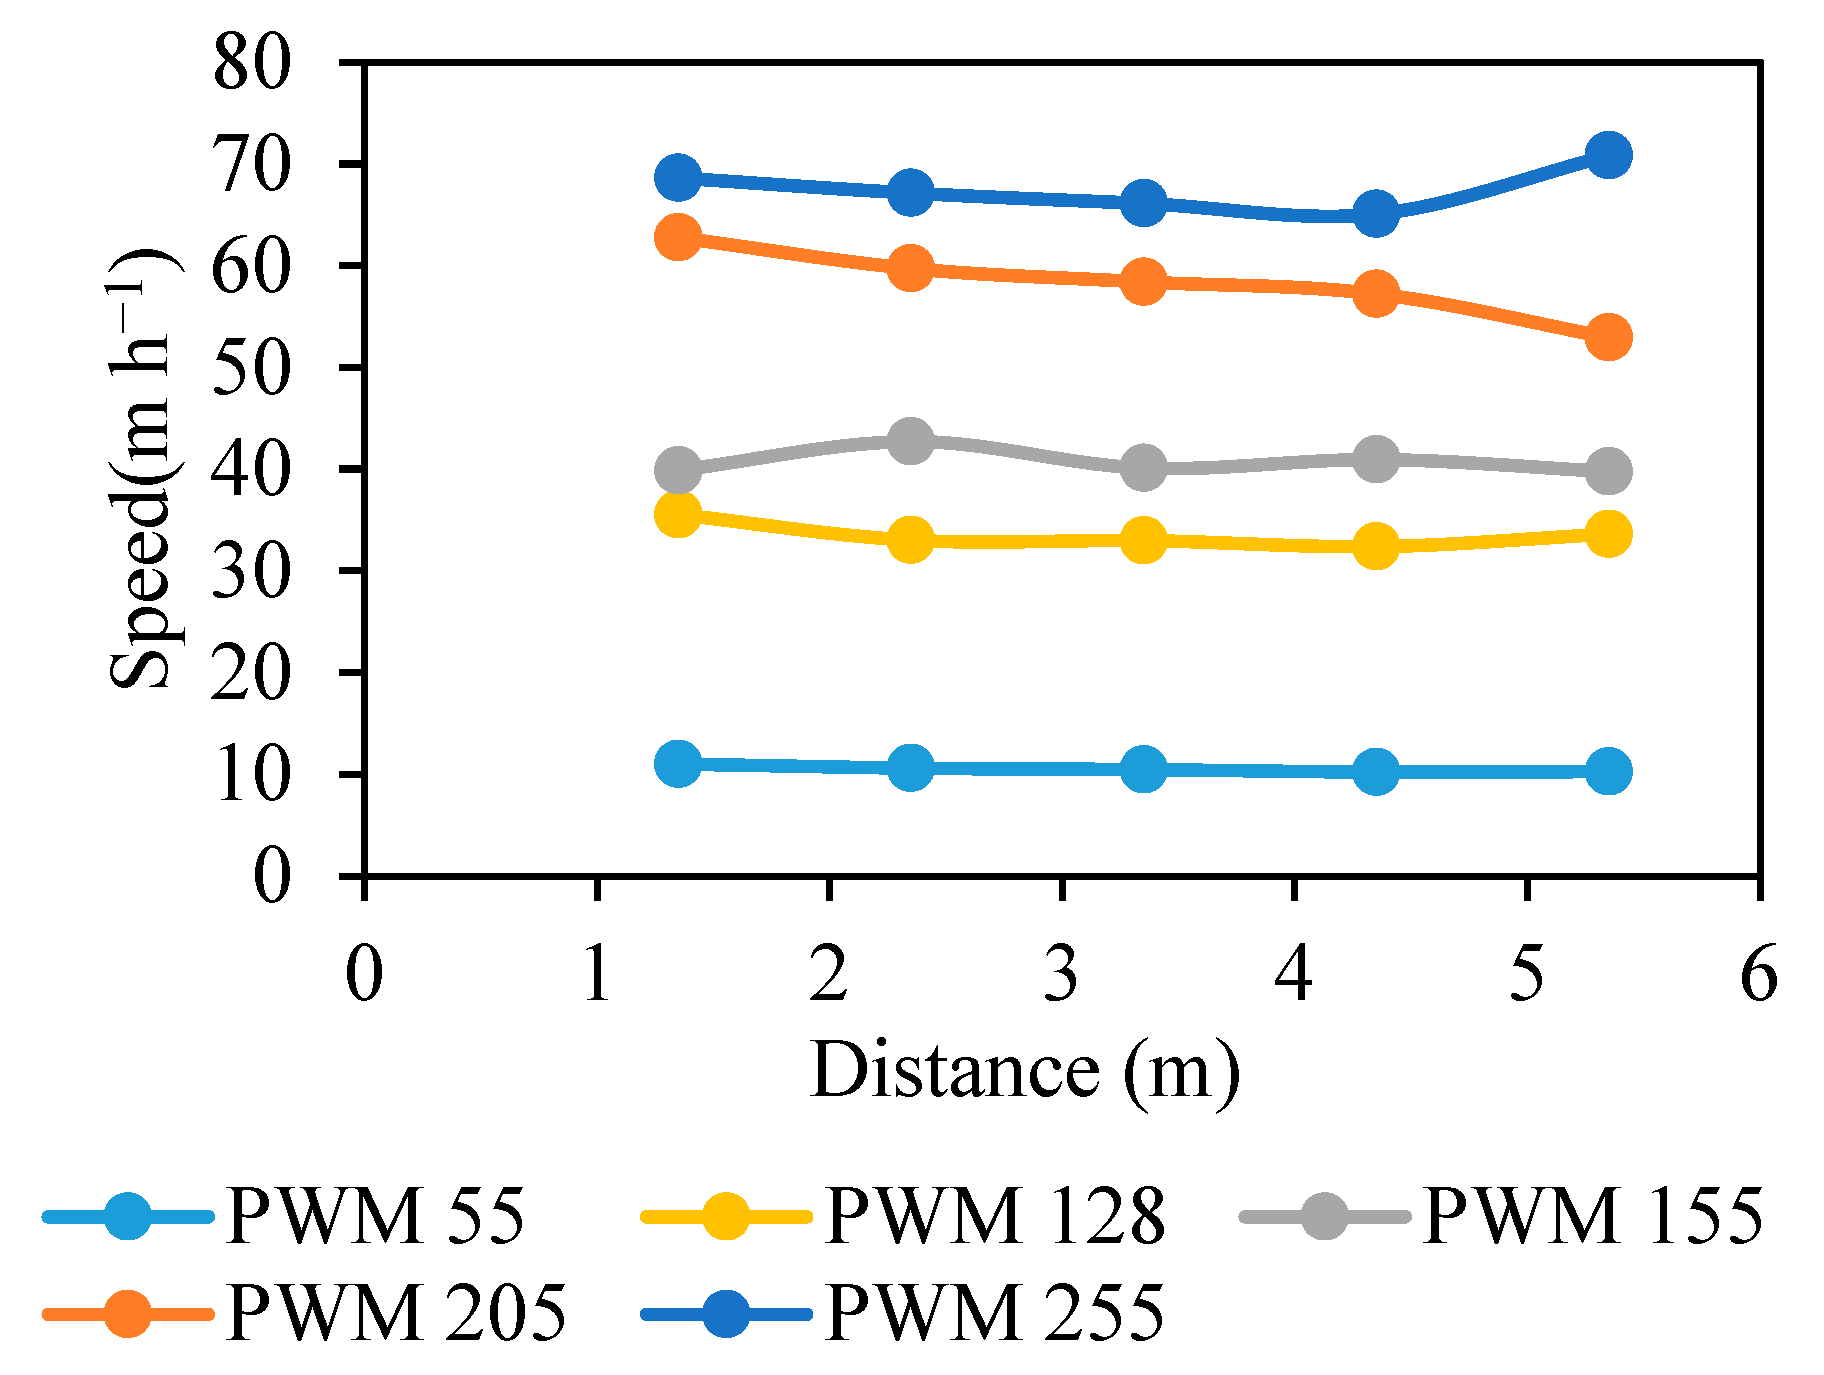
The reel mechanism structure is made of metal. It has a square chassis and a cylindrical axis in the middle. The reel features an electronic control center that controls the motor rotation and direction, and the power interface is the H-bridge. The motor rotation control is achieved through the microcontroller’s digital port configured to operate as PWM (Pulse Width Modulation), with an 8-bit resolution. Moreover, it is controlled by the number of bytes ranging from 0 to 255, where 0 represents minimum rotation, and 255 represents maximum rotation. The relationship between the displacement speed and the PWM byte value was determined through experiments, allowing the calibration curve to be obtained (Figure 1). Five rotation speeds were considered, corresponding to 55, 128, 155, 205, and 255 bytes. The drip line displacement speeds were measured every meter over a displacement distance of 5 m, with five repetitions. Therefore, in addition to the confidence curve, the speed variation along the route was evaluated.
In the electronic control center, readings of required depths and the distance between depth changes are taken using the SD (Secure Digital) card module attached to the microcontroller, which is previously input by the user. The displacement speed is calculated based on the maximum depth to be applied between the beds. The H-bridge module was used as the speed control interface and to change the motor rotation direction. After obtaining each SD card reading, the radiofrequency module sends the calculated relative rates (lr) to the electronic control center of the drip line.
The maximum and minimum speeds of the drip line were 71 m h−1 and 11 m h−1, respectively, allowing for the application of depths ranging from 0.5 mm to 2.5 mm at each application of the drip line. As the drip line applies water on both the way out and the way back, the depth range applied by the line varies from 1.0 to 5.0 mm per application.

2.1. Electronic Control System for the Irrigation System

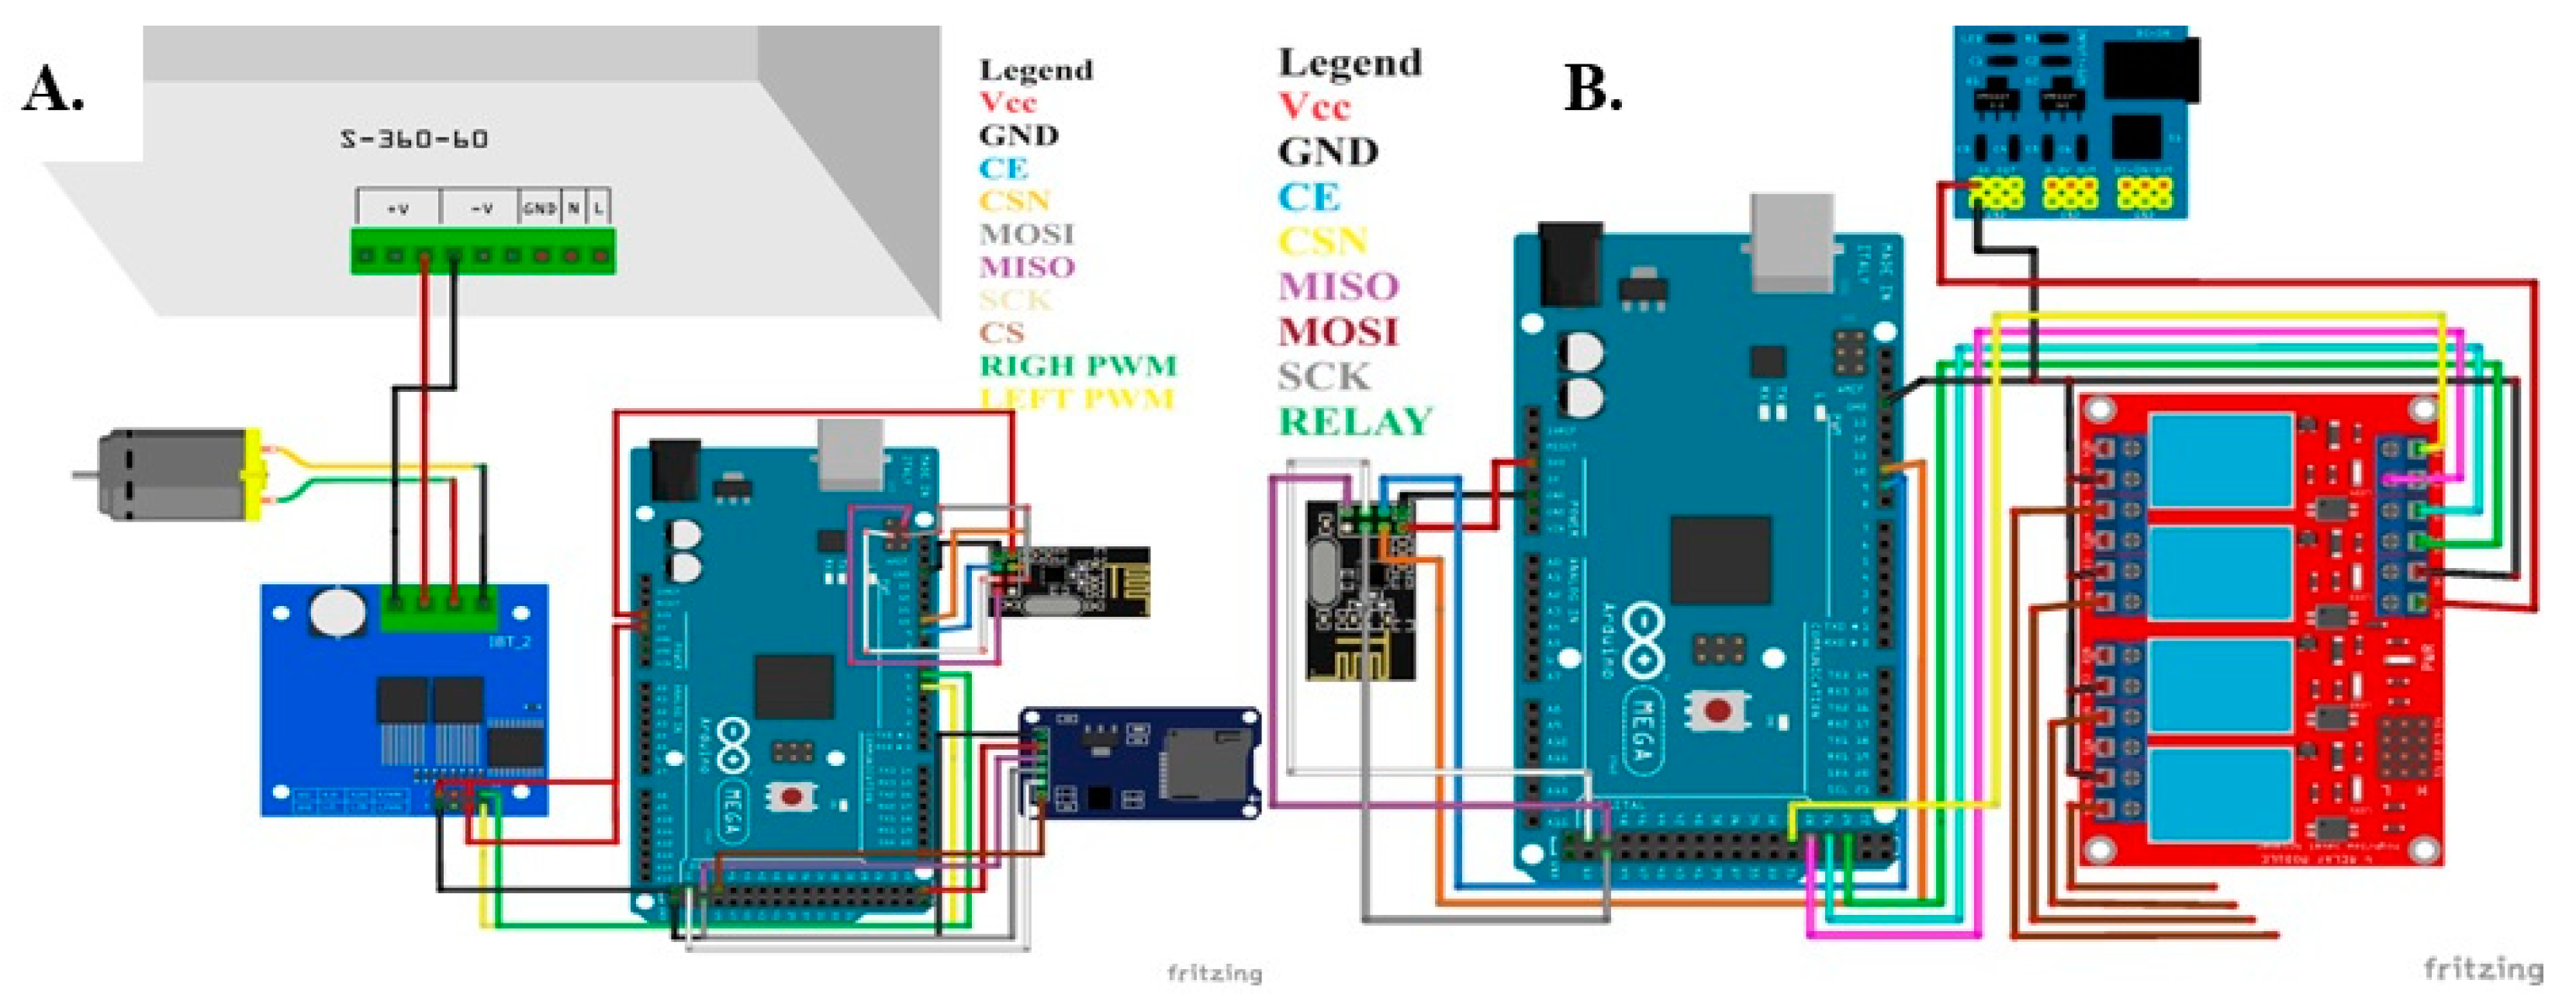
The control system consists of two electronic panels (central panel and valve control panel), comprised of Arduino Mega 2560 prototyping boards and NRF24l01 radio frequency modules (Nordic Semiconductors, Trondheim, Noruega), operating at a frequency of 2.4 GHz with a transmission rate of 250 Kbps in the open air, enabling communication between the electronic panels. The central panel is configured as a transmitter and controls the drip line speed, sending information to the valve control panel and receiving information via the user interface, which includes an SD card. The valve control panel is configured as a receiver and activates the relay module used to control the activation time of the solenoid valves. Figure 2 shows the connection schematics of the drip line electronic panel components (Figure 2A) and the central panel components (Figure 2B), created using Fritzing software (https://fritzing.org/).
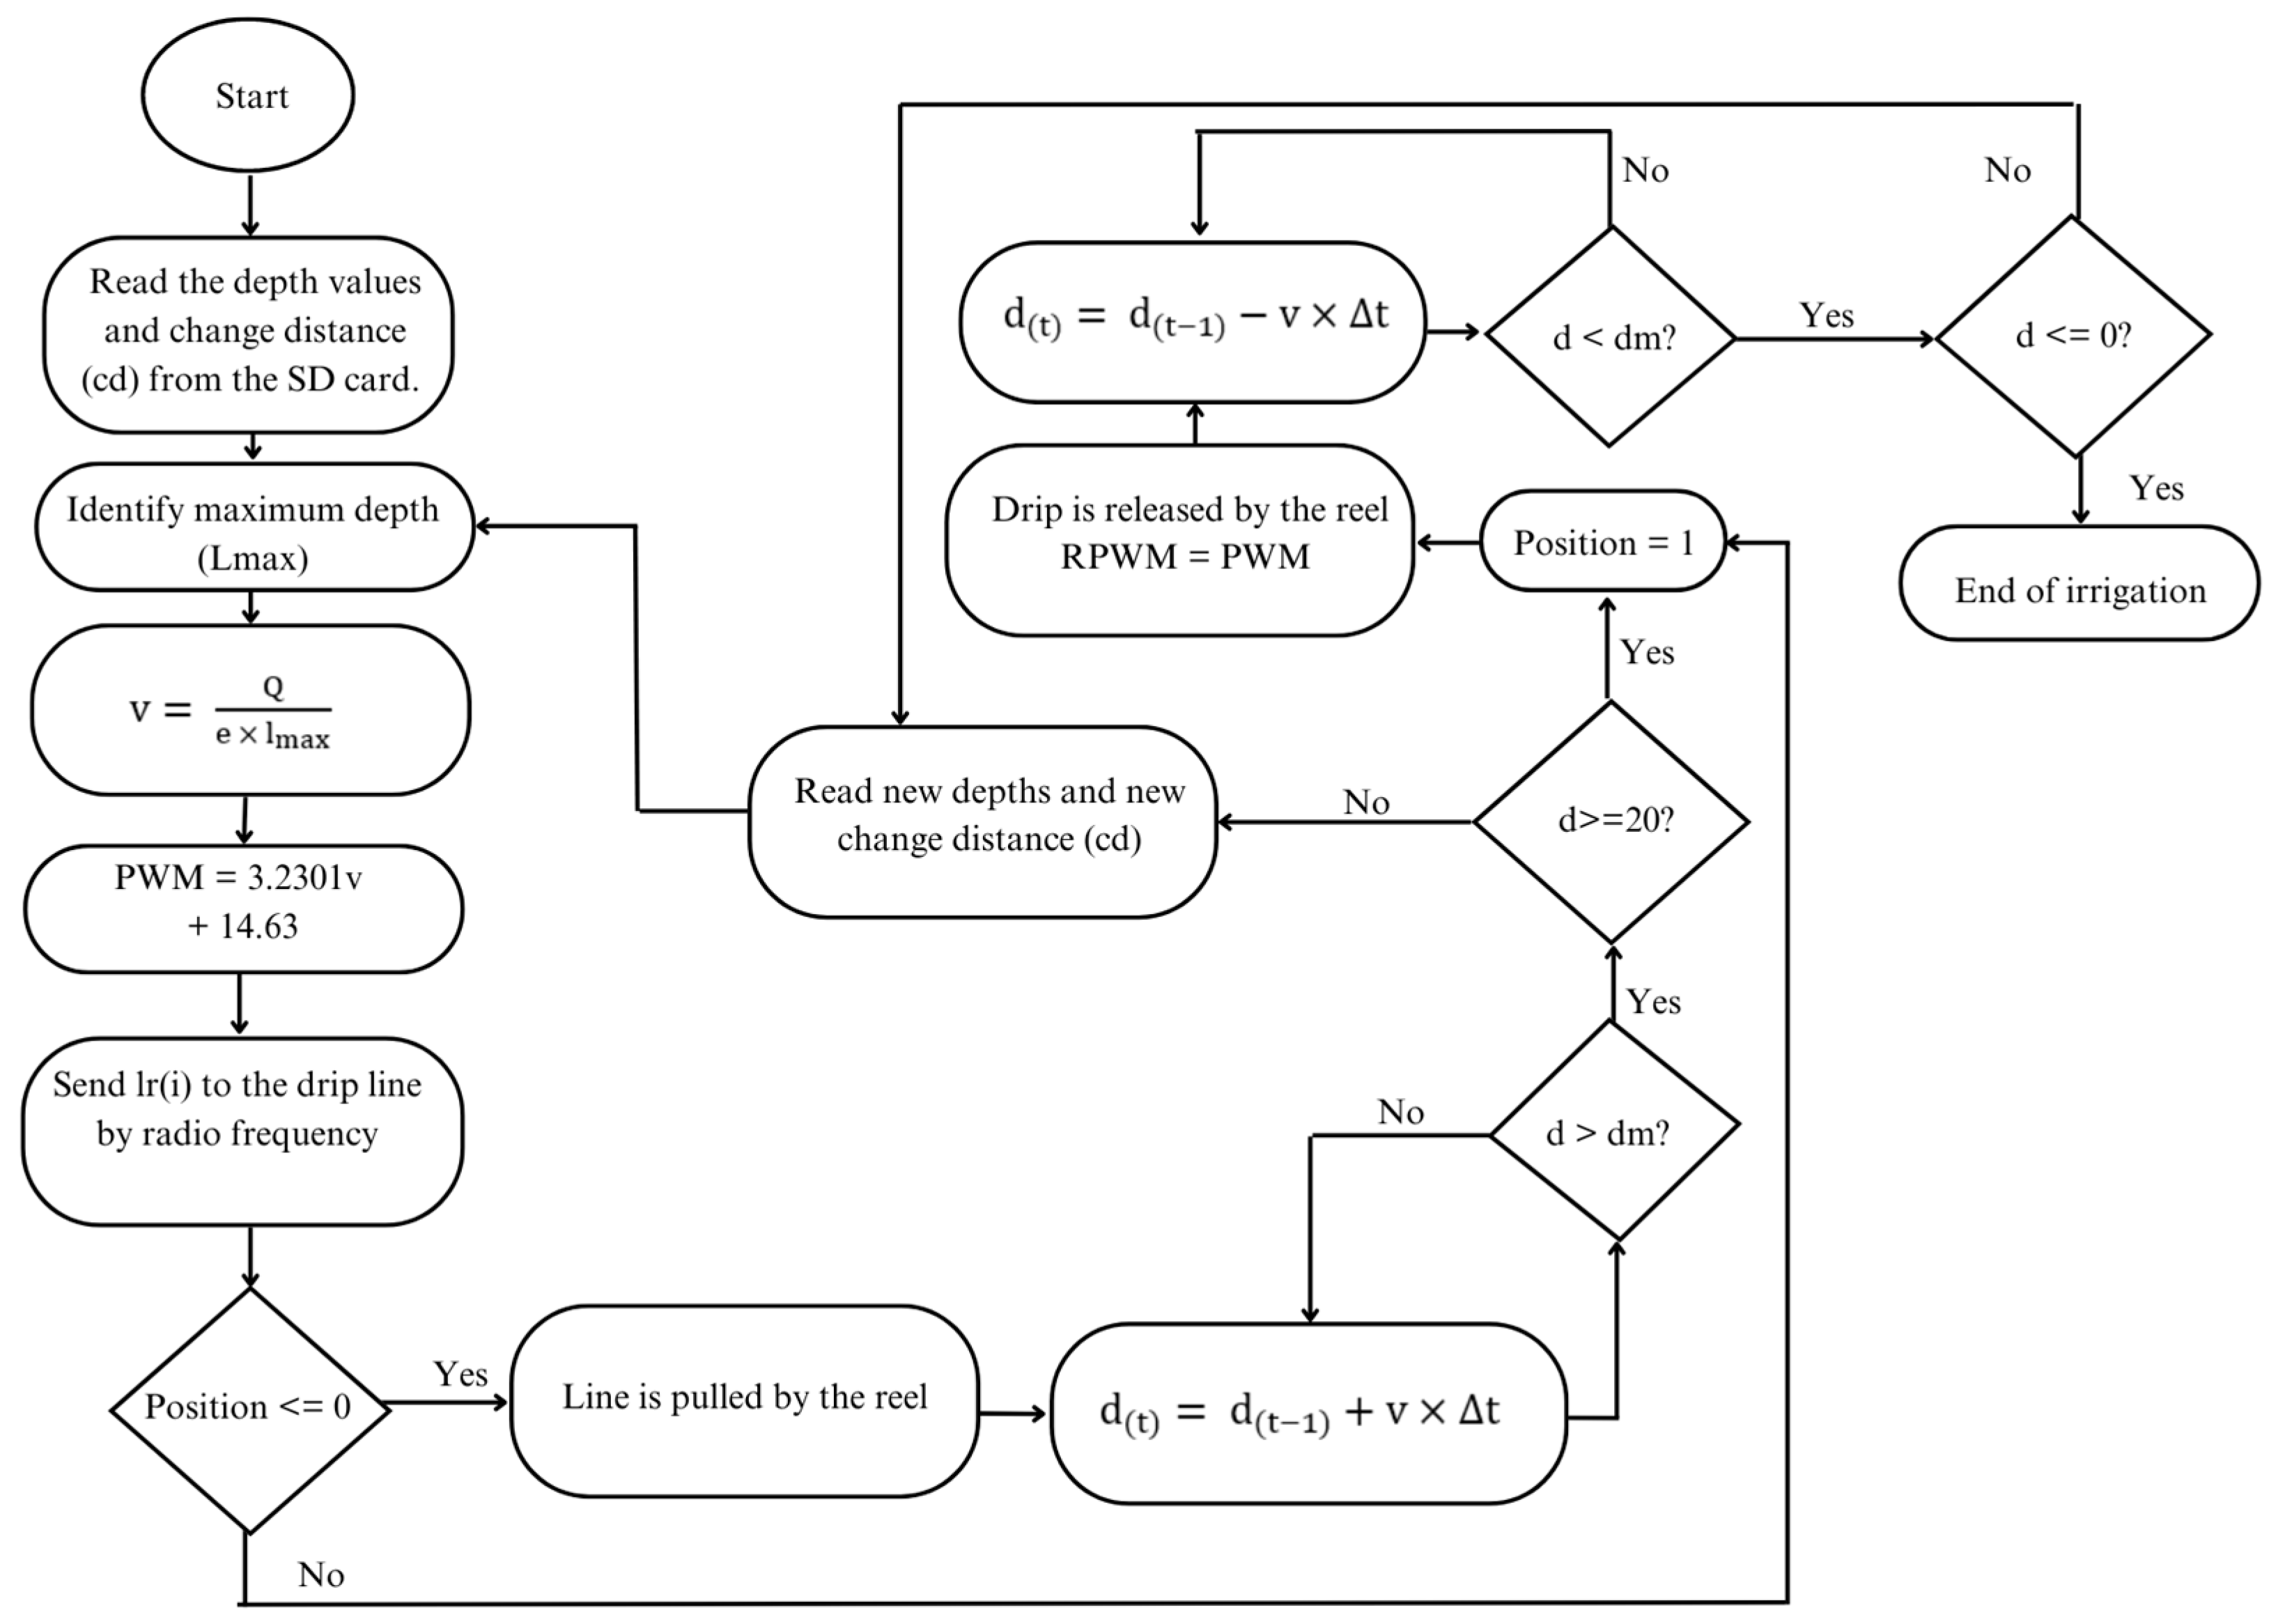
The algorithm of the central panel is subdivided into three functions, as shown in the flowchart in Figure 3: readings of the required depths and crop positions from the memory card; calculation of the maximum rate between the beds and adjustment of the displacement speed; and data transmission via radio frequency. It is worth noting that the motor rotation direction is changed at the end of the bed so that the reel will unwind the flexible hose. This results in half of the required depth applied at each point until returning to the initial position.
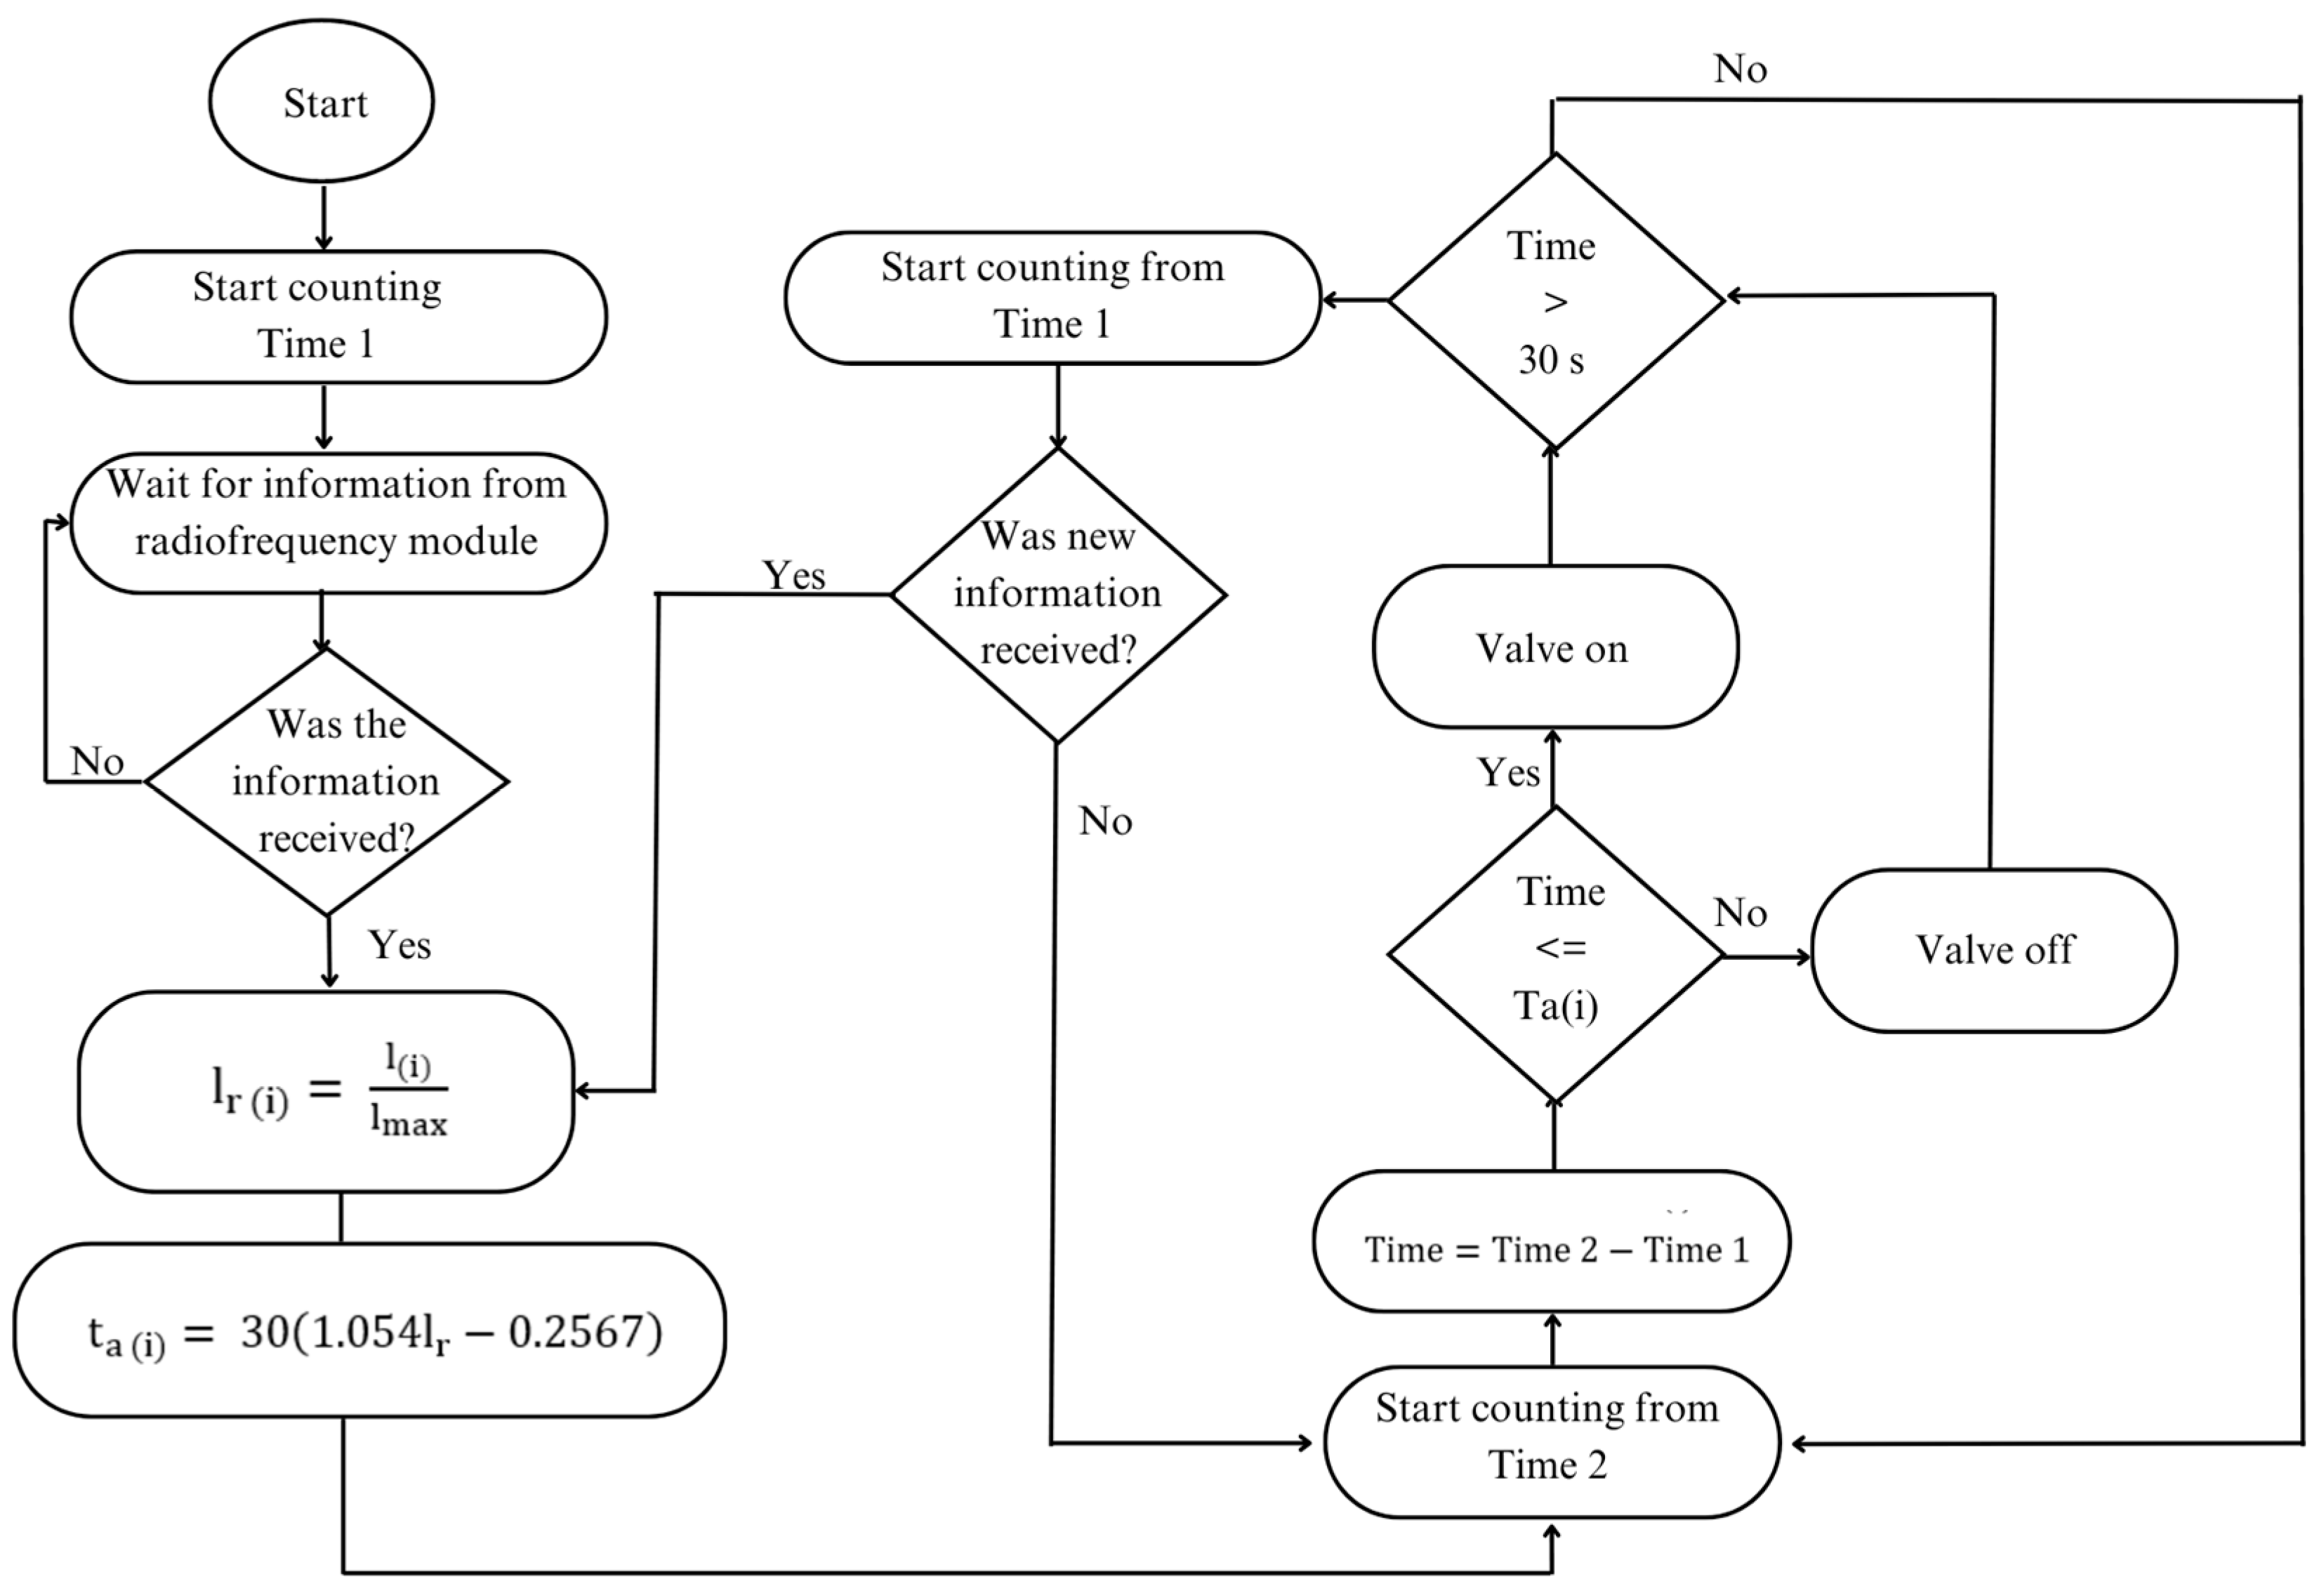
The flowchart of the programming implemented in the valve control panel is illustrated in Figure 4. Essentially, it involves receiving information about the depths from the central controller, and determining the activation time for each valve, which will apply the required depth for each bed.

2.2. Hydraulic Characterization of the Drip Line

The hydraulic characterization tests of the drip bar determined the calibration curves of the pulse control systems for the water depths, as well as the pressure loss in the hose. The water depth was measured by collecting water applied from the lateral drip line at each control valve, using 100 mm diameter, 1.0 m long PVC gutters and plastic containers, as shown in Figure 5. The gutters were used to simulate the wetted application area and to allow water collection from the four drippers in the lateral line. They were divided into two 0.50 m sections and were inclined to facilitate drainage into the collector placed below the center of the gutter (Figure 5).
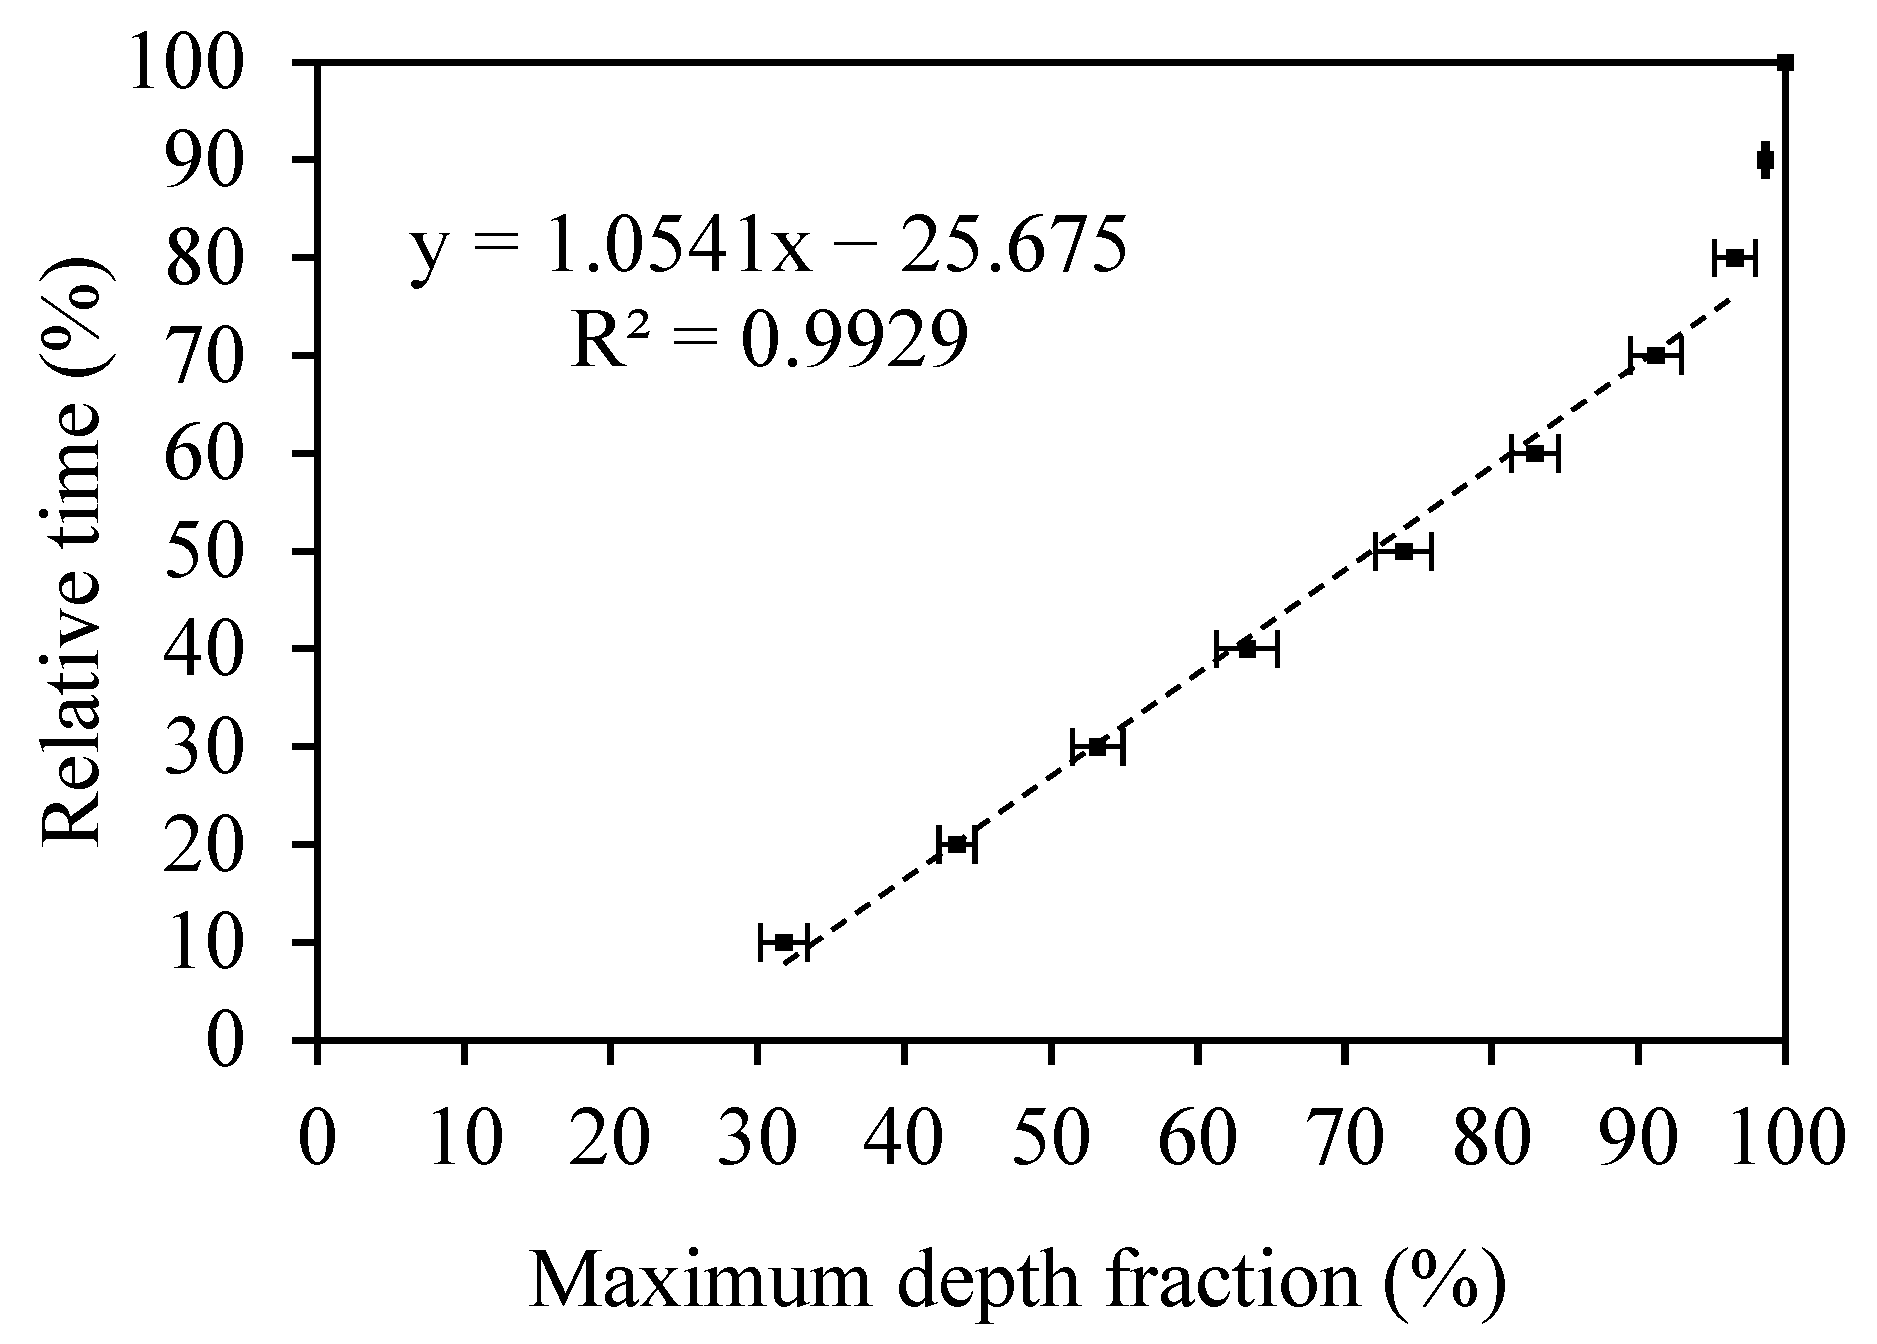
To obtain the calibration curve of the maximum rate fraction as a function of the valve activation time, the valves were activated for a duration ranging from 3 to 30 s (proportional intervals to the total time). They were switched off until completing the 30-s cycle. Five repetitions were conducted, totaling 2.5 min of testing. Finally, the fraction of the maximum depth was calculated using Equation (5).
lx i = Vp V 30
where:
lx(i)—fraction of the maximum depth (dimensionless);
Vp—volume applied for a pulse time p (mm);
and V30—volume for a pulse time of 30 s (mm).
To determine the pressure loss in the flexible hose, pressure measurements were taken at the reel inlet and at the drip line water outlet. The line was positioned at the beginning and the end of the bed. This was completed to assess whether the pressure loss (Equation (6)) increases when the hose is coiled.
hf = PC PB z
where:
hf—Pressure loss in the flexible hose (m);
PC—Pressure at the reel inlet (m);
PB—Pressure at the drip line inlet (m);
and z—Height of the manometer relative to the ground (m).

2.3. Performance Evaluation of the Drip Line

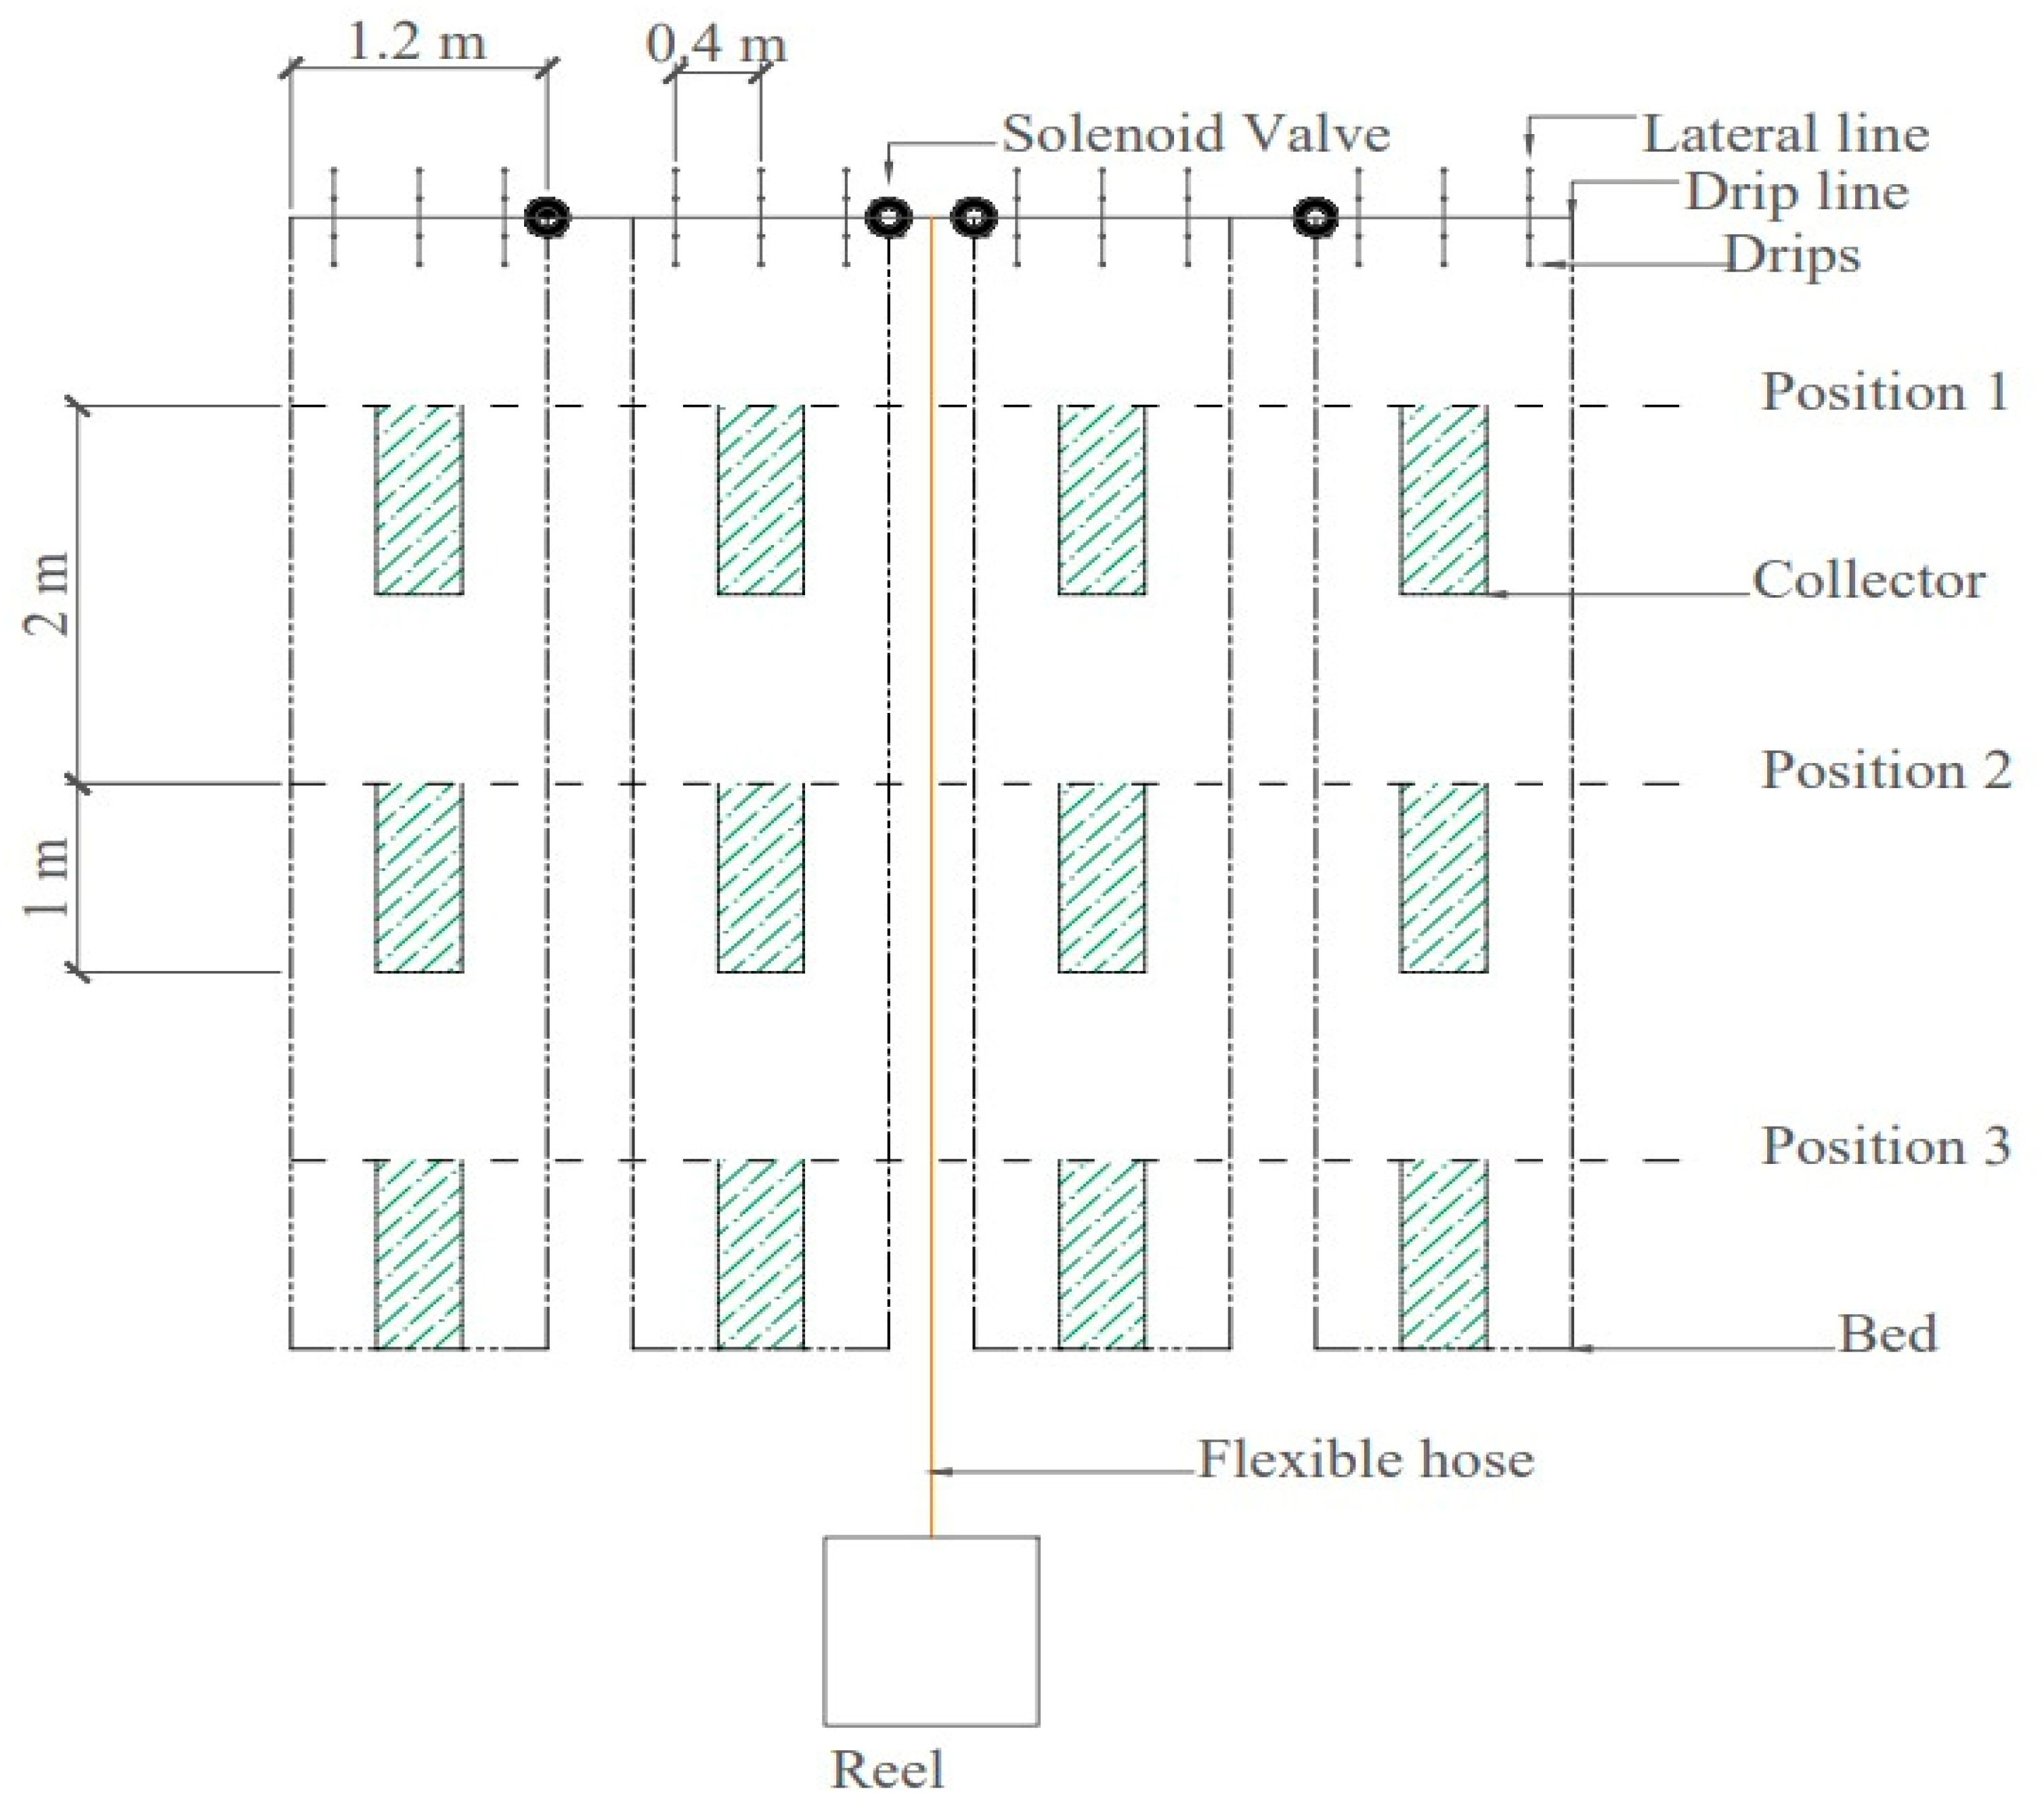
The performance evaluation of the drip line assessed the control of the applied depth through pulse activation and evaluated the variation in the displacement speed and pressure loss in the drip line flexible hose. For this purpose, laboratory tests were conducted where collectors were distributed along the evaluation area of the beds and crops, measuring the mass of the collected depth. The position of the collectors along the beds is illustrated in Figure 6. Twelve collectors were used, with four measured simultaneously at three different positions (1, 2, and 3).
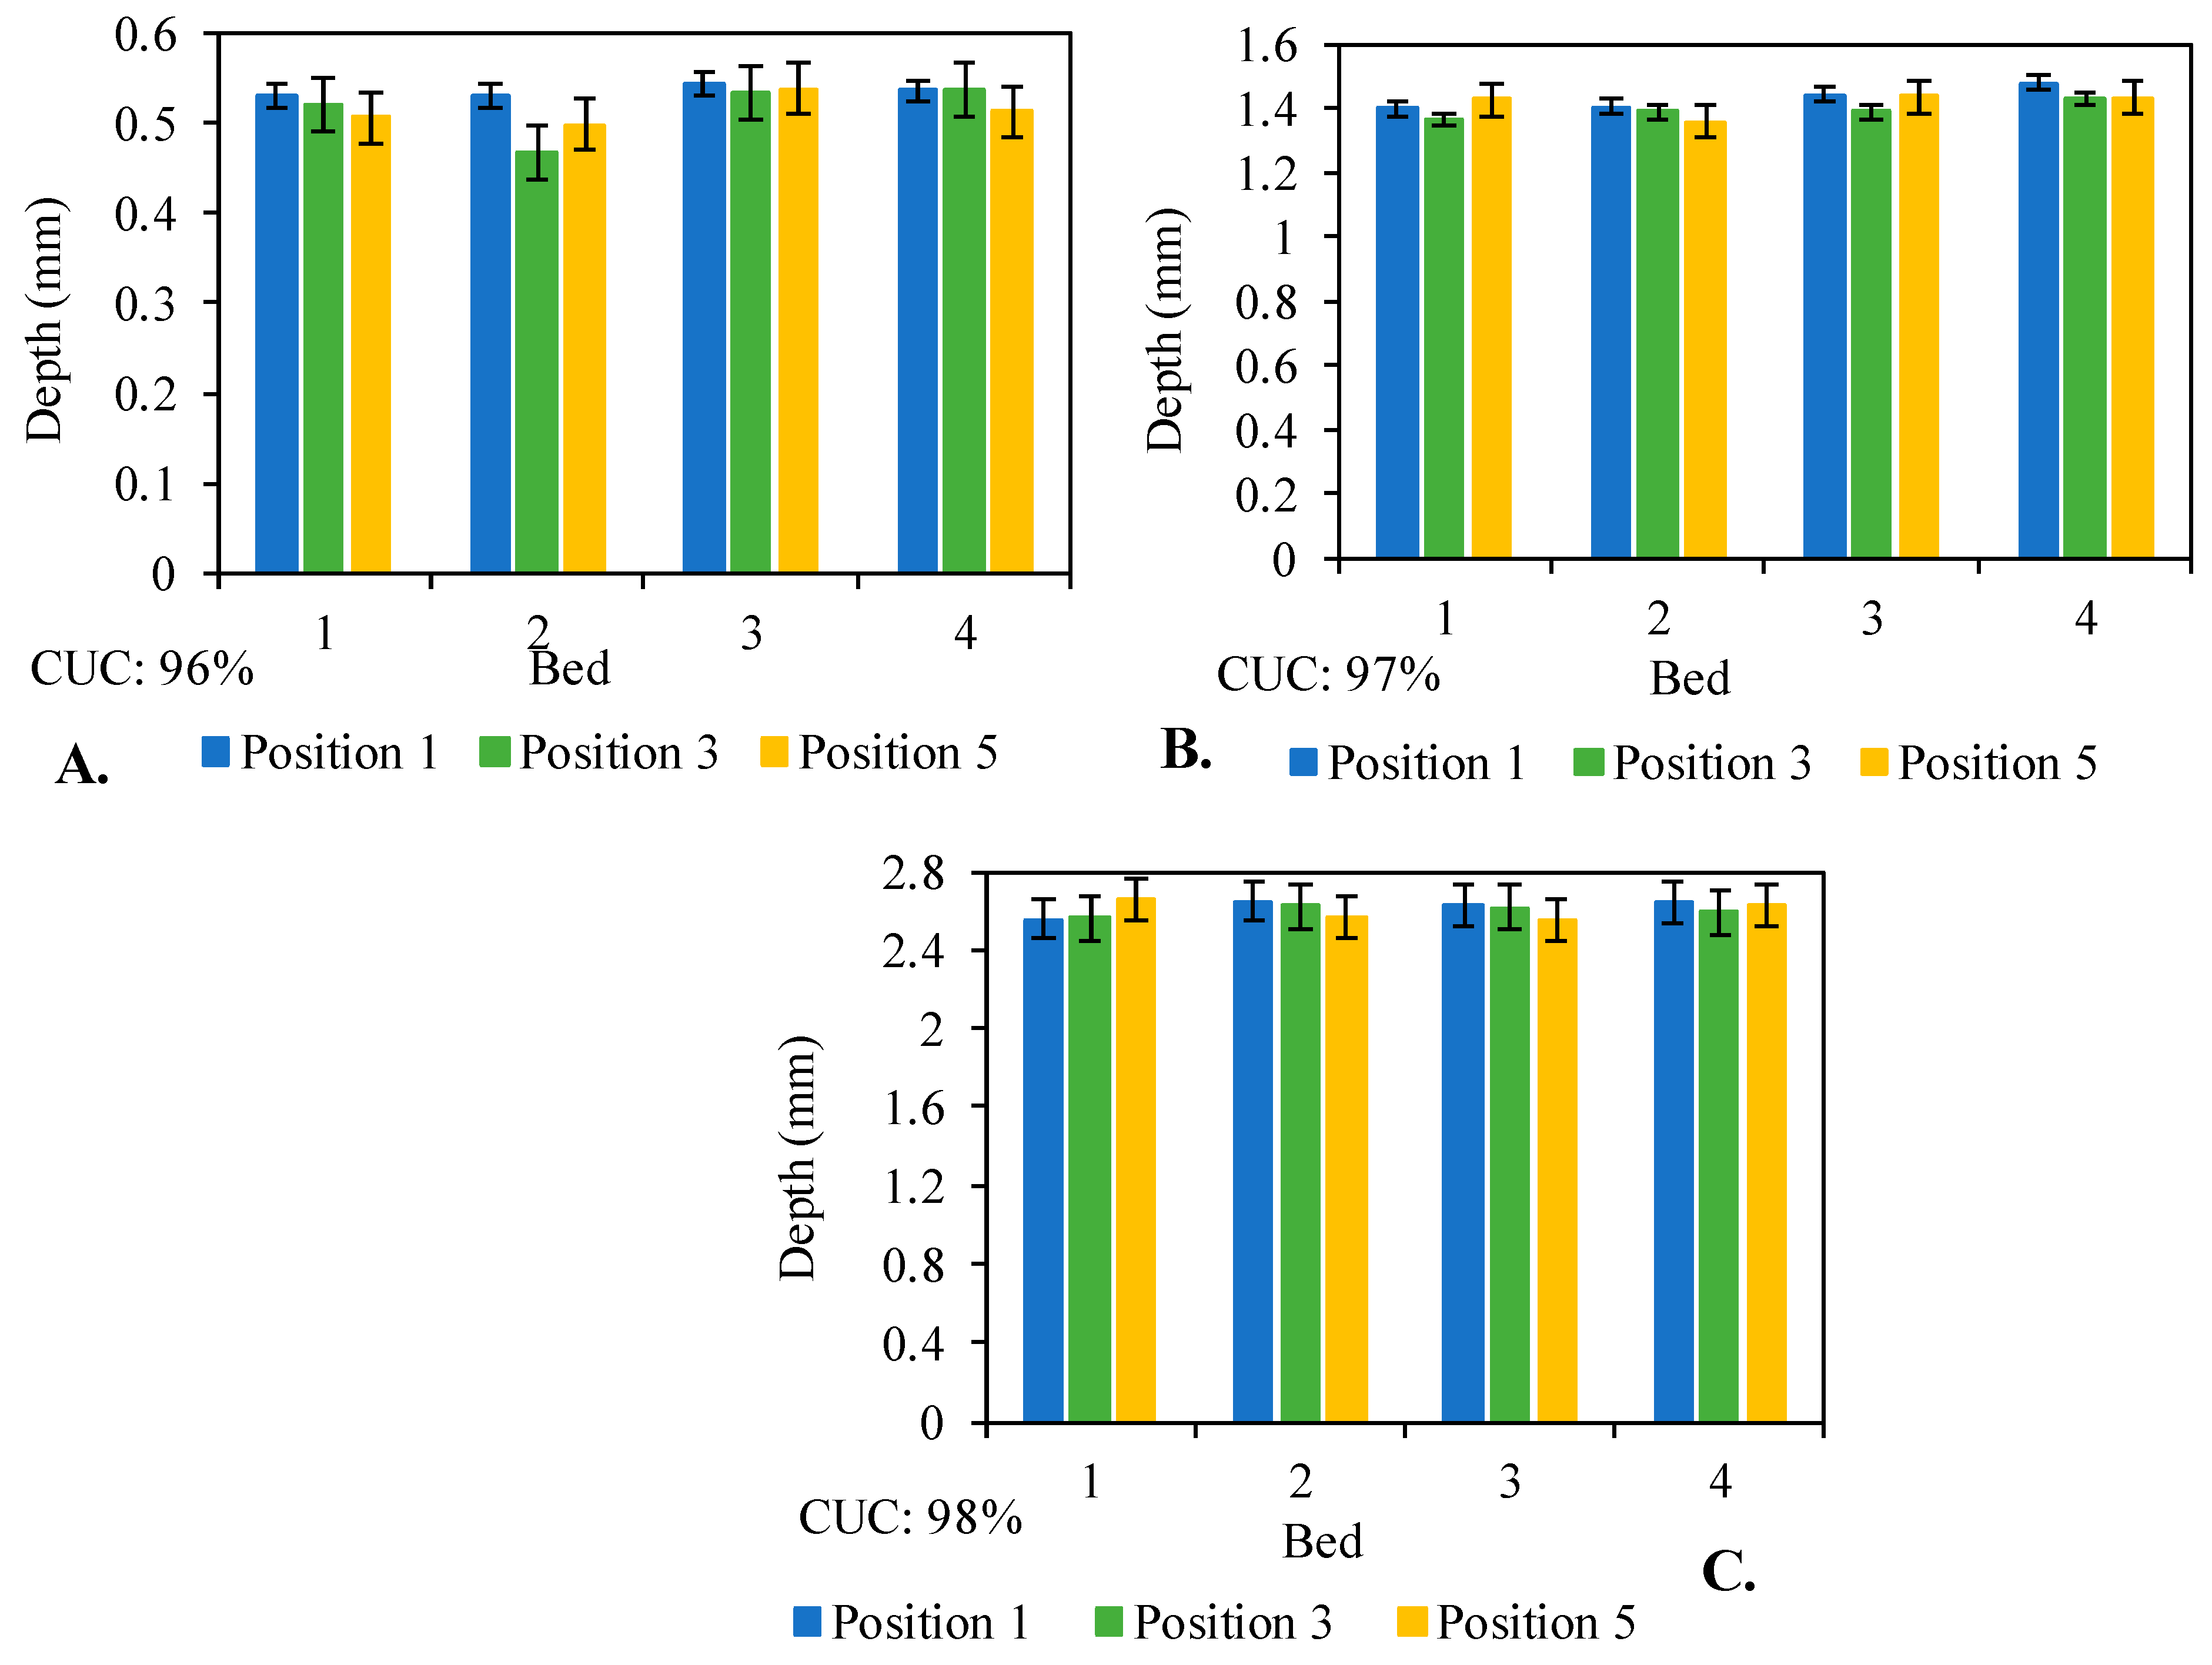
The drip line was evaluated using tests that considered both the uniform demand (constant depths) and variable demands (variable depths) along and between the beds. The constant depth evaluation aimed to assess hydraulic effects due to coiling the hose along the path and the stability of the speed control. To do this, depths of 0.5, 1.5, and 2.5 mm were defined, with corresponding speeds of 71, 26, and 16 m h−1, respectively. In the tests with variable depths, the water needs of horticulture production cultivated in the region of Seropédica-RJ, Brazil, were simulated, according to [19]. Five repetitions were performed for each depth in both tests.
In the simulation, four beds were considered, planted with carrots, lettuce, cucumbers, radishes, beans, chicory, and Malabar spinach, whose water needs were determined using reference evapotranspiration data and crop coefficients. The crop selection, development stage, and position in the beds were selected randomly, and the results are presented in Table 1.
After collecting the data from the performance evaluation of the drip line, the relative depth was determined, corresponding to the quotient of the applied depth by the required depth (Equation (7)).
I i = l a i l req i
where:
I i —Relative depth at each collector (dimensionless);
la(i)—Applied depth (mm) corresponding to bed i;
and lreq(i)—Required depth (mm) corresponding to bed i.
The application uniformity was expressed through Christiansen’s uniformity coefficient (Equation (8)). Considering that the system applies water at a variable rate according to spatial variability, the relative depth was considered for the CUC determination, aiming to measure the uniformity of the equipment in meeting crop demands.
CUC = 1 i = 1 n I i Im n Im × 100
where:
CUC—Christiansen’s uniformity coefficient (%);
Im—Average of the relative depths;
and n—Number of collectors.
The application efficiency (Ea) was determined using Equation (9), considering the area adequately irrigated (GA) from 83% to 100%, meaning this would be the percentage of the area receiving a depth equal to or greater than the required depth. Given the demand variability across the evaluation area, the relative depth was used as the basis, considering the depth stored in the soil equal to the required depth for points where Ii ≥ 1, and equal to the applied depth for points where Ii < 1, corresponding to regions with deficits.
Ea = LMarm LMa × 100
where:
Ea—Application efficiency (%);
LMarm—Average depth stored in the soil (mm);
and LMa—Average applied depth (mm).

2.4. Potential Irrigable Area

To evaluate the potential irrigable area, dimensions of 6.0 m in width and 20 m in length were considered, corresponding to the design dimensions of the drip line (width of the line × length of the beds). An irrigation time of 8 h and a maximum depth of 5 mm were considered to calculate the irrigation per unit area, providing irrigation for 16 beds per day.

3. Results

3.1. Control of the Applied Depth through Pulse Activation

The depth control between beds through pulse activation yielded satisfactory results for the emitter, as shown in Figure 7. The relationship between the time fraction and the average fraction of the depth showed low dispersion, linearity, and adequate response time. Regarding linearity, it is observed that beyond 80% of activation time, there is a limitation in depth control, and the operating limit is restricted to this range. This limit is related to the response time of the flow control valve, which for the imposed hydraulic conditions was 6 s, equivalent to 20% of the period between pulses.

3.2. Performance Evaluation of the Drip Line under a Constant Rate

For all the depths tested in the evaluation of uniformity under a constant rate (0.5, 1.5, and 2.5 mm), the CUCs were above 95%, considered excellent in localized irrigation [20] (Figure 8). The coefficients of variation (CV) were, respectively, 2.84, 3.25, and 3.43%, also considered excellent (CV < 10%) [21]. For the required depths of 0.5 and 2.5 mm, average applied depths were obtained 4% higher, but for the 1.5 mm depth, there was a deficit of 5%. These differences are associated with inherent errors in the line speed control, as well as the variation in the hydraulic behavior of emitters. It is worth noting that the level of error found is consistent with the results found in field evaluation for drip irrigation systems, as well as for mechanized systems [22,23], whose application efficiencies are generally below 90%.

3.3. Performance Evaluation of the Drip Line under a Variable Rate

The standardized CUC ranged from 93% to 96% among the tests under the variable rate, whose mean value was 95% ± 1.4 (Figure 9), and the average CV of standardized depths was 5.4%, classified as excellent according to [14]. The CUC values are above the minimum recommended for drip irrigation systems, which should be higher than 80% [22]. It is worth noting that the coefficient of variation of the required depths in the evaluations was 21.8% (Table 1), showing the importance of variable-rate irrigation in environments with diversified cropping systems.
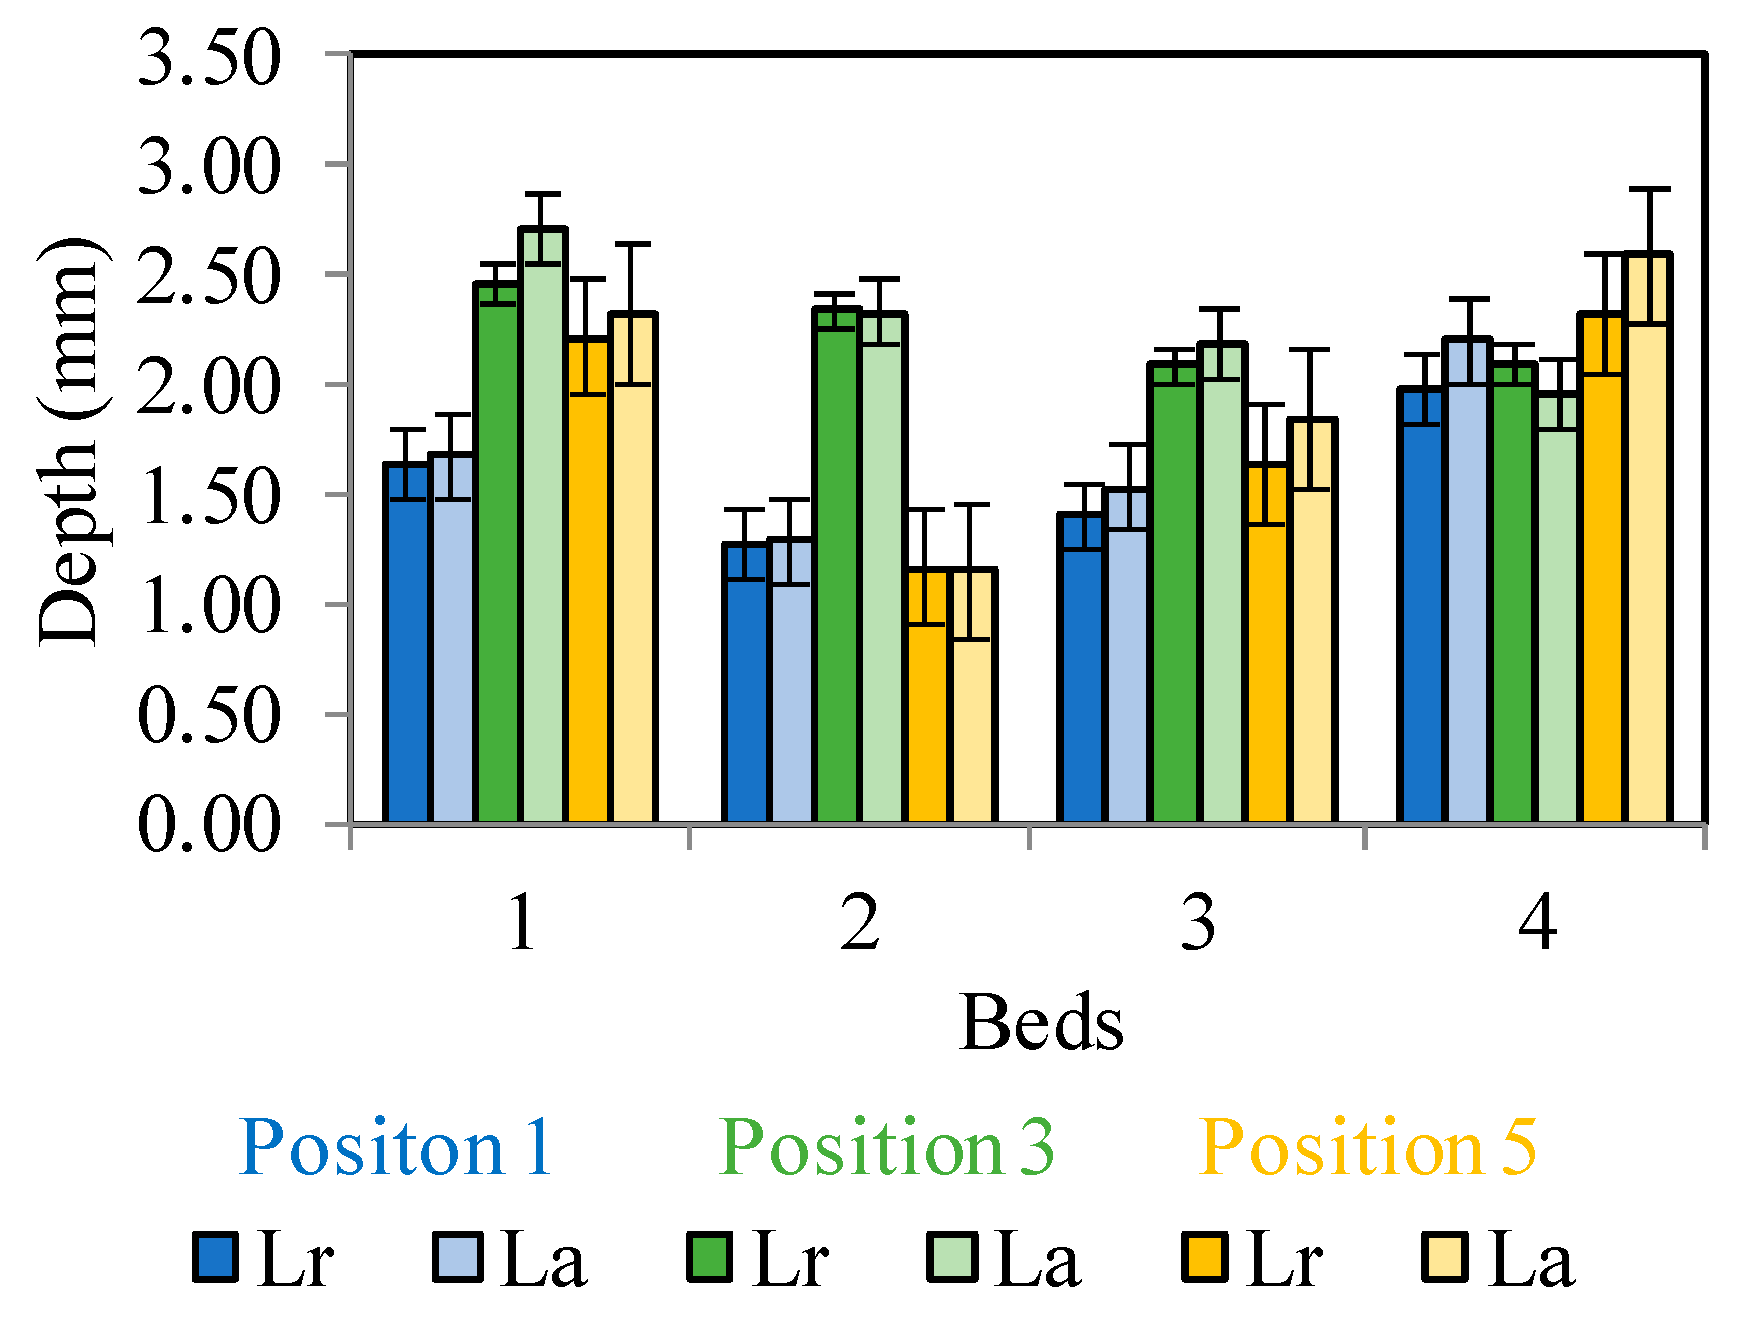
In addition to the high uniformity of distribution of the relative depths, the performance of the developed irrigation system showed good precision and accuracy in water application at variable rates (Figure 10). The average relative depth varied from 0.98 (bed 1, position 3) to 1.11 (bed 4, position 3), with a mean value of 1.05 ± 0.05.
The potential water savings considering all the beds of cultivated crops along the beds on the day of evaluation (Figure 10) were 23.2%, which corresponds to the difference between the average required depth and the maximum depth. Considering the applied depth during the evaluations and the maximum required depth, the savings would be at least 19.1%, as the constant rate system would also not have 100% application efficiency.
It is clear that the potential for savings in a diversified environment is highly dynamic, depending on the dynamics of the crops, and can provide returns much higher than those found in the drip line evaluation. In field evaluations with variable and constant application, [24] found a potential water savings of approximately 25% for soybean crops irrigated by center pivots. In a study on the use of variable-rate irrigation for pasture, corn, and potatoes, [25] observed a reduction in depths from 9% to 19% compared to uniform irrigation. It is worth noting that in the studies cited above, the variability was due to soil characteristics and not the crop or development phase.
Adopting irrigation management based on the maximum demand of the crop results in a reduction in application efficiency due to the excess water applied in areas with lower demand, leading to nutrient leaching and reduction of oxygen for the roots and, consequently, reducing crop productivity. In the study conducted by [25], the reduction in water losses due to percolation was from 25% to 45%, demonstrating that variable-rate irrigation contributes to the reduction of nutrient leaching.

3.4. Evaluation of Variation in Displacement Speed and Pressure Loss in the Flexible Hose of the Drip Line

The drip line speed showed low variation along the evaluated route for most PWM values, whose average speeds ranged from 10.5 to 67.6 m h−1 (Figure 11). The lowest speed variation was observed for the PWM value of 55 bytes (minimum motor rotation), whose standard deviation was 0.3 m h−1. For higher PWM values, there was a tendency for increased oscillations, with the highest standard deviation values of 2.3 and 3.6 m h−1, corresponding to PWM values of 255 and 205, respectively.

4. Discussion

4.1. Control of the Applied Depth through Pulse Activation

Considering the relative time interval from 20% to 80% of the pulse period, the calibration equation demonstrated linearity and low dispersion, resulting in a correction coefficient of approximately 1.0. The 30-s period between valve activation pulses led to satisfactory outcomes, enabling the control of depth application between the beds with a variation spanning from 0% to 100% of the maximum depth at the designated point between them. Importantly, the maximum depth is adjusted by the line speed. This illustrates that depth control between beds is not limited in range and facilitates meeting water demands with virtually unlimited spatial variability.
Ref. [26] used solenoid valves for the depth control of central pivot irrigation systems aiming for variable-rate water application. The activations were performed through pulses ranging from 20% to 80% of cycles. According to the authors, the depth control technique combined with Fuzzy logic provided a depth application that considered the spatial viability of water consumption by plants.

4.2. Performance Evaluation of the Drip Line under a Constant Rate

The performance observed in the application under constant rates demonstrates that the line speed and pressure at the emitter inlet remained stable during the tests. These two factors can contribute to the depth variations distributed in the field, especially the displacement speed, which directly affects the depth. Additionally, water distribution uniformity can be affected when there is displacement speed variation, as seen in self-propelled systems [27]. However, since the emitters used in the line are regulated, the effect of these variations is mitigated. Therefore, depth variations are less sensitive than speed variations. Regulated emitters can maintain a consistent flow rate even with pressure fluctuations, ensuring greater uniformity compared with unregulated emitters [28].

4.3. Performance Evaluation of the Drip Line under a Variable Rate

The use of CUC for relative depths as an indicator of irrigation quality in systems with variable application rates may be an interesting alternative since no methodologies indicated for measuring the performance of irrigation systems under this condition have been found in the literature. It is worth noting that this indicator does not represent the uniformity of water application in the system at variable rates but rather the uniformity of the system in meeting variable demands, which refers to the accuracy and effectiveness of the control system for the applied depths.
The results demonstrate that the control system for the applied depth is accurate and precise, as the depth variation among the conducted tests showed a standard deviation of the mean of 0.06, representing the uncertainty of the depth applied at each point in the soil. This performance is attributed to the stability of the displacement speed, as well as the effectiveness of the depth control between beds through valve activation via electrical pulses.
The fact that some points in the evaluated area received relative depths lower than 1.0 does not necessarily mean that the crop would experience permanent water deficit and, consequently, reduced productivity, as depth variations can be corrected by adopting application efficiency and degree of suitability. The application efficiency (Ea) was 93.4% for a degree of suitability of 83% (Figure 9B), meaning that 83% of the area would receive at least the required depth. For a suitability degree of 100%, where the entire area receives the minimum required, the Ae would be 88.3%.
The potential water savings from using variable-rate irrigation in the evaluated environment are related to the demand variability and the efficiencies of the irrigation system. The maximum required depth was 2.44 mm (bed 1, position 3), and the minimum required depth was 1.17 mm (bed 2, position 5), corresponding to a ratio of approximately 2.1 (Figure 10). This means that constant-rate irrigation would apply more than double the required depth in the area with lower demand as irrigation management, in general, is established considering the maximum demand in the area at the time of irrigation. According to [29], the driest areas of the field are selected by farmers as points for determining irrigation depths in conventional system management, i.e., without using variable-rate irrigation. In the case of diversified systems, these would be the locations with crops of higher water demand.

4.4. Evaluation of Variation in Displacement Speed and Pressure Loss in the Flexible Hose of the Drip Line

The coefficient of variation of the average speed for all PWM values was 3.8%. The lowest value was 3.0%, and the highest was 6.2%, corresponding to PWM values of 155 and 205 bytes, respectively. Overall, speed variation oscillated around 3.3%, with the highest variation for the PWM value of 205 bytes. According to [3], the speed of DC motors can be controlled by the armature supply voltage, and the PWM technique may present unsatisfactory dynamic behavior. Additionally, variations in the power supply voltage can lead to changes in the motor’s angular velocity. To correct these oscillations, it would be necessary to implement a real-time speed control system to constantly adjust the PWM value, maintaining the speed at the desired value. It is important to note that variations in displacement speed may decrease depth application uniformity because one of the methods of adjusting the depth is the speed. Despite the variations presented, application uniformity was satisfactory, demonstrating that speed adjustment was reliable and could be used as a method for varying the depths along the beds.
The average variation in pressure loss of the flexible hose was 3 mca, with 0.35 and 3.31 mca when the hose was completely uncoiled and coiled, respectively. This variation does not have the potential to alter application uniformity or applied depth as the emitters used are regulated. However, the inlet pressure of the reel should be adjusted considering the pressure loss in the coiled hose to ensure the minimum operating pressure of the emitters. The change in pressure loss in the hose when coiled is due to the alteration of flow resistance. In hydraulic evaluations of self-propelled systems, [30] found an increase of up to 28% in pressure loss in the hose when it was coiled on the reel.
Based on the range of displacement speeds shown in Figure 11, the potential irrigable area of the drip line is 360 m2 per day, considering 8 h of daily operation and an application rate of 5 mm per day. It is worth noting that the potential irrigable area may vary depending on the water demand of the cropping system and the dimensions of the irrigated area.

5. Conclusions

A mobile drip line irrigation system was developed to apply variable irrigation rates in areas with diversified crops. The irrigation rates were adjusted using two methods: along the beds, through the speed of movement, and between the beds, through the valve activation time via electrical pulses. The irrigation system was evaluated in terms of adjusting the water depth and application uniformity.
The drip line irrigation system that has been developed can effectively meet the spatial and temporal variability of crop water requirements in horticultural settings. Additionally, the control of irrigation depth through valve activation via electrical pulses allows for the application of variable depths between the beds.
Adjusting the speed of movement enables variation in depths along the beds, and the drip line demonstrated excellent performance, with over 96% uniformity in fixed depths and 95% in variable depths. Thus, this study offers an innovative and adaptable solution that can be implemented on a large scale, benefiting both farmers and the environment.
Further study is needed to quantify potential benefits, such as increased productivity and resource savings. Additionally, replacing the PVC support structure of the bar with metal materials could enhance mechanical performance, making the structure more rigid and robust. Furthermore, increasing the motor speed and the irrigated area could reduce the system’s implementation cost. It is also important to explore the possibility of using different types of valves and the potential for applying fertilizers, thereby expanding the system’s capabilities.

Author Contributions

Conceptualization, M.F.P. and M.V.M.d.O.; methodology, T.O.P.M., M.F.P. and M.V.M.d.O.; software, T.O.P.M. and M.F.P.; validation, T.O.P.M.; formal analysis, T.O.P.M. and M.F.P.; investigation, T.O.P.M., M.F.P. and M.V.M.d.O.; resources, M.F.P. and D.F.d.C.; data curation, T.O.P.M. and M.F.P.; writing—original draft preparation, T.O.P.M., M.F.P. and D.F.d.C.; writing—review and editing, T.O.P.M., M.F.P. and D.F.d.C.; supervision, M.F.P. and M.V.M.d.O.; project administration, M.F.P.; funding acquisition, M.F.P. All authors have read and agreed to the published version of the manuscript.

Funding

This project was financed by Coordenação de Aperfeiçoamento de Pessoal de Nível Superior–Brasil (CAPES): Finance Code 001, and Conselho Nacional de Desenvolvimento Científico e Tecnológico–Brasil (CNPq): Process 25999/2018-1.

Data Availability Statement

Data are contained within the article.

Acknowledgments

We thank the Federal Rural University of Rio de Janeiro, specifically the PGEAAMB/UFRRJ, and institutions that funded the study.

Conflicts of Interest

The authors declare no conflict of interest.

References

  1. Xian, Y.; Cai, G.Y.; Lin, J.; Chen, Y.; Wang, X.L. Comparison of crop productivity, economic benefit and environmental footprints among diversified multi-cropping systems in South China. Sci. Total Environ. 2023, 874, 162–407. [Google Scholar] [CrossRef] [PubMed]
  2. Kumari, V.V.; Balloli, S.S.; Kumar, M.; Ramana, D.B.V.; Prabhakar, M.; Osman, M.; Indorian, A.K.; Manjunath, M.; Maruthi, V.; Chary, G.R.; et al. Diversified cropping systems for reducing soil erosion and nutrient loss and for increasing crop productivity and profitability in rainfed environments. Agric. Syst. 2024, 217, 103–919. [Google Scholar] [CrossRef]
  3. Hernández-Guzmán, V.M.; Silva-Ortigoza, R.; Muñoz-Carrillo, D. Velocity control of a brushed DC-motor driven by a DC to DC buck power converter. Int. J. Innov. Comput. Inf. Control 2015, 11, 509–521. [Google Scholar]
  4. Burbano-Figueroa, O.; Sierra-Monroy, A.; David-Hinestroza, A.; Whitney, C.; Borgemeister, C.; Luedeling, E. Farm-planning under risk: An application of decision analysis and portfolio theory for the assessment of crop diversification strategies in horticultural systems. Agric. Syst. 2022, 199, 103–409. [Google Scholar] [CrossRef]
  5. Wu, J.; Wang, J.; Hui, W.; Zhao, F.; Wang, P.; Su, C.; Gong, W. Physiology of Plant Responses to Water Stress and Related Genes: A Review. Forests 2022, 13, 324. [Google Scholar] [CrossRef]
  6. Komarek, A.M.; De Pinto, A.; Smith, V.H. A review of types of risks in agriculture: What we know and what we need to know. Agric. Syst. 2020, 178, 102738. [Google Scholar] [CrossRef]
  7. Medici, L.O.; Reinert, F.; Carvalho, D.F.; Kozak, M.; Azevedo, R.A. What about keeping plants well watered? Environ. Exp. Bot. 2014, 99, 38–42. [Google Scholar] [CrossRef]
  8. Wu, P.; Wang, Y.; Li, Y.; Yu, H.; Shao, J.; Zhao, Z.; Qiao, Y.; Liu, C.; Liu, S.; Gao, C.; et al. Optimizing irrigation strategies for sustainable crop productivity and reduced groundwater consumption in a winter wheat-maize rotation system. J. Environ. Manag. 2023, 348, 119469. [Google Scholar] [CrossRef]
  9. Ben-Gal, A.; Cohen, Y.; Peeters, A.; Naor, A.; Nezer, Y.; Ohana-Levi, N.; Bahat, I.; Katz, L.; Shaked, B.; Linker, R.; et al. Precision drip irrigation for horticulture. Acta Hortic. 2022, 1335, 267–274. [Google Scholar] [CrossRef]
  10. Lopes, P.R.; Rezende, A.P.C.; Crespi, D.; Galata, R.F.; Silva, F.X.; Cruz, M.S.S.; Santos, J.D.; Kageyama, P.Y. Principles and tools for designing and managing agroecological gardens: Experiences from the agroecological settlements project in southern Bahia. Retrato Assentamentos 2016, 19, 175–207. [Google Scholar]
  11. De Lara, A.; Khosla, R.; Longchamps, L. Characterizing Spatial Variability in Soil Water Content for Precision Irrigation Management. Agronomy 2018, 8, 59. [Google Scholar] [CrossRef]
  12. Cahn, M.D.; Johnson, L.F. New approaches to irrigation scheduling of vegetables. Horticulturae 2017, 32, 28. [Google Scholar] [CrossRef]
  13. Kamyshova, G.; Osipov, A.; Gataullin, S.; Korchagin, S.; Ignar, S.; Gataullin, T.; Terekhova, N.; Suvorov, S. Artificial Neural Networks and Computer Vision’s-Based Phytoindication Systems for Variable Rate Irrigation Improving. IEEE Access 2022, 10, 8577–8589. [Google Scholar] [CrossRef]
  14. Li, X.; Zhao, W.; Li, J.; Li, Y. Effects of irrigation strategies and soil properties on the characteristics of deep percolation and crop water requirements for a variable rate irrigation system. Agric. Water Manag. 2021, 257, 107–143. [Google Scholar] [CrossRef]
  15. Sharma, V.; Irmak, S. Economic comparisons of variable rate irrigation and fertigation with fixed (uniform) rate irrigation and fertigation and pre-plant fertilizer management for maize in three soils. Agric. Water Manag. 2020, 240, 106–307. [Google Scholar] [CrossRef]
  16. Valença, D.C.; Carvalho, D.F.; Reinert, F.; Azevedo, R.A.; Pinho, C.F.; Medici, L.M. Automatically controlled deficit irrigation of lettuce in “organic potponics”. Sci. Agric. 2018, 75, 52–59. [Google Scholar] [CrossRef]
  17. Cunha, K.C.B.; Rocha, R.V. Automation in the irrigation process in family farming with Arduino platform. Rev. Eletrônica Competências Digit. Para Agric. Fam. 2015, 1, 62–74. [Google Scholar]
  18. Alvarenga, A.C.; Ferreira, V.H.; Fortes, M.Z. Photovoltaic solar energy: An application in family farming irrigation. Sinergia 2014, 15, 311–318. [Google Scholar]
  19. Silva, L.O. Agroecomic Performance of a Diversified Organic Vegetable Cultivation Module with a Focus on Nitrogen Balance. Master’s Thesis, Federal Rural University of Rio de Janeiro, Seropédica, RJ, Brazil, 2019; 64p. [Google Scholar]
  20. Frizzone, J.A.; Freitas, P.S.L.; Rezende, R.; Faria, M.A. Microirrigation: Drip and Microsprinkler Systems, 1st ed.; Maringá: Eduem, Brasil, 2012; 356p, ISBN 978-85-7628-460-4. [Google Scholar]
  21. Camp, C.R.; Sadler, E.J.; Busscher, W.J. A Comparison of Uniformity Measures for Drip Irrigation Systems. Trans. ASAE 1997, 40, 1013–1020. [Google Scholar] [CrossRef]
  22. Merriam, J.L.; Keller, J. Farm Irrigation System Evaluation: A Guide for Management; Agricultural Irrigation Engineering Department: Logan, UT, USA, 1978. [Google Scholar]
  23. Tarjuelo, J.M.; Montero, J.; Honrubia, F.T.; Ortiz, J.J.; Ortega, J.F. Analysis of uniformity of sprinkle irrigation in a semi-arid area. Agric. Water Manag. 1999, 40, 315–331. [Google Scholar] [CrossRef]
  24. Sui, R.; Yan, H. Field study of variable rate irrigation management in humid climates. Irrig. Drain. 2017, 66, 327–339. [Google Scholar] [CrossRef]
  25. Hedley, C.B.; Yule, I.J.; Tuohy, M.P.; Vogeler, I. Key Performance Indicators for Simulated Variable-Rate Irrigation of Variable Soils in Humid Regions. Trans ASABE 2009, 52, 1575–1584. [Google Scholar] [CrossRef]
  26. Schi, X.; Han, W.; Zhao, T.; Tang, J. Decision support system for variable rate irrigation based on UAV multispectral remote sensing. Sensors 2019, 19, 2880. [Google Scholar] [CrossRef] [PubMed]
  27. Oliveira, H.F.E.; Colombo, A.; Faria, L.C.; Prado, G. Effects of wind speed and direction on the uniformity of water application in self-propelled systems. Eng. Agrícola 2012, 32, 669–678. [Google Scholar] [CrossRef]
  28. Chen, X.; Wei, Z.; Wei, C.; He, K. Effect of compensation chamber structure on the hydraulic performance of pressure compensating drip emitters. Biosyst. Eng. 2021, 214, 107–121. [Google Scholar] [CrossRef]
  29. Peters, R.T.; Desta, K.; Nelson, L. Practical Use of Soil Moisture Sensors Their Data for Irrigation Scheduling Washington State University Extension Fact Sheet, F.S.0.8.3.E. 2013. Available online: https://cru.cahe.wsu.edu/CEPublications/FS083E/FS083E.pdf (accessed on 21 August 2024).
  30. Santos, M.V.M. Hydraulic Characterization of Reel Irrigators during Their Movement. Ph.D. Dissertation, Federal University of Lavras, Lavras, MG, Brazil, 2010; 106p. [Google Scholar]
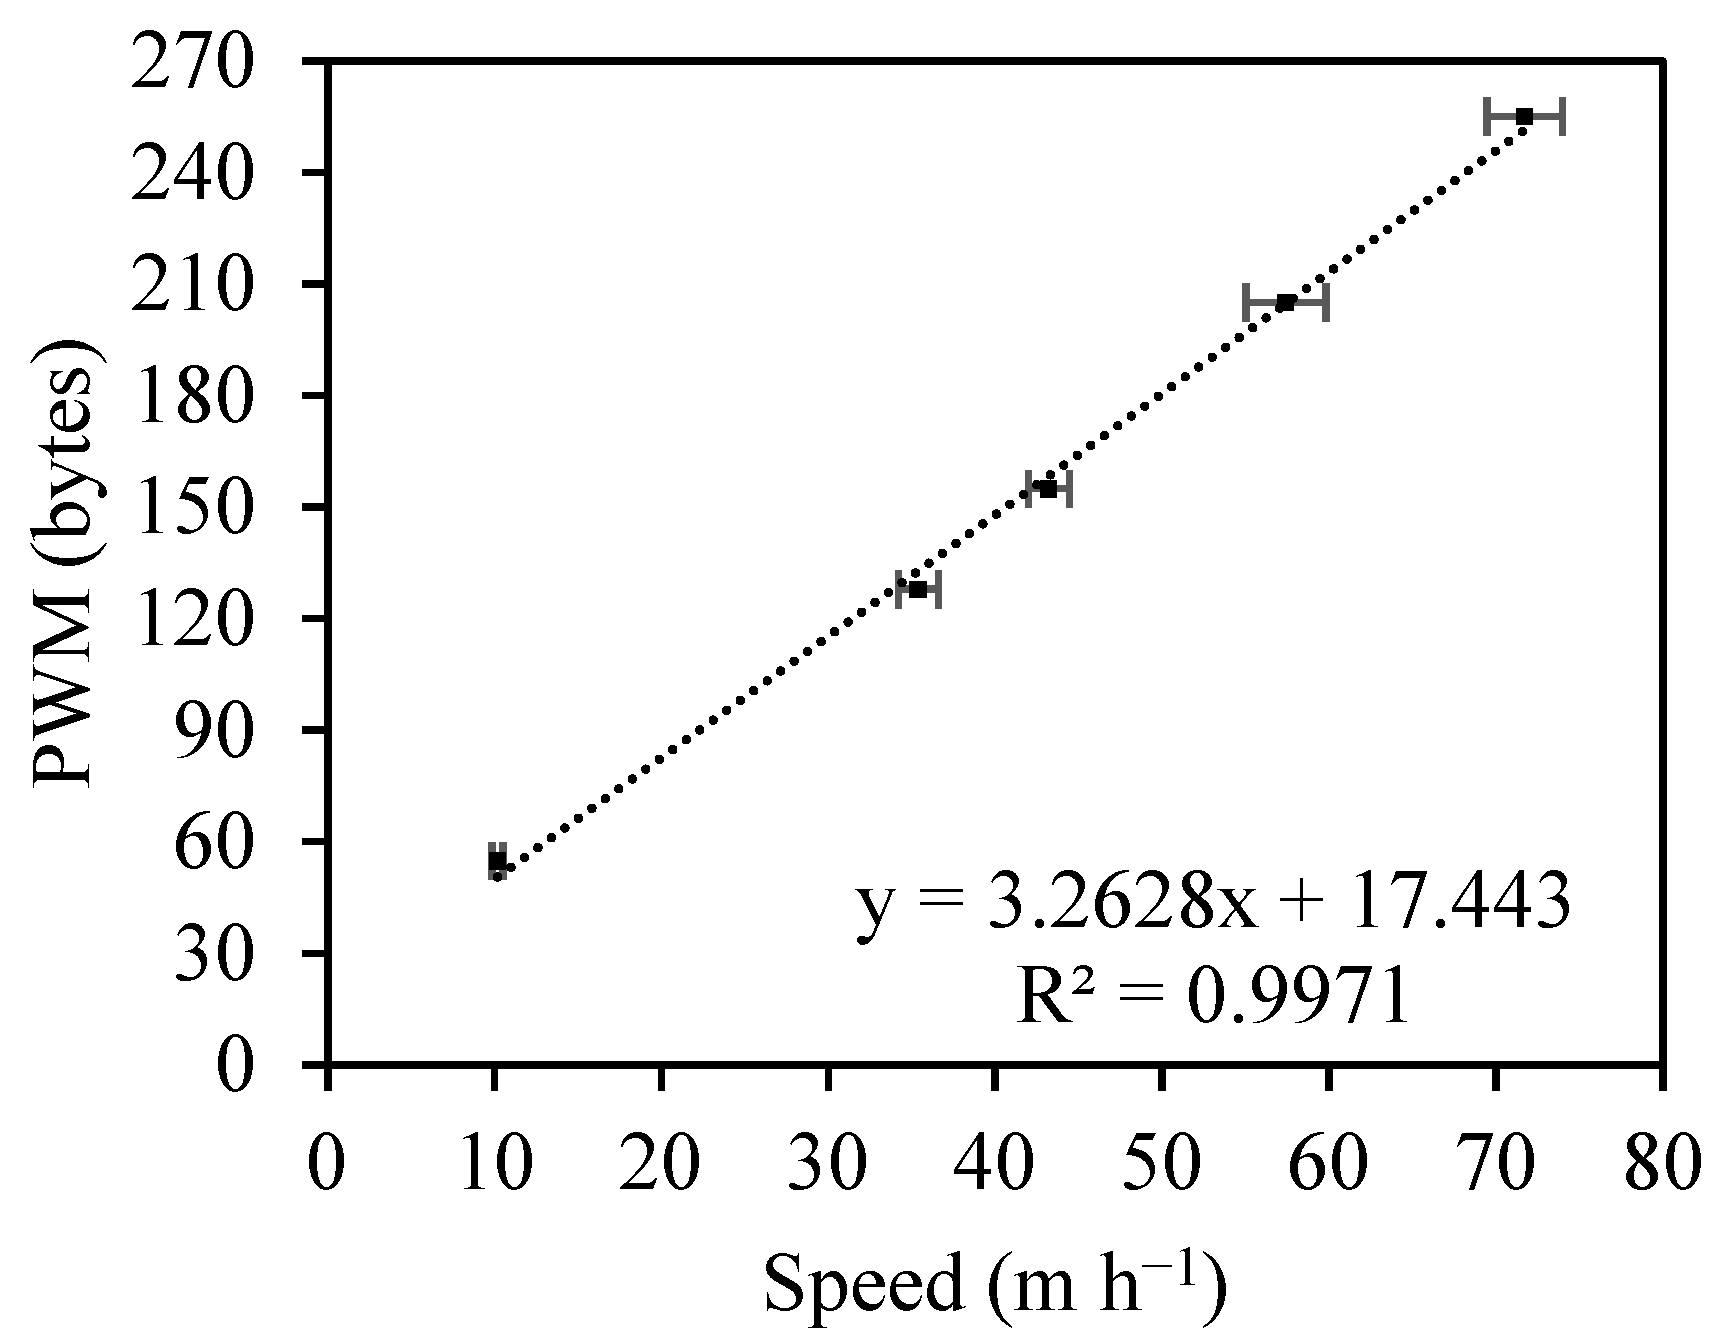
Figure 1. Calibration curve of the drip line displacement speed.
Agriengineering 06 00184 g001
Figure 2. Schematic diagrams showing the electronic control panel components of the drip line (A) and the electronic control panel components of the reel mechanism (B).
Agriengineering 06 00184 g002
Figure 3. Flowchart showing the programming implemented in the reel mechanism control panel.
Agriengineering 06 00184 g003
Figure 4. Flowchart showing the programming implemented in the electronic control panel of the drip line.
Agriengineering 06 00184 g004
Figure 5. Calibration test of the pulse-controlled depth system. 1: PVC gutters and plastic containers; 2: hose reel; 3: lateral line with drips; 4: electronic controller; 5: main line; 6: control valve.
Agriengineering 06 00184 g005
Figure 6. Diagram showing the evaluation area of the test with the layout of the collection area.
Agriengineering 06 00184 g006
Figure 7. Correlation between time fraction and maximum depth fraction.
Agriengineering 06 00184 g007
Figure 8. Distribution of applied water depth along the beds: (A) programmed depth of 0.5 mm; (B) programmed depth of 1.5 mm; and (C) programmed depth of 2.5 mm.
Agriengineering 06 00184 g008
Figure 9. Distribution of applied relative depths: (A) Between beds and along the bed; (B) as a function of the percentage of irrigated area. CUCav: Average CUC; CUCmax: Maximum CUC among repetitions; CUCmin: Minimum CUC; Ea83: application efficiency for GA = 83%; Ea100%: application efficiency for GA = 100%.
Agriengineering 06 00184 g009
Figure 10. Comparison between required depth and applied depth.
Agriengineering 06 00184 g010
Figure 11. Speed variation along the path for different PWM values.
Agriengineering 06 00184 g011
Table 1. Depths required by the crops are input into the memory card for the irrigation system evaluation (mm) in each bed and their respective positions.
PositionBed 1Bed 2Bed 3Bed 4
CultureETcCultureETcCultureETcCultureETc
1Carrots (I)3.26Lettuce (I)3.26Cucumbers (I)2.79Radishes (I)3.26
2Carrots (III)4.89Lettuce (III)4.66Cucumbers (III)4.66Radishes (III)4.19
3Carrots (IV)4.42Beans (I)2.33Chicory (I)3.26Malabar spinach (IV)4.63
(I): Initial phase, initial Kc; (II): Development phase, average Kc; (III): Reproductive phase, average Kc; (IV): Maturation phase, final Kc.
Disclaimer/Publisher’s Note: The statements, opinions and data contained in all publications are solely those of the individual author(s) and contributor(s) and not of MDPI and/or the editor(s). MDPI and/or the editor(s) disclaim responsibility for any injury to people or property resulting from any ideas, methods, instructions or products referred to in the content.