Article

Comparative Performance of a Sprayer Rate Controller and Pulse Width Modulation (PWM) Systems for Site-Specific Pesticide Applications

1
College of Engineering, University of Georgia, Athens, GA 30602, USA
2
Department of Biosystems Engineering, Auburn University, Auburn, AL 36849, USA
3
Department of Entomology, University of Georgia, Tifton, GA 31793, USA
4
Department of Crop and Soil Sciences, University of Georgia, Tifton, GA 31793, USA
*
Author to whom correspondence should be addressed.
AgriEngineering 2024, 6(3), 3312-3326; https://doi.org/10.3390/agriengineering6030189
Submission received: 19 August 2024 / Revised: 8 September 2024 / Accepted: 10 September 2024 / Published: 12 September 2024
(This article belongs to the Section Sensors Technology and Precision Agriculture)

Abstract

:
With recent advances in spray technology and rising interest in site-specific applications, it is imperative to assess the performance of the latest application technologies to ensure effective pesticide applications. Thus, a study was conducted to compare and evaluate the performance of two different flow control systems [rate controller (RC) and pulse width modulation (PWM)] on an agricultural sprayer while simulating different site-specific application scenarios. A custom data acquisition and logging system was developed to record the real-time nozzle flow and pressure across the sprayer boom. The first experiment measured the response time to achieve different target application rates in single-rate site-specific (On/Off) states at varying simulated ground speeds. The second experiment examined the response time for rate transitions in variable-rate application scenarios among different selected target rates at varying simulated ground speeds. Across all the application scenarios, the PWM system consistently outperformed the RC system in terms of response time and rate stabilization. Specifically, the PWM system exhibited significantly lower mean rate stabilization times compared to the RC system during single-rate application states. Similarly, in the variable-rate application states—where the rate transitions were evaluated—the PWM system consistently displayed shorter mean rate transition and stabilization times compared to the RC system. Overall, the findings from this study suggest PWM systems tend to be more responsive and effective, making them the preferred choice for efficient precision site-specific pesticide applications. Future research should evaluate the influence of other operational parameters such as look-ahead time and ground speed variations on the performance of both systems in actual field applications.

1. Introduction

Modern agriculture is highly dependent on pesticides to ensure a higher crop yield and meet the food and fiber demands of the growing population. The Food and Agriculture Organization (FAO) reported that the total pesticide use in agriculture worldwide in 2022 was 3.7 million tons (Mt) of active ingredients, Of which the pesticide use in the US alone was 1.89 Mt [1]. While more growers in the US have gradually transitioned towards conservation farming over the years because of its many benefits, such as low soil erosion, high fertility, and low compaction [2], the number of spray operations required per field in a conservation system, especially a no-till system, is also greater, which increases the potential for the misapplication of pesticides [3,4]. Studies have reported that more than 45% of the applied agrochemicals do not reach their intended target but end up in non-target areas or polluting surface water and groundwater [5,6,7]. The economic cost of pesticide exposure in the United States is estimated to be USD 2 billion annually. The increased usage of pesticides and subsequently the potential for off-target applications have also considerably raised concerns about their potential adverse effects on the environment and human health [8].
Over the last decade, research efforts have been focused on different aspects of pesticide applications to reduce their potential impact on the environment, including the adoption and implementation of various precision agriculture practices and technologies. Several spray technologies, such as automatic section control (ASC), rate controllers, auto-boom height control, individual nozzle control, and pulse width modulation (PWM) systems, have been developed and implemented on agricultural sprayers to increase the accuracy and efficiency of pesticide applications [3,9,10,11]. Spray technologies like ASC and individual nozzle control provide capabilities to reduce the total amount of skips and overlaps during applications, whereas rate controller and PWM systems ensure that the target rate is being applied as the sprayer ground speed changes with the field conditions [11,12,13,14]. Modern sprayers equipped with individual nozzle control and PWM technology have advanced capabilities such as varying the application rates based on pre-defined prescription maps [11,15]. With advanced spray technologies becoming more standardized on most of the new commercial agricultural application equipment and with the increased interest in the site-specific or variable-rate (VR) application of pesticides, more research has been focused lately on understanding their performance during field operations [5,16].
Several researchers have investigated the application performance of flow-based control systems on agricultural sprayers [5,14,17]. Sprayers equipped with flow-based control systems such as rate controllers rely on changes in system pressure to compensate for ground speed variations; however, these pressure changes can lead to a non-uniform spray deposition pattern and changes in the droplet size spectrum [18]. Past studies have reported application errors (applied rate > ±10% of the target rate) can occur in more than 50% of the field for applications with large self-propelled sprayers equipped with a rate controller [17,19]. Unlike flow-based systems, PWM-equipped sprayers rely on changes in the duty cycle instead of pressure to achieve the target rate [20]. The duty cycle refers to how long a solenoid valve stays open or activated and indicates the duration for which a spray nozzle dispenses liquid. One of the main advantages of PWM systems is their consistent performance in terms of spray quality (droplet size spectrum) [9,11] when operated within the 40% to 100% duty cycle range [5,16]. PWM technology also provides a turn compensation feature which offers a distinct advantage over flow-based systems in curvilinear passes [12]. PWM systems can also exhibit a small delay in achieving their target rates [5]; however, it is much larger in flow-based systems due to the large pressure variations with sprayer ground speed variations. Several other factors, including controller setup and latency, operating speed range, nozzle selection, and field characteristics (shape, terrain, etc.) can also influence the application performance of both flow-based and PWM systems during field operations [5,21].
In recent years, the rising cost of pesticides and increased concerns around their off-target movement have further emphasized the need to utilize technologies and practices that ensure precision and efficient applications. For similar reasons and experiences with nutrient management in the past, VR fertilizer application has become a widespread practice in precision agriculture due to the demonstrated benefits of the site-specific application of crop inputs [6,16,22]. Further, the latest advancements in agricultural technology and data management systems have also made the creation and utilization of site-specific prescription maps more accessible and efficient. Improvements in both ground and aerial sensing technologies have revolutionized the process of the rapid collection and storage of and access to high-resolution spatial and temporal data related to different crop growth and health characteristics [15,23,24]. Utilizing modern data analysis and machine learning techniques, this information can be used to rapidly generate site-specific prescription maps for crop inputs.
As noted earlier, while pesticide application technology has improved considerably in recent years, uniform broadcast pesticide applications are still quite common within agricultural fields. However, this trend is changing with the commercialization and availability of technologies such as John Deere’s See & Spray [25]. There is rising interest among researchers and industry in site-specific pest management through targeted (also commonly referred to as spot or selective spraying) or VR application of pesticides [15]. Accordingly, as the demand for site-specific applications continues to increase, it is imperative to investigate and understand the performance of the latest application technologies. Therefore, the main goal of this study was to assess and compare the spray performance, in terms of the system response and rate transition time, of a traditional flow-based rate controller and a PWM system on an agricultural sprayer.

2. Materials and Methods

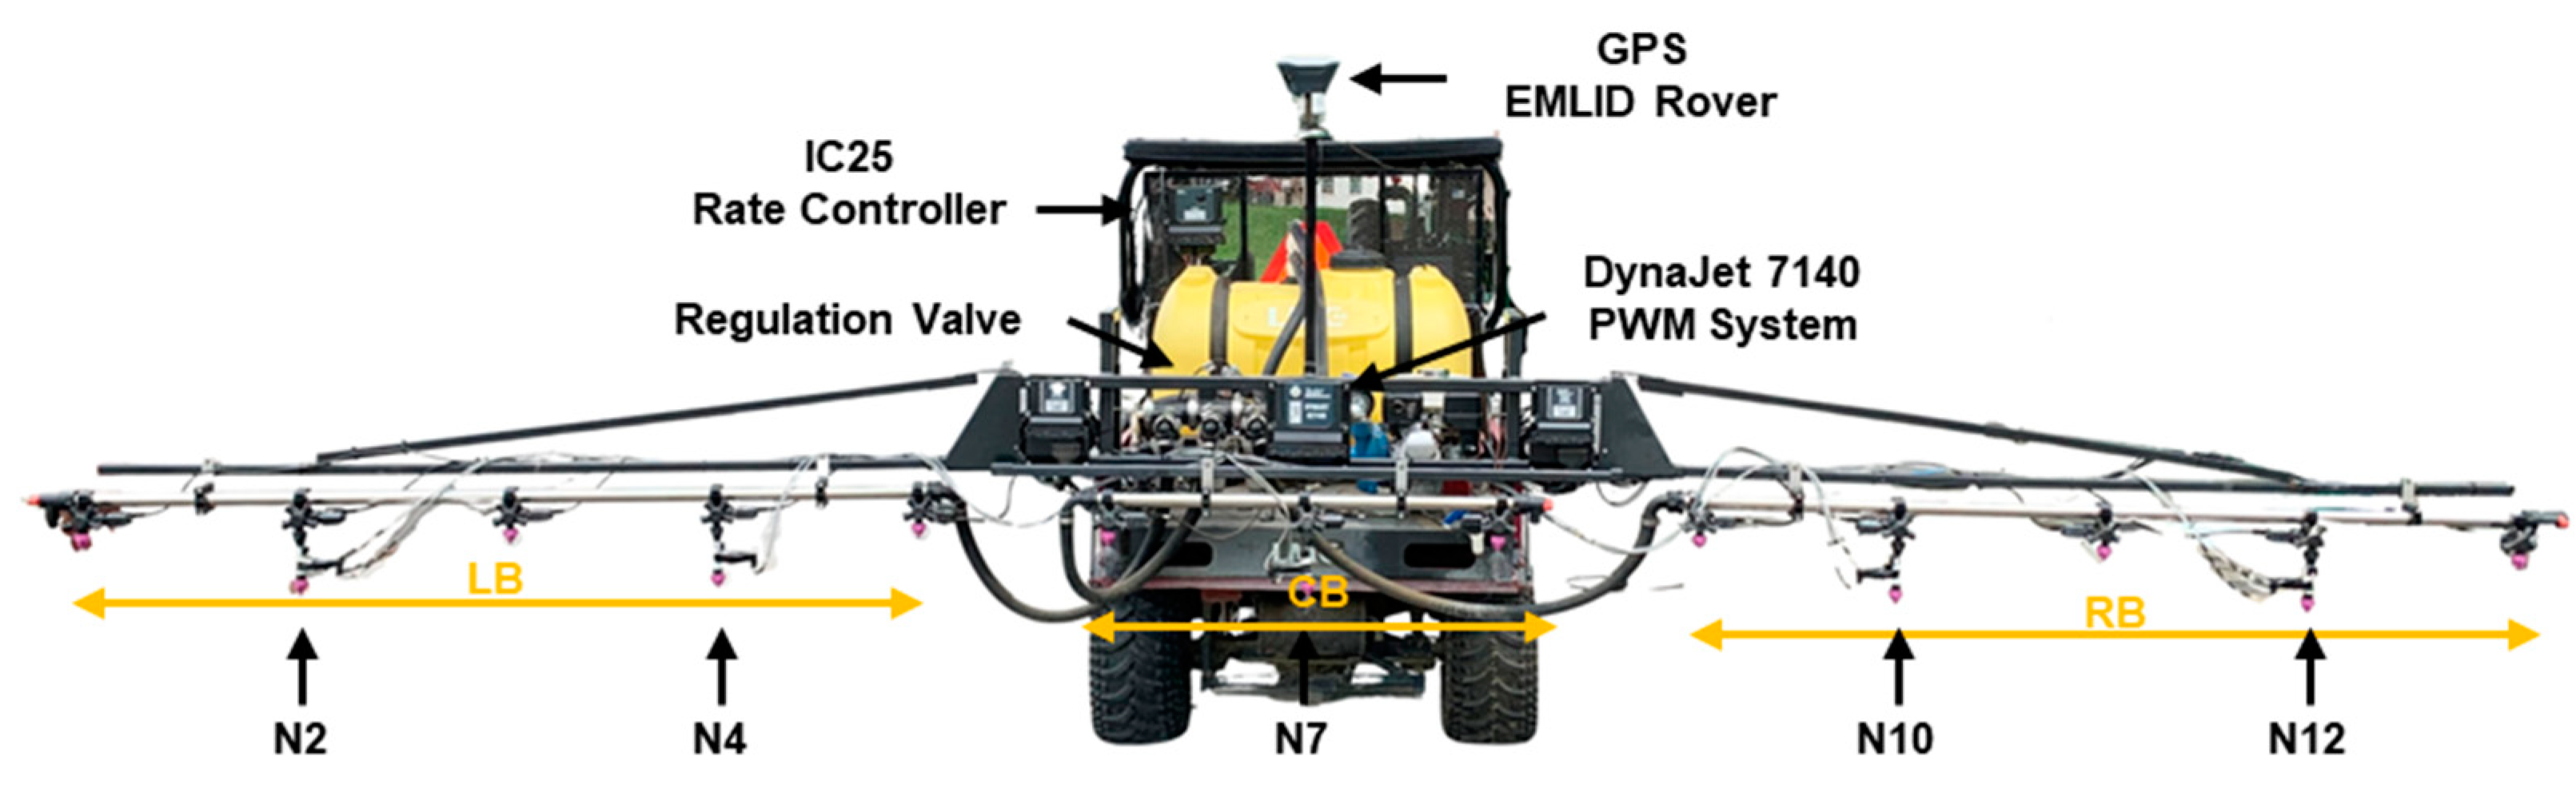
2.1. Application Equipment

A boom sprayer custom-built onto an all-terrain vehicle (Mule 550, Kawasaki Motors Corp., Lincoln, NE, USA) was used in this study (Figure 1). The sprayer had a boom length of 5.94 m with 13 nozzles spaced equidistant at 0.46 m intervals. The sprayer boom was divided into three sections as follows: the left boom section (LB, 5 nozzles), the center boom section (CB, 3 nozzles), and the right boom section (RB, 5 nozzles). The nozzles were numbered from 1 to 13, starting from the left boom section, as shown in Figure 1. The sprayer used a centrifugal pump (Model 1537, HYPRO, New Brighton, MN, USA) powered by a 3.6 kW gasoline engine (GX160, Honda Engines Group, Alpharetta, GA, USA) to pressurize the system. The system was equipped with an IC35 rate controller and a DynaJet 7140 PWM system, along with a turbine flow meter (Model 802), a pressure transducer (Model 16-05015), and a regulating valve (344BR-3F-06 CAB) installed in-line to control and measure the product flow and pressure (Figure 2a and Figure 2b, respectively). The PWM system also included solenoid valves (115880 e-ChemSaver) installed on all the nozzle bodies across the boom. An AEROS 9040 display/onboard computer was used to program and control the spray applications for both the rate control and PWM systems. Unless specified, all the components listed above were sold commercially by TeeJet® Technologies, Glendale Heights, IL, USA, and acquired for this study.

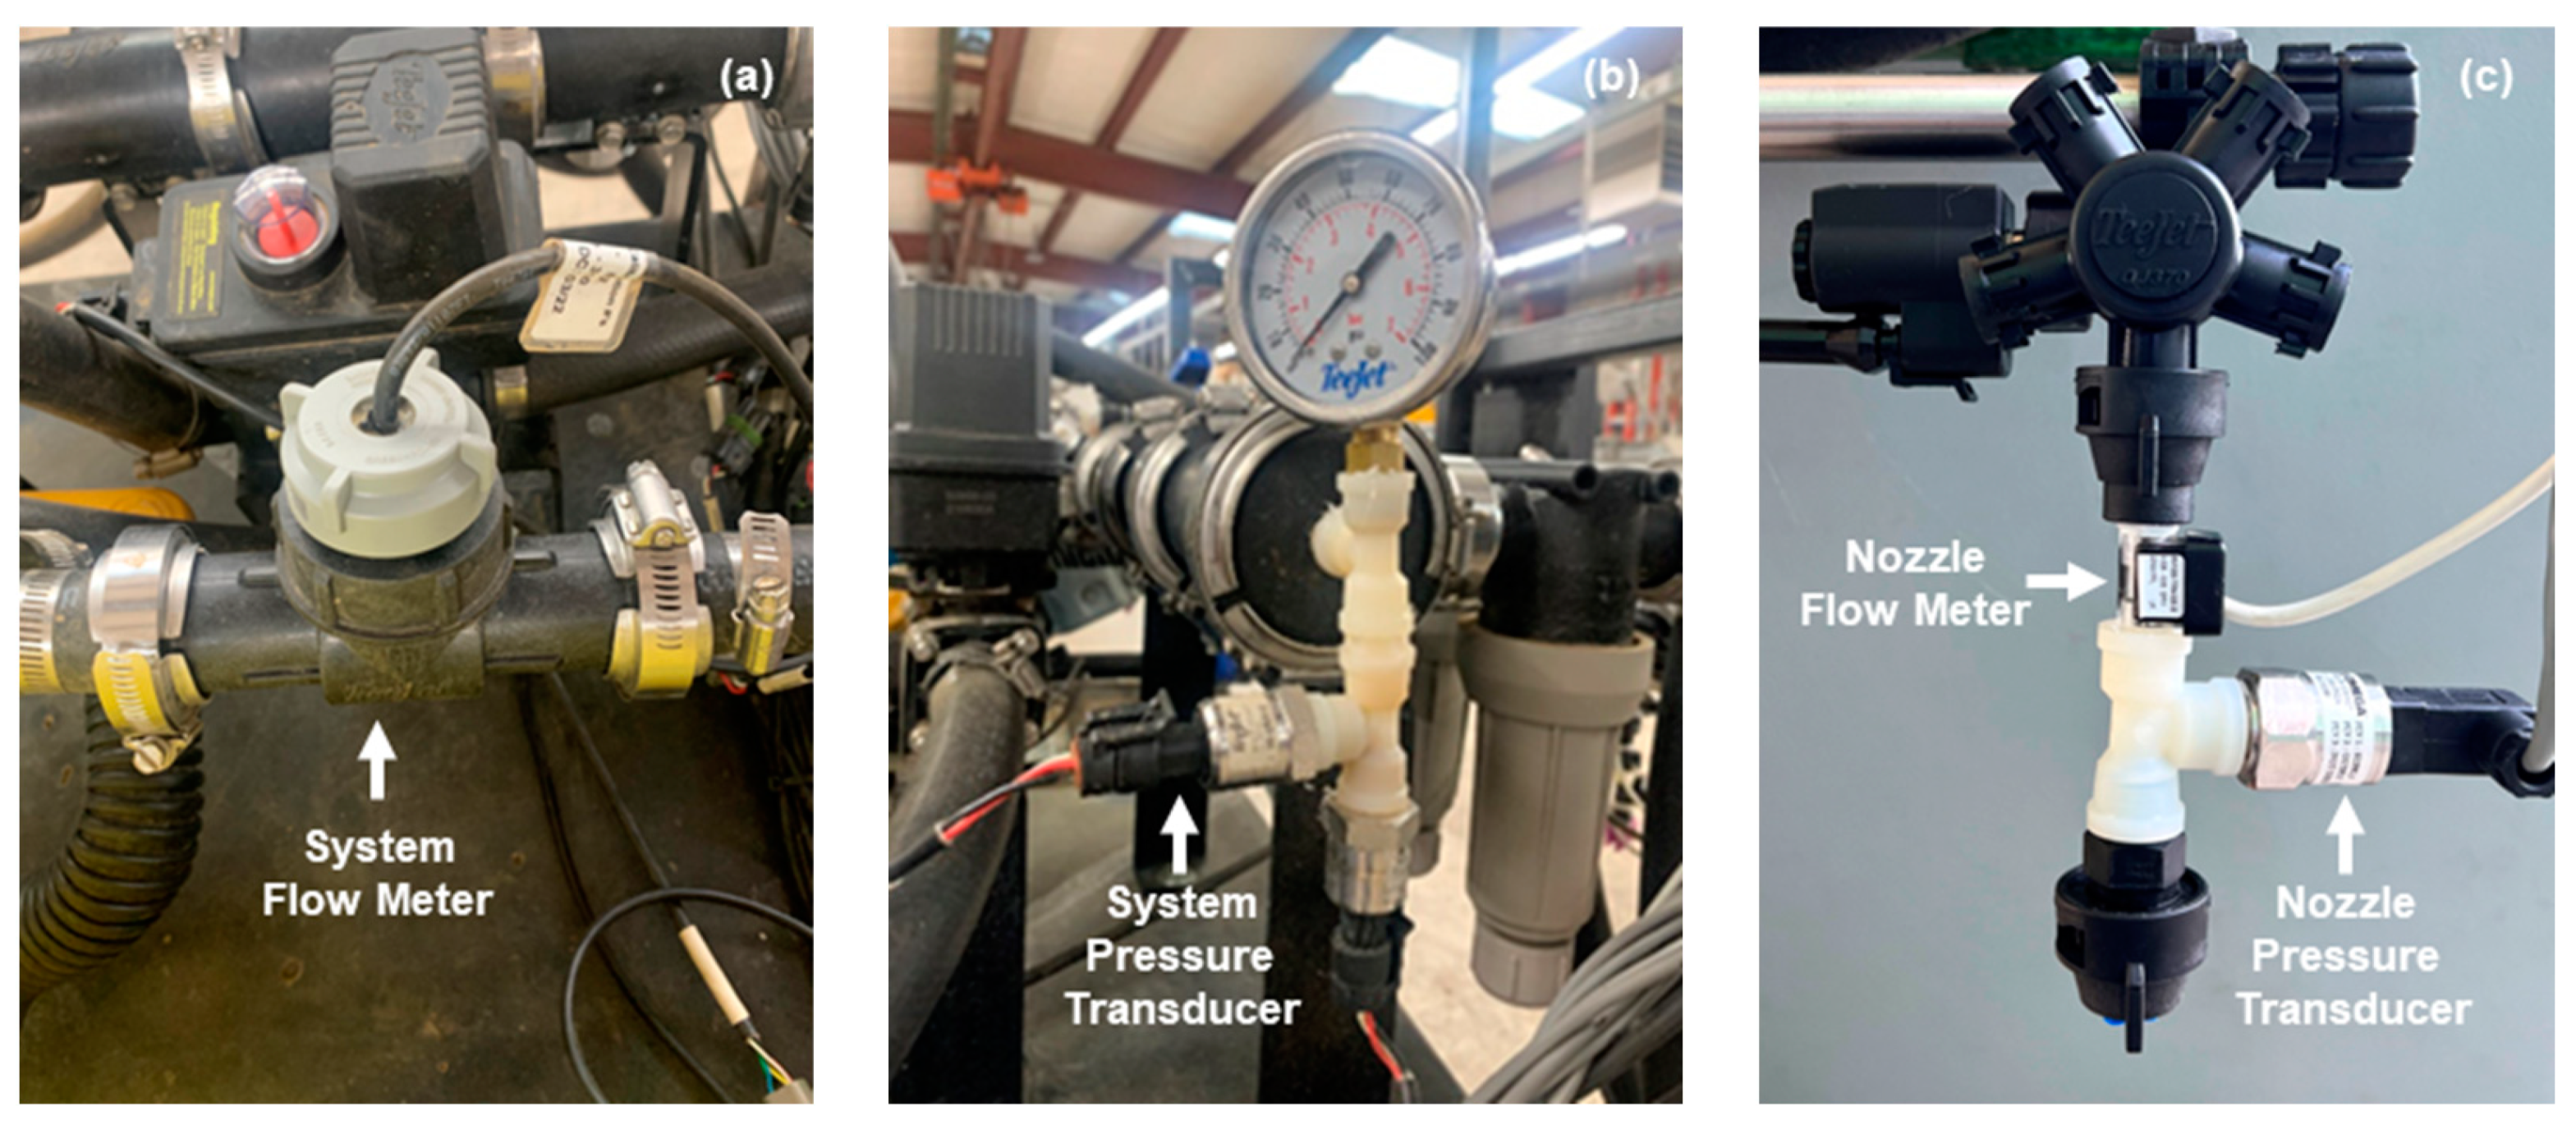
2.2. Instrumentation and Data Acquisition

To measure the real-time flow and pressure during testing, a compact turbine flow meter (Model BV2000TRN050B) and a pressure transducer (PX119-100AI) [Omega Engineering Inc., Norwalk, CT, USA] were installed on the selected nozzles (N2, N4, N7, N10, and N12) on each boom section (LB, CB, and RB). The flow meters had an operating range of 0.98 to 2.46 L min−1, while the operating pressure range for the transducer was from 0 to 689.47 kPa. Both sensors were installed in-line between the nozzle body and the nozzle tip, as shown in Figure 2c.
An NI USB-6210 DAQ with a custom LabView program (National Instruments, Austin, TX, USA) was used to record the real-time nozzle pressure and flow rate (N2, N4, N7, N10, and N12), along with the system pressure. The recorded data were geo-tagged using an onboard GPS/GNSS receiver (Reach RS+, EMLID, Budapest, Hungary) installed on the sprayer. All the data were logged at a 10 Hz sampling frequency during testing and recorded as a *.xlsx file for further analysis.

2.3. Study Design and Data Collection

This study focused on the performance evaluation of rate control (RC) and pulse width modulated (PWM) systems in attaining different target application rates at various simulated ground speeds. The evaluation process involved separate testing for each system. When testing the rate controller, the PWM system was deliberately kept inactive (manual mode and duty cycle set to 100%), ensuring that the assessment focused solely on the performance of the rate control system. Similarly, when testing the PWM system’s performance, the rate control system was disabled (the regulating valve set to the fully open position), allowing the PWM system to control the flow rate by adjusting the duty cycle. The performance of each control system was assessed for two different types of field application scenarios: (1) single-rate site-specific (SRSS) application with the boom sections turning on/off based on a single prescribed rate and (2) variable-rate site-specific (VRSS) application with the system attaining different rates as programmed in the prescription (Rx) map. For the SRSS scenario, the experimental design consisted of a factorial arrangement of three different application rates (93.5, 116.1, and 140.3 L ha−1) and three simulated ground speeds (12.9, 16.1, and 19.3 km h−1). Each test constituted measuring the systems’ response time in attaining and stabilizing the target rate at the selected ground speed. Each treatment combination (application rate by ground speed) was replicated 3 times, with a total of 27 tests. Each test run constituted data collection for a total of a 1 min duration as follows: the sprayer boom primed and nozzles initially OFF for 15 s, nozzles ON for 30 s, and nozzles OFF for 15 s. An actual run time of 30 s was selected through preliminary testing and deemed sufficient for each control system to attain and stabilize the different target rates selected in this study.
For the VRSS tests, the study design consisted of measuring each system’s performance for rate transitions between the three selected application rates (93.5, 116.1, and 140.3 L ha−1) at three different simulated ground speeds (12.9, 16.1, and 19.3 km h−1). The selected design provided a total of six different rate transitions as follows: 93.5–116.1–140.3, 93.5–140.3–116.1, 116.1–93.5–140.3, 116.1–140.3–93.5, 140.3–93.5–116.1, and 140.3–116.1–93.5 L ha−1. Each rate transition was replicated 3 times and implemented at all 3 selected ground speeds, with a total of 18 tests. All the tests for the VR scenario were performed for a total duration of 2 min with the sprayer primed and the nozzles initially OFF for 15 s, followed by turning the nozzles ON for 90 s (30 s for each rate) and then turning the nozzles OFF for the remaining 15 s.
For both the SRSS and VRSS tests, all the experiments were performed with the sprayer static and the target application rates and simulated ground speeds implemented through the TeeJet® AEROS display/controller. Before each test, the sprayer boom was primed to a pressure of 413.7 kPa, which was determined based on the system’s ability to attain the highest application rate of 140.3 L ha−1 plus an additional 68.9 kPa. The data collection was initiated and terminated by turning the sprayer master switch ON and OFF, respectively, while the selected control system attained the target application rate or transitioned between different rates. All the nozzles used in this testing had a 110° spray angle and were selected per the manufacturer’s recommendations (TeeJet® Technologies, Glendale Heights, IL, USA). The information on the different nozzle (orifice) sizes used for both the SRSS and VRSS tests is provided in Table 1 and Table 2, respectively.

2.4. Data Analysis

The measured nozzle flow rates (L min−1) were converted into application rates (L ha−1) to enable direct comparison with the target rates. The application rate data from each boom section were analyzed to determine the amount of time taken by the respective system (RC or PWM) to attain the target application rate. Considering the relatively smaller length (0.91–1.82 m) of the sprayer boom and the negligible pressure loss across the entire boom, the data for each test run were pooled across all three boom sections for further analysis. A similar response exhibited by the boom sections is also visualized in the graphs presented in Figure 3. To compare and assess the performance between the two systems, the time required by the nozzles to attain and stabilize the target rate (±5% error) was determined for the SRSS tests. The analysis for the VRSS tests focused on determining the time required by each system to transition between the selected application rates (±5% error) and then attain and stabilize the subsequent target rate. From here forward, this time value will be referred to as the mean rate stabilization time (MRST) and the mean rate transition and stabilization time (MRTST) for the SRSS and VRSS tests, respectively. The data were analyzed using a two-way ANOVA in JMP® Pro 16.0.0 (SAS, Cary, NC, USA). A Student’s t-test procedure with a significance level of α = 0.05 was used to separate the treatment means.

3. Results and Discussion

3.1. Single-Rate Site-Specific (SRSS) Tests

The graphs in Figure 4 display the actual rate response against the target rate for both systems (for the selected target rate and speed combinations), while Table 3 presents the summary statistics for the mean time required by each control system to attain and stabilize different target rates at the various simulated ground speeds used in this study (12.9, 16.1, and 19.3 km h−1). A distinct overall trend observed from the data (Table 3 and Figure 4) was that the mean rate stabilization time (MRST) required by the PWM system (110–1350 ms) was significantly lower than that required by the RC system (1133–4033 ms). This indicates that the PWM system had a faster response in attaining the target rates compared to the RC system across all rate and speed combinations. This response lag associated with the RC system can also be observed in the graphs in Figure 4a,c and is generally expected, as the rate controller relies on a pressure change to attain the target rate, which is accomplished by a change in the position of the regulating valve [17]. The time required by the regulating valve correlates with the time required by the system to attain the target rate. In contrast, the PWM system depends on a change in the duty cycle to accomplish rate changes [21,26,27] which are relatively faster, thus explaining the lower MRST for PWM than the RC system.
Comparing the performance of the RC and PWM systems under various speed and target rate conditions further reveals distinctive trends in their mean rate stabilization times (MRSTs). A significant interaction for the MRST was observed among the control system × speed × target rate (p = 0.0089) (Table 3). For the RC system, it was observed that the MRST decreased with an increase in both the target rate and speed. Specifically, the MRST was comparable for the target rates of 93.5 and 116.1 L ha−1 at each speed; however, it was significantly lower for the target rate of 140.3 L ha−1 across all three speeds, indicating that the RC system attained and stabilized the target rate faster for the higher application rates than the lower rates. This response of the RC system is again related to the magnitude of the pressure change required to accomplish the target rate. Additionally, as mentioned earlier, the sprayer boom was primed to a pressure of 413.7 kPa during each test, and the smaller the magnitude of pressure change required, the faster it was attained by the RC system and vice versa. For the PWM system, the MRST decreased significantly with an increase in the target rate from 93.5 to 140 L ha−1 at the simulated ground speed of 12.9 km h−1. A similar trend was noticed across the speeds of 16.1 and 19.3 km h−1; however, it was not statistically valid (p > 0.05), indicating a comparable performance of the PWM system in achieving all three target rates at these simulated speeds.
The effect of speed on the MRST varied by the target rate for the RC system. For the target rate of 93.5 L ha−1, the MRST was greatest at the speed of 12.9 km h−1, whereas it was lower and comparable at speeds of 16.1 and 19.3 km h−1 (Table 3). Interestingly, the MRST was similar across all simulated ground speeds at the target rate of 116.1 L ha−1; however, it decreased significantly with an increase in speed from 12.9 to 19.3 km h−1 for the target rate of 140.3 L ha−1. This response of the RC system can also be observed clearly in Figure 4c. Interestingly, the rate and speed combination of 140.3 L ha−1 and 19.3 km h−1 also exhibited the lowest MRST among all the rate and speed combinations for the RC system. Conversely, for the PWM system, the MRST was similar for 16.1 and 19.3 km h−1 speeds for all three target rates, again indicating the quick response time of the system at these speeds. Further, the system exhibited similar MSRTs across all three speeds at a target rate of 140.3 L ha−1. The PWM system showed a similar trend to that for the RC system at a target rate of 93.5 L ha−1, where the MRST was greatest at a speed of 12.9 km h−1 and comparable at speeds of 16.1 and 19.3 km h−1 (Figure 4b). Similar to the RC system, the PWM system also exhibited the lowest MRST at the rate and speed combination of 140.3 L ha−1 and 19.3 km h−1, which can be observed in Figure 4d as well.

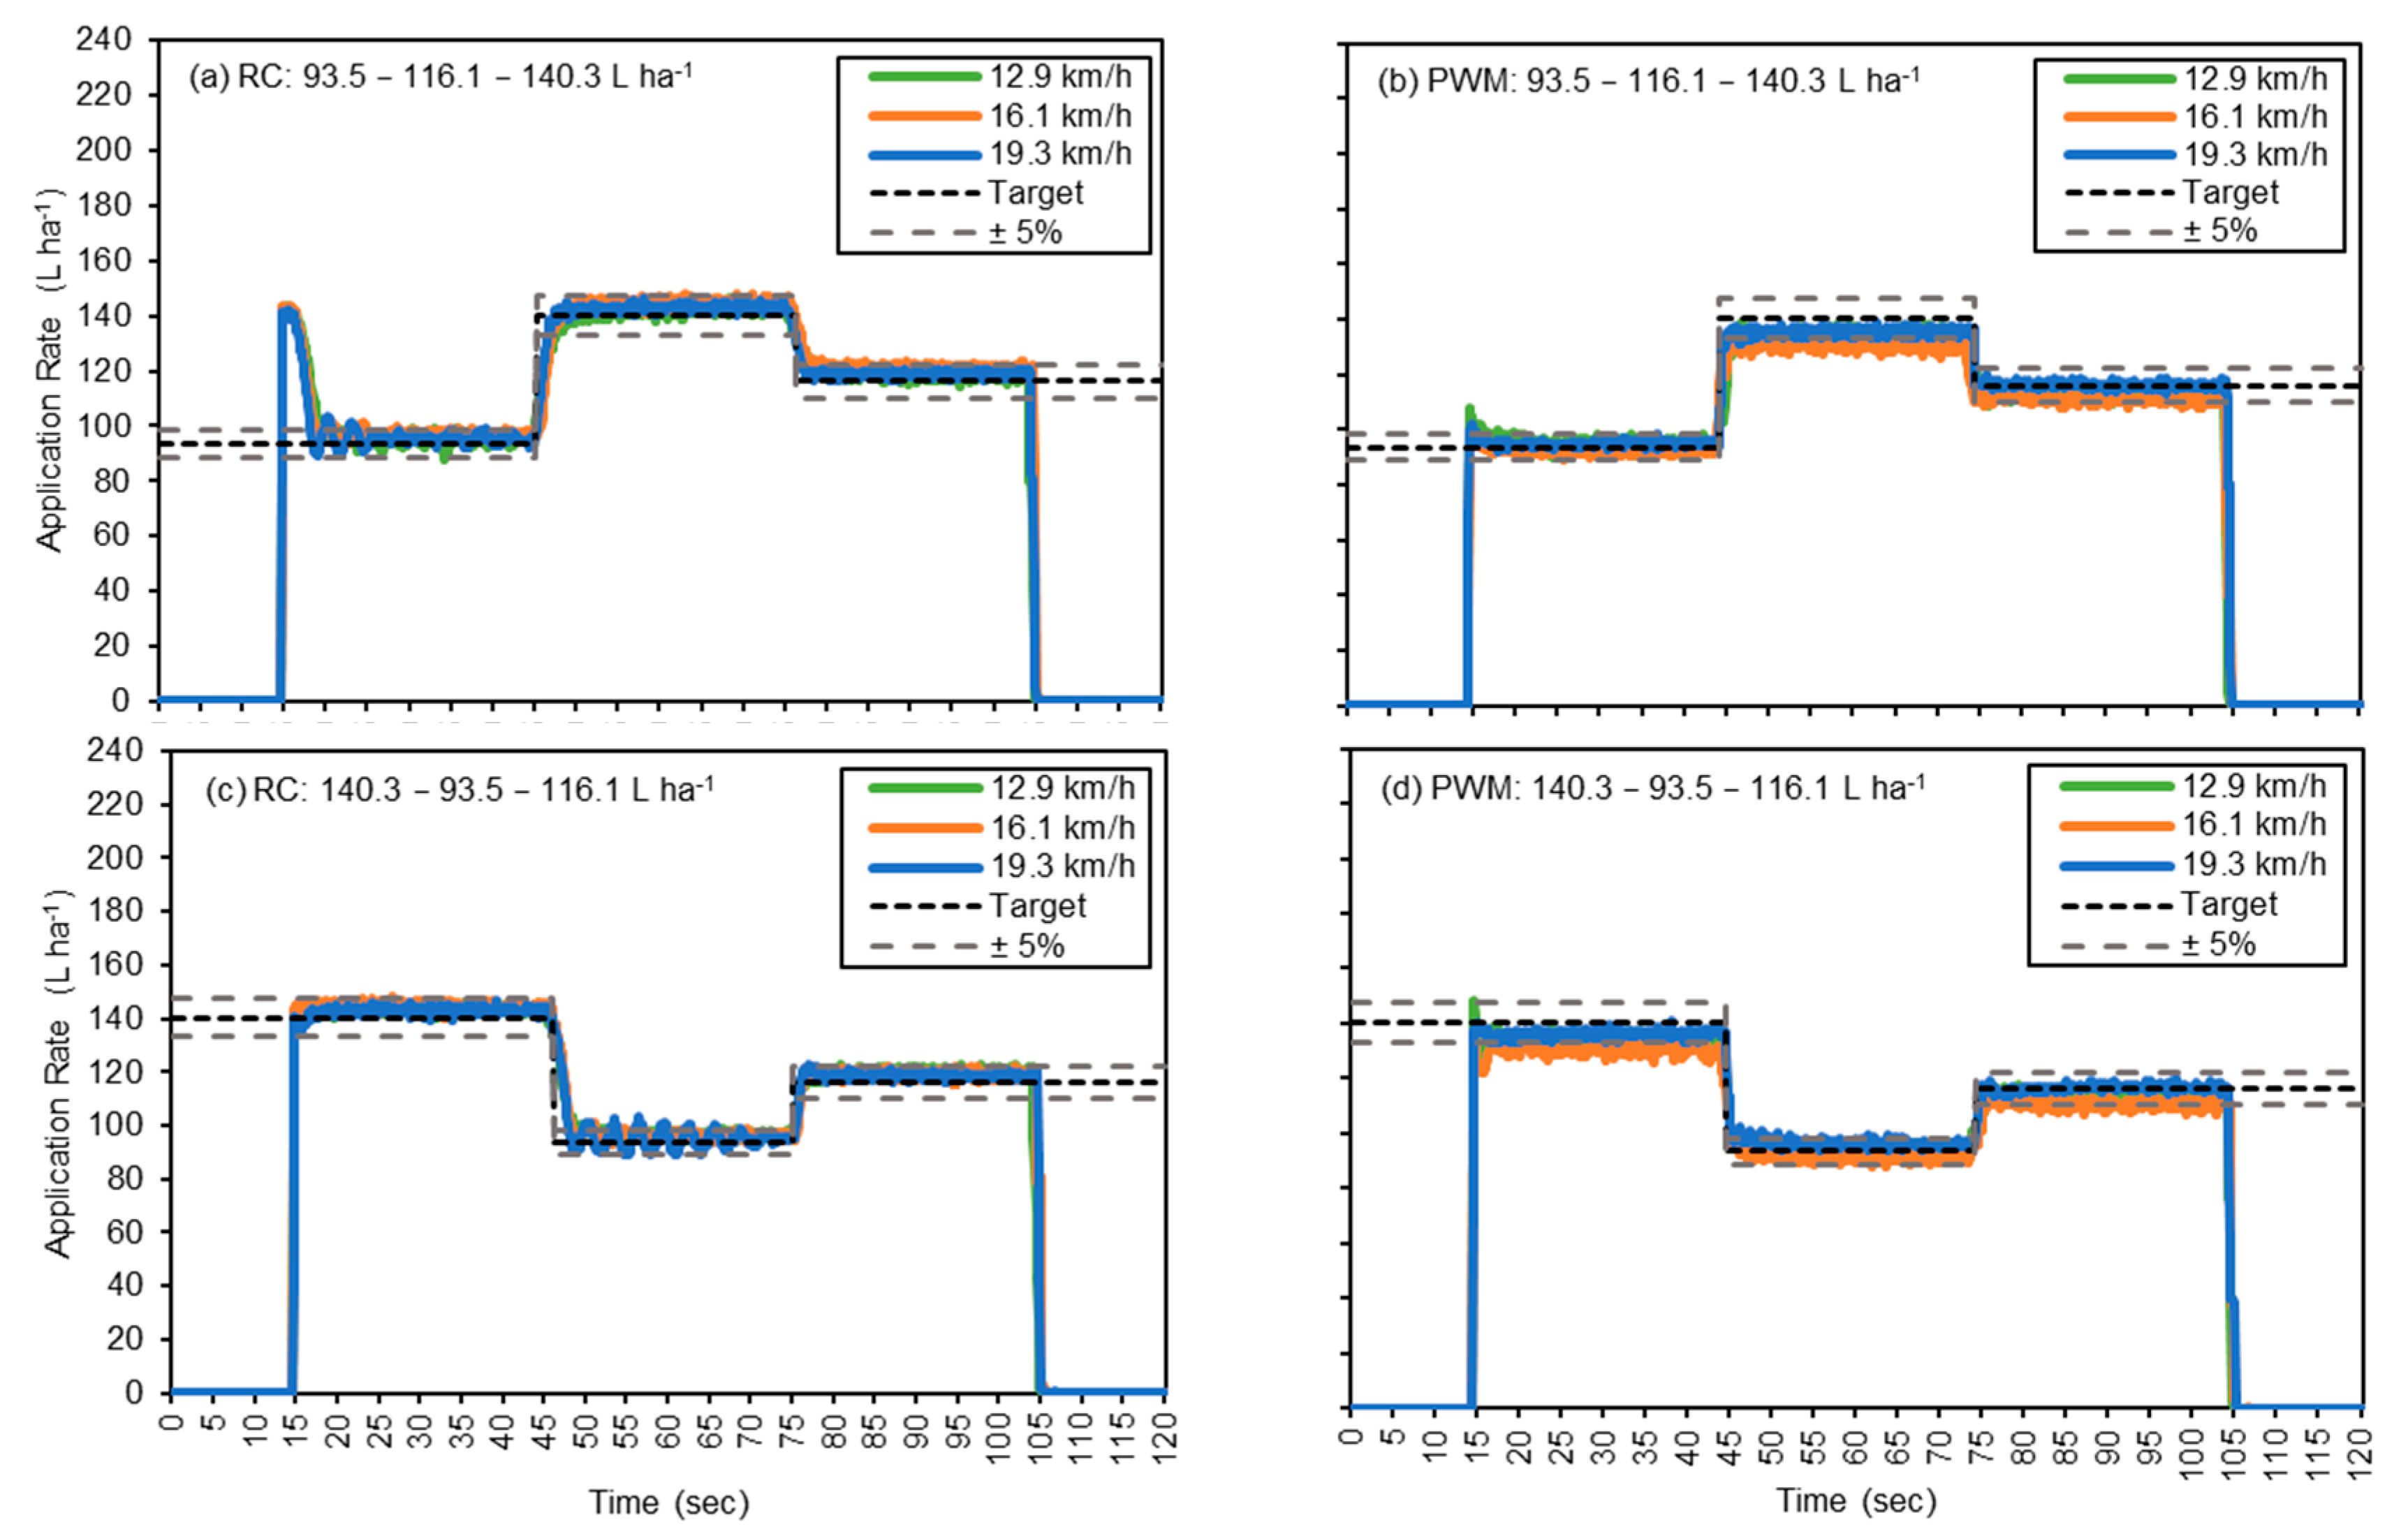
3.2. Variable-Rate Site-Specific (VRSS) Application Tests

While the SRSS testing focused on determining the time required by each control system to attain a target rate when the boom was initially turned on (transitioning from zero/off to a target rate), the goal of the VRSS testing was to assess the time required by each system to transition from one target rate to the next rate when the sprayer boom was already on. Thus, the mean rate transition and stabilization time, referred to as the MRTST in the discussion of the results of the VRSS testing, corresponds to the time required by each system to transition and stabilize the subsequent target rate. These values are presented for both the RC and PWM systems at three simulated speeds in Table 4. Additionally, Figure 5 illustrates the actual rate response for selected tests for both the RC and PWM systems. These data indicated a clear trend, where the MRTST for the PWM system (150 to 1600 ms) was considerably lower than that for the RC system (593 to 3211 ms) across all rate transitions and simulated ground speeds tested in this study. An examination of the data for the RC and PWM systems further revealed distinct trends in their performance under varying rate transitions. Similar to the SRSS testing, a significant interaction for system × speed × rate (p < 0.0001) existed for the time required to reach and stabilize the target rate during VRSS testing. For brevity in the discussion of the results for VRSS testing from here forward, the rate transitions from 140.3 to 116.1 and 116.1 to 93.5 L ha−1 are referred to as a rate decrement of 23.4 L ha−1 and from 140.3 to 93.5 L ha−1 as a rate decrement of 46.8 L ha−1. Similarly, the rate transitions from 93.5 to 116.1 and 116.1 to 140.3 L ha−1 are referred to as a rate increment of 23.4 L ha−1 and from 93.5 to 140.3 L ha−1 as a rate increment of 46.8 L ha−1.
A general trend observed for the RC system was that the MRTST was lower when the magnitude of the rate decrement was smaller, which showed that the RC system exhibited a faster response for smaller rate transitions. This can again be attributed to the characteristic response of the RC system, where the regulating valve takes less time for smaller rate transitions and vice versa. In contrast, the PWM system exhibited a consistently lower MRTST for rate decrements of 23.4 and 46.8 L ha−1 across all the simulated speeds. However, the only exception to this was the simulated speed of 12.9 km h−1, where the MRTST for a rate decrement of 23.4 L ha−1 (278 ms) was significantly lower than the MRTST for a rate decrement of 46.8 L ha−1 (833 ms). When considering the transitions for rate increments, the response time of the RC system was consistently faster for 23.4 L ha−1 across all the simulated speeds compared to 46.8 L ha−1. As stated earlier, this can be attributed to the relatively longer time required by the regulating valve for larger rate transitions. Interestingly, the PWM system also showed a similar trend to that for the RC system for a rate increment of 23.4 L ha−1 but had a quicker response time (478–189 ms) compared to the RC system (650–593 ms) at simulated speeds of 12.9 and 19.3 km h−1. Additionally, the MRTST for the PWM system for a rate increment of 46.8 L ha−1 was always greater compared to the other rate transitions at each simulated speed. For the PWM system, the flow rate is regulated by adjusting the duty cycle of the electronically actuated solenoid valves, while the overall system pressure remains constant throughout the entire spray boom [26]. In this case (a rate increment of 46.8 L ha−1), it was observed that the PWM system approached the upper limit of the system duty cycle (Table 2), which was set to 90% within the TeeJet® AEROS display/controller. Butts et al. [27] investigated the influence of the duty cycle on the flow rate and spray uniformity for a PWM system and reported that a duty cycle between 40 and 80% gives a more uniform spray pattern and a better flow rate accuracy. Similarly, in the present study, the PWM system showed an erratic response with a greater time to transition and to stabilize the rate when the duty cycle approached this upper limit.
For both the RC and PWM systems, the effect of speed varied with the magnitude of the rate transitions, resulting in varying trends for the MSTRT (Table 4). The MRTST for rate decrements (−23.4 and −46.8 L ha−1) decreased significantly with an increase in ground speed for the RC system. However, for rate increments (23.4 and 46.8 L ha−1), the MRTST was statistically similar across all three simulated speeds (Figure 5a,c). Conversely, for the PWM system, the MRST for rate increments (23.4 and 46.8 L ha−1) decreased significantly with an increase in speed. However, it was statistically similar across all three speeds for transitions with rate decrements of 23.4 and 46.8 L ha−1 (Figure 5b,d). A general trend observed throughout these application scenarios was that both systems (RC and PWM) performed better as the application speed increased. The underlying reason behind this response for the RC system can be explained by the fact that at higher target rates, the target pressure closely aligns with the prime pressure of 413.7 kPa for all treatments. Similarly, for the PWM system, this response can be attributed to the fact that at higher simulated speeds, the target pressure for PWM systems (at the selected nozzle for each VR scenario) closely aligns with the prime pressure of 413.7 kPa for all treatments (Table 2).
Overall, the RC and PWM systems revealed distinct behavior under varying simulated speeds and rate combinations in both the SRSS and VRSS testing. The results from the SRSS testing showed that the RC exhibited lower MRSTs for higher target rates compared to lower rates across all the simulated speeds. The PWM system also followed the same trend, with both systems showcasing a reduced MRST for a single target with an increase in speed and with considerable differences only evident for the RC system at the highest target rate, as shown in Figure 4c,d. At slower speeds, the RC system experiences an increase in the MRST, indicating there could be potential challenges in accurately applying single-rate (spot/selective spray) site-specific prescription maps. Both control systems demonstrated improved performance as the speed increased or at higher target rates (Table 3). Additionally, the PWM system consistently exhibited a lower stabilization time across all simulated speeds, highlighting its effectiveness in reaching the target rates swiftly.
For the VRSS testing, both systems showed a higher MRTST for larger rate transitions compared to the smaller rate transitions. Gopala Pillai et al. [28] conducted a study assessing a PWM system’s performance and observed its capability to adjust the flow rates while preserving the spray pattern and droplet size. However, the authors noted its poor performance in terms of spray uniformity at higher speeds and lower duty cycles. Consistent with our findings, they observed shorter time lags for rate changes with minor adjustments, facilitating effective variable-rate herbicide application at low speeds. In the present study, the RC system exhibited a higher MRTST for rate decrements as compared to rate increments in the majority of cases across the simulated speeds. Conversely, the PWM system consistently exhibited a lower MRTST and adapted to rate decrements faster across various simulated speeds. The lower MRTST values not only signify a rapid response but also highlight the capabilities of the PWM system to rapidly adjust to varying target rates, as necessitated generally during variable-rate/site-specific applications. Its faster response time and capability to rapidly transition between different rates make the PWM system the preferred technology for agricultural sprayers to implement accurate and precise site-specific applications. Regardless of the choice between the two systems, each system must be properly set up and calibrated to minimize the influence of other operational factors on the in-field spraying performance.

4. Research Implications

When applying pesticides using a site-specific approach, it crucial to account for the distance required by the sprayer’s flow control system to stabilize and achieve the prescribed target rate accurately. Otherwise, such applications will most likely result in the over- or under-application of pesticides within different areas/zones. While the data collected in this study represent static testing with simulated ground speed conditions, the response times can be used to compute the minimum distance required by sprayers equipped with the RC and PWM systems to conduct site-specific pesticide applications, assuming no influence of other operational factors. Thus, based on the MRST and MRTST recorded during the SRSS and VRSS testing, respectively, Table 5 presents these data for different target rates, assuming spraying operations occur at a constant ground speed of 12.9 km h−1 for both systems. It should be noted that these distances are expected to increase with ground speed and vice versa. Additionally, they can be affected by other operational parameters.
From Table 5, it can be observed that for a sprayer equipped with the RC system, the minimum distance required to attain a target rate between 93.5 and 140.3 L ha−1 is 12.2 to 14.4 m for single-rate (On/Off) site-specific application scenarios. This means that the spray zones within the prescription map cannot be smaller than these areas and the length of the spray zones (assuming the width of these areas is at least equal or greater than the sprayer boom length) needs to be at least three to four times greater for the sprayer to effectively attain and apply the prescribed rate. A prescription map with spray areas smaller than these distances will result in large areas of misapplication within a field. Further, an increase in ground speed and/or larger rate transitions will increase these application errors, resulting in greater potential for misapplications. In contrast, the PWM system requires a significantly shorter distance (1.1 to 4.8 m for SRSS applications and 0.8 to 3.0 m for VRSS applications), which implies that the length of the spray areas could be as small as 0.8 to 1.1 m (a width equal or greater than the boom length) in fields where site-specific pesticide applications are implemented using a sprayer equipped with a PWM system. This again emphasizes the ability of the PWM system to swiftly transition and accurately apply the prescribed rates, even within small areas/zones. It should be noted that these application scenarios assume that both sprayer systems are set up properly and that other operational factors such as the valve response time or look-ahead time have been selected accordingly to optimize the application performance of each system. Overall, the findings of this study suggest that the PWM system is advantageous in real-world scenarios by enabling more precise site-specific pesticide applications compared to sprayers equipped with RC systems, particularly in situations where multiple rates need to be applied in smaller areas within a field. Additionally, the lower MRST and MRTST values also indicate the PWM system’s ability to respond quickly to rate changes induced by other factors such as the field topography and variations in ground speed.

5. Conclusions and Future Work

This study evaluated and compared the performance of a traditional flow-based rate controller (RC) and a pulse width modulation (PWM) system on an agricultural sprayer in terms of their response time and rate transition capabilities for site-specific pesticide applications. The following conclusions can be drawn from the results obtained in this study:
  • Single-Rate Site-Specific Applications:
  • The PWM system demonstrated a consistently lower mean rate stabilization time in achieving the target rates across all simulated speeds compared to the RC system.
  • The RC system exhibited an increased mean rate stabilization time at lower simulated ground speeds.
  • Both systems showed improved performance (reduced rate stabilization time) at higher target rates or increased simulated ground speeds.
  • Variable-Rate Site-Specific Applications:
  • The PWM system demonstrated a lower mean rate transition time across both rate increments and decrements across all simulated speeds.
  • The RC system exhibited a higher rate transition time for rate decrements and a lower transition time for rate increments.
  • Both systems demonstrated improved performance (reduced rate transition and stabilization times) at increased simulated ground speeds.
While this study focused solely on one component of site-specific applications, i.e., the response time of the control system, several other factors can impact the accuracy and efficiency of these systems during site-specific pesticide applications. One of the main limitations of this study was that all the data were collected during simulated application scenarios (different rate and ground speed combinations) with the sprayer in static mode. It is speculated that various operational and field parameters can influence the performance of both systems if similar treatments are implemented during actual site-specific pesticide applications. Therefore, a thorough investigation to evaluate the effect of these factors can quantify the performance of these systems better and inform the best management practices for effectively utilizing these spray technologies on modern application equipment. Future research also needs to evaluate the impact of ground speed variations and the look-ahead time on the performance of RC and PWM systems in actual field applications. Variations in ground speed could influence the control system’s response time, thus warranting a closer examination to understand their implications for application rate errors. Additionally, exploring how the system’s look-ahead time or ability to anticipate changes in operating conditions affects the system performance would provide valuable insights into enhancing its operational efficiency and effectiveness. Conducting field trials across diverse agricultural settings, such as varying lengths of spray zones and ranges of target rates, can provide insights into the functionality and performance of these systems in real-world application conditions.

Author Contributions

Conceptualization, R.M. and S.V.; methodology, R.M. and S.V.; investigation, S.V. and R.M.; writing—original draft preparation, R.M. and S.V.; writing—review and editing, R.M., S.V., G.R. and W.P.; visualization, S.V. and R.M.; supervision, S.V.; funding acquisition, S.V. All authors have read and agreed to the published version of the manuscript.

Funding

This research was funded by the Georgia Peanut Commission (Grant# UGA-38-21/22) and the National Peanut Board (Grant# GA-214, 606).

Data Availability Statement

Data is contained within the article.

Acknowledgments

The authors would like to acknowledge TeeJet Technologies for its assistance with the sprayer control systems used in this study. Also, thanks to Brian Mathis for assisting with the selection of different nozzles and spray parameters for the testing.

Conflicts of Interest

The authors declare no conflicts of interest.

References

  1. FAO. Pesticides Use and Trade—1990–2022; FAOSTAT Analytical Briefs, No. 89; FAO: Rome, Italy, 2024. [Google Scholar] [CrossRef]
  2. Swanton, C.J.; Shrestha, A.; Chandler, K.; Deen, W. An Economic Assessment of Weed Control Strategies in No-Till Glyphosate-Resistant Soybean (Glycine Max). Weed Technol. 2000, 14, 755–763. [Google Scholar] [CrossRef]
  3. Luck, J.D.; Zandonadi, R.S.; Luck, B.D.; Shearer, S.A. Reducing Pesticide Over-Application with Map-Based Automatic Boom Section Control on Agricultural Sprayers. Trans. ASABE 2010, 53, 685–690. [Google Scholar] [CrossRef]
  4. Sharda, A.; Fulton, J.P.; McDonald, T.P.; Zech, W.C.; Darr, M.J.; Brodbeck, C.J. Real-Time Pressure and Flow Dynamics Due to Boom Section and Individual Nozzle Control on Agricultural Sprayers. Trans. ASABE 2010, 53, 1363–1371. [Google Scholar] [CrossRef]
  5. Fabula, J.; Sharda, A.; Kang, Q.; Flippo, D. Nozzle Flow Rate, Pressure Drop, and Response Time of Pulse Width Modulation (PWM) Nozzle Control Systems. Trans. ASABE 2021, 64, 1519–1532. [Google Scholar] [CrossRef]
  6. Reyes, J.F.; Esquivel, W.; Cifuentes, D.; Ortega, R. Field Testing of an Automatic Control System for Variable Rate Fertilizer Application. Comput. Electron. Agric. 2015, 113, 260–265. [Google Scholar] [CrossRef]
  7. Yang, C.; Everitt, J.H.; Bradford, J.M. Comparisons of Uniform and Variable Rate Nitrogen and Phosphorus Fertilizer Applications for Grain Sorghum. Trans. ASAE 2001, 44, 201–209. [Google Scholar] [CrossRef]
  8. Langley, R.L.; Mort, S.A. Human Exposures to Pesticides in the United States. J. Agromed. 2012, 17, 300–315. [Google Scholar] [CrossRef]
  9. Bora, G.C.; Schrock, M.D.; Oard, D.L.; Grimm, J. Performance of a Pulse Width Modulated (PWM) Single to Multifold Outlet System for Variable-rate Anhydrous Ammonia Application. Trans. ASABE 2011, 54, 397–402. [Google Scholar] [CrossRef]
  10. Huang, H.; Deng, J.; Lan, Y.; Yang, A.; Deng, X.; Wen, S.; Zhang, H.; Zhang, Y. Accurate Weed Mapping and Prescription Map Generation Based on Fully Convolutional Networks Using UAV Imagery. Sensors 2018, 18, 3299. [Google Scholar] [CrossRef]
  11. Jiang, H.; Zhang, L.; Shi, W. Effects of Operating Parameters for Dynamic PWM Variable Spray System on Spray Distribution Uniformity. IFAC-PapersOnLine 2016, 49, 216–220. [Google Scholar] [CrossRef]
  12. Fabula, J.V.; Sharda, A. Field Evaluation of Turn Compensation Feature of Pulse Width Modulation (PWM) Equipped Agricultural Sprayer. In Proceedings of the 2021 ASABE Annual International Virtual Meeting, Online, 12–16 July 2021; American Society of Agricultural and Biological Engineers: St. Joseph, MI, USA, 2021. [Google Scholar]
  13. Luck, J.D.; Zandonadi, R.S.; Luck, B.D.; Shearer, S.A. Effects of Field Shape and Size on Application Errors Using Manual and Automatic Boom Section Control on a Self-Propelled Agricultural Sprayer. In Proceedings of the 2010 ASABE Annual International Meeting, Pittsburgh, PA, USA, 20–23 June 2010; American Society of Agricultural and Biological Engineers: St. Joseph, MI, USA, 2010. [Google Scholar]
  14. Sharda, A.; Fulton, J.P.; McDonald, T.P.; Brodbeck, C.J. Real-Time Nozzle Flow Uniformity When Using Automatic Section Control on Agricultural Sprayers. Comput. Electron. Agric. 2011, 79, 169–179. [Google Scholar] [CrossRef]
  15. Villette, S.; Maillot, T.; Guillemin, J.P.; Douzals, J.P. Simulation-Aided Study of Herbicide Patch Spraying: Influence of Spraying Features and Weed Spatial Distributions. Comput. Electron. Agric. 2021, 182, 105981. [Google Scholar] [CrossRef]
  16. Grella, M.; Gioelli, F.; Marucco, P.; Zwertvaegher, I.; Mozzanini, E.; Mylonas, N.; Nuyttens, D.; Balsari, P. Field Assessment of a Pulse Width Modulation (PWM) Spray System Applying Different Spray Volumes: Duty Cycle and Forward Speed Effects on Vines Spray Coverage. Precis. Agric. 2021, 23, 219–252. [Google Scholar] [CrossRef]
  17. Sharda, A.; Luck, J.D.; Fulton, J.P.; McDonald, T.P.; Shearer, S.A. Field Application Uniformity and Accuracy of Two Rate Control Systems with Automatic Section Capabilities on Agricultural Sprayers. Precis. Agric. 2013, 14, 307–322. [Google Scholar] [CrossRef]
  18. Ayers, P.D.; Rogowski, S.M.; Kimble, B.L. An Investigation of Factors Affecting Sprayer Control System Performance. Appl. Eng. Agric. 1990, 6, 701–706. [Google Scholar] [CrossRef]
  19. Luck, J.D.; Sharda, A.; Pitla, S.K.; Fulton, J.P.; Shearer, S.A. A Case Study Concerning the Effects of Controller Response and Turning Movements on Application Rate Uniformity with a Self-Propelled Sprayer. Trans. ASABE 2011, 54, 423–431. [Google Scholar] [CrossRef]
  20. Butts, T.R.; Butts, L.E.; Luck, J.D.; Fritz, B.K.; Hoffmann, W.C.; Kruger, G.R. Droplet Size and Nozzle Tip Pressure from a Pulse-Width Modulation Sprayer. Biosyst. Eng. 2019, 178, 52–69. [Google Scholar] [CrossRef]
  21. Mangus, D.L.; Sharda, A.; Engelhardt, A.; Flippo, D.; Strasser, R.; Luck, J.D.; Griffin, T. Analyzing the Nozzle Spray Fan Pattern of an Agricultural Sprayer Using Pulse Width Modulation Technology to Generate an On-Ground Coverage Map. Trans. ASABE 2017, 60, 315–325. [Google Scholar] [CrossRef]
  22. Fulton, J.P.; Shearer, S.A.; Chabra, G.; Higgins, S.F. Performance Assessment and Model Development of a Variable–Rate, Spinner–Disc Fertilizer Applicator. Trans. ASAE 2001, 44, 1071–1081. [Google Scholar] [CrossRef]
  23. Bandyopadhyay, D.; Bhavsar, D.; Pandey, K.; Gupta, S.; Roy, A. Red Edge Index as an Indicator of Vegetation Growth and Vigor Using Hyperspectral Remote Sensing Data. Proc. Natl. Acad. Sci. India Sect. A Phys. Sci. 2017, 87, 879–888. [Google Scholar] [CrossRef]
  24. Castaldi, F.; Pelosi, F.; Pascucci, S.; Casa, R. Assessing the Potential of Images from Unmanned Aerial Vehicles (UAV) to Support Herbicide Patch Spraying in Maize. Precis. Agric. 2017, 18, 76–94. [Google Scholar] [CrossRef]
  25. See and Spray. In John Deere’s See & Spray Ultimate Cuts Chemical Use by Targeting Weeds with Precision Spraying; John Deere: Moline, IL, USA, 2024; Available online: https://www.deere.com/en/sprayers/see-spray-ultimate/ (accessed on 14 September 2023).
  26. Virk, S.; Meena, R. Pulse Width Modulation Technology for Agricultural Sprayers; Circular 1277; University of Georgia Cooperative Extension: Tifton, GA, USA, 2022; Available online: https://extension.uga.edu/publications/detail.html?number=C1277&title=pulse-width-modulation-technology-for-agricultural-sprayers (accessed on 14 September 2023).
  27. Butts, T.R.; Luck, J.D.; Fritz, B.K.; Hoffmann, W.C.; Kruger, G.R. Evaluation of Spray Pattern Uniformity Using Three Unique Analyses as Impacted by Nozzle, Pressure, and Pulse-width Modulation Duty Cycle. Pest Manag. Sci. 2019, 75, 1875–1886. [Google Scholar] [CrossRef] [PubMed]
  28. GopalaPillai, S.; Tian, L.; Zheng, J. Evaluation of a Flow Control System for Site-Specific Herbicide Applications. Trans. ASAE 1999, 42, 863–870. [Google Scholar] [CrossRef]
Figure 1. The sprayer setup and different components used for spray performance testing. LB, CB, and RB indicate left, center, and right boom sections, respectively, whereas nozzles are numbered from N1 to N13, starting from the left of the sprayer boom.
Agriengineering 06 00189 g001
Figure 2. This figure illustrates the placement of the flow meter and pressure transducers on the sprayer system. (a) A flow meter was installed in-line to measure the boom flow rate. (b) A pressure transducer was installed on the manifold to measure boom pressure. (c) A high-resolution flow meter and pressure transducer were installed at the selected nozzles to measure flow rate and pressure, respectively.
Agriengineering 06 00189 g002
Figure 3. Graphs showing the actual rate response for all three boom sections versus the target application rate for (a) single-rate site-specific (SRSS) and (b) variable-rate site-specific (VRSS) tests.
Agriengineering 06 00189 g003
Figure 4. Graphical representation of the actual rate response (dark solid lines) versus the target application rates (black dashed line) of 93.5 and 140.3 L ha−1 at different simulated speeds for the rate controller (RC) [(a,c), respectively] and pulse width modulation (PWM) [(b,d), respectively] systems during single-rate site-specific (SRSS) testing.
Agriengineering 06 00189 g004
Figure 5. Graphical representation of the rate response for the rate transitions of 93.5–116.1–140.3, and 140.3–93.5–116.1 L ha−1 at different simulated speeds for the rate controller (RC) [(a,c), respectively] and pulse width modulation (PWM) [(b,d), respectively] systems during variable-rate site-specific (VRSS) testing.
Agriengineering 06 00189 g005
Table 1. Information on different nozzle types used and system pressure and duty cycle attained by the flow control systems at different rate and speed combinations during SRSS testing.
Control SystemSpeed
(km h−1)
Target Rate
(L ha−1)
NozzlePressure
(kPa)
Duty Cycle
(%)
RC12.993.5XRC110025255.1-
116.1XRC11003262.1-
140.3XRC11004234.4-
16.193.5XRC11003262.1-
116.1XRC11004248.2-
140.3XRC11005234.4-
19.393.5XRC11004227.5-
116.1XRC11005227.5-
140.3XRC11006262.1-
PWM12.993.5XRC11004268.855
116.1XRC11004268.870
140.3XRC11004268.884
16.193.5XRC11005282.756
116.1XRC11005282.772
140.3XRC11005282.786
19.393.5APTJ11008365.458
116.1APTJ11008365.475
140.3APTJ11008365.485
Table 2. Information on different nozzle types, pressures, and duty cycles for the rate controller (RC) and pulse width modulation (PWM) systems during VRSS testing.
Control SystemSpeed
(km h−1)
Target Rate
(L ha−1)
NozzlePressure
(kPa)
Duty Cycle
(%)
RC12.993.5XRC11003172.4-
116.1XRC11003262.1-
140.3XRC11003365.4-
16.193.5XRC11004158.6-
116.1XRC11004248.2-
140.3XRC11004351.6-
19.393.5XRC11005151.6-
116.1XRC11005234.4-
140.3XRC11005337.8-
PWM12.993.5XRC11004268.955
116.1XRC11004268.970
140.3XRC11004268.984
16.193.5XRC11005282.756
116.1XRC11005282.772
140.3XRC11005282.786
19.393.5APTJ11008365.458
116.1APTJ11008365.475
140.3APTJ11008365.485
Table 3. Descriptive statistics for the time required by the RC and PWM systems to attain and stabilize the target application rates at different simulated speeds during SRSS testing.
Control SystemSpeed
(km h−1)
Target Rate
(L ha−1)
Time (ms)
Mean[a]Min.Max.Std. Dev.
RC12.993.54033 a4000410058
116.13567 ab3500360058
140.33400 b31003800361
16.193.53300 b31003400173
116.13333 b28004400924
140.32233 c2200230058
19.393.52967 b29003100115
116.12967 b28003200208
140.31133 de30024001115
PWM12.993.51350 d1300140050
116.1667 ef5001000289
140.3300 f200400100
16.193.5467 f40050058
116.1333 f30040058
140.3200 f2002000
19.393.5200 f2002000
116.1167 f10020058
140.3100 f1001000
[a] Means with the same letter are not significantly different from each other (p > 0.05).
Table 4. Descriptive statistics for the time required by the RC and PWM systems to transition from the initial rate and stabilize the subsequent target rate at different simulated speeds during VRSS testing.
Control SystemSpeed
(km h−1)
Rate Transition
(L ha−1)
Time (ms)
Mean[a]MinMaxStd. Dev.
RC12.9−46.83211 a26004800694
−23.41117 fgk6001900405
23.4650 jk3001000192
46.82600 b22003000352
16.1−46.81678 c14001800130
−23.4967 hi5002500535
23.4661 jk5001000124
46.81433 cde13001600151
19.3−46.81500 cde6001800354
−23.4600 k400800133
23.4593 k400900142
46.81417 cde12001800264
PWM12.9−46.8833 ij2001300387
−23.4278 l100700173
23.4478 k1001400366
46.81367 def12001500121
16.1−46.8244 l100600181
−23.4247 l100700187
23.41227 efg8001700322
46.81600 cd15001700100
19.3−46.8150 l10020058
−23.4222 l100600126
23.4189 l10040096
46.81022 ghi6001700421
[a] Means with the same letter are not significantly different from each other (p > 0.05).
Table 5. Information on the minimum distance required to attain different target rates and rate transitions based on the measured times for the RC and PWM systems during SRSS and VRSS testing.
TestSystemTarget
(L ha−1)
Speed
(km h−1)
Mean Time
(ms)
Distance
(m)
SRSSRC93.512.9403314.4
116.112.9356712.8
140.312.9340012.2
PWM93.512.913504.8
116.112.96672.4
140.312.93001.1
VRSSRC23.412.914565.2
46.812.9321111.5
PWM23.412.92220.8
46.812.98333.0
Disclaimer/Publisher’s Note: The statements, opinions and data contained in all publications are solely those of the individual author(s) and contributor(s) and not of MDPI and/or the editor(s). MDPI and/or the editor(s) disclaim responsibility for any injury to people or property resulting from any ideas, methods, instructions or products referred to in the content.

