Article

RGB Composition Obtained by a UAV in the Monitoring of Sugarcane Row Gaps Using the Biophysical Index

by
Camila G. B. de Melo
1,
Mário M. Rolim
1,*,
Roberta Q. Cavalcanti
1,
Marcos V. da Silva
2,
Ana Lúcia B. Candeias
3,
Pabrício M. O. Lopes
1,
Pedro F. S. Ortiz
1 and
Renato P. de Lima
4
1
Department of Agricultural Engineering, Federal Rural University of Pernambuco, Recife 52171900, PE, Brazil
2
Department of Agricultural Engineering, Center for Agricultural and Environmental Sciences (CCAA), Federal University of Maranhão, BR-222, Chapadinha 65500000, MA, Brazil
3
Department of Cartographic Engineering, Federal University of Pernambuco, Recife 50740530, PE, Brazil
4
Agricultural Engineering College, Universidade Estadual de Campinas (UNICAMP), Campinas 13083875, SP, Brazil
*
Author to whom correspondence should be addressed.
AgriEngineering 2025, 7(1), 17; https://doi.org/10.3390/agriengineering7010017
Submission received: 14 October 2024 / Revised: 30 December 2024 / Accepted: 6 January 2025 / Published: 15 January 2025

Abstract

:
Sugarcane crops have a long cycle with successive harvests before re-planting, and row gaps are one of the main problems associated with the yield. The objective of this study was to establish an alternative methodology for measuring the planting and regrowth of sugarcane rows using UAV (Unmanned Aerial Vehicle) images and to compare it with manual measurements. This study was conducted in a 1 ha experimental area under mechanized harvesting. The reference methodology consists of measuring the continuous distances without regrowth between two plants along a planting row, considering distances greater than 0.50 m as gaps and the following gaps classes: >0.5–1.0 m, >1.0–1.5 m, >1.5–2.0 m, >2.0–3.5 m, and >3.5 m. Images were collected from a UAV equipped with a 12-megapixel RGB camera. The number of regrowth gaps measured through imaging for the class of gaps with a length between 0.5 and 1.0 m was eight times higher than field measurement. In the class of gaps with a length between 1.0 and 1.5 m, the result is the opposite, as the field measurement was approximately three times higher than the UAV measurement, with a significant difference in both classes. In the other length classes analyzed, the number of gaps did not show significant differences. Our results suggest that regrowth gaps can be quickly estimated with the proposed methodology for gaps greater than 1.5 m. For gaps smaller than <1 m, the methodology using a UAV is not accurate.

1. Introduction

Sugarcane is among the main crops produced in Brazil, originating products such as sugar, ethanol, and electricity from the full use of the plant [1,2]. The estimated production for the 2024/2025 season is 652.9 million tons of sugarcane, with 8.63 million hectares for harvest [3]. One of the stages that directly influences sugarcane production capacity is harvesting, which has been switched from manual to mechanized [4]. Mechanized sugarcane harvesting has promoted numerous benefits for the production system, optimizing production processes and reducing environmental impacts, for instance by reducing burning [5]. However, a decrease in sugarcane production capacity has been observed since 2008, a period in which there has been an intensification of mechanization, especially in harvesting [6]. This decline in production results from a reduction in the quality of the harvested material, which contributes to yield losses across the affected area with each harvest [7,8,9,10]. A direct consequence of these issues is the emergence of regrowth gaps along the sugarcane cultivation lines, leading to sprouting failures and productivity losses that can exceed 25% [11,12].
The traditional method for gap measurement is based on [13], in which gaps are measured manually in the field along each planting row by counting empty spaces greater than 0.5 m in the planting line. However, this methodology is considered very laborious and hence difficult to apply in large areas of cultivation. Faced with this problem, alternative methodologies such as the use of aerial images obtained by an Unmanned Aerial Vehicle (UAV) applied to identify and measure gaps in sugarcane regrowth areas have made it possible to characterize large areas efficiently and accurately, besides assisting in decision-making regarding the renewal of sugarcane fields to ensure continuous profitability [14,15,16,17].
For instance, Barbosa Júnior et al. [18] concluded that the traditional method of measuring planting gaps in their study area involved evaluating a 30 m segment for every 0.7 hectares, which represented only 0.45% of the total row length. This limited sampling was considered insufficient for accurately mapping the gap percentage and assessing crop quality. In contrast, Molin et al. [19] utilized imaging, sensors, and a GNSS to detect planting faults in sugarcane. Their controlled and field tests demonstrated high accuracy, with errors of only 0.02–0.03 m compared to manual measurements. The method produced fault density maps, which proved useful for targeted crop management and enhancing productivity. Additionally, Oliveira et al. [20] found that gap lengths identified using RTK and non-RTK UAV imagery were similar, with precision and accuracy differences of approximately 1% for both systems. However, RTK was notably more efficient, providing stakeholders with reliable guidelines for precise gap mapping, which facilitates informed decision-making in site-specific management.
One effective way to analyze the spatial characteristics of elements in an aerial image is through classification methodologies. These involve assigning specific meanings to image pixels based on their numerical properties and spectral characteristics, essentially using the spectral signature to identify and categorize land use types [21,22].
This type of analysis is made possible by photosynthetically active radiation (PAR) in plants [23]. Since plants absorb a portion of the incident electromagnetic radiation to perform photosynthesis; this interaction can be detected in the visible spectrum [24,25]. Consequently, the visible region (RGB images) and the near-infrared region have become essential tools for studies focused on terrestrial vegetation imaging [26,27,28].
UAVs have emerged as invaluable tools for mapping sugarcane cultivation areas. Equipped with cameras capable of capturing light spectrum bands, UAVs can monitor plant behavior under different spectral interactions. These cameras can collect data in red (R), green (G), or blue (B) bands, enabling the modeling of biophysical indices that enhance decision-making accuracy across scales through the vast amount of data captured and processed.
Given the need for faster and more efficient assessments of sugarcane field conditions—particularly regarding planting and regrowth gaps, which are critical indicators for field renewal decisions—this study aimed to propose an alternative methodology for measuring planting and regrowth gaps in sugarcane crops using UAV images.

2. Materials and Methods

2.1. Study Area

This study was carried out in an area under sugarcane cultivation located at São José Mill in the municipality of Igarassu, PE, Brazil. The soil in the study area was classified as Ultisol [29] and has good characteristics for agricultural development, but low natural fertility (Figure 1). According to Köppen’s climate classification, the climate of the region is As’, hot and humid tropical, with an average annual temperature of 24.9 °C and an average annual rainfall of 1689 mm [30,31].
An experiment was carried out in a 1 ha experimental area under sugarcane cultivation, in a mechanized harvesting system, with the objective of evaluating the behavior of gaps after planting and after the first harvest (regrowth) of the crop. Prior to planting, the sugarcane field was renewed using the conventional soil tillage system. To set up the experiment, tractors were used to transport and distribute sugarcane setts (RB92579 variety) along the furrows of the experimental area, as described in the methodology established by [32].
Sugarcane cultivation was arranged at a combined spacing of 0.90 m × 1.40 m (Figure 1), and the evaluated area had 44 double rows, totaling 88 planting rows with a length of 100 m. The experimental area analyzed was subjected to mechanized harvesting, without burning the straw. Sugarcane harvesting was performed by a conventional John Deere harvester with a capacity of about 20 tons, which cuts and cleans the crop, chopping it into segments and depositing them in a trailer. This trailer is pulled by a tractor, which is responsible for transporting the sugarcane and moves parallel to the harvester.

2.2. Manual Analysis of Planting and Regrowth Gaps

To measure row gaps (Figure 2), a tape measure was used to record the distance between plants in each row where gaps exceeded 0.50 m [13]. Manual gap measurements were conducted approximately 90 days after planting (March 2017) and 90 days after the harvest (March 2018) of the sugarcane. The average height of the sugarcane crop varied between 0.4 and 0.6 m.
The measurements included the following variables: (i) the number of gaps in each row, counted individually; (ii) the total gap length (in meters), calculated as the sum of the lengths of all gaps in each row for each evaluated planting or harvest stage. Additionally, gaps were classified into five size categories, >0.5–1.0 m, >1.0–1.5 m, >1.5–2.0 m, >2.0–3.5 m, and >3.5 m, to assess the distribution of gap sizes.
Field surveys were conducted at two stages: 90 days after initial planting (March 2017) and 90 days after the first harvest (March 2018), when the crop is considered fully established. This process followed the classical methodology for identifying and measuring gaps in sugarcane regrowth [13], where a gap is defined as the distance between two consecutive stalks along a row that exceeds 0.50 m. In total, gaps were measured across 88 planting rows, and the length of each gap was recorded for analysis.

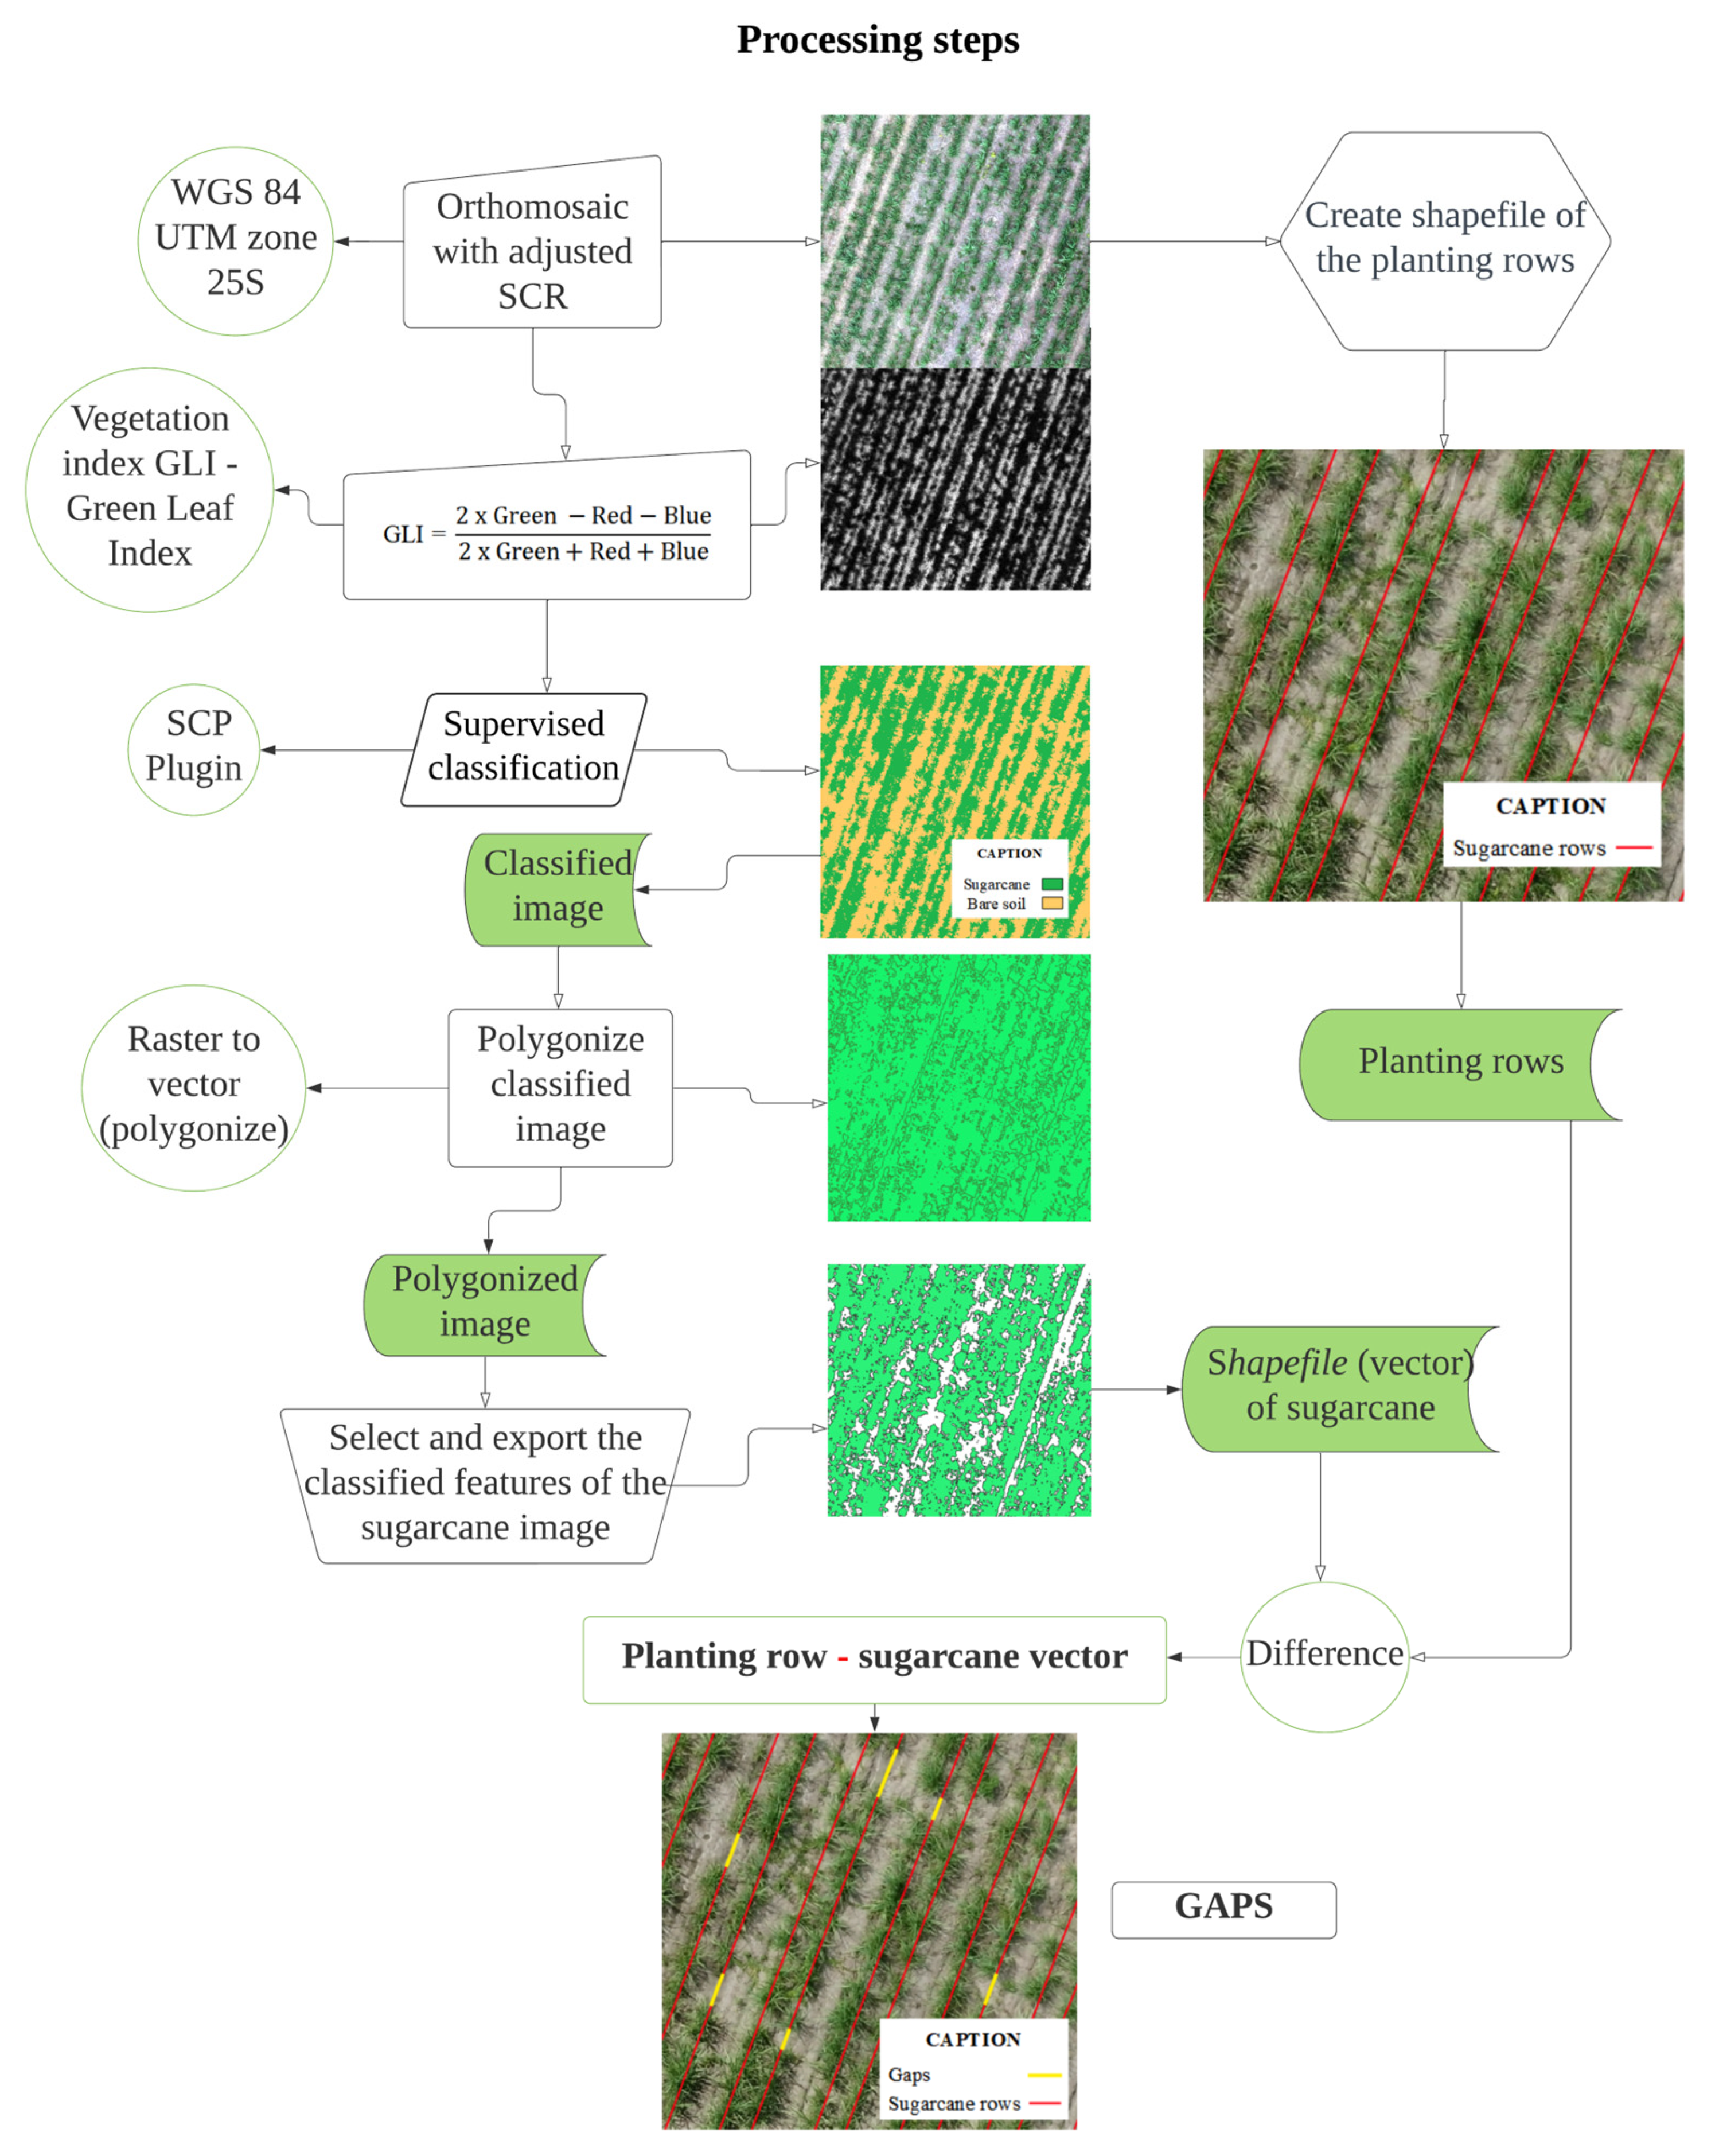
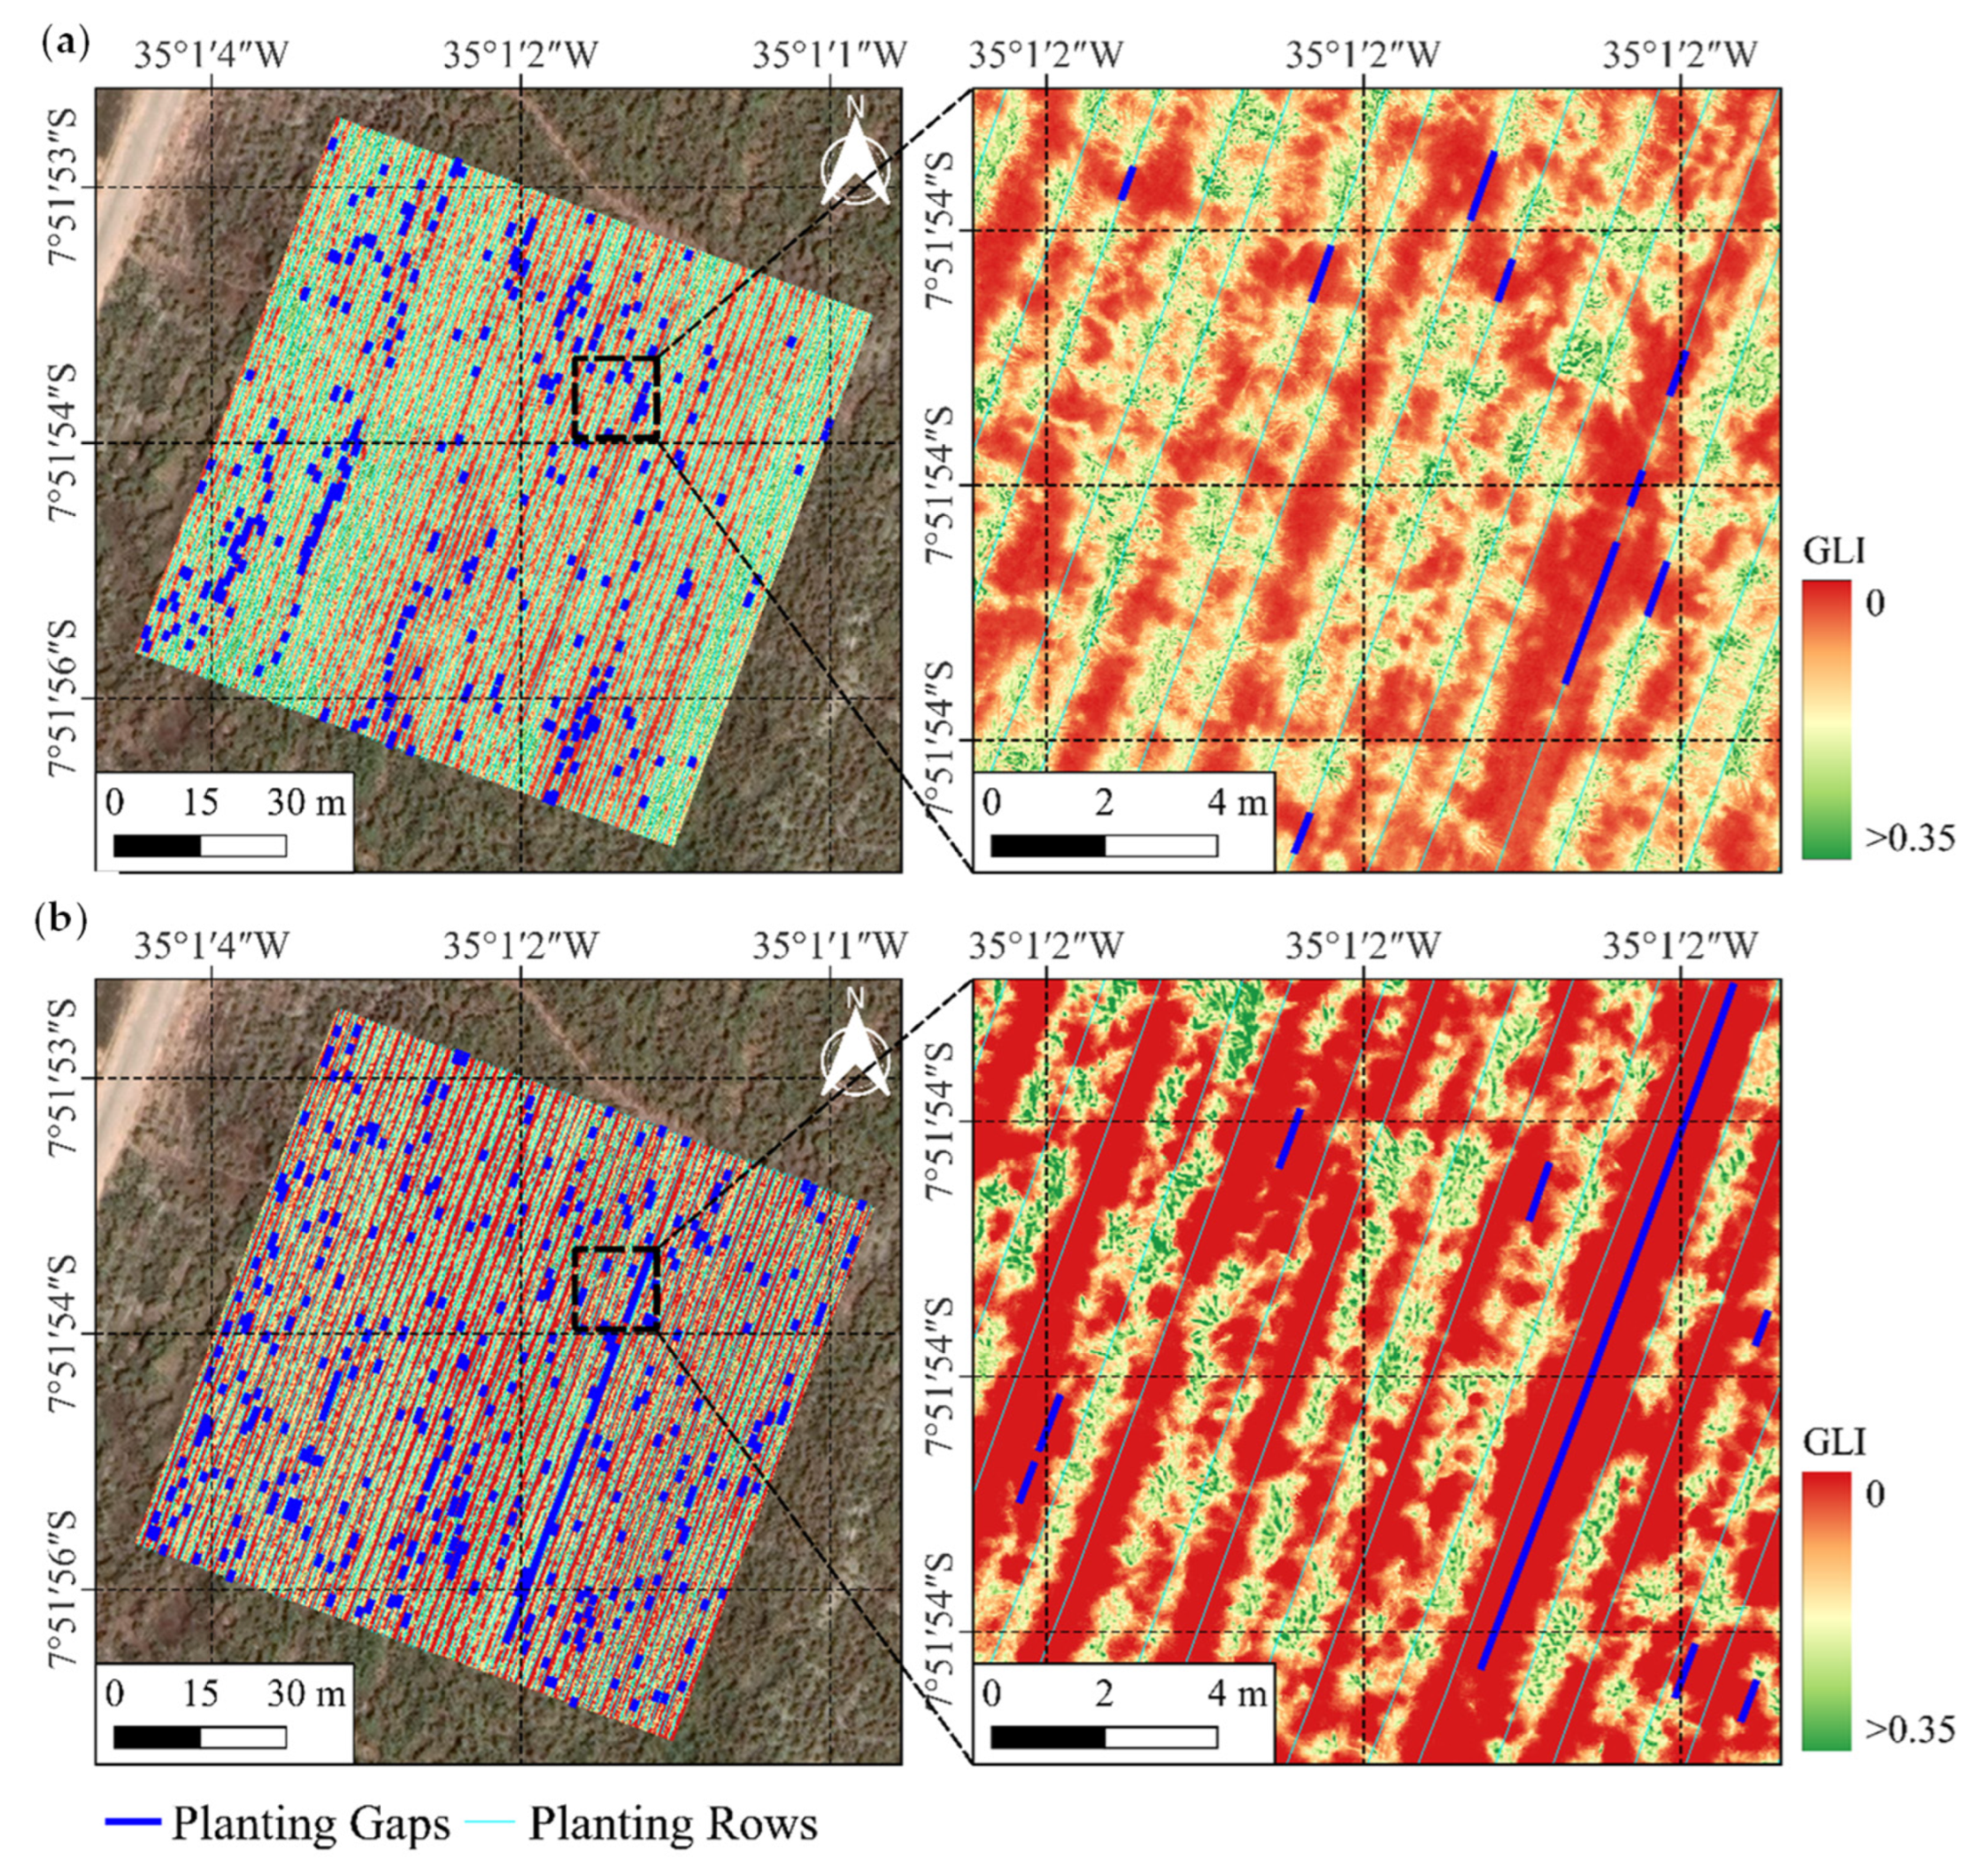
2.3. Analysis of Gaps via Unmanned Aerial Vehicle (UAV)

Figure 3 shows the processing steps of the UAV images. Sugarcane regrowth gaps were estimated using images collected by a UAV model DJI Mavic Pro (Table 1). For navigation, it employed one GPS and GLONASS module, two inertial measurement unit (IMU) modules, and a forward and downward vision system for automatic self-stabilization and to navigate between obstacles and to track moving objects [33].
The UAV was equipped with a DJI FC220 non-metric camera, manufactured by DJI in Shenzhen, China, with sensor size 1/2.3″ (6.16 mm × 4.55 mm) and pixel size 1.55 µm (Table 2). The digital camera can capture land cover images with a spatial resolution of 1.55 µm and an image size of 4000 × 3000 pixels. The camera tagged (into the EXIF metadata) the images with geolocation data using the UAV’s GPS (direct image georeferencing) [34].
The survey flight plan was programmed using DroneDeploy software (version 5.45.0), with input parameters including post-flight geodetic grade ground control point (GCP) measurements, the UTM cartographic projection system, and the WGS 84/Pseudo Mercator reference datum. The data of the planned flight patterns are presented in detail in Table 3. It was assumed that a ground sampling distance (GSD) of approximately 2 cm/pixel would be sufficient to generate a numerical model of the terrain and point clouds of the land surface, and it would allow for further analysis of the phenomena with satisfactory accuracy [33]. Because the parameters of the cameras used in both campaigns differ (Table 2) for a fixed GSD (ground sampling distance), the average flight altitude (MAGL) over the priority area was calculated using the following formula [33]:
h M A G L = I W   × GSD × F R 100   ×   S W
where IW —image width expressed in pixels (px); GSD—the given ground sampling distance in pixels per centimeter (px/cm); FR—actual focal length of the camera (mm); and SW—actual sensor width (mm).
The flight was conducted at an altitude of 60 m, with a longitudinal photo overlap of 80% and a lateral photo overlap of 75%. The flight path followed a single-grid mission plan and was used for general measurements with a nadir camera orientation. This plan is suitable for most environments and is recommended when the principal interest is in 2D map outputs, relatively flat surfaces, and large areas [34].
Subsequently, after the images were acquired, processing was carried out to generate the respective mosaics of the final images of the experimental area. Two UVA images were obtained at different phenological stages of the sugarcane. The first image was obtained in March 2017 (90 days after planting) and the second in March 2018 (90 days after harvest). These UVA imaging periods coincided with the measurements of gaps in the sugarcane field.
After obtaining the images, the digital processing of the UVA images followed two distinct steps (Figure 2). The first step consisted of using the images to create the sugarcane planting rows. This resulted in 13 sugarcane planting rows being created from the UVA images, applying the New Shapefile Layer tool of the QGIS software in version 3.12.3. In the second stage, the Raster Calculator tool estimated the Green Leaf Index (GLI) according to Equation (2) proposed by [35].
GLI = 2   ×   G   R   B 2   ×   G + R + B
where R is the reflectance in the red band (0.63 to 0.69 μm); G is the reflectance in the green band (0.52 to 0.60 μm); and B is the reflectance in the blue band (0.45 to 0.52 μm).
The GLI is a vegetative chlorophyll index and represents the change in vegetation, indicating live and dead plants and exposed soil, ranging from −1 to +1. If the value is negative, the GLI represents exposed soil or lifeless vegetation, but if the value is positive, it corresponds to green leaves [35]. In this study, GLI images were classified into two classes: sugarcane and exposed soil. The Semi-Automatic Classification Plugin (SCP) allowed for the supervised classification of GLI images using the Maximum Likelihood (ML) method [36].
Then, the digital images of land use and land cover were transformed into thematic maps (sugarcane and exposed soil), applying the polygonization tool of the QGIS software in version 3.12.3. The difference between the thematic maps of the planting lines and the thematic maps of land use and land cover resulted in the estimation of the length of the sugarcane planting gaps.
The difference resulted in a thematic map with fragments of the sugarcane planting line, classified as exposed soil. Each planting gap was measured separately in relation to its length using the field calculator tool, using the $length function in QGIS. According to the criteria established by [13], fragments with a length greater than 0.50 m were considered gaps and were kept in the image, while those with a length less than 0.50 m were excluded. The lengths of the sugarcane planting gaps were exported to an Excel spreadsheet and compared with the gaps in the planting lines measured in the field.

2.4. Statistical Analysis

The total lengths of gaps measured per row in the UAV image and in the field were subjected to analysis of variance (p < 0.05), considering the periods after planting and after the first harvest. In addition, regression analysis was applied between the total length of the gaps measured in the field and in the UAV image of each row. Statistical procedures were performed using R software [37].

3. Results

3.1. Comparison of Row Gap Number: Field Measurement vs. UAV Estimation

Figure 4 shows thematic maps of sugarcane planting gaps (blue-toned lines) 90 days after planting (March 2017) and 90 days after the first harvest (March 2018). In the comparison between the gap maps, it is possible to identify that the number of gaps increased and that some gaps that were measured in the first image (Figure 4a) remained in the second image (Figure 4b). The occurrence of gaps in the area after the first harvest increased in number, size, and percentage after the mechanized harvesting operations. This increase in the number of gaps from the period after planting (Figure 4a) to the period after the first harvest (Figure 4b) may be related to the effects of mechanized harvesting.
Figure 5 illustrates the gaps in the planting line measured in the field and estimated from UAV images regarding the length classes after sugarcane planting and after plant cane harvest. By observing the gaps identified in the measurements of both surveys, it is possible to infer that there was an increase in the number of gaps. The total number of gaps visualized in the UAV image was higher (249) than that measured in the field (145) in the period after planting (Figure 5a); after the harvest, however, the total number of gaps was 357 in the UAV images and 407 in the field measurements (Figure 5b). Another result was the highest number of gaps, which was within the range from 0.50 to 1.50 m in the two periods evaluated and both in the UAV image and the field measurement.
Thus, in the survey of gaps carried out after sugarcane harvest, the first cut, the number of gaps increased according to the analysis performed on the image and the field measurement (Figure 5b). Nonetheless, when identifying and measuring sugarcane regrowth gaps at the two evaluated moments (after planting (Figure 5a) and after harvest (Figure 5b), we observed that the number of gaps per length class was higher in the UAV image than in the field measurement for the 0.5–1.0 m length class. However, this behavior reversed for gaps between 1 and 1.5 m.
In the measurement after planting (Figure 5a), it was also observed that the total number of gaps found in the image was higher than in the field survey, with 249 gaps observed in the image through the applied algorithm and 145 gaps measured in the field.

3.2. Assessment of Total Length per Class: Field Measurement vs. UAV Estimation

Gap lengths per class obtained using the UAV image and by field measurement after planting and after harvest showed discrepant values in the classes >0.5–1 m and >1.0–1.5, and there was an increase in gap length in the two periods evaluated (Figure 6). The UAV image after planting (Figure 6a) indicates a longer gap length in the 0.5–1.0 m class (135 m), whereas field measurement in the same period results in a longer overall length in the 1.0–1.5 m class (117 m).
When quantifying the length of regrowth gaps measured with the UAV image after harvest (Figure 6b), a greater presence of gaps with a length of 0.5–1.0 m (158 m) was also observed, but the length of gaps in this same class measured in the field was shorter (93 m). In the next class (>1.0–1.5 m), an inverse behavior occurred, as the gap length observed in the UAV image was 90 m and the field measurement was 247 m (Figure 6b). In the other length classes analyzed (>1.5–2.0 m, >2.0–3.5 m, and >3.5 m), the number of gaps did not differ significantly between the two methodologies. However, field measurements continue to be superior to UAV estimates.

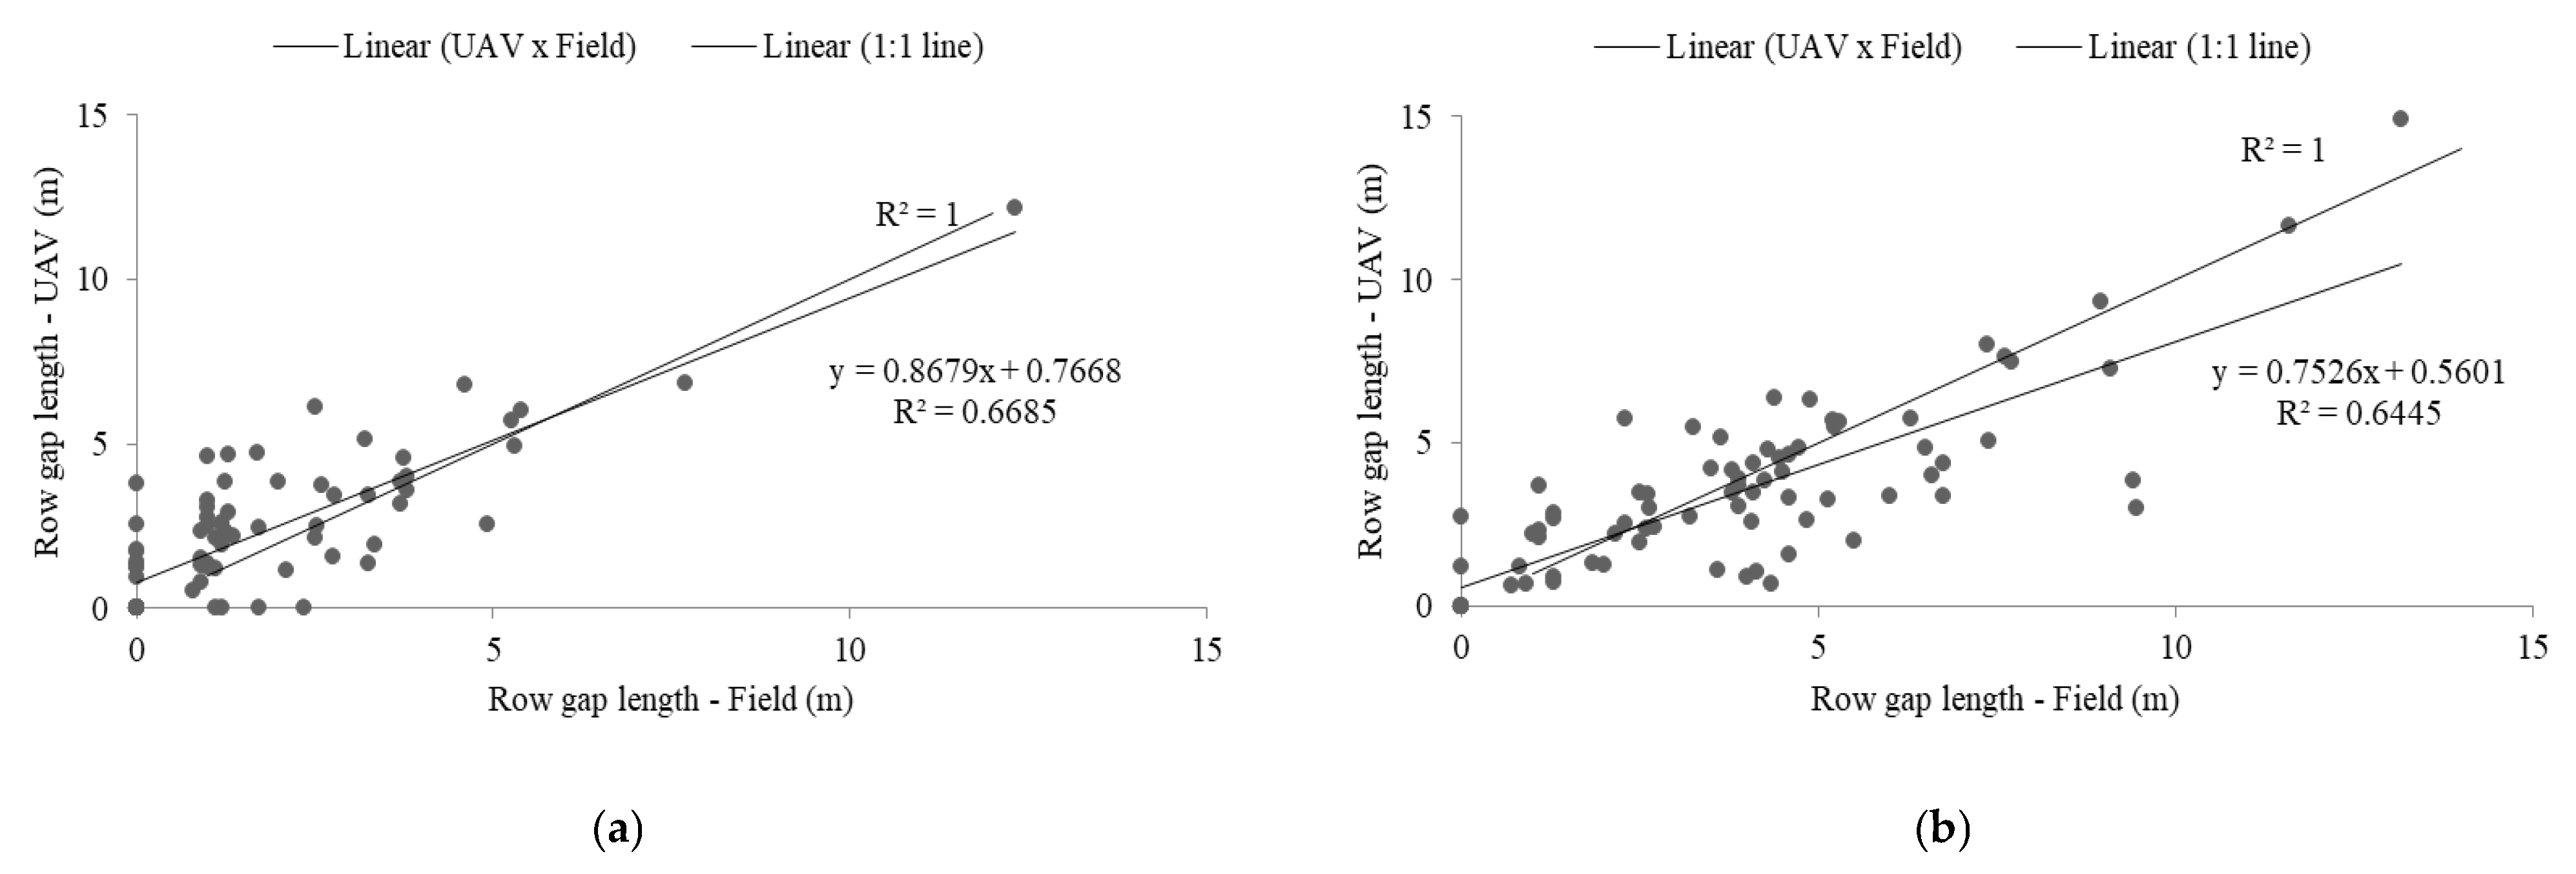
3.3. Validation of Aerial Image Method

There was a statistical difference between the images obtained by the UAV and measurements taken in the field after planting (p < 0.05) (Table 4), but after harvest there was no difference (p > 0.05) (Table 5). The relationship between gap lengths obtained by the UAV and by field measurement after planting and after harvest was satisfactory, as confirmed by the values of R2 = 0.67 and R2 = 0.64, respectively (Figure 7a,b). Other results indicate that for both surveys the correlation graphs (Figure 7a,b) have a greater concentration of points at the beginning of the axis, due to the presence of shorter gaps, between >0.5 and 2.0 m.

4. Discussion

This study offers an alternative methodology to measure planting and regrowth gaps in sugarcane crops using images from an RGB camera installed on a UAV. In the study area, the sugarcane harvesting process is mechanized, impacting plant health and crop productivity. In this context, the basal cutting mechanism of sugarcane harvesters causes damage to ratoons and root systems, leading to the appearance of regrowth gaps [38]. Bernache et al. [39] found similar results when evaluating the quality of the basal cutting mechanism using ratoon damage and loss rates as indicators. These authors found that ratoon damage and losses become more pronounced as the wear of the basal cutting blade intensifies, negatively affecting sugarcane regrowth and, consequently, its development and yield in the area.
The mechanized harvesting system may be responsible for the highest occurrence of gaps due to the use of harvesters and to machine traffic; the former can affect the structure of the plant and uproot it in the cutting process, while the latter may be responsible for smashing the stalks, which hinders regrowth. Sugarcane harvesters can cause serious damage to the stalks, since the cutting actions can crack and break them, exposing the inner part of the plant to air and accelerating stalk deterioration [40]. The cutting system used in mechanized harvesting causes serious damage to sugarcane stalks and, in extreme cases, can pull the plants from the ground [41,42]. After the first harvest, the sugarcane regrowth process is influenced by the way the harvesting operation was managed, how the harvester and trailer traffic occurs in the area, and the quality of the cut. Studies show that, after mechanized harvesting, only 45% of the cut sugarcane stalks remain unharmed [43], as this operation causes direct damage to the stalks, such as cracks and smashing, besides facilitating a possible attack by pathogens, factors that prevent regrowth and increase the occurrence of gaps, consequently leading to greater production losses [19,44,45].
Results observed for the number of gaps and gap lengths between 0.5 and 1.0 m estimated with the images from the RGB camera installed on the UAV differ greatly from those obtained with manual measurements, which may be related to the ability of the algorithm to view shorter objects, but this is not the only reason for these discrepancies. The capacity of the algorithm to visualize gaps is directly related to the quality of the image with regard to pixel size, which is a result of the characteristics of the camera used and the flight height employed to obtain the images [46]. Hu et al. [46] suggest that the pixel size should be around 10% of the target to be detected to obtain satisfactory results. In the present study, the height used was approximately 60 m, resulting in a spatial resolution of 3.405 cm (34.05 mm). This pixel size allows the detection of gaps smaller than 0.5 to 1.0 m, which may not be easily identifiable in manual measurements, especially in densely vegetated areas. Barbosa Júnior et al. [18] estimated failures with an error of 19.2% for plant heights of 0.5 m using a pixel size of 35 mm.
Another reason is that the vegetation can obscure the view of smaller gaps during manual measurement, leading to underestimating the number of gaps. In addition, the height of the plant influences the measurement of the length of the gaps by the UAV and, ultimately, contributes to underestimating their size. If the leaves are too large at the time of the survey, they can cover the place where the gap exists and result in a measurement with reduced lengths by the UAV. Barbosa Júnior et al. [18] analyzed how pixel size and sugarcane height (variety CTC-4) can impact the prediction of gap length in RGB UAV images in São Paulo, Brazil. These authors state that the larger the pixel or plant, the less accurate the prediction of the gap length, as it becomes less visible on the acquisition platform data. This type of error is most likely to occur for regions in the field where actively growing vegetation overlaps 0.5 m gaps [47]. Aerial imagery, in turn, captures these areas more clearly when the plant height is close to 0.5 m, allowing for more accurate counting of 35 mm pixels, and 0.5 m tall plants outperformed other combinations, making it the most precise solution (absolute error ~0.015 m) for remote field mapping [47].
The 1 to 1.5 m class manual measurements outperform gap estimates from UAV imagery. In the other classes, the behavior does not change. This inversion in the results is due to the observer’s ability to distinguish and accurately measure gaps containing only sugarcane. The sugarcane planting row may contain invasive plants such as weeds. For Ranđelović et al. [48], the weeds present in the sugarcane planting lines are a factor that limits the access of the sensors to long gaps. If the planting line contains weeds, these plants are also classified as sugarcane. The spectral behavior of sugarcane and healthy weeds are identical when measured by the optical sensor. The result is a mismatch between actual and predicted values. Molin et al. [19], when evaluating gaps at 40 and 80 days after planting, observed that the image-based gap measuring method finds a higher percentage than actually exists, which corroborates the results found in the present study.
Another possible reason for the gap estimate to underestimate the actual values observed in the field is the variability in interpreting what constitutes a gap. Different observers may have different criteria, while UAV estimates use algorithms that offer greater consistency. Barbosa Júnior et al. [18] observed that plants next to the 0.5 m gaps had leaves covering the entire surface of the fault area, thus making it difficult to see the fault. The faults are unlikely to be fully visible, as the architecture of the plant and the arrangement of its leaves may partially or fully cover the gap area, affecting gaps of shorter lengths.
In this study, the two UAV images correspond to 90 days after planting and 90 days after harvest, where the plant height was approximately 0.5 m. According to Barbosa Júnior et al. [18], a user who wants to map gaps in sugarcane fields should plan to fly a UAV in the field no later than 45 days after planting. Otherwise, optical remote sensing will not be feasible, resulting in a systematic error. However, this depends on the variety and fraction of sugarcane cover grown. In this context, our results indicate that images obtained by UAVs in sugarcane crops can provide accurate information on the incidence of gaps, especially after harvest. Similar behavior has also been observed by [15,18,19,22] when establishing the same type of correlation.
Accurate estimates of gaps in sugarcane plantations using UAV images depend on local weather conditions at the time of flight, plant size, days after planting or harvesting, camera spatial resolution, flight height, vegetation cover, the algorithm used, and the presence of weeds. In this context, UAV imagery offers high spatial resolution, consistency, and efficiency in determining gaps in sugarcane fields. The accurate identification and quantification of gaps in sugarcane fields due to the impacts of mechanization are of great importance, as they allow the assessment of the uniformity of germination and tillering and, consequently, the formation of stalks, variables directly correlated with productivity [14,19,49,50,51]. With information about the number and extent of gaps in the planting line, the farmer will decide whether to replant or reform the sugarcane fields, facilitating the assessment of the profitability and longevity of the plantations [17,52]. Thus, UAV images are valuable for identifying gaps in sugarcane plantations, especially in smaller areas, contributing to more informed and effective management practices.

5. Conclusions

The proposed processing algorithm proved effective in identifying and measuring sugarcane regrowth gaps, with no significant differences between methods for gap length classes of 1.5–2.0 m, 2.0–3.5 m, and >3.5 m, indicating that a UAV image is particularly effective for larger gaps. For gaps smaller than <1 m, the methodology using a UAV is not accurate and requires refinement. The gap detection was influenced by the crop’s emergence stage at the time of image capture and the resolution of the images (pixel size). These findings suggest that regrowth gaps can be rapidly estimated using the proposed methodology, enabling timely corrective actions to improve crop management. Future research could refine the image analysis with advanced algorithms, explore different UAV sensors and resolutions, assess applicability to other crops, and integrate gap detection maps with precision agriculture systems to enhance efficiency and sustainability in agricultural practices.

Author Contributions

Conceptualization, C.G.B.d.M. and M.M.R.; methodology, R.Q.C. and P.F.S.O.; software, R.P.d.L. and P.M.O.L.; formal analysis, C.G.B.d.M. and M.V.d.S.; investigation, C.G.B.d.M. and P.F.S.O.; data curation, R.P.d.L.; writing—original draft preparation, C.G.B.d.M.; writing—review and editing, R.P.d.L., M.M.R., A.L.B.C. and M.V.d.S. All authors have read and agreed to the published version of the manuscript.

Funding

This research was funded by FACEPE, grant number BFP-0141-5.03/22.

Data Availability Statement

Data are contained within the article.

Conflicts of Interest

The authors declare no conflicts of interest.

References

  1. Karp, S.G.; Medina, J.D.; Letti, L.A.; Woiciechowski, A.L.; de Carvalho, J.C.; Schmitt, C.C.; Soccol, C.R. Bioeconomy and biofuels: The case of sugarcane ethanol in Brazil. Biofuel Bioprod. Biorefin. 2021, 15, 899–912. [Google Scholar] [CrossRef]
  2. Vandenberghe, L.P.S.; Valladares-Diestra, K.K.; Bittencourt, G.A.; Torres, L.Z.; Vieira, S.; Karp, S.G.; Soccol, C.R. Beyond sugar and ethanol: The future of sugarcane biorefineries in Brazil. Renew. Sustain. Energy Rev. 2022, 167, 112721. [Google Scholar] [CrossRef]
  3. Conab—Companhia Nacional de Abastecimento. Acompanhamento da Safra Brasileira de Cana-de-Açúcar, v. 12-Safra 2024/25, n. 2, Segundo Levantamento, Brasília. 2024. Available online: https://www.conab.gov.br/info-agro/safras/cana (accessed on 10 November 2024).
  4. Maldaner, L.F.; Corrêdo, L.P.; Canata, T.F.; Molin, J.P. Predicting the sugarcane yield in real-time by harvester engine parameters and machine learning approaches. Comput. Electron. Agric. 2021, 181, 105945. [Google Scholar] [CrossRef]
  5. Valente, F.; Laurini, M. Pre-harvest sugarcane burning: A statistical analysis of the environmental impacts of a regulatory change in the energy sector. Clean. Eng. Technol. 2021, 4, 100255. [Google Scholar] [CrossRef]
  6. Bordonal, R.D.O.; Carvalho, J.L.N.; Lal, R.; de Figueiredo, E.B.; de Oliveira, B.G.; La Scala, N. Sustainability of sugarcane production in Brazil. A review. Agron. Sustain. Dev. 2018, 38, 13. [Google Scholar] [CrossRef]
  7. Cortez, J.W.; Missio, C.; Barreto, A.K.G.; Silva, M.D.; Reis, G.N. Quality of sugarcane mechanized planting. Rev. Eng. Agríc. 2016, 36, 1136–1144. [Google Scholar] [CrossRef]
  8. Santoro, E.; Soler, E.M.; Cherri, A.C. Route optimization in mechanized sugarcane harvesting. Comput. Electron. Agric. 2017, 141, 140–146. [Google Scholar] [CrossRef]
  9. Du, C.; Kulay, L.; Cavalett, O.; Dias, L.; Freire, F. Life cycle assessment addressing health effects of particulate matter of mechanical versus manual sugarcane harvesting in Brazil. Int. J. Life Cycle Assess. 2018, 23, 787–799. [Google Scholar] [CrossRef]
  10. Silva, M.J.; Neves, L.O.; Correa, M.H.F.; de Souza, C.H.W. Quality indexes and performance in mechanized harvesting of sugarcane at a burnt cane and green cane. Sugar Tech 2021, 23, 499–507. [Google Scholar] [CrossRef]
  11. Pacheco, E.P.; Cantalice, J.R.B. Compressibilidade, resistência à penetração e intervalo hídrico ótimo de um Argissolo Amarelo cultivado com cana-de-açúcar nos Tabuleiros Costeiros de Alagoas. Rev. Bras. Ciência Solo 2011, 35, 403–415. [Google Scholar] [CrossRef]
  12. Castioni, G.A.; Cherubin, M.R.; Menandro, L.M.S.; Sanches, G.M.; Bordonal, R.O.; Barbosa, L.C.; Franco, H.C.J.; Carvalho, J.L.N. Soil physical quality response to sugarcane straw removal in Brazil: A multi-approach assessment. Soil Tillage Res. 2018, 184, 301–309. [Google Scholar] [CrossRef]
  13. Stolf, R. Metodologia de avaliação de falhas nas linhas de cana-de-açúcar. STAB 1986, 4, 22–36. [Google Scholar]
  14. Luna, I.; Lobo, A. Mapping Crop Planting Quality in Sugarcane from UAV Imagery: A Pilot Study in Nicaragua. Remote Sens. 2016, 8, 500. [Google Scholar] [CrossRef]
  15. Souza, C.H.W.; Lamparelli, R.A.C.; Rocha, J.V.; Magalhães, P.S.G. Mapping skips in sugarcane fields using object-based analysis of unmanned aerial vehicle (UAV) images. Comput. Electron. Agric. 2017, 143, 49–56. [Google Scholar] [CrossRef]
  16. Dhariwal, S.; Sharma, A. Aerial Images were used to Detect Curved-Crop Rows and Failures in Sugarcane Production. In Proceedings of the IEEE International Conference on Electronics, Computing and Communication Technologies (CONECCT), Bangalore, India, 8–10 July 2022; pp. 1–7. [Google Scholar] [CrossRef]
  17. Cardoso, L.A.S.; Farias, P.R.S.; Soares, J.A.C. Use of Unmanned Aerial Vehicle in Sugarcane Cultivation in Brazil: A Review. Sugar Tech 2022, 24, 1636–1648. [Google Scholar] [CrossRef]
  18. Barbosa Júnior, M.R.; Tedesco, D.; Corrêa, R.G.; Moreira, B.R.A.; Silva, R.P.; Zerbato, C. Mapping Gaps in Sugarcane by UAV RGB Imagery: The Lower and Earlier the Flight, the More Accurate. Agronomy 2021, 11, 2578. [Google Scholar] [CrossRef]
  19. Molin, J.P.; Veiga, J.P.S.; Cavalcante, D.S. Spatial variability of sugarcane row gaps: Measurement and Measuring and mapping sugarcane gaps. Ciênc. Agrotec. 2016, 40, 347–355. [Google Scholar] [CrossRef]
  20. Oliveira, M.P.D.; Cardoso, P.H.; Oliveira, R.P.D.; Barbosa Júnior, M.R.; da Silva, R.P. Mapping gaps in sugarcane fields using UAV-RTK platform. Agriculture 2023, 13, 1241. [Google Scholar] [CrossRef]
  21. Santos, S.G.; Melo, J.C.; Constantino, R.G.; Brito, A.V. A solution for vegetation analysis, separation and geolocation of management zones using aerial images by UAVs. In Proceedings of the 2019 IX Brazilian Symposium on Computing Systems Engineering (SBESC), Natal, Brazil, 19–22 November 2019; pp. 1–8. [Google Scholar] [CrossRef]
  22. Rocha, B.M.; da Fonseca, A.U.; Pedrini, H.; Soares, F. Automatic detection and evaluation of sugarcane planting rows in aerial images. Inf. Process. Agric. 2023, 10, 400–425. [Google Scholar] [CrossRef]
  23. Huang, C.Y.; Wei, H.L.; Rau, J.Y.; Jhan, J.P. Use of principal components of UAV-acquired narrow-band multispectral imagery to map the diverse low stature vegetation fAPAR. GISci. Remote Sens. 2019, 56, 605–623. [Google Scholar] [CrossRef]
  24. Wang, N.; Suomalainen, J.; Bartholomeus, H.; Kooistra, L.; Masiliūnas, D.; Clevers, J.G. Diurnal variation of sun-induced chlorophyll fluorescence of agricultural crops observed from a point-based spectrometer on a UAV. Int. J. Appl. Earth Obs. Geoinf. 2021, 96, 102276. [Google Scholar] [CrossRef]
  25. Ganeva, D.; Roumenina, E.; Dimitrov, P.; Gikov, A.; Jelev, G.; Dragov, R.; Taneva, K. Phenotypic traits estimation and preliminary yield assessment in different phenophases of wheat breeding experiment based on UAV multispectral images. Remote Sens. 2022, 14, 1019. [Google Scholar] [CrossRef]
  26. Rueda-Ayala, V.P.; Peña, J.M.; Höglind, M.; Bengochea-Guevara, J.M.; Andújar, D. Comparing UAV-based technologies and RGB-D reconstruction methods for plant height and biomass monitoring on grass ley. Sensors 2019, 19, 535. [Google Scholar] [CrossRef] [PubMed]
  27. Sumesh, K.C.; Ninsawat, S.; Som-ard, J. Integration of RGB-based vegetation index, crop surface model and object-based image analysis approach for sugarcane yield estimation using unmanned aerial vehicle. Comput. Electron. Agric. 2021, 180, 105903. [Google Scholar] [CrossRef]
  28. Castro-Valdecantos, P.; Apolo-Apolo, O.E.; Pérez-Ruiz, M.; Egea, G. Leaf area index estimations by deep learning models using RGB images and data fusion in maize. Precis. Agric. 2022, 23, 1949–1966. [Google Scholar] [CrossRef]
  29. Soil Survey Staff. Keys to Soil Taxonomy, 12th ed.; NRCS: Washington, DC, USA, 2018. Available online: https://www.nrcs.usda.gov/sites/default/files/2022-09/The-Soil-Survey-Manual.pdf (accessed on 27 July 2023).
  30. Alvares, C.A.; Stape, J.L.; Sentelhas, P.C.; Gonçalves, J.D.M.; Sparovek, G. Köppen’s climate classification map for Brazil. Meteorol. Z. 2013, 22, 711–728. [Google Scholar] [CrossRef]
  31. INMET. Instituto Nacional de Meteorologia. Dados Históricos Anuais. Available online: https://portal.inmet.gov.br/dadoshistoricos (accessed on 2 February 2023).
  32. Ortiz, P.F.S.; Rolim, M.M.; Lima, R.P.; Tormena, C.A.; Cavalcanti, R.Q.; Pedrosa, E.M.R. A Soil Physical Assessment Over Three Successive Burned and Unburned Sugarcane Annual Harvests. Sugar Tech 2022, 25, 518–530. [Google Scholar] [CrossRef]
  33. Burdziakowski, P.; Specht, C.; Dabrowski, P.S.; Specht, M.; Lewicka, O.; Makar, A. Using UAV Photogrammetry to Analyse Changes in the Coastal Zone Based on the Sopot Tombolo (Salient) Measurement Project. Sensors 2020, 20, 4000. [Google Scholar] [CrossRef]
  34. Stateczny, A.; Kazimierski, W.; Burdziakowski, P.; Motyl, W.; Wisniewska, M. Shore Construction Detection by Automotive Radar for the Needs of Autonomous Surface Vehicle Navigation. ISPRS Int. J. Geo-Inf. 2019, 8, 80. [Google Scholar] [CrossRef]
  35. Louhaichi, M.; Borman, M.M.; Johnson, D.E. Spatially located platform and aerial photography for documentation of grazing impacts on wheat. Geocarto Int. 2001, 16, 65–70. [Google Scholar] [CrossRef]
  36. Congedo, L. Semi-Automatic Classification Plugin for QGIS; Sapienza University: Rome, Italy, 2013. [Google Scholar]
  37. R Core Team. R: A Language and Environment for Statistical Computing; R Foundation for Statistical Computing: Vienna, Austria, 2021; Available online: https://www.r-project.org (accessed on 12 September 2023).
  38. Toledo, A.; Silva, R.P.; Furlani, C.E.A. Quality of cut and basecutter blade configuration for the mechanized harvest of green sugarcane. Sci. Agric. J. 2013, 70, 384–389. [Google Scholar] [CrossRef]
  39. Bernache, L.; Oliveirpa, D.T.; Oliveira, L.P.; Corrêa, L.N.; Silva, R.P. Can basal cutting blade wear affect sugarcane regrowth? Rev. Eng. Agríc. 2020, 40, 53–60. [Google Scholar] [CrossRef]
  40. Qiu, M.; Meng, Y.; Li, Y.; Shen, X. Sugarcane stem cut quality investigated by finite element simulation and experiment. Biosyst. Eng. 2021, 206, 135–149. [Google Scholar] [CrossRef]
  41. Voltarelli, M.A.; Silva, R.P.D.; Cassia, M.T.; Daloia, J.G.M.; Paixão, C.S.S. Qualidade do corte basal de cana-de-açúcar efetuado por facas de diferentes angulações e revestimentos. Rev. Ciênc. Agron. 2017, 48, 438–447. [Google Scholar] [CrossRef]
  42. Voltarelli, M.A.; Silva, R.P.D.; Cassia, M.T.; Ortiz, D.F.; Torres, L.S. Qualidade do corte basal de cana-de-açúcar utilizando-se de três modelos de facas. Eng. Agríc. 2015, 35, 528–541. [Google Scholar] [CrossRef]
  43. Manhães, C.M.C.; Francelino, F.M.A.; Araújo, R.A.; Oliveira, D.G.; Francelino, H.O.; Silva, M.P.S.; Santos, A.S.; Moura Júnior, M.D. Visible Losses to the Mechanical Harvesting of Ratoon Sugarcane Using the Harvester John Deere 3520. Am. J. Anal. Chem. 2018, 9, 580–590. [Google Scholar] [CrossRef]
  44. Braunack, M.V.; Arvidsson, J.; Hakansson, I. Effect of harvest traffic position on soil conditions, and sugarcane (Saccharum officinarum) response to environmental conditions in Queensland, Australia. Soil Tillage Res. 2006, 89, 103–121. [Google Scholar] [CrossRef]
  45. Manhães, C.M.C.; Garcia, R.F.; Junior, D.C.; Francelino, F.M.A.; Francelino, H.O.; Santos, C.M.F.G. Evaluation of visible losses and damage to the ratoon cane in the mechanized harvesting of sugarcane for different displacement speeds. Am. J. Plant Sci. 2014, 5, 2956–2964. [Google Scholar] [CrossRef]
  46. Hu, P.; Guo, W.; Chapman, S.C.; Guo, Y.; Zheng, B. Pixel size of aerial imagery constrains the applications of unmanned aerial vehicle in crop breeding. ISPRS J. Photogramm. Remote Sens. 2019, 154, 1–9. [Google Scholar] [CrossRef]
  47. Santana, C.H.G.; Silva, A.L. Identificação de Falhas de Plantio em Lavoura de Cana-de-Açúcar em Diferentes Alturas com Uso de Vant, R.C.E.A. 2021, Volume 40, p. 1. Available online: https://faef.revista.inf.br/imagens_arquivos/arquivos_destaque/6STaT7PI0jAX1gb_2021-12-21-15-7-39.pdf (accessed on 18 December 2024).
  48. Ranđelović, P.; Đorđević, V.; Milić, S.; Balešević-Tubić, S.; Petrović, K.; Miladinović, J.; Đukić, V. Prediction of Soybean Plant Density Using a Machine Learning Model and Vegetation Indices Extracted from RGB Images Taken with a UAV. Agronomy 2020, 10, 1108. [Google Scholar] [CrossRef]
  49. Bocca, F.F.; Rodrigues, L.H.A.; Arraes, N.A.M. When do I want to know and why? Different demands on sugarcane yield predictions. Agric. Syst. 2015, 135, 48–56. [Google Scholar] [CrossRef]
  50. Matsuoka, S.; Stolf, R. Sugarcane Tillering and Ratooning: Key Factors for a Profitable Cropping. In Sugarcane: Production, Cultivation and Uses; Nova Publishers: Hauppauge, NY, USA, 2012; pp. 138–157. ISBN 9781612097459. [Google Scholar]
  51. Maldaner, L.F.; Molin, J.P.; Martello, M.; Tavares, T.R.; Dias, F.L. Identification and measurement of gaps within sugarcane rows for site-specific management: Comparing different sensor-based approaches. Biosyst. Eng. 2021, 209, 64–73. [Google Scholar] [CrossRef]
  52. Keerthipala, A.P.; Dharmawardene, N. Determination of optimal replanting cycles for sugarcane production in Sri Lanka. Sugar Tech 2000, 2, 9–19. [Google Scholar] [CrossRef]
Figure 1. Location of the study area, based on the topographic elevation provided by the Shuttle Radar Topography Mission (SRTM) digital elevation model, within the municipality of Igarassu, PE, Brazil. Geographic references include: (a) South America; (b) the State of Pernambuco; (c) the municipality of Igarassu; and the sugarcane plantation area (d).
Agriengineering 07 00017 g001
Figure 2. Measurement of gaps in the sugarcane planting line.
Agriengineering 07 00017 g002
Figure 3. Flowchart of the processing steps and the results evaluated. SCR—Coordinate reference system; UTM—Universal Transverse Mercator; WGS—World Geodetic System; SCP—Semi-Automatic Classification Plugin; and GLI—Green Leaf Index.
Agriengineering 07 00017 g003
Figure 4. Maps of gaps extracted through the processing algorithm obtained at 90 days after planting (a) and at 90 days after the first harvest (b) in the municipality of Igarassu, PE, Brazil. The blue-toned lines represent sugarcane planting gaps.
Agriengineering 07 00017 g004
Figure 5. Row gap number measured in the field and estimated from UAV images regarding the length classes after sugarcane planting (a) and after plant cane harvest (b).
Agriengineering 07 00017 g005
Figure 6. Total length per class measured in the field and estimated with UAV after sugarcane planting (a) and after plant cane harvest (b).
Agriengineering 07 00017 g006
Figure 7. Correlation between the total row gap lengths measured in the field and by the UAV in each of the rows after sugarcane planting (a) and after plant cane harvest (b).
Agriengineering 07 00017 g007
Table 1. Technical data of DJI Mavic Pro Unmanned Aerial Vehicle.
Technical DataDJI Mavic Pro
Dimensions (L × W × H) (mm)305 × 244 × 85
Weight (g)734
Maximum rising speed (m/s)5
Maximum ascending velocity (m/s)3
Maximum advance velocity (km/h)65
Maximum altitude (m)5000
Maximum flight time (min)27
Maximum hovering time (min)24
Mean flight time (min)21
Maximum flight range (km)13
Permissible operating temperature range (°C)0 to 40
Satellite Navigation SystemsGPS/GLONASS
Source: adapted from Burdziakowski et al. [33].
Table 2. DJI FC220 UAV camera sensor specifications.
Technical DataFC220
Sensor size 1/2.3″ (6.16 mm × 4.55 mm), 12.35 MP
Pixel size1.55 μm
Lens (field of view, FOV)78.8° (f/2.2)
Image size4000 × 3000 pixels
Focal length4.74 mm
Focal length (35 mm equivalent)27.64 mm
Principal point X, Y1974.82 pixels, 1491.48 pixels
Distortion coefficients: K1, K2, K3, P1, P2−0.001, 0.0325, −0.046, 0, 0
FocusFrom 0.5 m to ∞, auto/manual focus
ISO range100–3200 (video), 100–1600 (photographs)
Electronic shutter speed8–1/8000 s
Photographic file formatJPEG, DNG
Source: adapted from Stateczny et al. [34].
Table 3. Flight details.
2017/2018
Flight pathsingle grid
Ground sampling distance (GSD)2.21
Number of photos taken-
Coverage (longitudinal/traverse) (%)80/75
Flight altitude above ground level (AGL)60
Source: adapted from Burdziakowski et al. [33].
Table 4. Analysis of variance for total gap lengths measured per row in UAV image and in the field after planting.
FactorsDFSSMSFp-Value
Regression1255.44255.44161.334.0521 × 10−5
Residual80126.671.58 7.12701 × 10⁻²¹
Total81382.10
Table 5. Analysis of variance for total gap lengths measured per row in UAV image and in the field after harvest.
FactorsDFSSMSFp-Value
Regression1359.11359.11141.390.06647
Residual78198.112.54 3.40018 × 10⁻¹⁹
Total79557.22
Disclaimer/Publisher’s Note: The statements, opinions and data contained in all publications are solely those of the individual author(s) and contributor(s) and not of MDPI and/or the editor(s). MDPI and/or the editor(s) disclaim responsibility for any injury to people or property resulting from any ideas, methods, instructions or products referred to in the content.

