Abstract
Sustainable turfgrass management is essential for maintaining healthy and visually appealing green spaces. Autonomous mowers have emerged as an innovative solution, but the efficiency and quality of mowing operations depend on several factors. This study investigates the impact of mowing patterns and cutting heights on the performance of an autonomous mower through updated custom-built software. Three different mowing patterns (vertical, diagonal, and horizontal) and two cutting heights (3 cm and 6 cm) were analyzed to analyze mowing efficiency, coverage, and cutting uniformity. The vertical pattern emerged as the most effective, maximizing speed (0.52 m/s) and efficiency (0.77), while minimizing overlap (4.27 cm) and uncut areas (0.014 m2). In contrast, the horizontal and diagonal patterns showed lower efficiency (0.71 and 0.76) and less coverage percentage (97.05% and 96.71%) compared to the vertical pattern (98.57%). Cutting height influenced performance, with higher heights sometimes requiring adjustments to prevent inefficiencies. The interaction between the mowing pattern and cutting height was critical for optimizing both operational efficiency and cutting quality. These findings highlight the importance of selecting an appropriate mowing pattern and cutting height tailored to the specific operational goals.
1. Introduction
Sustainable turfgrass management is a critical challenge for various applications, including sports fields and ornamental areas. Maintaining a healthy, aesthetically pleasing turfgrass requires management practices that balance operational efficiency, quality results, and environmental sustainability [1]. In this regard, autonomous mowers emerged as a promising solution for turfgrass maintenance [2].
Autonomous mowers, thanks to their frequent mowing and the razor-type blades with which are equipped, can improve the cut quality by achieving a cleaner cut, decreasing leaf chlorosis, and reducing turfgrass stress from mowing [3,4]. These machines can increase the density of the turfgrass and reduce the average leaf width, resulting in a higher turf quality [5]. Moreover, they can reduce weed pressure compared to conventional mowers, with the exception, for example, of creeping species that can adapt to constant mowing [6]. Autonomous mowers can provide several managerial advantages, including reduced labor requirements and a lower risk of operator injuries. Furthermore, compared to conventional mowers, they contribute to a reduction in gas and noise emissions in the operating area, while also leading to lower primary energy consumption [2,7]. Moreover, the latest models with systematic trajectories can minimize overlap, further reducing working time and energy consumption [8].
Among the various operational aspects, cutting trajectories and cutting height play a crucial role in determining both the quality of the outcome and the overall system efficiency [9]. Existing research has emphasized the importance of the interaction between these factors in determining the quality of the turf, the uniform distribution of cuts, and operational efficiency [10]. The adjustment of the cutting height significantly affects the health of the lawn, its aesthetic quality, the machine’s efficiency and consumption, and also has an environmental impact [11]. Frequent mowing at a low height can reduce lawn floral resources useful for pollinators [12]. Instead, regarding mowing trajectories, systematic cutting models provide the opportunity to reduce redundant movements and optimize the theoretical surface coverage, improving cutting distribution and minimizing untreated areas [13]. Previous studies have shown that autonomous mowers equipped with advanced technologies, such as GNSS navigation systems, can contribute to improving energy and work efficiency [14,15].
Real-time kinematic GNSS (RTK-GNSS) is one of the common methods used for accurate on-filed navigation of autonomous agricultural robot [16].
According to Liu et al. [17], path planning and tracking control technologies are other fundamental research fields of robot mowers working analysis. In fact, path planning and tracking control are two crucial aspects for the functioning of robot mowers, as they determine their ability to complete tasks efficiently and reliably, directly impacting the robot intelligence level [18]. Path planning allows the robot to assess its movement route using internal environmental data and information gathered from onboard sensors, aiming to optimize the path and reduce travel time while avoiding obstacles [19].
On the other hand, tracking control technology enables the robot to precisely follow the preset path by adjusting the steering angle in real time to correct lateral and angular deviations [20]. This could improve the automation of mower robots and prevent incomplete or repeated mowing operations [21]. However, to optimize these techniques, it is essential to choose the most suitable robot based on the specific characteristics of the green area to be managed [22]. For example, the shape of the area could influence the operative performance during the robot turning path, in terms of time and overlapping [23]. Selecting the right robot based on the type and size of the area to be mowed is the first step in ensuring the effectiveness of path planning and tracking control techniques. As highlighted by Sun et al. [24], the use of RTK-GNSS (Real-Time Kinematic Global Navigation Satellite System) systems for tracking vehicle paths has shown potential in optimizing green space management, particularly in residential and urban settings, due to an improved navigation system. In this regard, studies analyzing in detail how different cutting patterns impact the overall effectiveness of the system remain limited. Current research still presents gaps, particularly regarding the comparative analysis of the impact of different cutting patterns on turfgrass management in real-world conditions. While the existing literature has primarily focused on energy efficiency and overall cutting coverage, there is still a need to explore how different trajectory models and cutting heights affect factors such as overlap between passes, cutting uniformity, and system adaptability to different types of turfgrasses infested with spontaneous species. This study aims to contribute to the understanding of these dynamics by investigating the impact of three different systematic cutting patterns and two cutting heights on the performance of an autonomous mower through updated custom-built software. This study focuses on the analysis of remote system sensing and software integration, highlighting their applicability and utility in evaluating the performance of autonomous mowers.
2. Materials and Methods
2.1. Experimental Field Trials
The trial was carried out at the Centre for Research on Turfgrass for Environment and Sports (CeRTES) of the Department of Agriculture, Food, and Environment of the University of Pisa (San Piero a Grado, Pisa, Italy—43°40′ N, 10°19′ E, 6 m a. s. l.). The trial was performed on a bermudagrass (Cynodon dactylon × Cynodon transvaalensis cv ‘Patriot’) mature stand infested with clover (Trifolium repens) and dallisgrass (Paspalum dilatatum Poir.). The soil was characterized by a silty loam texture (28% sand, 55% silt, and 17% clay). Before the beginning of the trial the entire area was managed with a ride-on mower with a cutting height of 3.5 cm. The turfgrass had homogeneous characteristics with an average height of 4 cm. Before the beginning of the trial irrigation was conducted two times a week to supplement rainfall and to avoid any potential turfgrass stress. Fertilization was applied on 11 June 2024 at a rate of 168 kg ha−1 of N. No weed or pest control were performed. The weather conditions during the test period were collected from the local weather station (San Piero a Grado (PI), with a focus on July, August, September, and October 2024).
From July to October 2024 three different patterns and two different heights were evaluated on areas of 254 m2 each. The adopted experimental layout consisted of a randomized complete block design with three replications. The mowing management system consisted of an autonomous mower with systematic trajectories, set to operate three times a week in each area. The autonomous mower ultrasonic sensors were disabled. The main factor was the parallel systematic mowing pattern type (three levels: vertical, horizontal and diagonal), the other one was the cutting height (two levels: 3 cm and 6 cm). The autonomous mowers worked at an average speed of 0.46 m s−1 with a cutting-disk revolving speed of 2300 rpm and a working width of 240 mm. The autonomous mowers were left working until the areas were totally mown.
2.2. Assessment
A grass height meter was employed to measure the turf height before and after every mowing event in each plot.
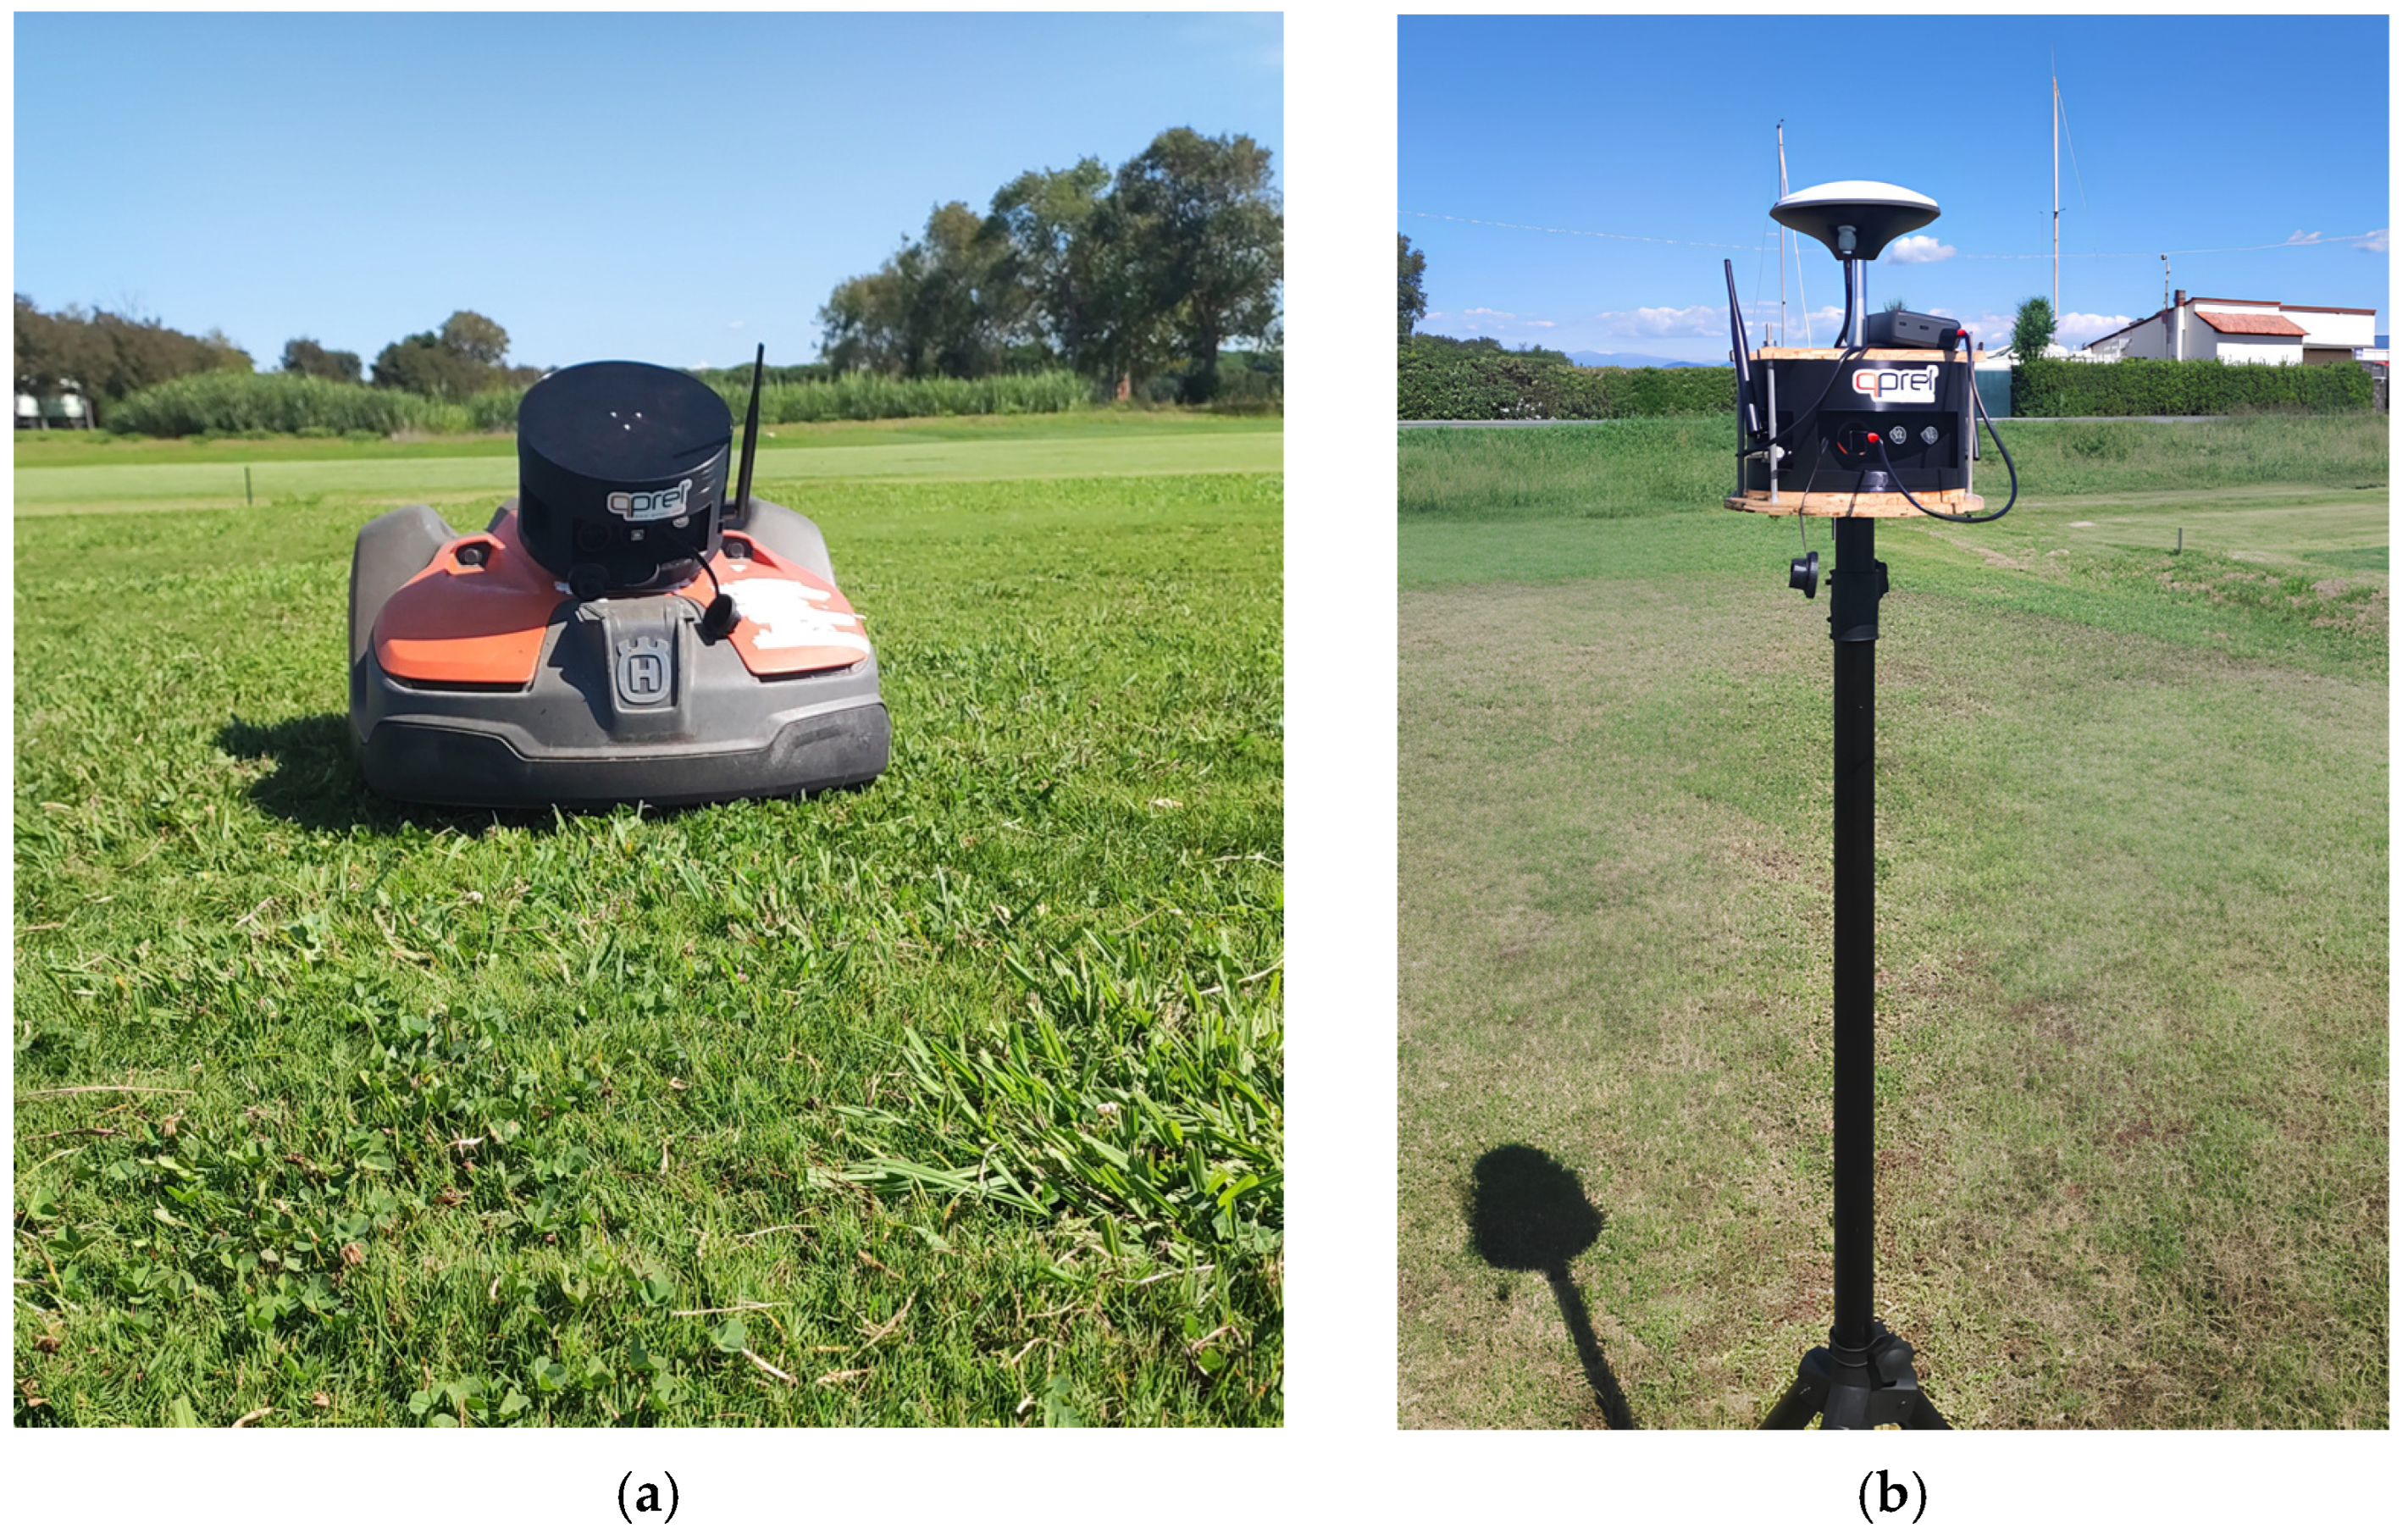
A new custom-built remote system sensing system was employed to analyze the working data of the different autonomous mower mowing patterns. The remote system sensing employed is a new version of the one described by Luglio et al. [9]. The base was located in a fixed position outside the experimental area (Figure 1a). On the rover (Figure 1b) is mounted a simpleRTK3B Pro board from ArduSimple (Andorra la Vella, Andorra) which is equipped with the mosaic-X5 module from Septentrio (Lovanio, Belgio) which constitutes its operational core. This module is a GNSS receiver equipped with a CPU with its firmware that manages the GNSS receiver parameters. Mosaic-X5 can acquire the position with a precision of up to 0.7 cm with a rate of 100 Hz (for our purposes we used the default of 1 Hz) and it supports 3 reception bands L1, L2 and L5 and relies on different satellites (GPS, GLONASS, Galileo, BeiDou, QZSS, Navic, SBAS). It also has several communications channels with which it can communicate: 2 serial ports, USB port and a 10/100 Base-T Ethernet. There is also an SD Card slot where data is stored during the entire operation of the devices, both on the rover and on the base unit. For communication between the rover and the base, LoRa radio communication was used (band 863–870 MHz, power 20 mW) which allows a wide range of operation. The LoRa module is mounted on a Shield which has been coupled via 2xSIL pin headers on the main board. Communication between the radio module and the rover takes place via a serial port at 115,200 baud. The base consists of a simple RTK3B Pro board with the same LoRa module to communicate the corrections (RTCMv3) to the rover unit and receive the correct position from the latter via RTK. The base is equipped with an additional Ethernet shield which allows connection via LAN to a Wi-Fi router also inserted in the same case. Through the Wi-Fi network it is possible to manage the base configuration and download the acquired data (dedicated web page).

Figure 1.
(a) The rover fixed on the robot mower while it is cutting one of the areas; (b) the base station collocated outside the working area.
In addition to the USB power socket, both units are also equipped with an auxiliary USB for configuring the mosaic-X5 modules. The rover and the base are powered by 11 rechargeable lithium batteries (18,650 format, 2700 mAh capacity per battery) connected in parallel.
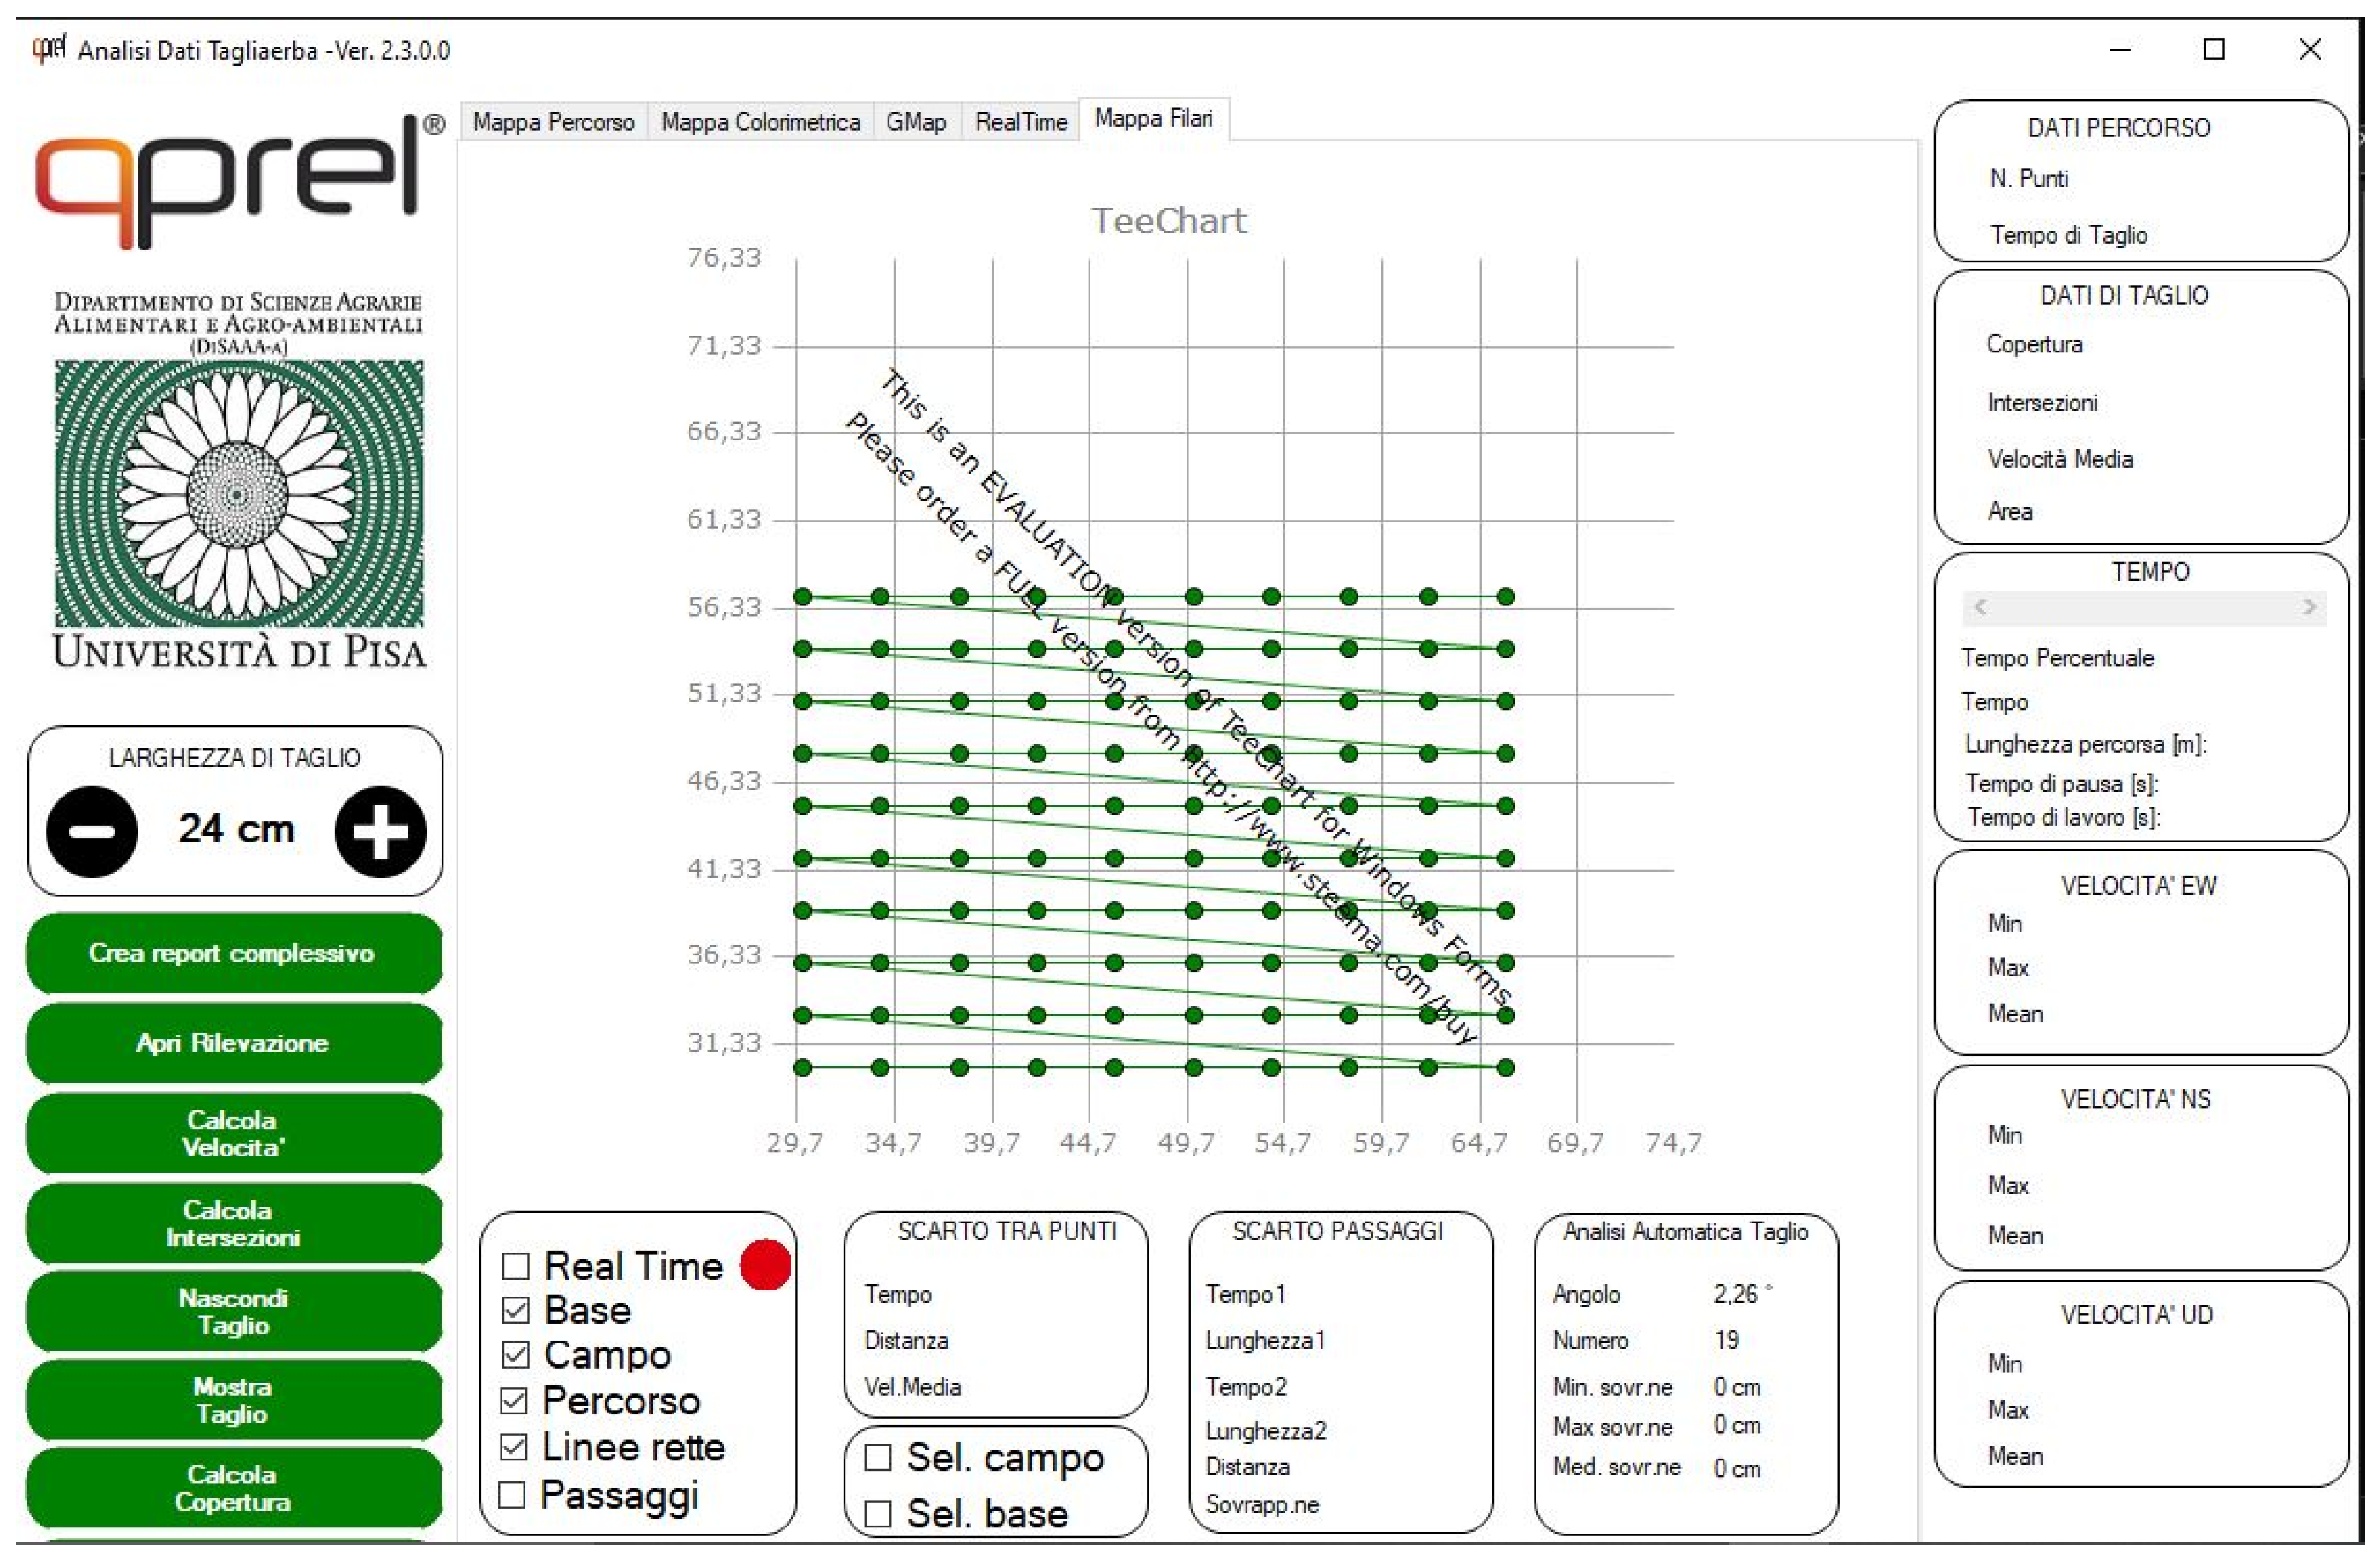
To acquire and process the data generated by the rover’s tracking devices, the “Robot mower tracking data calculator” software (version 1.8.0.0) described by Sportelli et al. [25] was integrated with the new streaming communications protocols (TCP socket) and new GNSS receivers proprietary data formats (SBF, Septentrio Binary Format). All points with low accuracy are not taken into consideration by the software. Once the data have been acquired, it is possible to view them and manually trace the cutting area of the autonomous mower and the area where the charging base is positioned (useful for calculating the device’s dwell time) (Figure 1). The software, based on the hypothesis of a systematic grass cutting process, calculates the number of parallel cuts made. The determination of a groove (angle and intercept) is carried out through linear regression between adjacent positions, assigning them to the same straight line with a maximum acceptance angle of 10°. In the software it is possible to select each acquisition point and, for each pair of selected points are calculated the cutting distance, the acquisition time difference and the average speed between the points. It is also possible to select a pair of lines to determine their relative distance and, given the cutting width of the lawnmower, the overlap in the passages. The software carries out an overall analysis of the entire job, identifying the maximum, the minimum, and the average cutting overlap of the adjacent lines; this overall analysis is displayed in the row maps section (Figure 2). It is also possible to directly acquire the streaming of the RTK rover position in real-time (Figure 3).
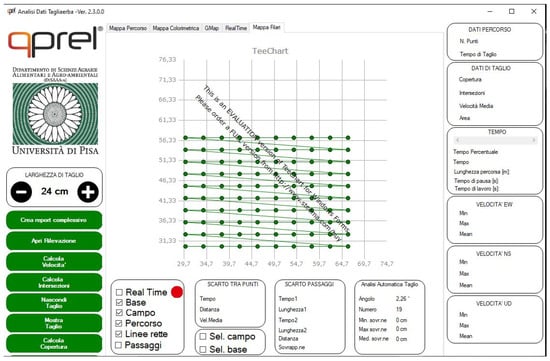
Figure 2.
New software functionality: gap between points, gap between passages, automatic analysis of cutting activity. The red dot indicates that the real time function is not active, when this function is active the dot becomes green. The green dots indicate the rover waypoints as recorded by the RTK system.
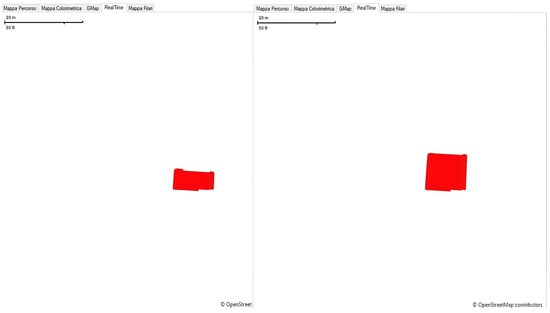
Figure 3.
Real-time window where it possible to visualize the robot position and working trajectories. In the figure it is possible to observe the progress of the robot mower trajectories (horizontal trajectories) coverage in real time. The red areas represent the trajectories of the robot mower as time passes.
To avoid the overestimation of operational data, the autonomous mower was fully recharged obtaining an interrupted data collection before each measurement. The data (coverage, distance travelled, efficiency, no cut area obtained from the Route map, and average speed, turning time, and the overlap between passages from the Row map) obtained with the software mentioned above allowed us to analyze the coverage and efficiency values of the different mowing patterns (vertical, horizontal, and diagonal) and two heights (3 cm and 6 cm). The distance traveled was selected as an operating parameter to calculate the Theoretical Cut Surface and the coverage was chosen to calculate the Actual Cut Surface. Both these values were adopted to estimate the efficiency through this equation [9]:
Work Efficiency = Actual Cut Surface/Theoretical Cut Surface
2.3. Statistical Analysis
The data of the turfgrass height (cm), percentage of area mowed (%), distance travelled (m), efficiency, speed (m/s), turning time (s), overlap between passages (cm), and no cut area (m2) were analyzed with the multivariate analysis of variance (MANOVA). The statistical analysis was conducted using the statistical software R version 4.3.2. Wilks’ lambda, Pillai’s trace, Hotelling’s trace, and Roy’s largest root were calculated to assess how the model terms contribute to the overall covariance. The least significant difference (LSD) test at 0.05 of probability was conducted. All the data analyzed mentioned above were evaluated as a function of pattern and cutting height. The pattern was used as a factor with 3 levels (vertical, horizontal, diagonal), cutting height as a factor with 2 levels (minimum—3 cm—and maximum—6 cm). The “ggplot2” package was used to generate graphs.
3. Results
Operative Parameters Analysis
Multivariate analysis of variance revealed that the mowing pattern (p = 0.038) and the cutting height (p = 9.621 × 10⁻⁶) significantly affected the turfgrass height. Also, the interaction between the mowing pattern and cutting height had a significant effect on the turfgrass height (p = 0.004). Multivariate analysis of variance revealed that the mowing pattern and the cutting height significantly affected the coverage (respectively, p = 9.213 × 10⁻⁶ and p = 1.038 × 10⁻³), the actual mowed area (respectively, p = 9.213 × 10⁻⁶ and p = 1.038 × 10⁻³), the theoretical mowed area (respectively, p = 2.773 × 10⁻¹¹ and p = 2.000 × 10⁻⁵), the efficiency (respectively, p = 8.796 × 10⁻²⁷ and p = 2.070 × 10⁻¹⁸), and the distance travelled (respectively, p = 2.773 × 10⁻¹¹ and p = 2.000 × 10⁻⁵). Also, the interaction between the mowing pattern and cutting height had a significant effect on all the above mentioned parameters (Table 1).

Table 1.
Mean square, F value, p value of MANOVA conducted on the parameter indagated in function of cutting height, mowing pattern, and their interaction.
The analyzed data concerning speed, turning time, overlapping, and no cut area were obtained through the new custom-built software row map. Multivariate analysis of variance revealed that the mowing pattern had a significant effect on the speed (5.513 × 10⁻7), the turning time at the end of each row (2.950 × 10⁻3), and the overlapping (p = 4.459 × 10⁻3). The cutting height significantly affected the speed (1.392 × 10⁻3), the turning time (p = 1.400 × 10⁻6), and the overlapping (p = 3.884 × 10⁻2). The interaction between the mowing pattern and cutting height had a significant effect on the overlapping (p = 4.632 × 10⁻2) and the no cut area (3.695 × 10⁻2).
The mean value of turfgrass height in the function of the type of mowing pattern revealed how turfgrass is lower in the areas mowed by diagonal mowing pattern (2.98 cm), and the highest value was detected in areas mowed by vertical mowing patterns (3.72 cm) (Figure 4a). The lowest mean value of height was detected in areas mowed by the lowest cutting height (2.56 cm) compared to the highest one (4.17 cm). The mean value of height in function of the interaction between mowing pattern and mowing height revealed how turfgrass height was lower in areas mowed by horizontal pattern with the lowest cutting height (2.33 cm) and diagonal pattern with the lowest cutting height (1.80 cm) (Figure 4b).
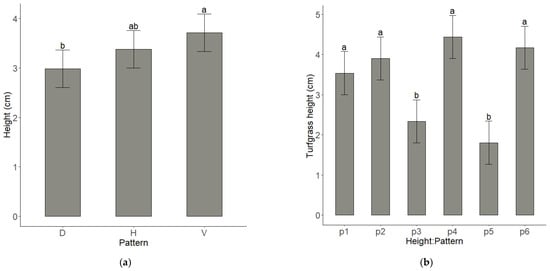
Figure 4.
(a) Effect of pattern on the turfgrass height. (b) Effect of the interaction between cutting height (indicated in the figure as “height”) and pattern on turfgrass height. Means denoted by different letters indicate statistically significant differences at p < 0.05 (LSD test), these letters are located above the upper confidence limit. LCL (Lower Confidence Limit) and UCL (Upper Confidence Limit) are reported. p1: vertical pattern with the lowest cutting height; p2: vertical pattern with the highest cutting height; p3: horizontal pattern with the lowest cutting height; p4: horizontal pattern with the highest cutting height; p5: diagonal pattern with the lowest cutting height; p6: diagonal pattern with the highest cutting height. D: diagonal pattern; H: horizontal pattern; V: vertical pattern.
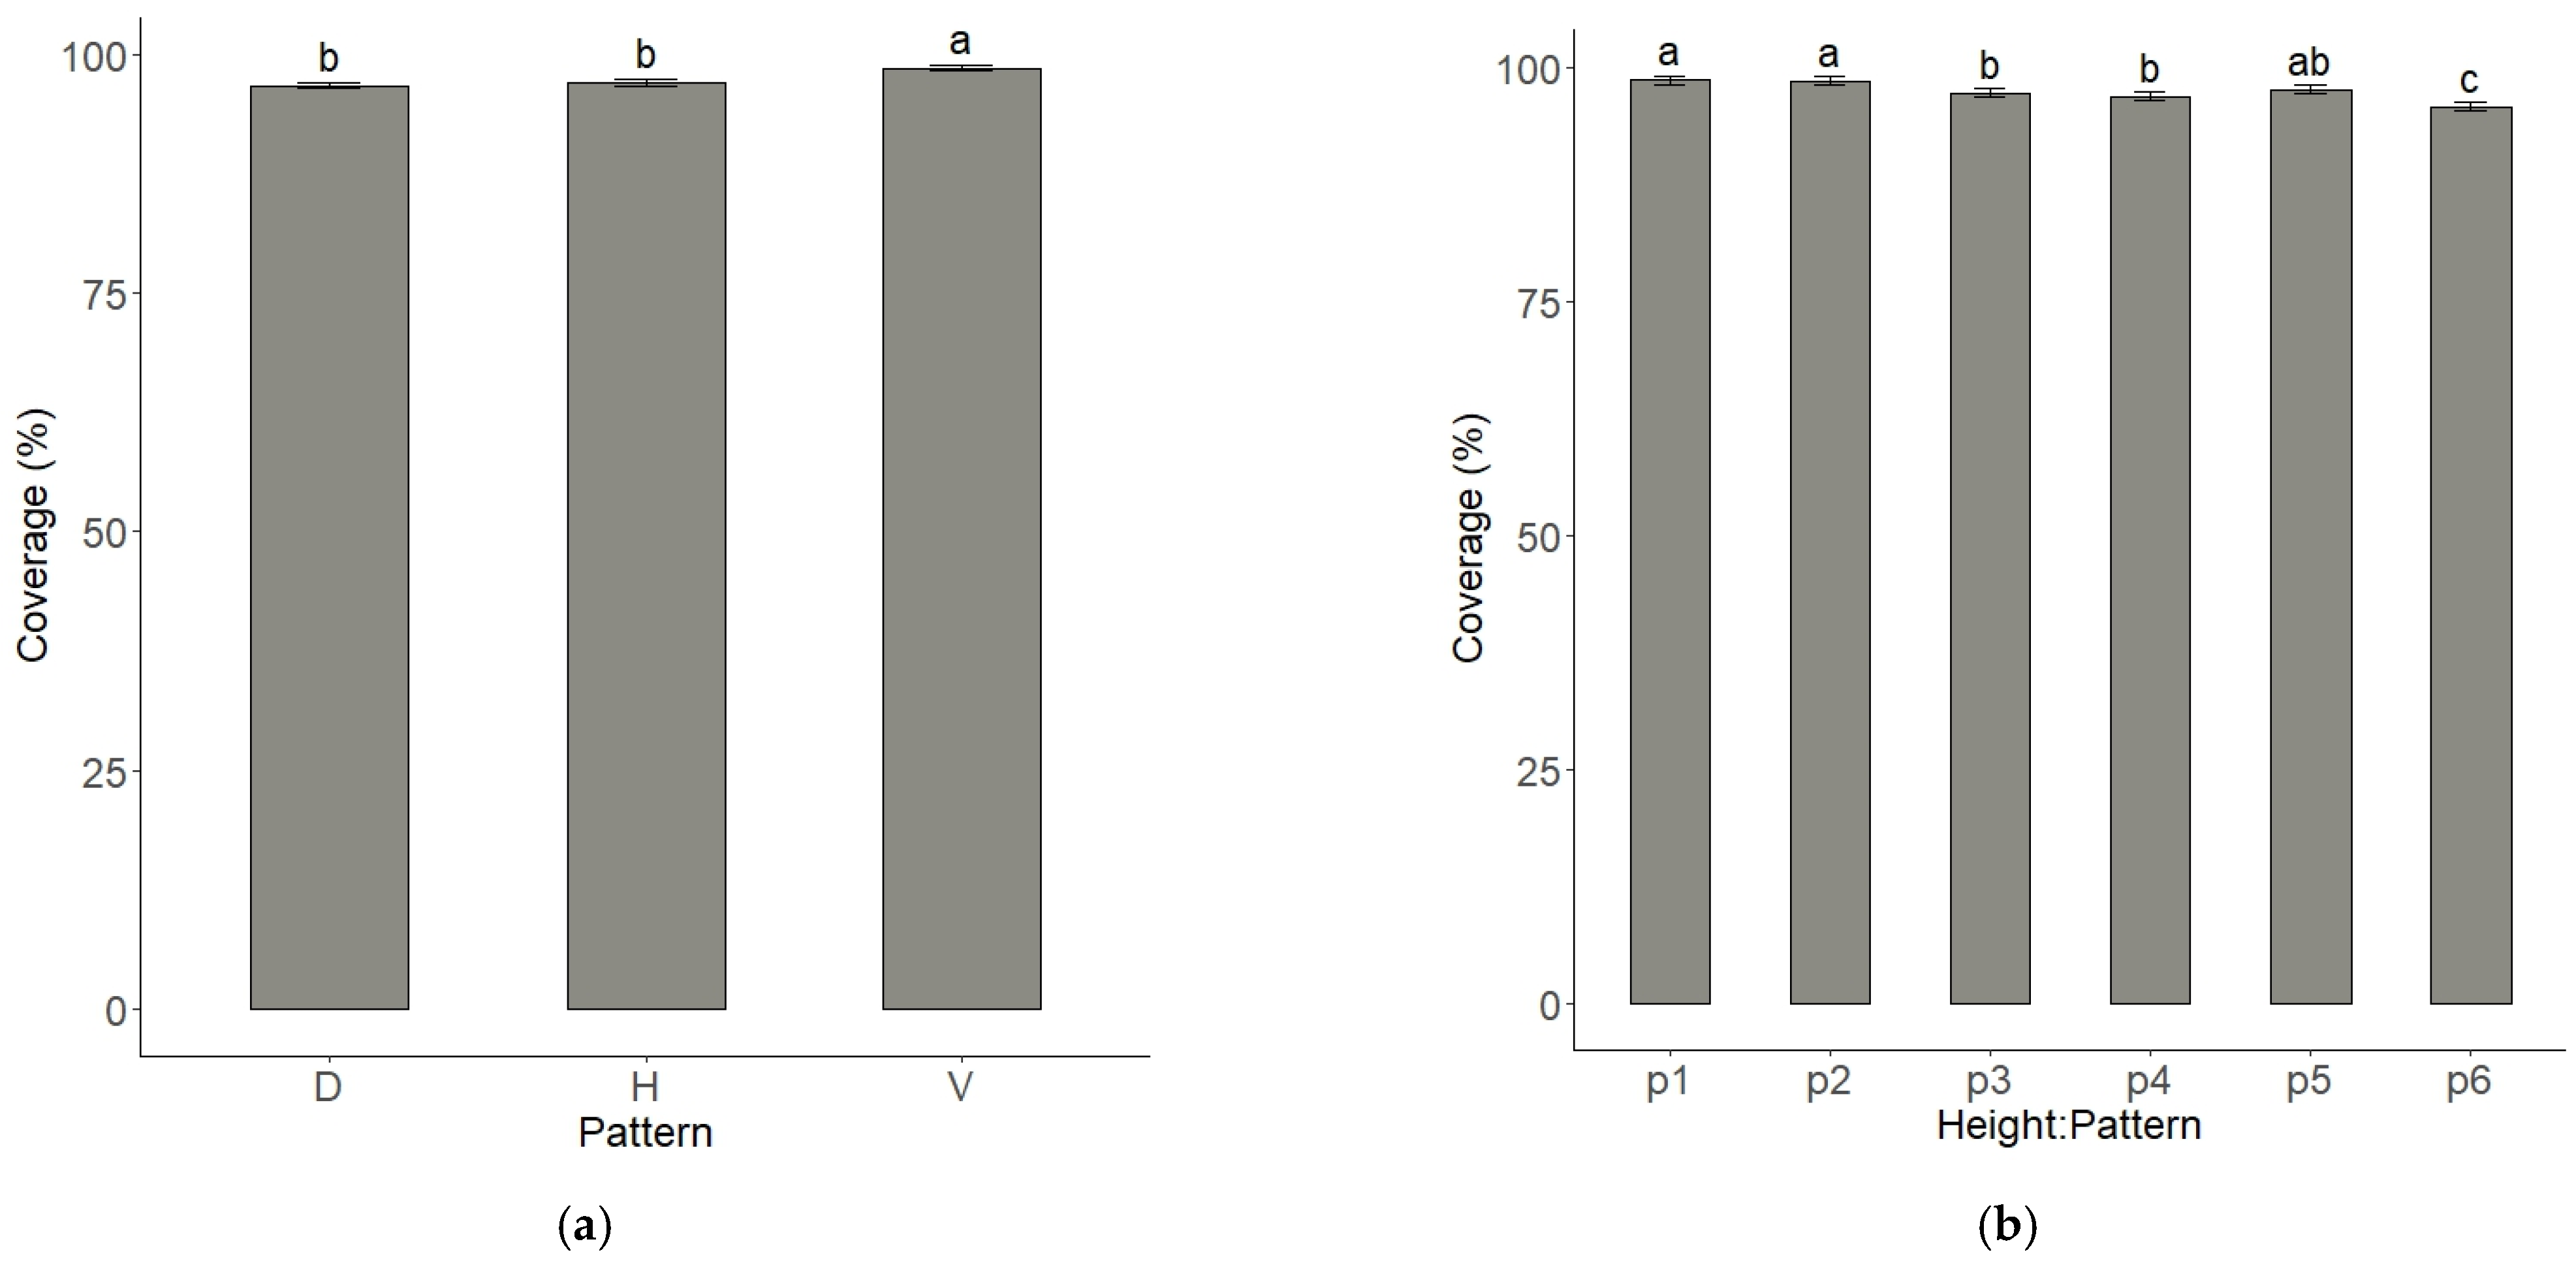
The mean value of coverage in the function of the type of mowing pattern revealed how coverage is higher in the areas mowed by the vertical mowing pattern (98.57%), followed by ones mowed by the horizontal mowing pattern (97.05%) and the diagonal mowing pattern (96.72%) (Figure 5a). The lowest mean value of coverage was detected in areas mowed by the highest cutting height (97.06%) compared to the lowest one (97.83%). The mean value of coverage in function of the interaction between the mowing pattern and mowing height revealed how coverage was higher in areas mowed by vertical mowing pattern (98.62%—lowest cutting height, and 98.53%—highest cutting height), the lowest one was detected in areas mowed by the diagonal pattern with the highest cutting height (95.78%) (Figure 5b).

Figure 5.
(a) Effect of pattern on the percentage of area covered. (b) Effect of the interaction between cutting height (indicated in the figure as “height”) and pattern on percentage of area covered. Means denoted by different letters indicate statistically significant differences at p < 0.05 (LSD test), these letters are located above the upper confidence limit. LCL (Lower Confidence Limit) and UCL (Upper Confidence Limit) are reported. p1: vertical pattern with the lowest cutting height; p2: vertical pattern with the highest cutting height; p3: horizontal pattern with the lowest cutting height; p4: horizontal pattern with the highest cutting height; p5: diagonal pattern with the lowest cutting height; p6: diagonal pattern with the highest cutting height. D: diagonal pattern; H: horizontal pattern; V: vertical pattern.
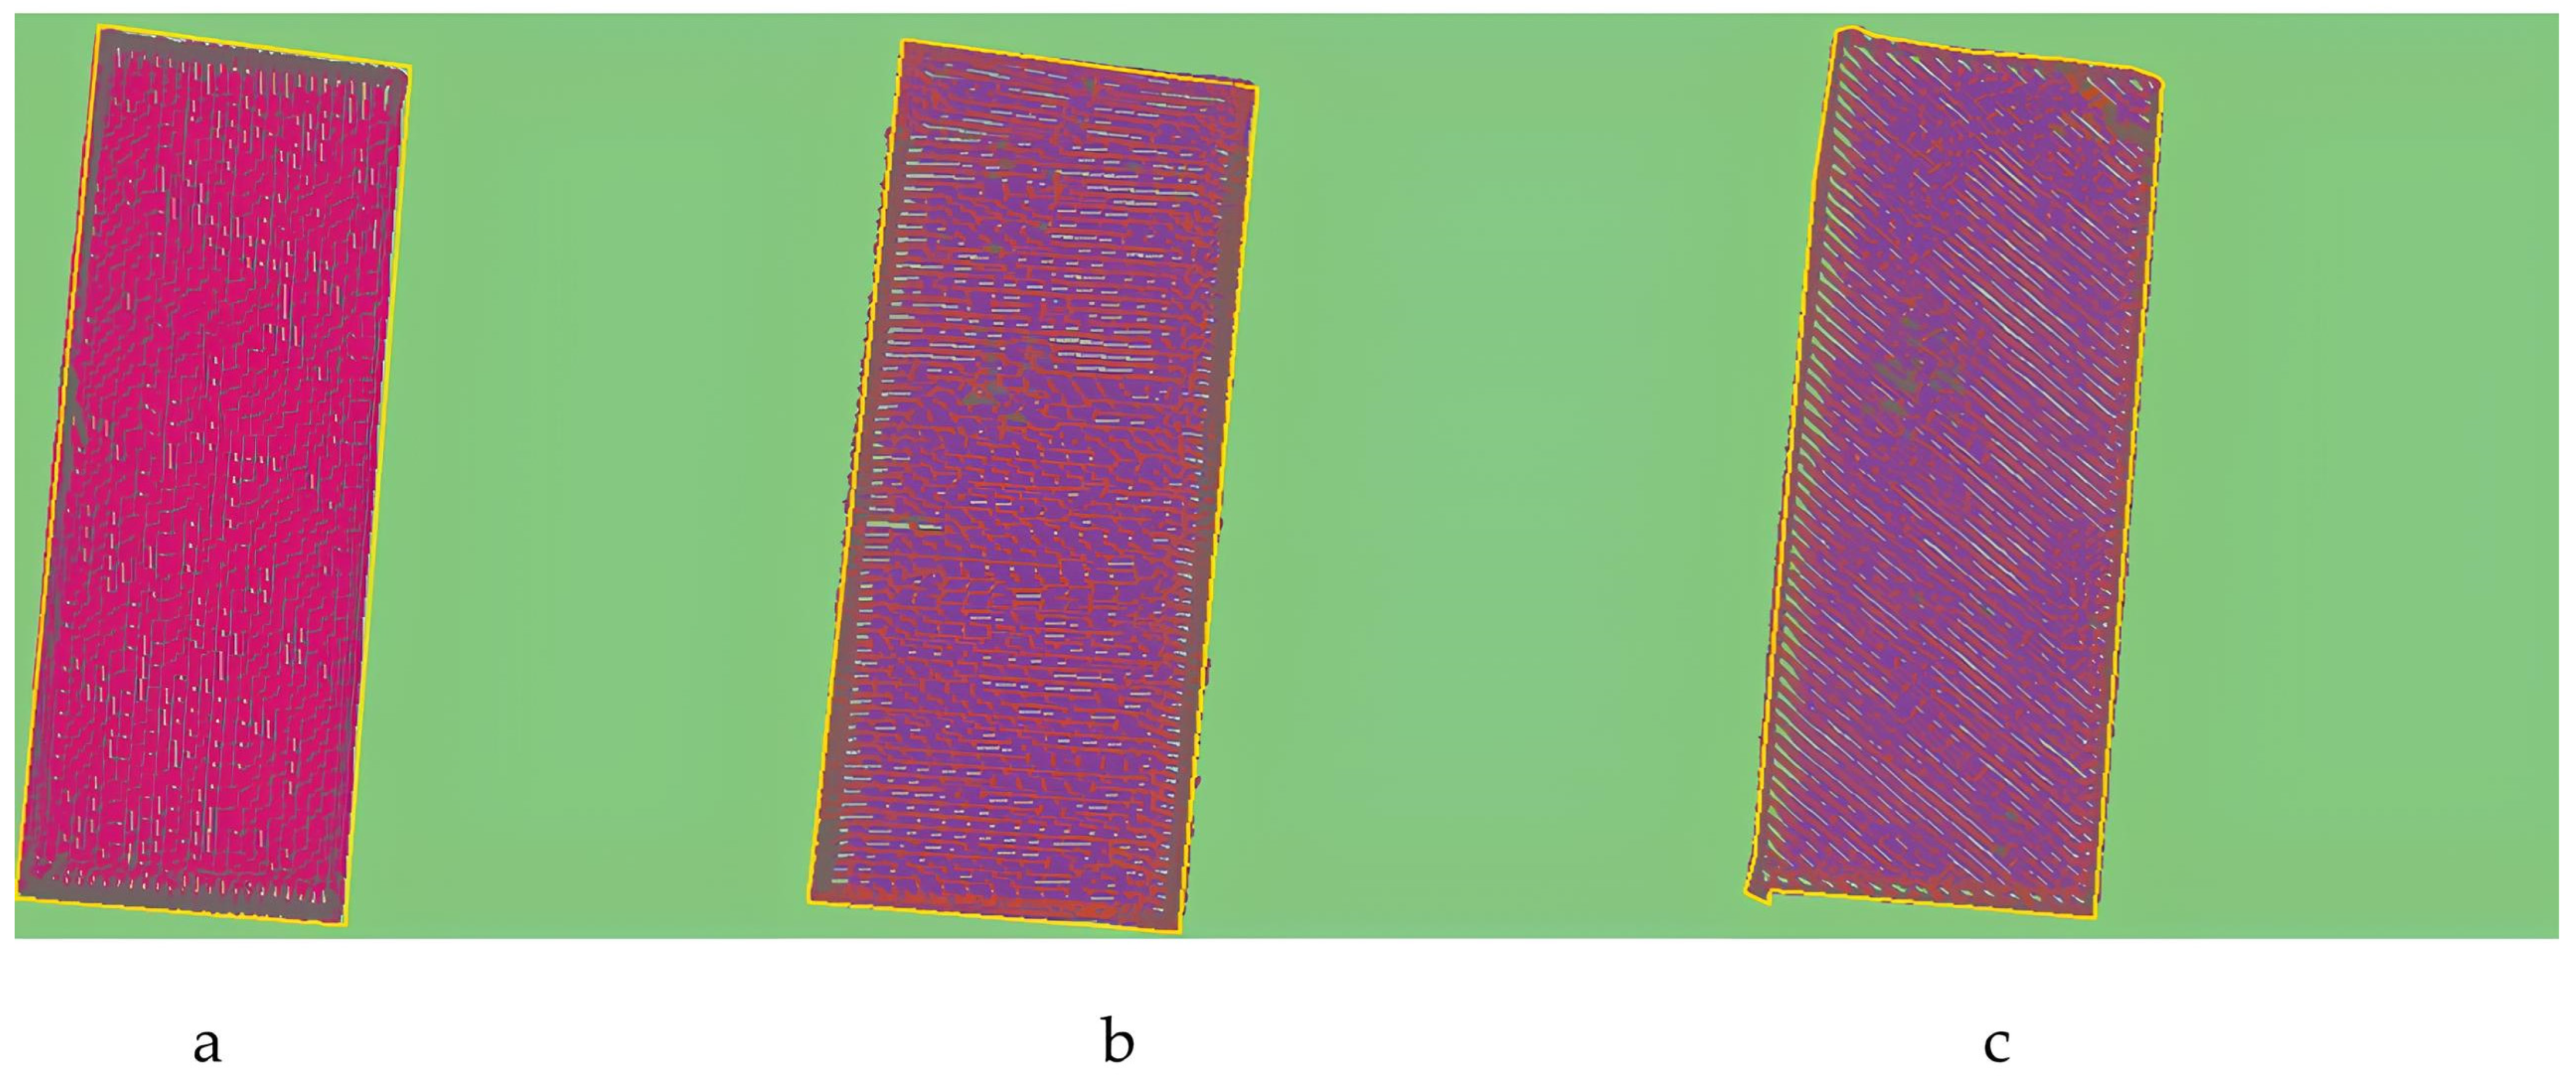
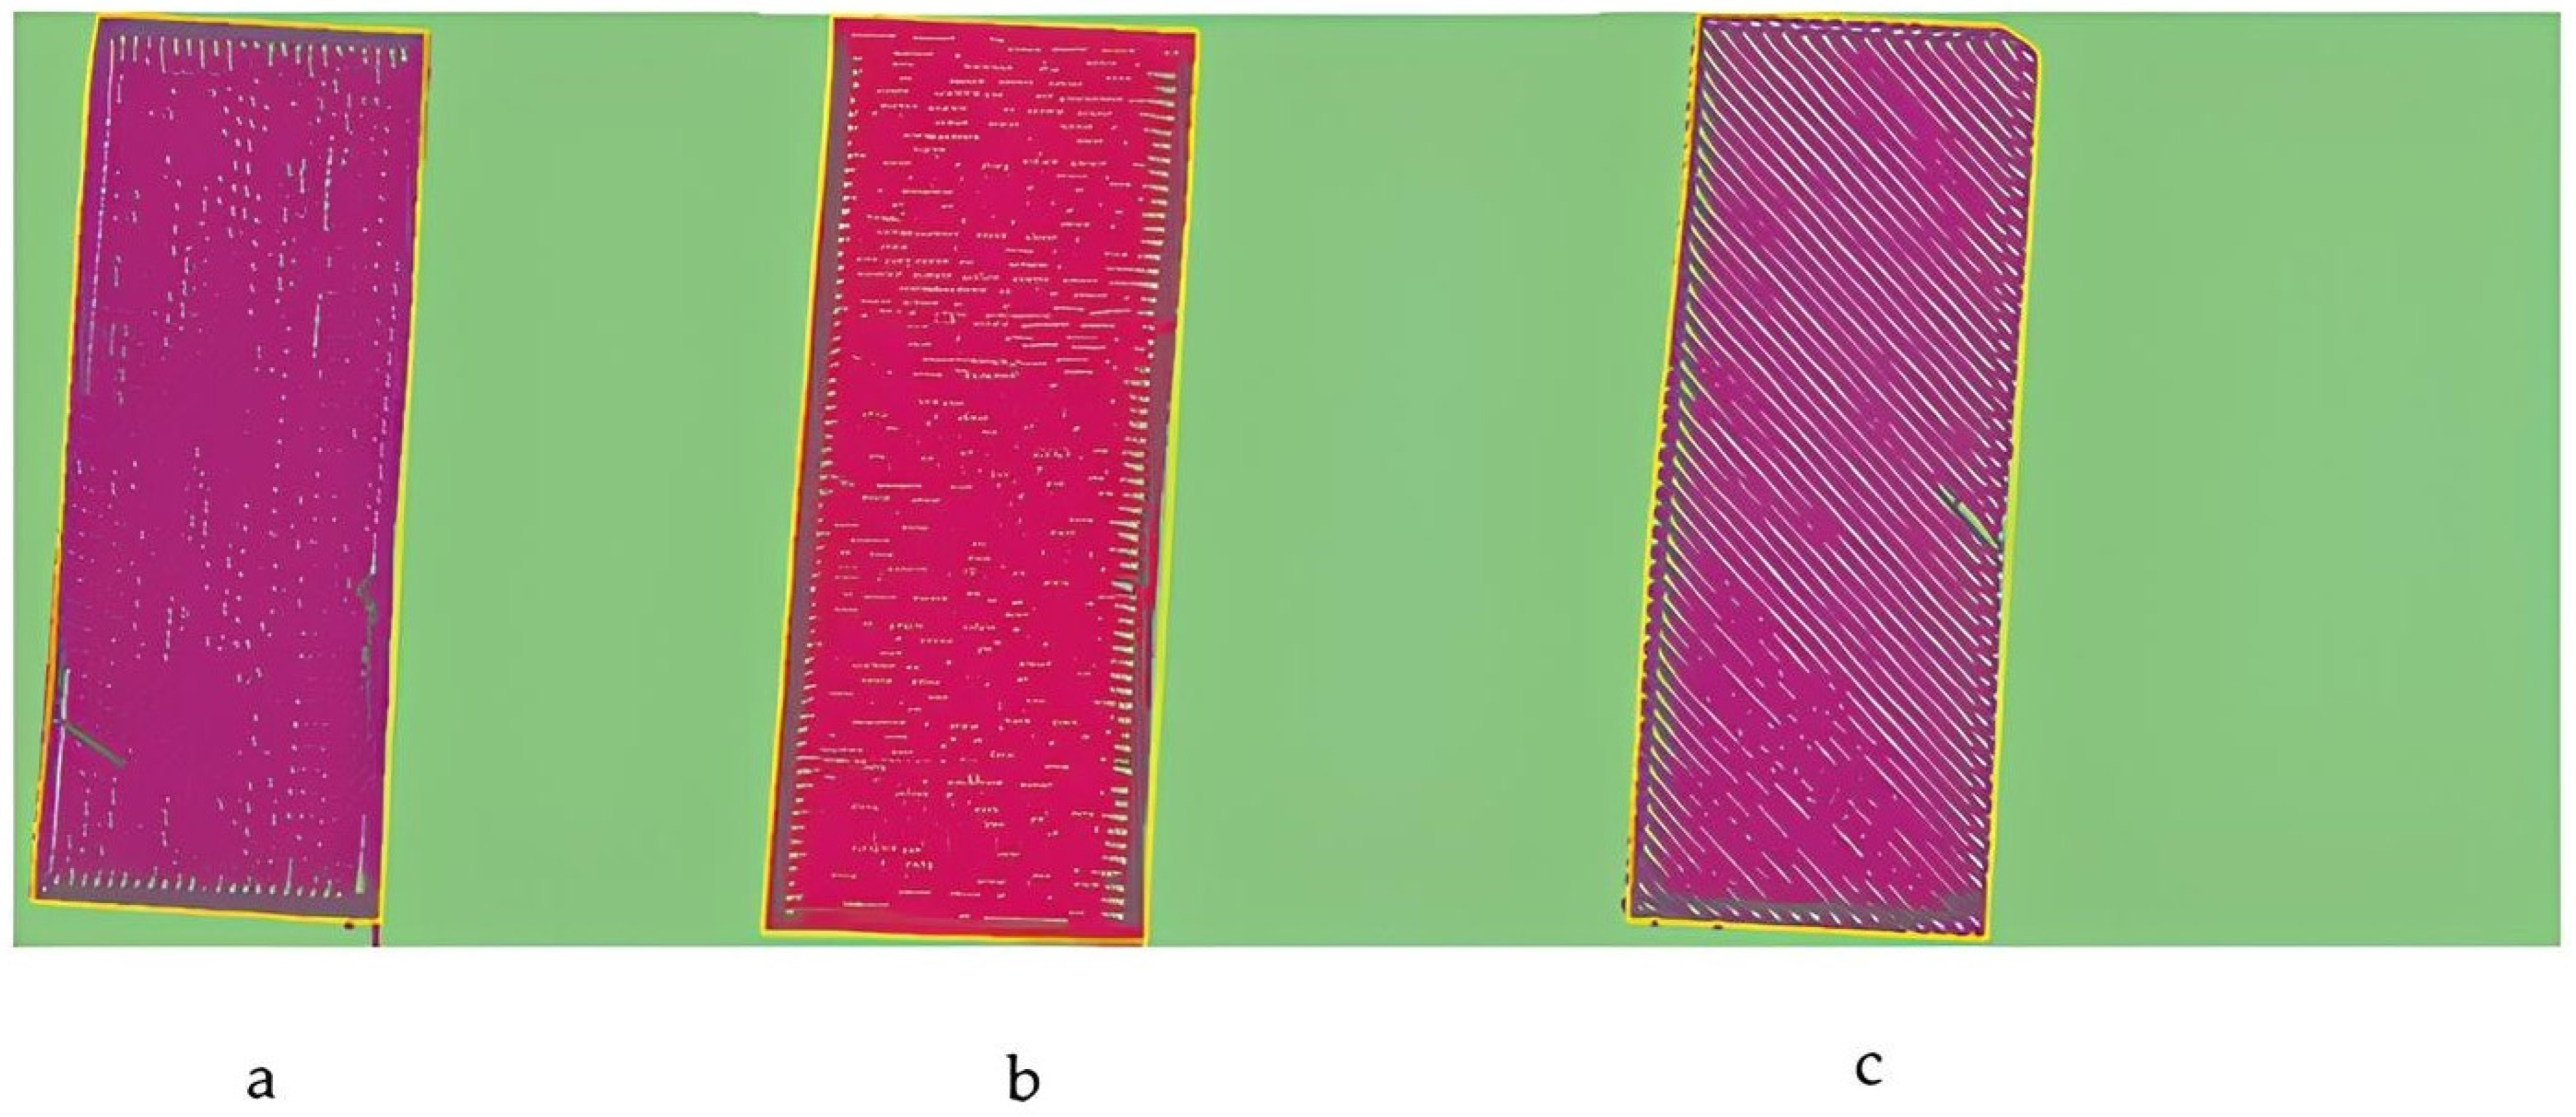
Figure 6 reported visual examples for each mowing pattern with the lowest cutting height (3 cm) of the colorimetric map created by the custom-built software. Figure 7 reported visual examples for each mowing pattern with the highest cutting height (6 cm) of the colorimetric map created by the custom-built software. Darker areas mean higher trampling levels, and the green zones are areas not covered by the autonomous mower. This aspect is explained by the colorimetric scale correlated to the number of passages and trampling activity shown in Figure 8 contained in the software colorimetric map window.

Figure 6.
Colorimetric maps showing the number of passages and the trajectories of the autonomous mower different patterns with the lowest cutting height: (a) vertical, (b) horizontal, (c) diagonal. Darker areas mean higher trampling. Green areas within the cutting areas, are the zones did not trample by the autonomous mower.
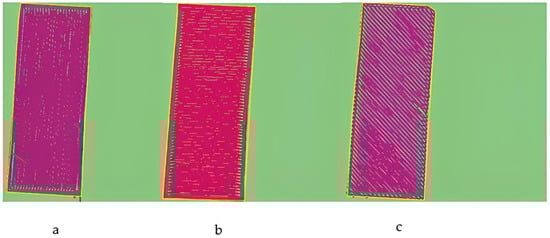
Figure 7.
Colorimetric maps showing the number of passages and the trajectories of the autonomous mower different patterns with the highest cutting height: (a) vertical, (b) horizontal, (c) diagonal. Darker areas mean higher trampling. Green areas within the cutting areas, are the zones did not trample by the autonomous mower.

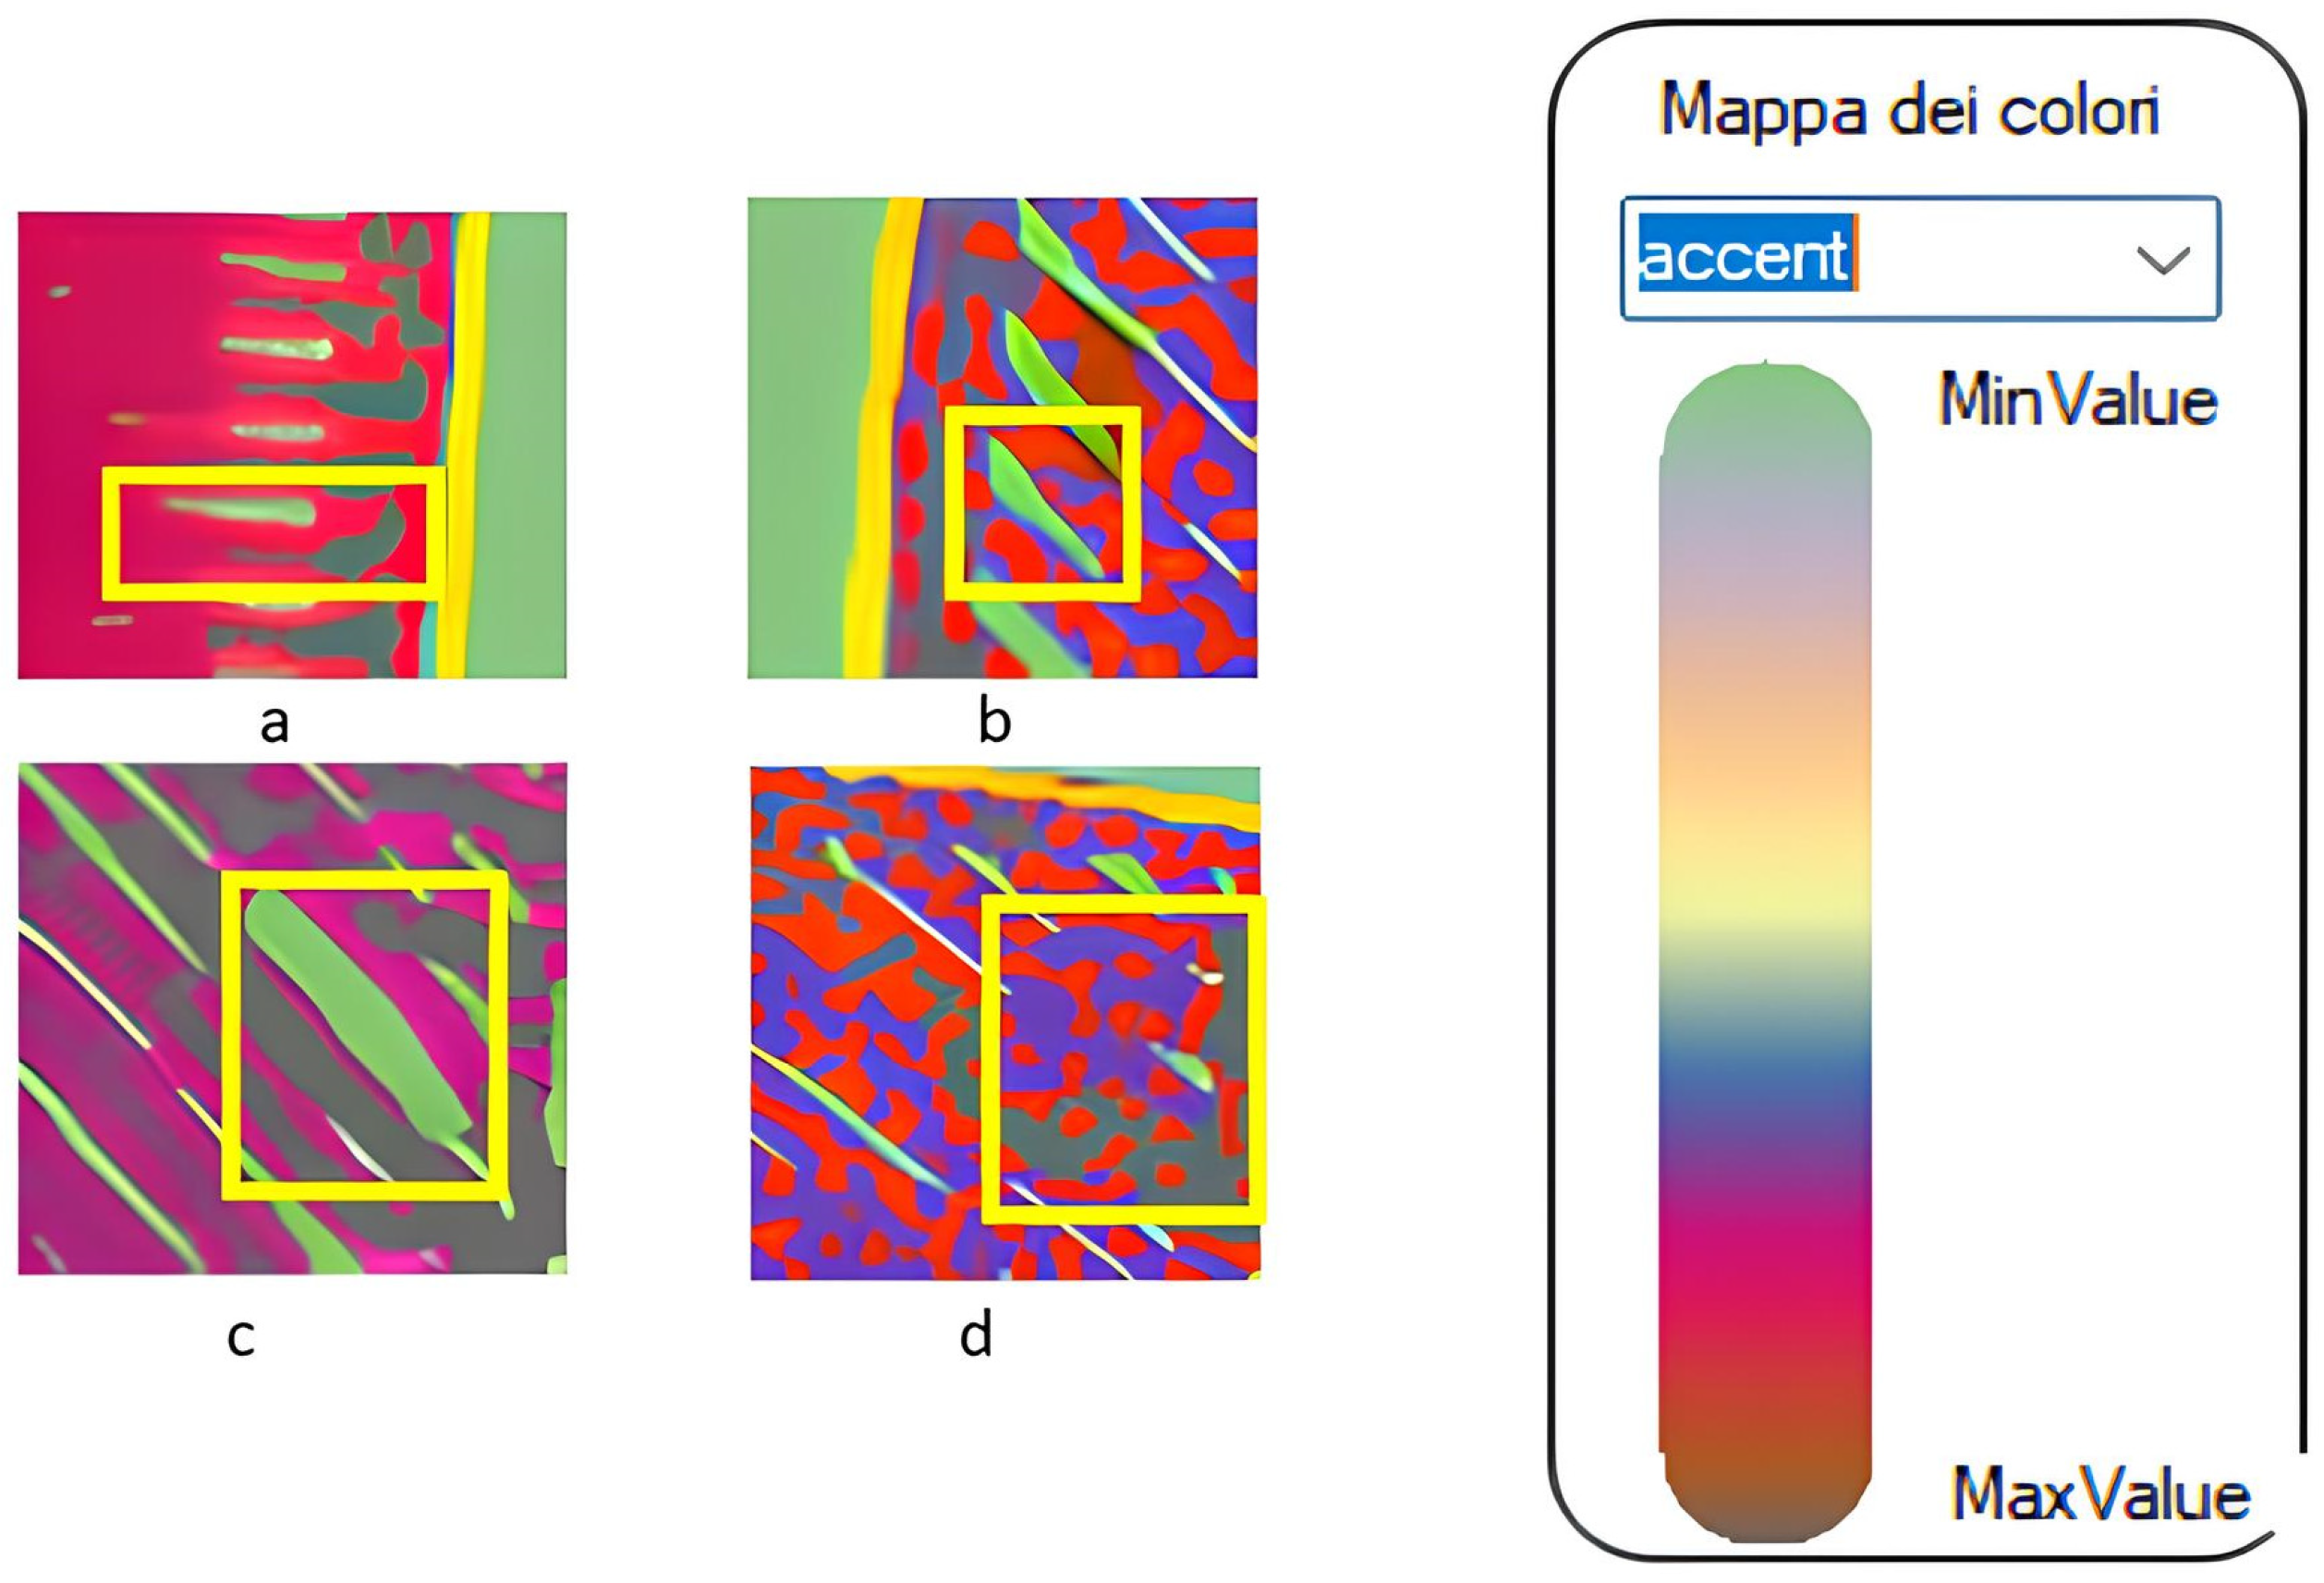
Figure 8.
Local magnification of areas characterized by (a) a higher trampling level zone and no cut turning area (horizontal pattern with the highest cutting height), (b) no cut turning area (diagonal pattern with the highest cutting height), (c) no cut area in the linear trajectory of diagonal pattern (diagonal pattern with the highest cutting height), (d) area characterized by higher trampling level and overlapping (diagonal pattern with the lowest cutting height). Details of each type of area (a–d) are highlighted by yellow rectangles. On the right, the colorimetric scale of the colorimetric map is shown, the color near to the max value means a high level of trampling activity and the correlated number of passages.
Within the colorimetric maps it was possible to observe areas characterized by higher trampling activity, overlapping areas, and areas which were not cut by the robot mower. These areas are shown in Figure 8.
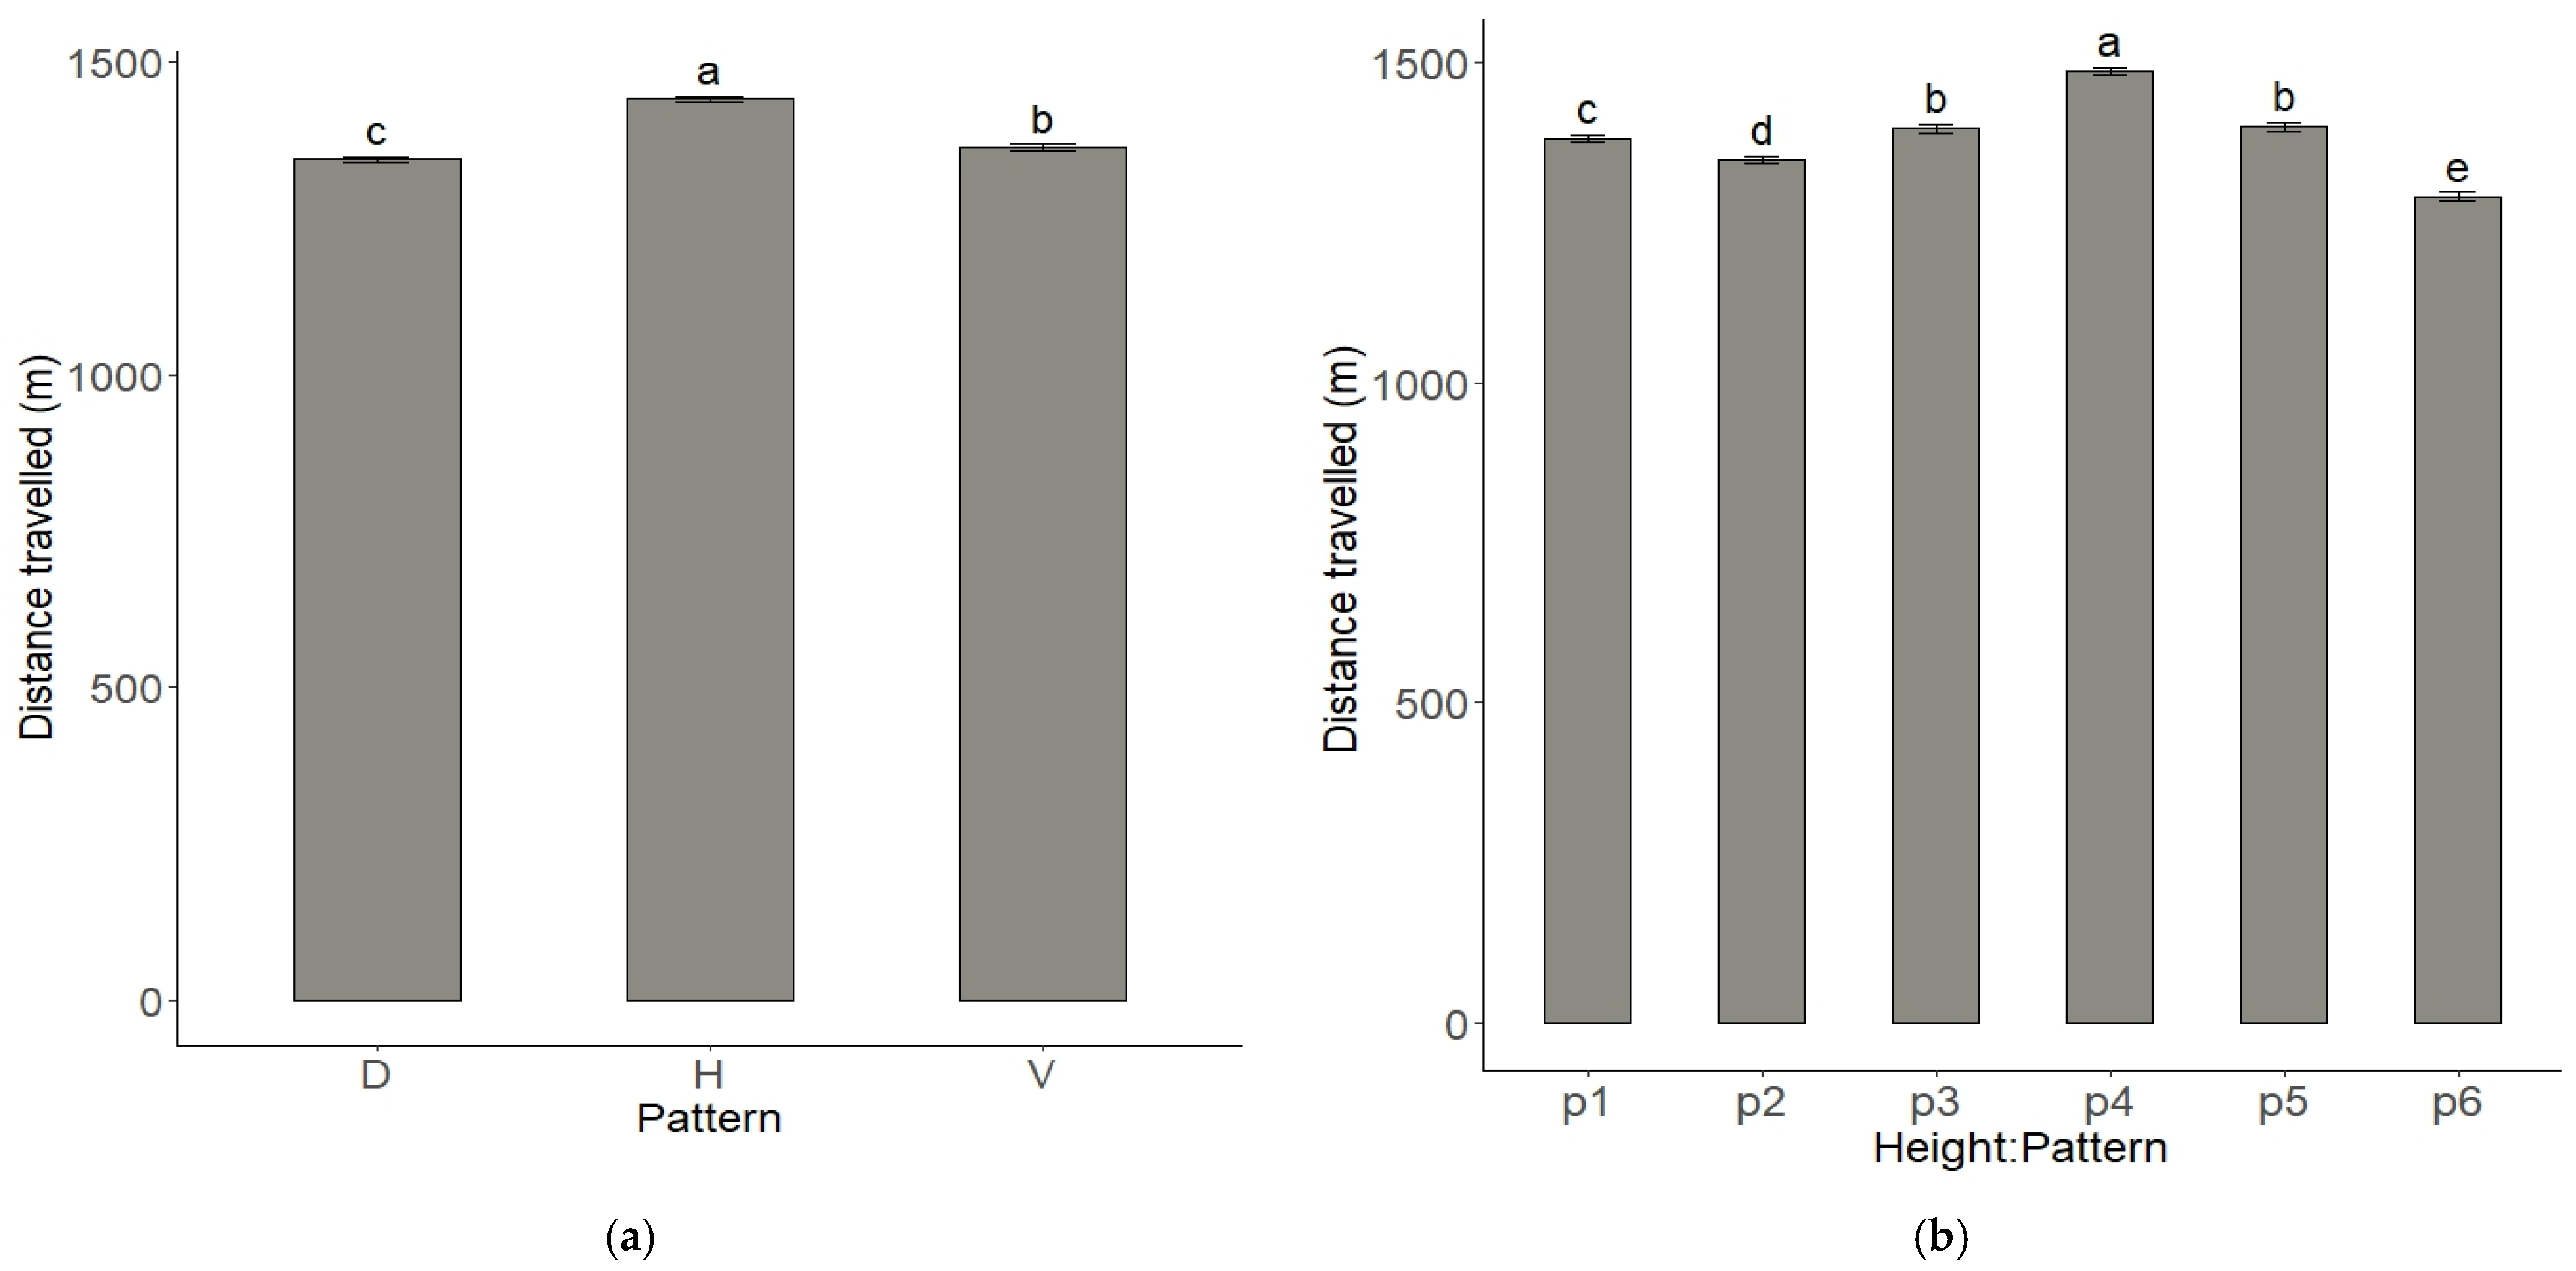
The mean value of distance travelled in the function of the type of mowing pattern revealed how distance travelled is higher in the areas mowed by the horizontal mowing pattern (1440.935 m), followed by ones mowed by the vertical mowing pattern (1364.118 m) and the diagonal mowing pattern (1344.599 m) (Figure 9a). The lowest mean value of distance travelled in function of cutting height was detected in areas mowed by the highest cutting height (1374.477 m) compared to the one mowed by the lowest cutting height (1391.957 m). The mean value of distance travelled in the function of the interaction between cutting height and mowing pattern is higher in the areas mowed by the horizontal mowing pattern with the highest cutting height (1485.676 m) and lower in the areas mowed by the diagonal mowing pattern with the higher cutting height (1290.092 m) (Figure 9b).
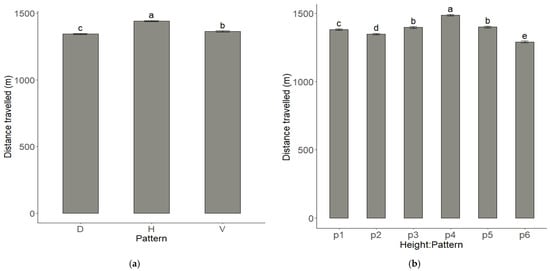
Figure 9.
(a) Effect of pattern on the distance travelled. (b) Effect of the interaction between cutting height (indicated in the figure as “height”) and pattern on distance travelled. Means denoted by different letters indicate statistically significant differences at p < 0.05 (LSD test), these letters are located above the upper confidence limit. LCL (Lower Confidence Limit) and UCL (Upper Confidence Limit) are reported. p1: vertical pattern with the lowest cutting height; p2: vertical pattern with the highest cutting height; p3: horizontal pattern with the lowest cutting height; p4: horizontal pattern with the highest cutting height; p5: diagonal pattern with the lowest cutting height; p6: diagonal pattern with the highest cutting height. D: diagonal pattern; H: horizontal pattern; V: vertical pattern.
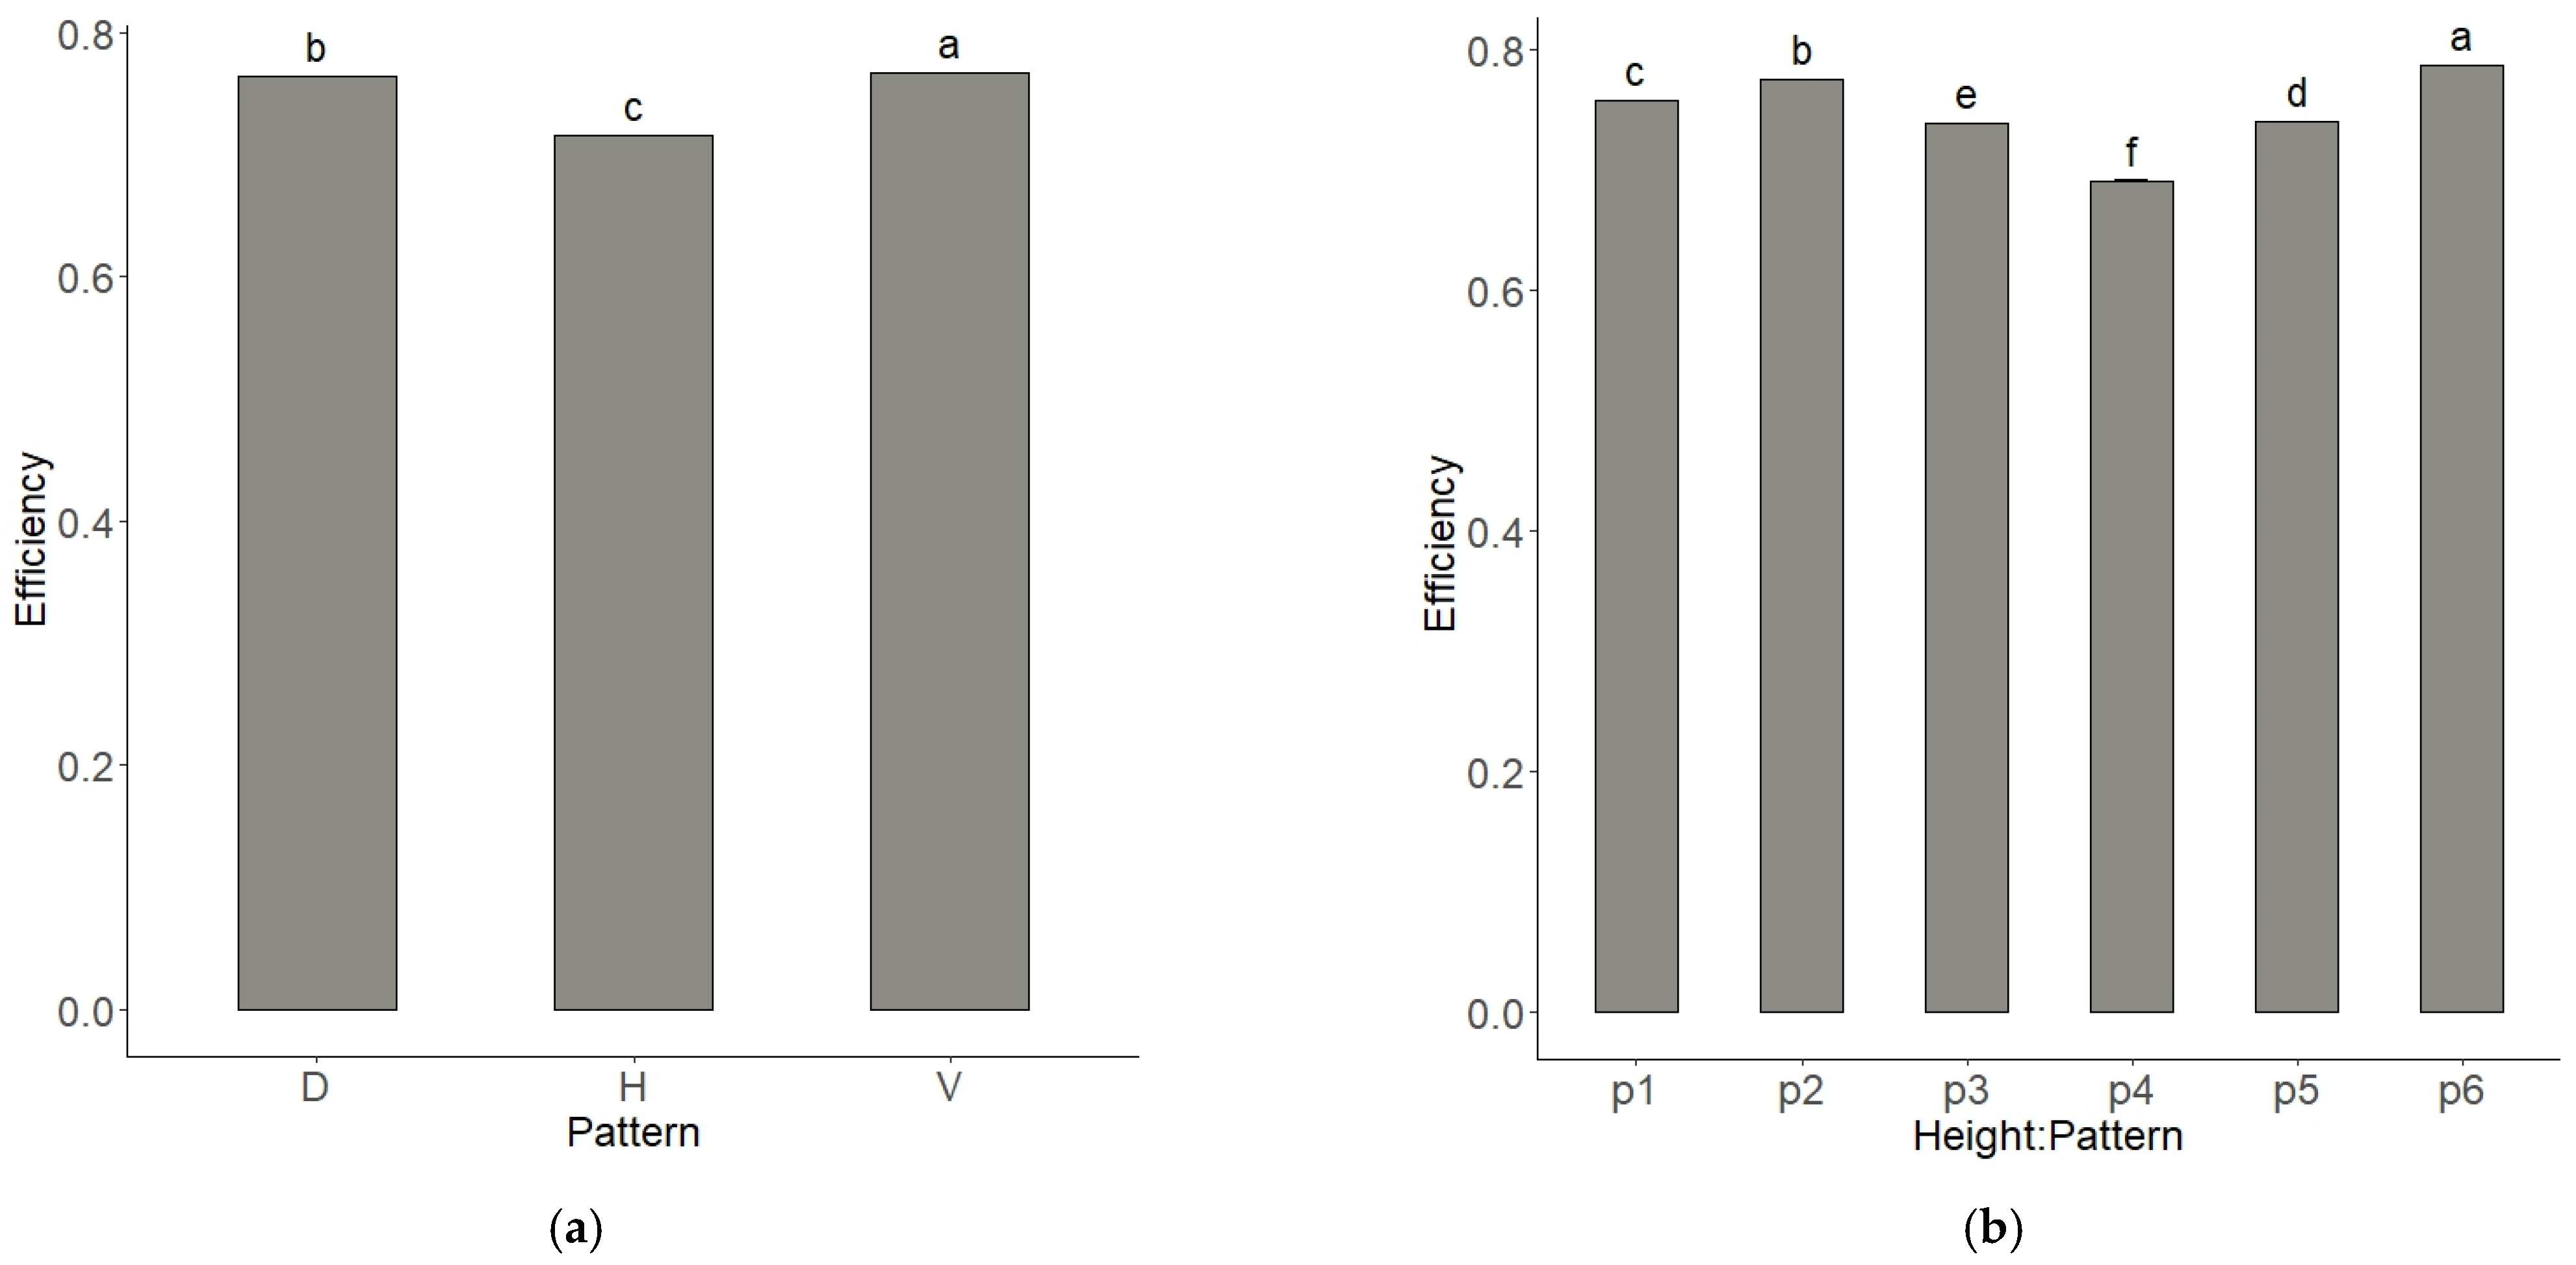
The mean value of efficiency in the function of the type of mowing pattern revealed how efficiency is higher in the areas mowed by the vertical mowing pattern (0.766), followed by the ones mowed by the diagonal mowing pattern (0.764) and the horizontal mowing pattern (0.715) (Figure 10a). The lowest mean value of efficiency was detected in areas mowed by the lowest cutting height (0.74) compared to the highest one (0.75). The mean value of efficiency in function of the interaction between mowing pattern and mowing height revealed how efficiency was higher in areas mowed by the diagonal pattern with the highest height (0.79), the lowest one was detected in areas mowed by the horizontal pattern with the highest cutting height (0.69) (Figure 10b).
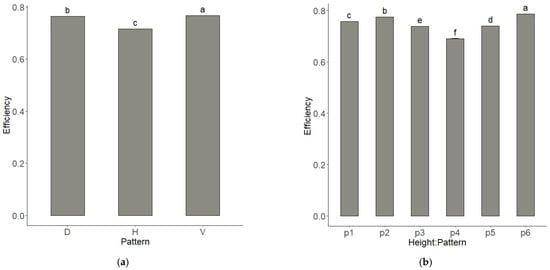
Figure 10.
(a) Effect of pattern on efficiency. (b) Effect of the interaction between cutting height (indicated in the figure as “height”) and pattern on efficiency. Means denoted by different letters indicate statistically significant differences at p < 0.05 (LSD test), these letters are located above the upper confidence limit. LCL (Lower Confidence Limit) and UCL (Upper Confidence Limit) are reported. p1: vertical pattern with the lowest cutting height; p2: vertical pattern with the highest cutting height; p3: horizontal pattern with the lowest cutting height; p4: horizontal pattern with the highest cutting height; p5: diagonal pattern with the lowest cutting height; p6: diagonal pattern with the highest cutting height. D: diagonal pattern; H: horizontal pattern; V: vertical pattern.
The mean value of speed in the function of the type of mowing pattern revealed how speed is higher in the areas mowed by the vertical mowing pattern (0.52 m/s); no differences are detected in areas mowed by the diagonal mowing pattern (0.39 m/s) and horizontal mowing pattern (0.38 m/s) (Figure 11a). The lowest mean value of speed was detected in areas mowed by the lowest cutting height (0.41 m/s) compared to the highest one (0.45 m/s). The mean value of turning time in function of mowing pattern revealed how the turning time is higher in areas mowed by the horizontal mowing pattern (6.13 s). No differences are detected in areas mowed by the diagonal (5.08 s) and vertical mowing patterns (5.00 s) (Figure 11b). The lowest mean value of turning time was detected in areas mowed by the lowest cutting height (4.109 s) compared to the highest one (6.570 s).
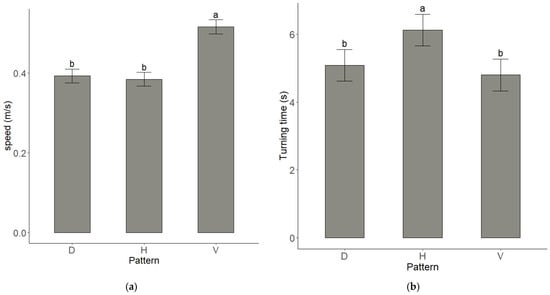
Figure 11.
(a) Effect of pattern on speed. (b) Effect of the pattern on speed. Means denoted by different letters indicate statistically significant differences at p < 0.05 (LSD test), these letters are located above the upper confidence limit. LCL (Lower Confidence Limit) and UCL (Upper Confidence Limit) are reported. D: diagonal pattern; H: horizontal pattern; V: vertical pattern.
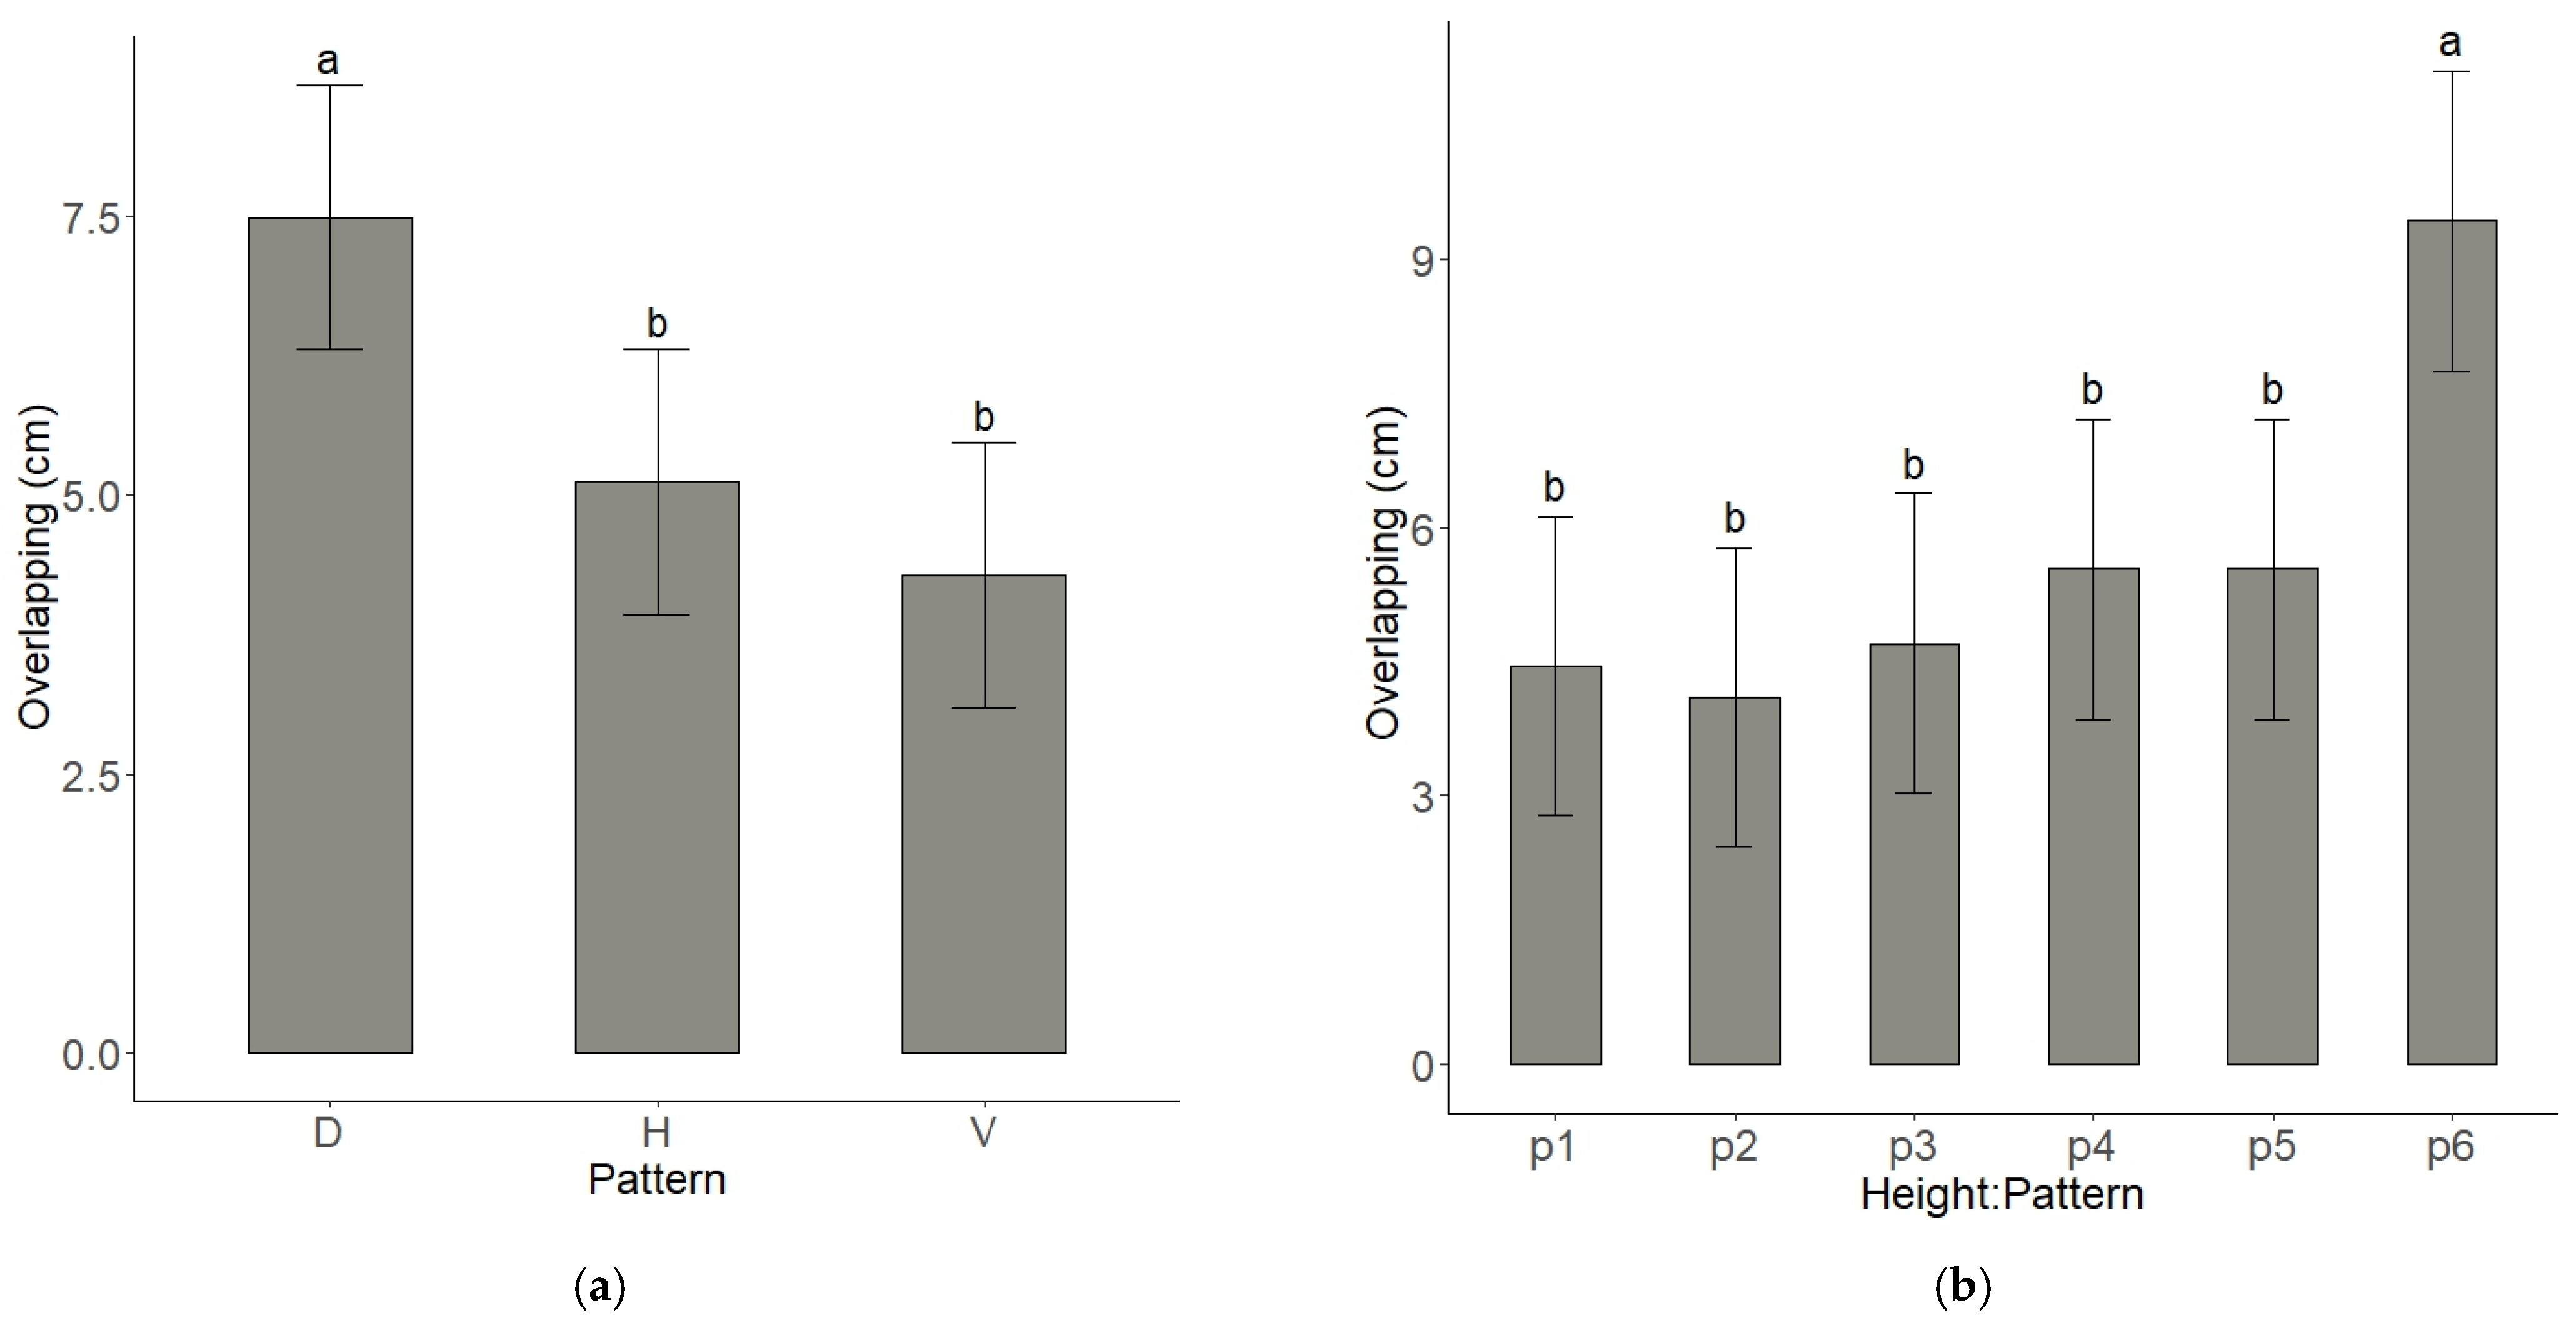
The mean value of overlapping in the function of the type of mowing pattern revealed how overlapping is higher in the areas mowed by the diagonal mowing pattern (7.48 cm); no differences are detected in plots mowed by the vertical mowing pattern (4.27 cm) and horizontal mowing pattern (5.12 cm) (Figure 12a). The lowest mean value of overlapping was detected in areas mowed by the lowest cutting height (4.90 cm) compared to the highest one (6.36 cm). The mean value of overlapping in the function of the mowing pattern and mowing height revealed how the overlapping is higher in areas mowed by the diagonal pattern with highest cutting height (9.43 cm) (Figure 12b).
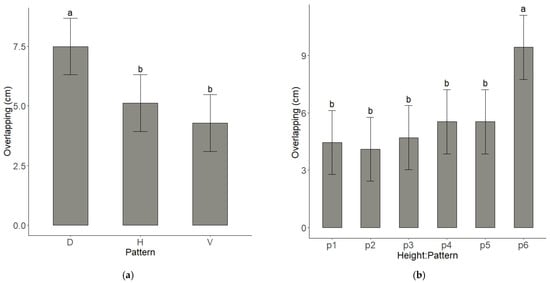
Figure 12.
(a) Effect of pattern on overlapping. (b) Effect of the interaction between cutting height (indicated in the figure as “height”) and pattern on overlapping. Means denoted by different letters indicate statistically significant differences at p < 0.05 (LSD test) these letters are located above the upper confidence limit. LCL (Lower Confidence Limit) and UCL (Upper Confidence Limit) are reported. p1: vertical pattern with the lowest cutting height; p2: vertical pattern with the highest cutting height; p3: horizontal pattern with the lowest cutting height; p4: horizontal pattern with the highest cutting height; p5: diagonal pattern with the lowest cutting height; p6: diagonal pattern with the highest cutting height. D: diagonal pattern; H: horizontal pattern; V: vertical pattern.
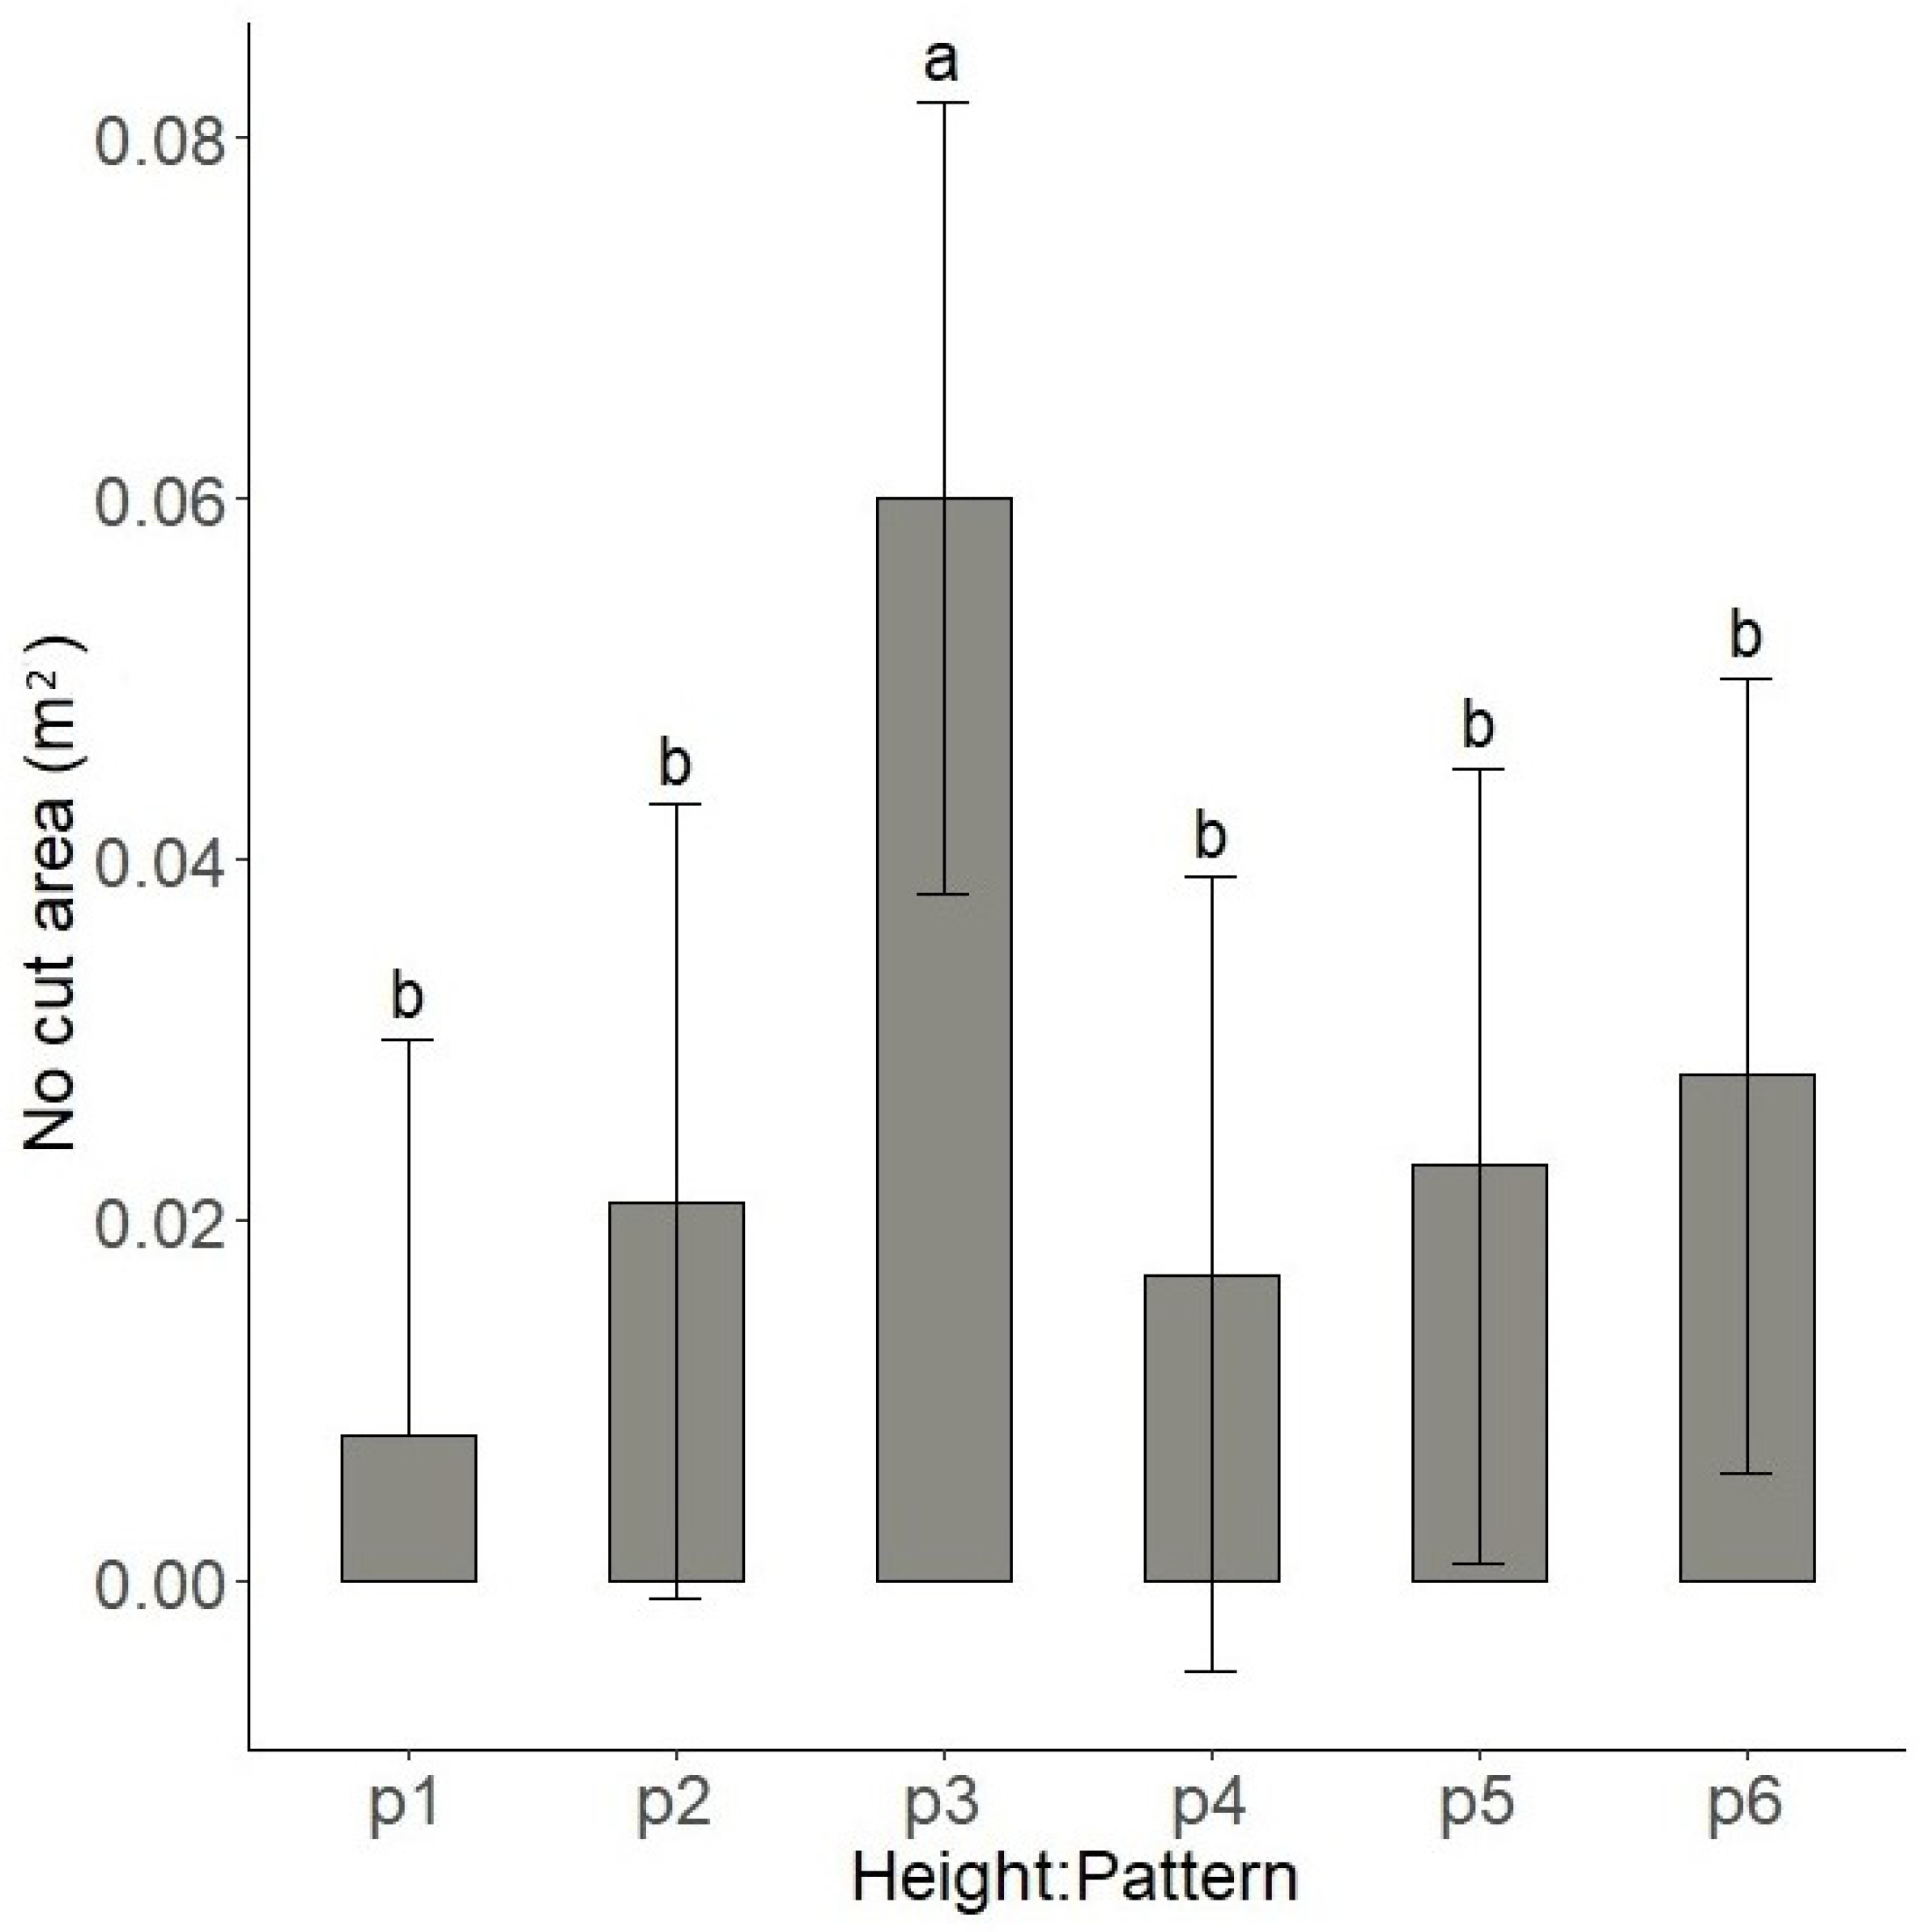
The mean value of no cut area in function of mowing pattern and mowing height revealed how the no cut area is higher in areas mowed by a horizontal pattern and the lowest cutting height (0.060 m2) (Figure 13).
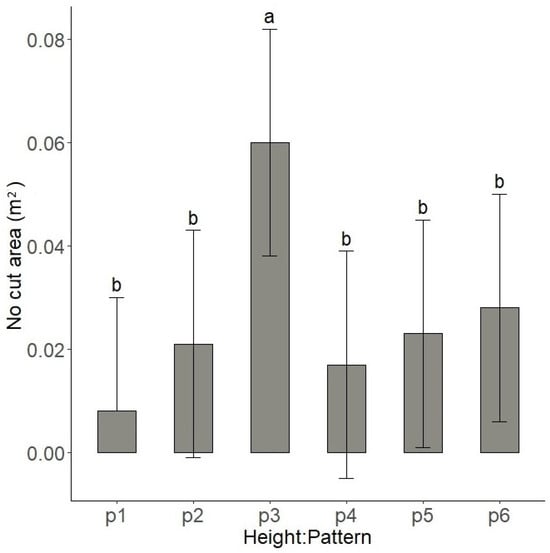
Figure 13.
Effect of the interaction between cutting height (indicated in the figure as “height”) and pattern on no cut area at the end of each row. Means denoted by different letters indicate statistically significant differences at p < 0.05 (LSD test), these letters are located above the upper confidence limit. LCL (Lower Confidence Limit) and UCL (Upper Confidence Limit) are reported. p1: vertical pattern with the lowest cutting height; p2: vertical pattern with the highest cutting height; p3: horizontal pattern with the lowest cutting height; p4: horizontal pattern with the highest cutting height; p5: diagonal pattern with the lowest cutting height; p6: diagonal pattern with the highest cutting height.
4. Discussion
The performance analysis of the robot mower, operating with three different mowing patterns and two cutting heights, provided valuable insights into the importance of tailoring operational strategies to the specific characteristics of green areas, such as their size and shape [26]. This emphasizes the importance of selecting appropriate management approaches to optimize mowing efficiency and coverage. The analysis of turfgrass height revealed that the lowest height was recorded in areas mowed with the diagonal pattern at the lowest cutting height, while the highest height, in absolute value, was observed in areas mowed with the horizontal pattern at the highest cutting height. Also, the results in the function of the pattern are partially in line. Indeed, the diagonal pattern achieved the lowest value of height, similar to the horizontal pattern, which did not differ from the vertical one, but it is higher compared to the first in absolute value.
The significant effect of the mowing pattern (p < 0.05) on cutting height contrasts with the findings of Sportelli et al. [27], who reported no differences between patterns (systematic vs. random). However, it is important to emphasize the role of the mowing pattern in terms of overlapping and canopy folding. According to Luglio et al. [9], repeated passes of the robot mower over the same area can contribute to canopy folding without effective cutting. In this context, the overlap results partially explain the height differences observed, with the highest overlap detected in areas mowed using the diagonal pattern. Understanding the impact of autonomous mower settings on turfgrass height is environmentally significant. Autonomous mowers generally operate at high frequency, and adopting a setting that favors a lower lawn height could compromise vegetation diversity, promoting the dominance of low-growing annual or biennial plant species [28]. This may also limit floral resources for pollinators by removing taller flowering structures, leading to cascading ecological effects, reduced ecosystem resilience, and increased susceptibility to harmful pest species [12,29].
The results shown in Figure 5b can be correlated with the coverage results, which indicated that the coverage value was lower in areas cut using the diagonal mowing pattern at the highest cutting height. Coverage is higher in the vertical pattern because the uncut area at the end of each turn is smaller (as it is shown in the Figure colorimetric map). In the interaction, coverage remains higher in the vertical pattern, and the uncut area also remains lower, although it does not differ significantly from the others (p2, p4, p5, p6). The interaction value for coverage in the diagonal pattern with the maximum height might be explained by uncut areas in the middle of the field, as highlighted by the colorimetric maps, which visually show a higher number of green areas. This is intrinsically related to the software’s operation, which calculates coverage as the green area (cutting trajectories) minus the yellow area (total area). Additionally, the presence of areas identified as uncut can be attributed to the functioning of the RTK GPS system itself. During signal loss—an issue observed during the trials—these uncovered areas may have been generated. In this regard, many authors recognize that the RTK correction signal can fail in numerous situations as tree canopies may obstruct satellite signals, degrading positional accuracy [30,31]. For this reason, alternative methods, such as vision-based systems, are increasingly being adopted [6]. Nevertheless, it should be considered that suboptimal coverage of the work area, and thus uneven mowing of the lawn, may lead to a deterioration in aesthetic quality [32]. Additionally, the areas left uncut may become refuges for weeds, which will have more opportunities to grow and spread [5].The efficiency results (Equation (1)) can be interpreted in light of the coverage outcomes. This is because the area recognized as cut by the software is derived directly from the test area of 254 m2, scaled by the percentage of coverage. The same applies to the data on the distance traveled, which impacts the calculation of theoretical surface area and, consequently, efficiency. Greater distance travelled significantly affects the efficiency ratio. In this regard, it is important to emphasize how an increasing number of turns (higher in horizontal and diagonal mowing patterns) related to the geometry of the area can increase not only the distance traveled but also the turning time [33]. It should be considered that turns also have an effect on the health and quality of the lawn. The robot, with its turns, can create mechanical stress on the turf, thus causing its wear [5].
In the case of higher overlap (diagonal and p6) this could be attributed to issues with the functioning of the robot’s RTK GPS system. In oblique trajectories, the system may face greater difficulty in maintaining a consistent path relative to the reference edges of the rectangular area [34]. The results for speed, which were highest for the vertical pattern, are closely related to the absence of RTK GPS signals observed in the field. This caused the robot to slow down and recalculate its trajectories. Additionally, the vertical pattern moved faster because it had fewer orientation challenges compared to the diagonal pattern. In contrast to the horizontal pattern, the significantly lower number of turns in the vertical pattern also contributed to its higher speed [35]. The results related to turfgrass height directly impact the effort exerted by the robotic mower and the presence of thatch. Additionally, mowing at a low height can result in scalping, particularly in lawns with dense thatch, as the mower may cut too low, damaging the grass crowns and disrupting the mowing process [36]. The results related to turning time show a higher average time in areas mowed with the horizontal pattern. In this regard, according to [17], different mowing patterns and cutting heights can affect the movement and performance of robotic mowers. Patterns such as horizontal mowing can lead to more complex maneuvers, resulting in increased difficulty covering certain areas due to sharper turns and more frequent trajectory corrections.
Therefore, overall, it would be desirable to promote more sustainable management by alternating different cutting patterns to achieve 100% coverage of the working area. This approach would help to avoid the creation of preferential traffic corridors, thereby reducing stress on the turf [37].
5. Conclusions
The results highlight the importance of selecting the mowing pattern and cutting height based on operational objectives. The vertical pattern proved optimal for maximizing speed (0.52 m/s) and efficiency (0.77), while it also minimized overlap (4.27 cm) and uncut areas (0.008 m2), demonstrating superior efficiency compared to the horizontal pattern (0.71), which performed less effectively in terms of cutting uniformity (coverage percentage of 97.05% vs. 98.57% of vertical cutting pattern). Cutting height had a complex impact on performance, as higher heights sometimes necessitated pattern adjustments to avoid inefficiencies. The interaction between mowing patterns and cutting height emerged as a critical factor for optimizing both operational efficiency and cutting quality. The findings underscore the value of targeted approaches, such as, in this specific case, employing the vertical pattern with an optimal cutting height, to achieve better results. Overall, the findings show, even if there are some differences, that the autonomous mower had satisfactory performances with all patterns, with improved coverage and reduced total times compared to the random trajectories studied in previous tests.
Future research should investigate additional parameters, such as terrain morphology or vegetation characteristics effect, to extend these findings and develop broadly applicable guidelines. Validating the new custom-built software results through cross-referencing with independent methods, such as manual surveys or alternative sensors, will further ensure the reliability and consistency of these conclusions. In addition, further study should be conducted on the influence of different of mowing height on the biodiversity rate within the turfgrass ecosystem.
Author Contributions
Conceptualization, S.M.L. and M.F.; methodology, S.M.L. and L.G.; software, S.P.; validation, C.F., M.R. and M.V.; formal analysis, S.M.L. and L.G.; investigation, S.M.L. and L.G.; resources, M.F., M.R. and M.V.; data curation, S.M.L. and C.F.; writing—original draft preparation, S.M.L. and L.G.; writing—review and editing, S.M.L., L.G. and MF.; visualization, S.M. and A.P.; supervision, S.P. and C.F.; project administration, M.F. and A.P.; funding acquisition, M.F. and M.R. All authors have read and agreed to the published version of the manuscript.
Funding
This research received no external funding.
Data Availability Statement
Data are contained within this paper.
Acknowledgments
The authors sincerely thank Husqvarna AB, Sweden, for providing the machine, Lorenzo Greci, Romano Zurrida, and Tommaso Federighi from DAFE for their technical assistance, and Lorenzo Giardina and all Qprel s.r.l., Italy, for the technical support.
Conflicts of Interest
Author Stefano Pieri was employed by the company Qprel s.r.l.. The remaining authors declare that the research was conducted in the absence of any commercial or financial relationships that could be construed as a potential conflict of interest.
References
- Fidanza, M. Achieving Sustainable Turfgrass Management; Burleigh Dodds Science Publishing: Cambridge, UK, 2023; Volume 125. [Google Scholar]
- Pk, R.; Patel, N. Autonomous Lawn Mower—A Comprehensive Review. Int. Res. J. Adv. Sci. Hub 2023, 5, 420–428. [Google Scholar] [CrossRef]
- Shaddox, T.; Munshaw, G.; Cropper, K. Cut Quality of Turfgrass Leaves as Influenced by Robotic and Rotary Mowers. In Proceedings of the 2020 ASA-CSSA-SSSA International Annual Meeting, Virtual, 9–13 November 2020. [Google Scholar]
- Shaddox, T.; Cropper, K.; Qian, C. Robotic Mowers and Turfgrass Cut Quality. Robot vs. Rotary: Research at the University of Kentucky Compared the Mowers’ Effects on Leaf Cut Quality and Leaf Tip Chlorosis. Available online: https://www.gcmonline.com/research/news/robotic-mower-cut-quality (accessed on 13 January 2025).
- Boeri, P.A.; Lindsey, A.J.; Unruh, J.B. Autonomous Compared with Conventional Mower Use on St. Augustinegrass Lawn Quality. HortTechnology 2023, 33, 377–380. [Google Scholar] [CrossRef]
- Luglio, S.M.; Frasconi, C.; Gagliardi, L.; Raffaelli, M.; Peruzzi, A.; Volterrani, M.; Magni, S.; Fontanelli, M. Analysis of Football Pitch Performances Based on Different Cutting Systems: From Visual Evaluation to YOLOv8. Agronomy 2024, 14, 2645. [Google Scholar] [CrossRef]
- Hossain, M.; Takahashi, K.; Komatsuzaki, M. Robotic Lawnmower Saves Labor and Operation Costs in a Pear (Pyrus pyrifolia) Orchard. Jpn. J. Farm Work Res. 2020, 55, 143–153. [Google Scholar] [CrossRef]
- Xu, J.; Lai, J.; Guo, R.; Lu, X.; Xu, L. Efficiency-Oriented MPC Algorithm for Path Tracking in Autonomous Agricultural Machinery. Agronomy 2022, 12, 1662. [Google Scholar] [CrossRef]
- Luglio, S.M.; Sportelli, M.; Frasconi, C.; Raffaelli, M.; Gagliardi, L.; Peruzzi, A.; Fortini, V.; Volterrani, M.; Magni, S.; Caturegli, L.; et al. Monitoring Autonomous Mowers Operative Parameters on Low-Maintenance Warm-Season Turfgrass. Appl. Sci. 2023, 13, 7852. [Google Scholar] [CrossRef]
- Gagliardi, L.; Fontanelli, M.; Luglio, S.M.; Frasconi, C.; Raffaelli, M.; Peruzzi, A.; Caturegli, L.; Sciusco, G.; Federighi, T.; Magni, S.; et al. Assessment of the Effects of Autonomous Mowers on Plant Biodiversity in Urban Lawns. Horticulturae 2024, 10, 355. [Google Scholar] [CrossRef]
- Winkler, J.; Pasternak, G.; Sas, W.; Hurajová, E.; Koda, E.; Vaverková, M.D. Nature-Based Management of Lawns—Enhancing Biodiversity in Urban Green Infrastructure. Appl. Sci. 2024, 14, 1705. [Google Scholar] [CrossRef]
- Lerman, S.B.; Contosta, A.R.; Milam, J.; Bang, C. To Mow or to Mow Less: Lawn Mowing Frequency Affects Bee Abundance and Diversity in Suburban Yards. Biol. Conserv. 2018, 221, 160–174. [Google Scholar] [CrossRef]
- Hoffmann, M.; Clemens, J.; Stronzek-Pfeifer, D.; Simonelli, R.; Serov, A.; Schettino, S.; Runge, M.; Schill, K.; Buskens, C. Coverage Path Planning and Precise Localization for Autonomous Lawn Mowers. In Proceedings of the 2022 Sixth IEEE International Conference on Robotic Computing (IRC), Naples, Italy, 5–7 December 2022; pp. 238–242. [Google Scholar]
- Kaur, B.; Mansi; Dimri, S.; Singh, J.; Mishra, S.; Chauhan, N.; Kukreti, T.; Sharma, B.; Singh, S.P.; Arora, S.; et al. Insights into the Harvesting Tools and Equipment’s for Horticultural Crops: From Then to Now. J. Agric. Food Res. 2023, 14, 100814. [Google Scholar] [CrossRef]
- Hutsol, T.; Kutyrev, A.; Kiktev, N.; Biliuk, M. Robotic Technologies in Horticulture: Analysis and Implementation Prospects. Agric. Eng. 2023, 27, 113–133. [Google Scholar] [CrossRef]
- Sara, G.; Todde, G.; Pinna, D.; Caria, M. Evaluating an Autonomous Electric Robot for Real Farming Applications. Smart Agric. Technol. 2024, 9, 100595. [Google Scholar] [CrossRef]
- Liu, L.; Liu, H.; Wang, X.; Li, J.; Wang, P.; Liu, S.; Zou, J.; Yang, X. Application of Path Planning and Tracking Control Technology in Mower Robots. Agronomy 2024, 14, 2473. [Google Scholar] [CrossRef]
- Bochtis, D.; Griepentrog, H.W.; Vougioukas, S.; Busato, P.; Berruto, R.; Zhou, K. Route Planning for Orchard Operations. Comput. Electron. Agric. 2015, 113, 51–60. [Google Scholar] [CrossRef]
- Fragapane, G.; De Koster, R.; Sgarbossa, F.; Strandhagen, J.O. Planning and Control of Autonomous Mobile Robots for Intralogistics: Literature Review and Research Agenda. Eur. J. Oper. Res. 2021, 294, 405–426. [Google Scholar] [CrossRef]
- Fu, W.; Liu, Y.; Zhang, X. Research on Accurate Motion Trajectory Control Method of Four-Wheel Steering AGV Based on Stanley-PID Control. Sensors 2023, 23, 7219. [Google Scholar] [CrossRef]
- Saggini, E.; Zereik, E.; Bibuli, M.; Ranieri, A.; Bruzzone, G.; Caccia, M.; Riccomagno, E. Evaluation and Comparison of Navigation Guidance and Control Systems for 2D Surface Path-Following. Annu. Rev. Control 2015, 40, 182–190. [Google Scholar] [CrossRef]
- Qiao, J.; Guo, J.; Li, Y. Simultaneous Localization and Mapping (SLAM)-Based Robot Localization and Navigation Algorithm. Appl. Water Sci. 2024, 14, 151. [Google Scholar] [CrossRef]
- Zhang, M.; Ji, Y.; Li, S.; Cao, R.; Hongzhen, X.; Zhang, Z. Research Progress of Agricultural Machinery Navigation Technology. Trans. Chin. Soc. Agric. Mach. 2020, 51, 4. [Google Scholar]
- Sun, Q.C.; Xia, J.C.; Foster, J.; Falkmer, T.; Lee, H. Pursuing Precise Vehicle Movement Trajectory in Urban Residential Area Using Multi-GNSS RTK Tracking. Transp. Res. Procedia 2017, 25, 2356–2372. [Google Scholar] [CrossRef]
- Sportelli, M.; Luglio, S.M.; Caturegli, L.; Pirchio, M.; Magni, S.; Volterrani, M.; Frasconi, C.; Raffaelli, M.; Peruzzi, A.; Gagliardi, L.; et al. Trampling Analysis of Autonomous Mowers: Implications on Garden Designs. AgriEngineering 2022, 4, 592–605. [Google Scholar] [CrossRef]
- Denny, G.C.; Hansen, G. Right Plant, Right Place: The Art and Science of Landscape Design—Plant Selection and Siting: ENH1156/EP416, 2/2010. EDIS 2010, 2010, 1–5. [Google Scholar] [CrossRef]
- Sportelli, M.; Fontanelli, M.; Pirchio, M.; Frasconi, C.; Raffaelli, M.; Caturegli, L.; Magni, S.; Volterrani, M.; Peruzzi, A. Robotic Mowing of Tall Fescue at 90 Mm Cutting Height: Random Trajectories vs. Systematic Trajectories. Agronomy 2021, 11, 2567. [Google Scholar] [CrossRef]
- Forbes, S.; Cooper, D.; Kendle, A.D. The History and Develop- Ment of Ecological Landscape Styles. In Urban Nature Conservation-Landscape Management in the Urban Countryside; Kendle, T., Forbes, S., Eds.; Routledge: London, UK, 1997; pp. 244–254. [Google Scholar]
- Busey, P. Cultural Management of Weeds in Turfgrass. Crop Sci. 2003, 43, 1899–1911. [Google Scholar] [CrossRef]
- Saha, S.; Morita, T.; Ospina, R.; Noguchi, N. A Vision-Based Navigation System for an Agricultural Autonomous Tractor. IFAC-PapersOnLine 2022, 55, 48–53. [Google Scholar] [CrossRef]
- Saha, S.; Morita, T.; Noguchi, N. A Vision-Based Road Detection System for the Navigation of an Agricultural Autonomous Tractor. Eng. Agric. Environ. Food 2023, 16, 43–52. [Google Scholar] [CrossRef] [PubMed]
- Diwakaran, S.; Kumar, M.D.V.; Mohanreddy, P.S.; Rishika, C.; Sreenivasulu, P.; Sivasubramanian, M. Design of an Autonomous Mower with Height Adjustable Cutting Motor. In Proceedings of the 2023 4th International Conference on Signal Processing and Communication (ICSPC), Coimbatore, India, 23 March 2023; pp. 348–352. [Google Scholar]
- Tang, Q.; Schiehlen, W. From Lawnmower Dynamics to Modeling, Simulation and Experiments of a Differentially Driven Robot. In Advances on Theory and Practice of Robots and Manipulators; Mechanisms and Machine Science; Ceccarelli, M., Glazunov, V., Eds.; Springer: Cham, Switzerland, 2014; Volume 22. [Google Scholar]
- Broderick, P.L.; Cipra, R.J. A Method for Determining and Correcting Robot Position and Orientation Errors Due to Manufacturing. J. Mech. Transm. Autom. Des. 1988, 110, 3–10. [Google Scholar] [CrossRef]
- Li, Y.; Zhao, B.; Zhang, W.; Wei, L.; Zhou, L. Evaluation of Agricultural Machinery Operational Benefits Based on Semi-Supervised Learning. Agriculture 2022, 12, 2075. [Google Scholar] [CrossRef]
- Landschoot, P. Managing Thatch in Lawns. 2023. Available online: https://extension.psu.edu/managing-thatch-in-lawns (accessed on 13 January 2025).
- University of Massachusetts Amhers UMass Extension Turf Program. 9. Traffic Stress & Turf Cultivation. Available online: https://ag.umass.edu/turf/publications-resources/best-management-practices/9-traffic-stress-turf-cultivation (accessed on 13 January 2025).


Disclaimer/Publisher’s Note: The statements, opinions and data contained in all publications are solely those of the individual author(s) and contributor(s) and not of MDPI and/or the editor(s). MDPI and/or the editor(s) disclaim responsibility for any injury to people or property resulting from any ideas, methods, instructions or products referred to in the content. |
© 2025 by the authors. Licensee MDPI, Basel, Switzerland. This article is an open access article distributed under the terms and conditions of the Creative Commons Attribution (CC BY) license (https://creativecommons.org/licenses/by/4.0/).