
LeafLaminaMap: Exploring Leaf Color Patterns Using RGB Color Indices

 ,
,  , , ,
, , , 
Abstract

1. Introduction
2. Materials and Methods
2.1. Plant Material and Digitalization
2.2. Color and Vegetation Indices
2.3. Statistical Analysis
2.4. Software
3. Results
3.1. Color Analyis with the LeafLaminaMap Software
3.2. Colorimetic Evaluation
3.2.1. Mean and Standard Deviation of the Color Indices
3.2.2. Contrast, Energy and Entropy of the Color Indices
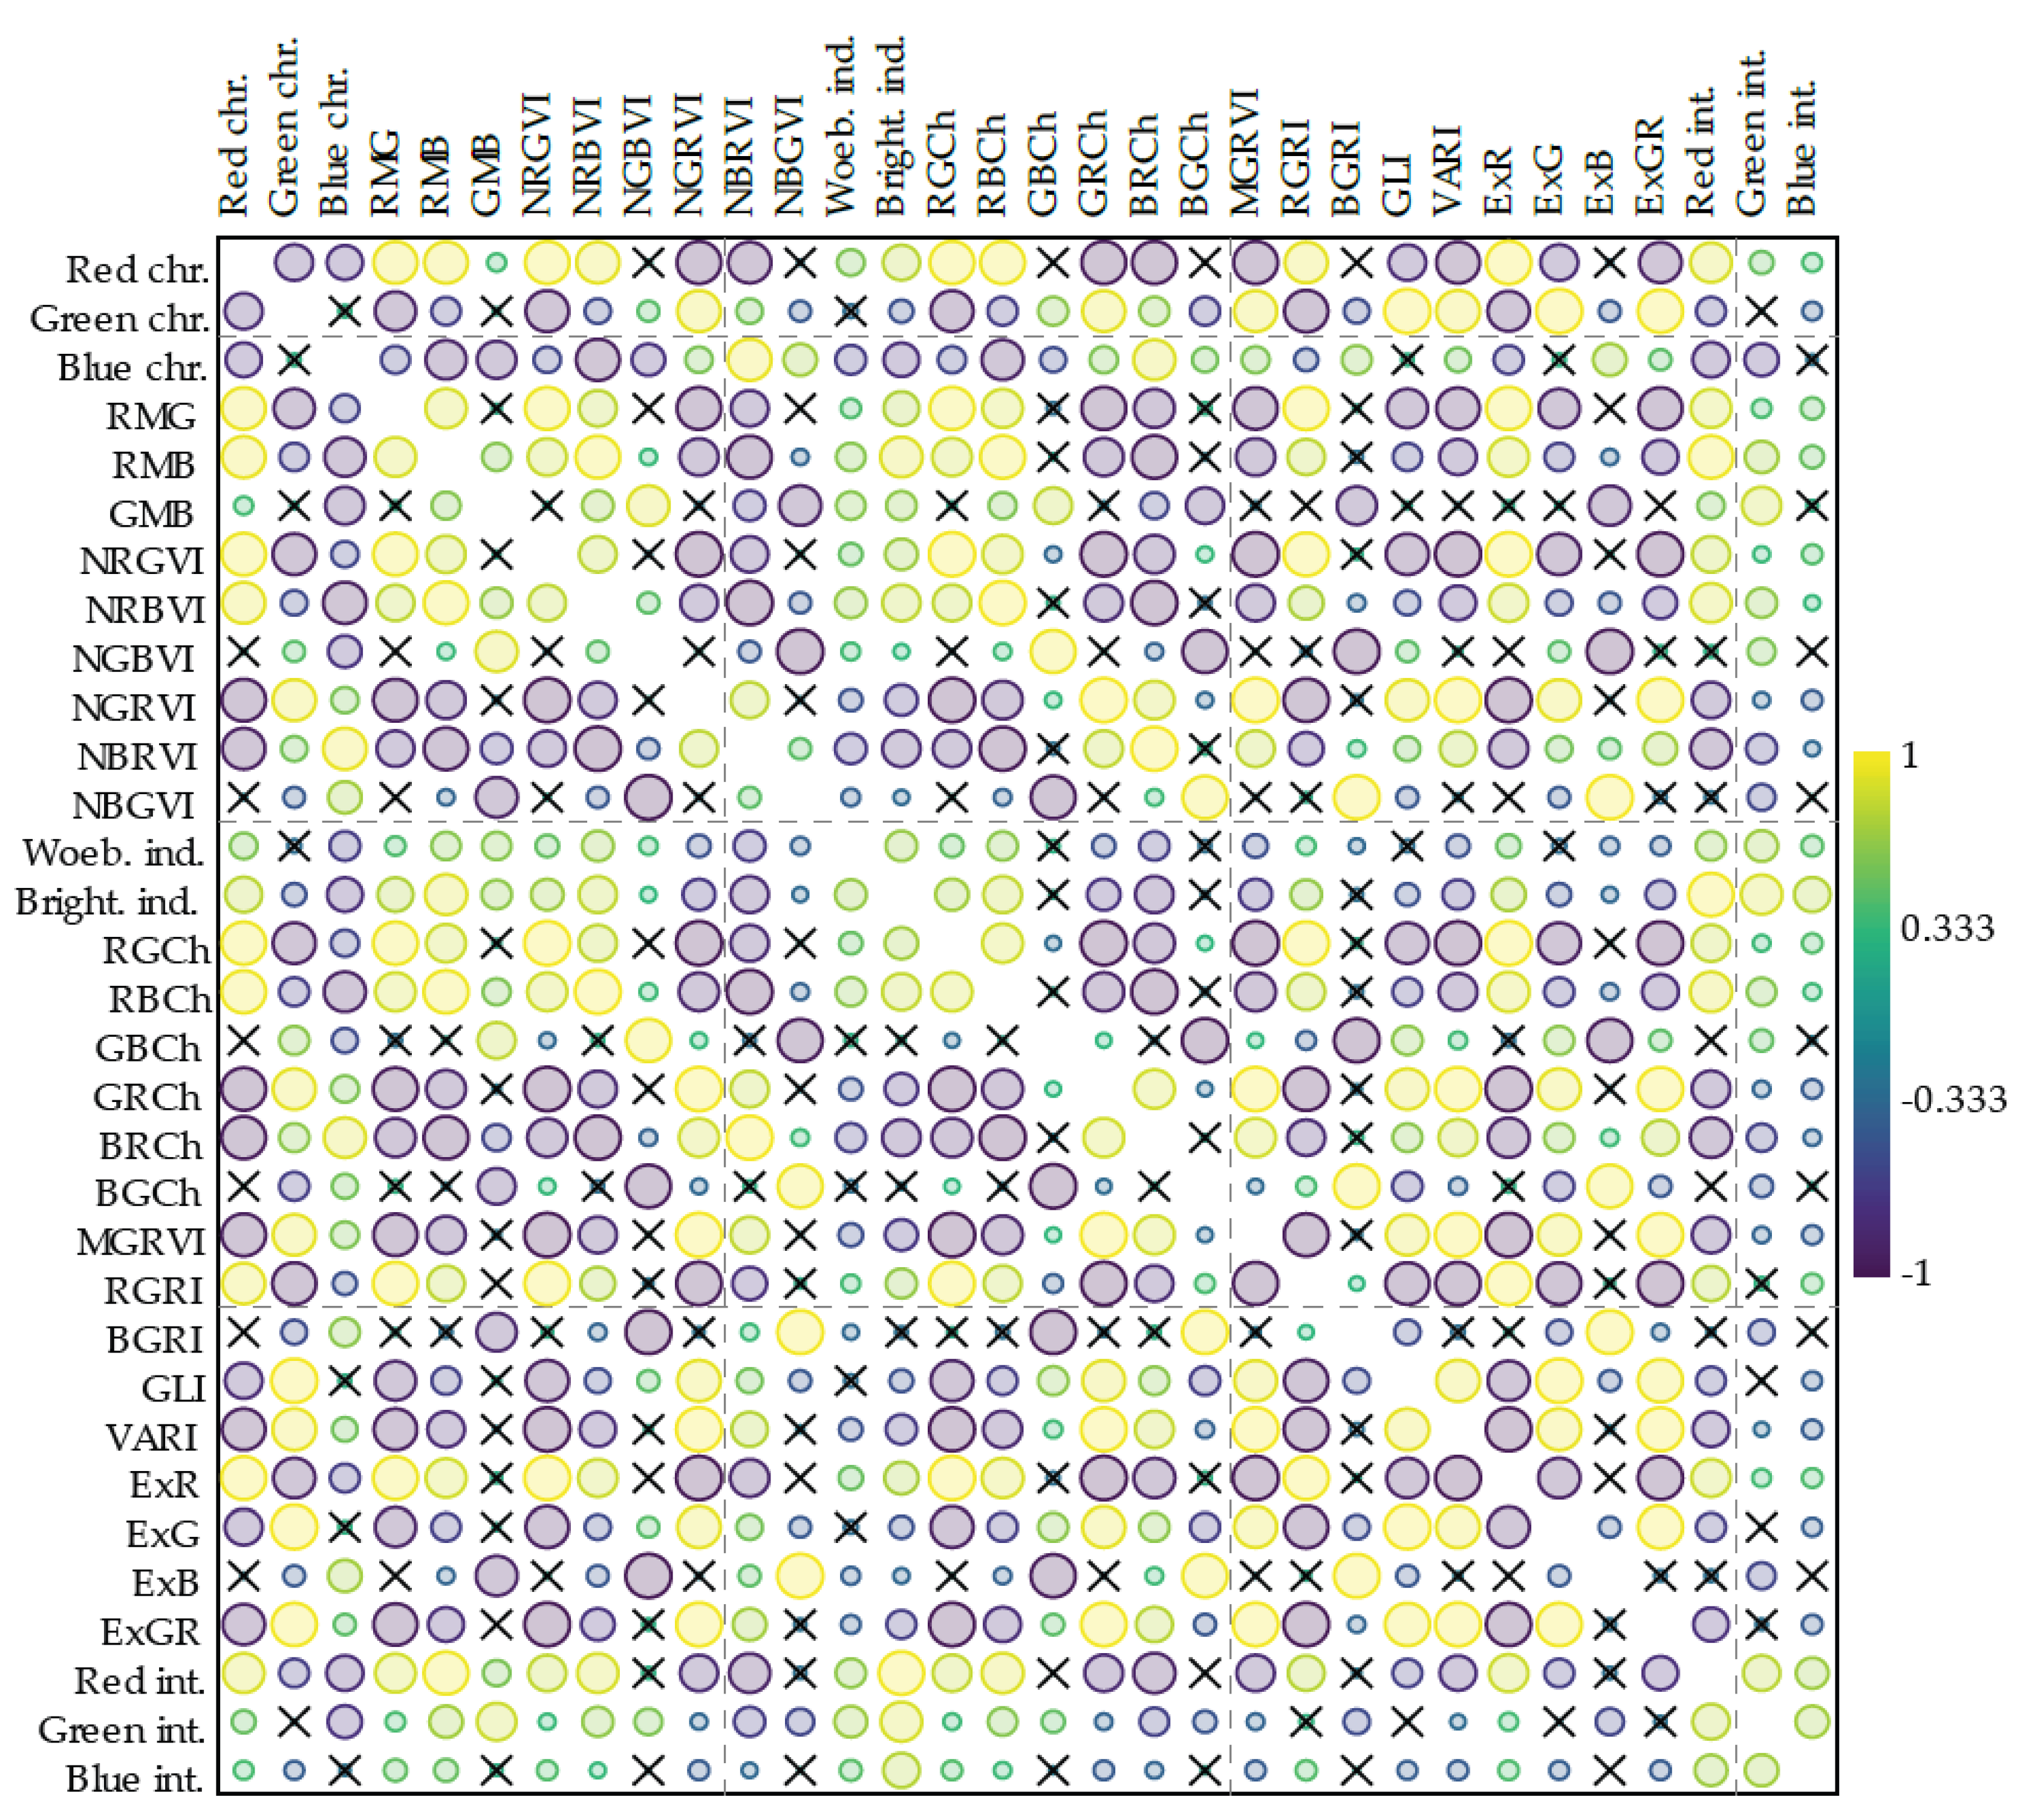
3.2.3. Correlation of the Color and Vegetation Indices
3.3. Classification of Leaf Samples
4. Discussion
5. Conclusions
Supplementary Materials
Author Contributions
Funding
Data Availability Statement
Conflicts of Interest
References
- Talebzadeh, F.; Valeo, C. Evaluating the effects of environmental stress on leaf chlorophyll content as an index for tree health. In IOP Conference Series: Earth and Environmental Science; IOP Publishing: Bristol, UK, 2022; Volume 1006. [Google Scholar] [CrossRef]
- Turnbull, C. Changes in Pigment Accumulation as Indicators of Physical Stress in Eucalyptus pauciflora. Field Stud. Ecol. 2019, 2, 10. Available online: https://studentjournals.anu.edu.au/index.php/fse/article/view/220 (accessed on 18 January 2025).
- Zhou, Y.; Karl, T.; Lewis, D.H.; McGhie, T.K.; Arathoon, S.; Davies, K.M.; Ryan, K.G.; Gould, K.S.; Schwinn, K.E. Production of betacyanins in transgenic Nicotiana tabacum increases tolerance to salinity. Front. Plant Sci. 2021, 12, 653147. [Google Scholar] [CrossRef] [PubMed]
- Lázár, J.; Bisztray, G.D. Virus and virus-like diseases of grapevine in Hungary. Int. J. Hortic. Sci. 2011, 17, 25–36. [Google Scholar] [CrossRef]
- Saba, A.; Moneta, E.; Peparaio, M.; Sinesio, F.; Vassallo, M.; Paoletti, F. Towards a multi-dimensional concept of vegetable freshness from the consumer’s perspective. Food Qual. Prefer. 2018, 66, 1–12. [Google Scholar] [CrossRef]
- Fouladkhah, A.; Bunning, M.; Stone, M.; Stushnoff, C.; Stonaker, F.; Kendall, P. Consumer hedonic evaluation of eight fresh specialty leafy greens and their relationship to instrumental quality attributes and indicators of secondary metabolites. J. Sens. Stud. 2011, 26, 175–183. [Google Scholar] [CrossRef]
- Liang, D.; Huang, G. Influence of Urban Tree Traits on Their Ecosystem Services: A Literature Review. Land 2023, 12, 1699. [Google Scholar] [CrossRef]
- Marcotrigiano, M. Chimeras and variegation: Patterns of deceit. HortScience 1997, 32, 773–784. [Google Scholar] [CrossRef]
- Zhang, H.; Feng, S.; Wu, D.; Zhao, C.; Liu, X.; Zhou, Y.; Zheng, S. Hyperspectral Image Classification on Large-Scale Agricultural Crops: The Heilongjiang Benchmark Dataset, Validation Procedure, and Baseline Results. Remote Sens. 2024, 16, 478. [Google Scholar] [CrossRef]
- Sun, Y.; Tong, C.; He, S.; Wang, K.; Chen, L. Identification of nitrogen, phosphorus, and potassium deficiencies based on temporal dynamics of leaf morphology and color. Sustainability 2018, 10, 762. [Google Scholar] [CrossRef]
- Wiwart, M.; Fordoński, G.; Żuk-Gołaszewska, K.; Suchowilska, E. Early diagnostics of macronutrient deficiencies in three legume species by color image analysis. Comput. Electron. Agric. 2009, 65, 125–132. [Google Scholar] [CrossRef]
- Abdelghafour, F.; Keresztes, B.; Germain, C.; Da Costa, J.P. In field detection of downy mildew symptoms with proximal color imaging. Sensors 2020, 20, 4380. [Google Scholar] [CrossRef] [PubMed]
- Rivera-Romero, C.A.; Palacios-Hernández, E.R.; Vite-Chávez, O.; Reyes-Portillo, I.A. Early-Stage Identification of Powdery Mildew Levels for Cucurbit Plants in Open-Field Conditions Based on Texture Descriptors. Inventions 2024, 9, 8. [Google Scholar] [CrossRef]
- Szabó, M.; Csikász-Krizsics, A.; Dula, T.; Farkas, E.; Roznik, D.; Kozma, P.; Deák, T. Black rot of grapes (Guignardia bidwellii)—A comprehensive overview. Horticulturae 2023, 9, 130. [Google Scholar] [CrossRef]
- Letousey, P.; Baillieul, F.; Perrot, G.; Rabenoelina, F.; Boulay, M.; Vaillant-Gaveau, N.; Fontaine, F. Early events prior to visual symptoms in the apoplectic form of grapevine esca disease. Phytopathology 2010, 100, 424–431. [Google Scholar] [CrossRef]
- Calzarano, F.; Pagnani, G.; Pisante, M.; Bellocci, M.; Cillo, G.; Metruccio, E.G.; Di Marco, S. Factors Involved on Tiger-Stripe Foliar Symptom Expression of Esca of Grapevine. Plants 2021, 10, 1041, Decline of Mediterranean Fruit Crops and Forests Associated with Fungal Trunk Pathogens 117. [Google Scholar] [CrossRef]
- Bannari, A.; Morin, D.; Bonn, F.; Huete, A. A review of vegetation indices. Remote Sens. Rev. 1995, 13, 95–120. [Google Scholar] [CrossRef]
- Ponti, M.P. Segmentation of low-cost remote sensing images combining vegetation indices and mean shift. IEEE Geosci. Remote Sens. Lett. 2012, 10, 67–70. [Google Scholar] [CrossRef]
- Tao, M.; Ma, X.; Huang, X.; Liu, C.; Deng, R.; Liang, K.; Qi, L. Smartphone-based detection of leaf color levels in rice plants. Comput. Electron. Agric. 2020, 173, 105431. [Google Scholar] [CrossRef]
- Barbosa, B.D.S.; Ferraz, G.A.S.; Gonçalves, L.M.; Marin, D.B.; Maciel, D.T.; Ferraz, P.F.P.; Rossi, G. RGB vegetation indices applied to grass monitoring: A qualitative analysis. Agron. Res. 2019, 17, 349–357. [Google Scholar] [CrossRef]
- Kazemi, F.; Ghanbari Parmehr, E. Evaluation of RGB vegetation indices derived from UAV images for rice crop growth monitoring. ISPRS Ann. Photogramm. Remote Sens. Spat. Inf. Sci. 2023, 10, 385–390. [Google Scholar] [CrossRef]
- Elmetwalli, A.H.; Derbala, A.; Alsudays, I.M.; Al-Shahari, E.A.; Elhosary, M.; Elsayed, S.; Al-Shuraym, L.A.; Moghanm, F.S.; Elsherbiny, O. Machine learning-driven assessment of biochemical qualities in tomato and mandarin using RGB and hyperspectral sensors as nondestructive technologies. PLoS ONE 2024, 19, e0308826. [Google Scholar] [CrossRef] [PubMed]
- Li, B.; Xu, X.; Han, J.; Zhang, L.; Bian, C.; Jin, L.; Liu, J. The estimation of crop emergence in potatoes by UAV RGB imagery. Plant Methods 2019, 15, 15. [Google Scholar] [CrossRef] [PubMed]
- Morgan, G.R.; Stevenson, L. Unoccupied-Aerial-Systems-Based Biophysical Analysis of Montmorency Cherry Orchards: A Comparative Study. Drones 2024, 8, 494. [Google Scholar] [CrossRef]
- Ilniyaz, O.; Kurban, A.; Du, Q. Leaf area index estimation of pergola-trained vineyards in arid regions based on UAV RGB and multispectral data using machine learning methods. Remote Sens. 2022, 14, 415. [Google Scholar] [CrossRef]
- Sánchez-Sastre, L.F.; Alte da Veiga, N.M.; Ruiz-Potosme, N.M.; Carrión-Prieto, P.; Marcos-Robles, J.L.; Navas-Gracia, L.M.; Martín-Ramos, P. Assessment of RGB vegetation indices to estimate chlorophyll content in sugar beet leaves in the final cultivation stage. AgriEngineering 2020, 2, 128–149. [Google Scholar] [CrossRef]
- de Carvalho, T.C.L.; Nunes, C.A. Smartphone-based method for the determination of chlorophyll and carotenoid contents in olive and avocado oils: An approach with calibration transfer. J. Food Compos. Anal. 2021, 104, 104164. [Google Scholar] [CrossRef]
- Pahlevan, N.; Balasubramanian, S.V.; Sarkar, S.; Franz, B.A. Toward long-term aquatic science products from heritage Landsat missions. Remote Sens. 2018, 10, 1337. [Google Scholar] [CrossRef]
- Korznikov, K.A.; Kislov, D.E.; Altman, J.; Doležal, J.; Vozmishcheva, A.S.; Krestov, P.V. Using U-Net-like deep convolutional neural networks for precise tree recognition in very high resolution RGB (red, green, blue) satellite images. Forests 2021, 12, 66. [Google Scholar] [CrossRef]
- Viscosi, V.; Cardini, A. Leaf morphology, taxonomy and geometric morphometrics: A simplified protocol for beginners. PLoS ONE 2011, 6, e25630. [Google Scholar] [CrossRef]
- Bylesjö, M.; Segura, V.; Soolanayakanahally, R.Y.; Rae, A.M.; Trygg, J.; Gustafsson, P.; Jansson, S.; Street, N.R. LAMINA: A tool for rapid quantification of leaf size and shape parameters. BMC Plant Biol. 2008, 8, 82. [Google Scholar] [CrossRef]
- Cheng, L.; Zhu, X.; Gao, L.; Li, C.; Wang, L.; Zhao, G.; Jiang, Y. Estimation of chlorophyll content in apple leaves based on RGB model using digital camera. Acta Hortic. Sin. 2017, 44, 381. [Google Scholar]
- Kawashima, S.; Nakatani, M. An algorithm for estimating chlorophyll content in leaves using a video camera. Ann. Bot. 1998, 81, 49–54. [Google Scholar] [CrossRef]
- Biró, L.; Kozma-Bognár, V.; Berke, J. Comparison of RGB Indices used for Vegetation Studies based on Structured Similarity Index (SSIM). J. Plant Sci. Phytopathol. 2024, 8, 007–012. [Google Scholar] [CrossRef]
- Hammer, Ø.; Harper, D.A. Past: Paleontological statistics software package for education and data analysis. Palaeontol. Electron. 2001, 4, 1. [Google Scholar]
- Dou, P.; Shen, H.; Huang, C.; Li, Z.; Mao, Y.; Li, X. Large-scale land use/land cover extraction from Landsat imagery using feature relationships matrix based deep-shallow learning. Int. J. Appl. Earth Obs. Geoinf. 2024, 129, 103866. [Google Scholar] [CrossRef]
- Xu, H.; Cheng, W.; Wang, B.; Song, K.; Zhang, Y.; Wang, R.; Bao, A. Effects of Geomorphic Spatial Differentiation on Vegetation Distribution Based on Remote Sensing and Geomorphic Regionalization. Remote Sens. 2024, 16, 1062. [Google Scholar] [CrossRef]
- Cushman, K.C. Remote Sensing of Forest Structure and Dynamics in the Barro Colorado Nature Monument; Smithsonian Institution Scholarly Press: Washington, DC, USA, 2024. [Google Scholar] [CrossRef]
- Brewer, M.T.; Lang, L.; Fujimura, K.; Dujmovic, N.; Gray, S.; van der Knaap, E. Development of a controlled vocabulary and software application to analyze fruit shape variation in tomato and other plant species. Plant Physiol. 2006, 141, 15–25. [Google Scholar] [CrossRef]
- Gonzalo, M.J.; Brewer, M.T.; Anderson, C.; Sullivan, D.; Gray, S.; van der Knaap, E. Tomato fruit shape analysis using morphometric and morphology attributes implemented in Tomato Analyzer software program. J. Am. Soc. Hortic. Sci. 2009, 134, 77–87. [Google Scholar] [CrossRef]
- Králík, M.; Klíma, O.; Urbanová, P.; Polcerová, L.; Čuta, M. Morphometric Sex Estimation from the Hip Bone by Means of the HIP 1.1 Software. In Shape in Medical Imaging: International Workshop, ShapeMI 2018, Held in Conjunction with MICCAI 2018, Granada, Spain; Springer: Cham, Switzerland, 2018; Volume 11167, p. 78. [Google Scholar]
- Johnson, M.T.; Bertrand, J.A.; Turcotte, M.M. Precision and accuracy in quantifying herbivory. Ecol. Entomol. 2016, 41, 112–121. [Google Scholar] [CrossRef]
- Darrigues, A.; Hall, J.; van der Knaap, E.; Francis, D.M.; Dujmovic, N.; Gray, S. Tomato analyzer-color test: A new tool for efficient digital phenotyping. J. Am. Soc. Hortic. Sci. 2008, 133, 579–586. [Google Scholar] [CrossRef]
- Brabec, D.; Grothe, S.; Perez-Fajardo, M.; Pordesimo, L.; Yeater, K. Potential of a flatbed scanner for evaluation of flour samples for dark specks and flour color. Cereal Chem. 2024, 101, 508–517. [Google Scholar] [CrossRef]
- Baek, S.H.; Park, K.H.; Jeon, J.S.; Kwak, T.Y. A novel method for calibration of digital soil images captured under irregular lighting conditions. Sensors 2022, 23, 296. [Google Scholar] [CrossRef] [PubMed]
- Chizk, T.M.; Lee, J.A.; Clark, J.R.; Worthington, M.L. ShinyFruit: Interactive fruit phenotyping software and its application in blackberry. Front. Plant Sci. 2023, 14, 1182819. [Google Scholar] [CrossRef] [PubMed]
- Clohessy, J.W.; Pauli, D.; Kreher, K.M.; Buckler, E.S.; Armstrong, P.R.; Wu, T.; Hoekenga, O.A.; Jannink, J.L.; Sorrells, M.E.; Gore, M.A. A Low-Cost Automated System for High-Throughput Phenotyping of Single Oat Seeds. Plant Phenome J. 2018, 1, 1–13. [Google Scholar] [CrossRef]
- Bodor-Pesti, P.; Taranyi, D.; Nyitrainé Sárdy, D.Á.; Le Phuong Nguyen, L.; Baranyai, L. Correlation of the Grapevine (Vitis vinifera L.) Leaf Chlorophyll Concentration with RGB Color Indices. Horticulturae 2023, 9, 899. [Google Scholar] [CrossRef]
- QGIS Association. Free and Open Source Geographic Information System. In QGIS Geographic Information System; QGIS Association: Gossau, Switzerland, 2015. [Google Scholar]
- ESRI. ArcGIS Desktop: Release 10; Environmental Systems Research Institute: Redlands, CA, USA, 2011. [Google Scholar]
- Van Rossum, G.; Drake, F.L., Jr. Python Reference Manual; Centrum Voor Wiskunde en Informatica Amsterdam: Amsterdam, Netherlands, 1995. [Google Scholar]
- Domínguez-Manzano, J.; Monago-Maraña, O.; Muñoz de la Peña, A.; Durán-Merás, I. Monitoring of chlorophylls during the maturation stage of plums by multivariate calibration of RGB data from digital images. Chemosensors 2022, 11, 9. [Google Scholar] [CrossRef]
- Panahi, B.; Mohammadi, S.A.; Doulati-Baneh, H. Characterization of Iranian grapevine cultivars using machine learning models. Proc. Natl. Acad. Sci. India Sect. B Biol. Sci. 2020, 90, 615–621. [Google Scholar] [CrossRef]
- Patil, S.P.; Zambre, R.S. Classification of cotton leaf spot disease using support vector machine. Int. J. Eng. Res. 2014, 3, 1511–1514. [Google Scholar]
- Pydipati, R.; Burks, T.F.; Lee, W.S. Identification of citrus disease using color texture features and discriminant analysis. Comput. Electron. Agric. 2006, 52, 49–59. [Google Scholar] [CrossRef]
- Nyitrainé Sárdy, Á.D.; Ladányi, M.; Varga, Z.; Szövényi, Á.P.; Matolcsi, R. The effect of grapevine variety and wine region on the primer parameters of wine based on 1H NMR-spectroscopy and machine learning methods. Diversity 2022, 14, 74. [Google Scholar] [CrossRef]
- Lhermitte, E.; Hilal, M.; Furlong, R.; O’brien, V.; Humeau-Heurtier, A. Deep Learning and Entropy-Based Texture Features for Color Image Classification. Entropy 2022, 24, 1577. [Google Scholar] [CrossRef] [PubMed]
- Damayanti, R.; Riza, D.F.A.; Putranto, A.W.; Nainggolan, R.J. Vernonia Amygdalina Chlorophyll Content Prediction by Feature Texture Analysis of Leaf Color. In IOP Conference Series: Earth and Environmental Science; IOP Publishing: Bristol, UK, 2021; Volume 757, No. 1; p. 012026. [Google Scholar] [CrossRef]
- Sekharamantry, P.K.; Rao, M.S.; Srinivas, Y.; Uriti, A. PSR-LeafNet: A Deep Learning Framework for Identifying Medicinal Plant Leaves Using Support Vector Machines. Big Data Cogn. Comput. 2024, 8, 176. [Google Scholar] [CrossRef]
- Padmavathi, K.; Deepa, C. Swarm Intelligence Based Detection of Citrus Plant Diseases and Their Severity Level. Int. J. Innov. Technol. Explor. Eng. 2020, 3, 428–433. [Google Scholar] [CrossRef]


| Index | Formula |
|---|---|
| Red chromaticity | R/(R + G + B) |
| Green chromaticity | G/(R + G + B) |
| Blue chromaticity | B/(R + G + B) |
| RMG (Difference between red and green) | R − G |
| RMB (Difference between red and blue) | R − B |
| GMB (Difference between green and blue) | G − B |
| NRGVI (Normalized red-green difference index) | (R − G)/(R + G) |
| NRBVI (Normalized red-blue difference index) | (R − B)/(R + B) |
| NGBVI (Normalized green-blue difference index) | (G − B)/(G + B) |
| NGRVI (Normalized green-red difference index) | (G − R)/(G + R) |
| NBRVI (Normalized blue-red difference index) | (B − R)/(B + R) |
| NBGVI (Normalized blue-green difference index) | (B − G)/(B + G) |
| WI (Woebbecke index) | (G − B)/(R − G) |
| BI (Brightness index) | ((R2 + B2 + G2)/3)1/2 |
| RGCh (Red-green chromaticity) | (R − G)/(R + G + B) |
| RBCh (Red-blue chromaticity) | (R − B)/(R + G + B) |
| GBCh (Green-blue chromaticity) | (G − B)/(R + G + B) |
| GRCh (Green-red chromaticity) | (G − R)/(R + G + B) |
| BRCh (Blue-red chromaticity) | (B − R)/(R + G + B) |
| BGCh (Blue-green chromaticity) | (B − G)/(R + G + B) |
| MGRVI (Modified green-red vegetation index) | (G2 − R2)/(G2 + R2) |
| RGRI (Red-green ratio index) | R/G |
| BGRI (Blue-green ratio index) | B/G |
| GLI (Green leaf index) or VDVI (Visible band-difference vegetation index) | (2G − R − B)/(2G + R + B) |
| VARI (Visible atmospherically resistance index) | (G − R)/(G + R − B) |
| ExR (Excess red vegetation index) | (1.4 × R − G)/(R + G + B) |
| ExB (Excess blue vegetation index) | (1.4 × B − G)/(R + G + B) |
| ExG (Excess green vegetation index) | (2 × G − R − B)/(R + G + B) |
| ExGR (Excess green minus excess red) | ExG − ExR |
| Red intensity | R |
| Green intensity | G |
| Blue intensity | B |
| Color Index | Mean | St.dev. | Contrast | Energy | Entropy |
|---|---|---|---|---|---|
| Red chromacity | 58.11 * | 90.46 * | 54.11 * | 433.89 * | 840.79 * |
| Green chromacity | 19.59 * | 0.49 | 14.70 * | 541.21 * | 394.89 * |
| Blue chromacity | 29.69 * | 0.28 | 25.89 * | 41.85 * | 62.74 * |
| RMG | 27.53 * | 69.10 * | 5.55 + | 110.78 * | 172.90 * |
| RMB | 43.19 * | 46.54 * | 21.98 * | 42.88 * | 76.59 * |
| GMB | 10.36 * | 28.61 * | 17.78 * | 10.05 * | 17.88 * |
| NRGVI | 45.48 * | 29.79 * | 2.52 | 615.66 * | 610.49 * |
| NRBVI | 58.23 * | 9.56 * | 35.30 * | 71.52 * | 116.00 * |
| NGBVI | 1.52 | 1.34 | 8.06 * | 33.04 * | 48.41 * |
| NGRVI | 45.48 * | 29.79 * | 6.34 + | 604.62 * | 604.52 * |
| NBRVI | 58.23 * | 9.56 * | 33.80 * | 71.44 * | 115.31 * |
| NBGVI | 1.52 | 1.34 | 5.21 + | 32.56 * | 48.08 * |
| Woebbecke index | 45.62 * | 18.02 * | 12.70 * | 37.10 * | 53.11 * |
| Brightness index | 31.30 * | 2.65 | 24.14 * | 0.05 | 1.57 |
| RGCh | 44.27 * | 31.45 * | 2.38 | 907.45 * | 777.73 * |
| RBCh | 57.42 * | 29.45 * | 33.54 * | 123.68 * | 291.67 * |
| GBCh | 0.02 | 2.55 | 4.02 | 107.75 * | 161.17 * |
| GRCh | 44.27 * | 31.45 * | 6.98 + | 904.02 * | 771.21 * |
| BRCh | 57.42 * | 29.45 * | 30.92 * | 123.19 * | 291.29 * |
| BGCh | 0.02 | 2.55 | 0.11 | 107.18 * | 160.82 * |
| MGRVI | 50.65 * | 32.32 * | 6.17 + | 285.85 * | 260.47 * |
| RGRI | 27.45 * | 18.20 * | 23.76 * | 188.72 * | 453.15 * |
| BGRI | 0.51 | 1.65 | 0.12 | 14.35 * | 26.22 * |
| GLI | 18.10 * | 2.39 | 0.00 | 376.33 * | 322.05 * |
| VARI | 47.07 * | 25.68 * | 6.76 + | 49.55 * | 176.58 * |
| ExR | 47.67 * | 44.80 * | 22.54 * | 825.24 * | 844.31 * |
| ExG | 19.59 * | 0.49 | 0.83 | 514.64 * | 380.40 * |
| ExB | 1.46 | 2.74 | 8.81 * | 91.69 * | 148.86 * |
| ExGR | 32.66 * | 7.57 * | 6.98 + | 696.10 * | 551.28 * |
| Red intensity | 39.62 * | 14.20 * | 27.15 * | 4.40 + | 12.66 * |
| Green intensity | 16.17 * | 5.04 + | 15.43 * | 1.65 | 5.52 + |
| Blue intensity | 7.07 + | 5.54 + | 4.45 + | 28.72 * | 23.71 * |
| Feature | LDA | SVM Linear | SVM Radial | SVM Polynomial | SVM Sigmoid |
|---|---|---|---|---|---|
| Calibration | |||||
| Average | 100 | 100 | 95.00 | 82.50 | 92.50 |
| Deviation | 95.00 | 100 | 100 | 85.00 | 98.75 |
| Contrast | 91.20 | 100 | 95.00 | 72.50 | 92.80 |
| Energy | 100 | 100 | 100 | 100 | 100 |
| Entropy | 100 | 100 | 100 | 100 | 100 |
| Validation | |||||
| Average | 100 | 93.75 | 93.75 | 82.50 | 88.75 |
| Deviation | 83.75 | 93.75 | 97.50 | 81.25 | 97.50 |
| Contrast | 90.00 | 93.75 | 92.50 | 72.50 | 87.50 |
| Energy | 100 | 100 | 100 | 100 | 100 |
| Entropy | 100 | 100 | 100 | 100 | 100 |
Disclaimer/Publisher’s Note: The statements, opinions and data contained in all publications are solely those of the individual author(s) and contributor(s) and not of MDPI and/or the editor(s). MDPI and/or the editor(s) disclaim responsibility for any injury to people or property resulting from any ideas, methods, instructions or products referred to in the content. |
© 2025 by the authors. Licensee MDPI, Basel, Switzerland. This article is an open access article distributed under the terms and conditions of the Creative Commons Attribution (CC BY) license (https://creativecommons.org/licenses/by/4.0/).
Share and Cite
Bodor-Pesti, P.; Nguyen, L.L.P.; Nguyen, T.B.; Dam, M.S.; Taranyi, D.; Baranyai, L. LeafLaminaMap: Exploring Leaf Color Patterns Using RGB Color Indices. AgriEngineering 2025, 7, 39. https://doi.org/10.3390/agriengineering7020039
Bodor-Pesti P, Nguyen LLP, Nguyen TB, Dam MS, Taranyi D, Baranyai L. LeafLaminaMap: Exploring Leaf Color Patterns Using RGB Color Indices. AgriEngineering. 2025; 7(2):39. https://doi.org/10.3390/agriengineering7020039
Chicago/Turabian StyleBodor-Pesti, Péter, Lien Le Phuong Nguyen, Thanh Ba Nguyen, Mai Sao Dam, Dóra Taranyi, and László Baranyai. 2025. "LeafLaminaMap: Exploring Leaf Color Patterns Using RGB Color Indices" AgriEngineering 7, no. 2: 39. https://doi.org/10.3390/agriengineering7020039
APA StyleBodor-Pesti, P., Nguyen, L. L. P., Nguyen, T. B., Dam, M. S., Taranyi, D., & Baranyai, L. (2025). LeafLaminaMap: Exploring Leaf Color Patterns Using RGB Color Indices. AgriEngineering, 7(2), 39. https://doi.org/10.3390/agriengineering7020039