Article

Dynamic Identification Tests of 20th Century Historic Masonry Buildings in Japan

1
Department of Architecture, Shinshu University, 4-17-1, Wakasato, Nagano 380-8553, Japan
2
Department of Information Environment, Tokyo Denki University, 2-1200, Muzai Gakuendai Inzai, Chiba 270-1382, Japan
3
Department of Architecture, Mie University, 1577 Kurimamachiya-chō, Tsu 514-8507, Japan
*
Author to whom correspondence should be addressed.
GeoHazards 2021, 2(4), 332-351; https://doi.org/10.3390/geohazards2040018
Submission received: 4 September 2021 / Revised: 24 October 2021 / Accepted: 29 October 2021 / Published: 31 October 2021

Abstract

:
This paper discussed the application of health monitoring systems to 20th-century historic buildings. Natural disasters are major threats to monuments. They are often seismically vulnerable and require interventions. However, taking into account their historic and cultural values, it is appropriate to observe long-term behaviour before making a decision on intervention schemes. To this aim, health monitoring is considered an effective approach. In recent years, MEMS (micro-electromechanical systems) accelerometers have been attracting attention for their convenience and efficacy. Nonetheless, the reliability of MEMS accelerometers still needs to be examined for the monitoring of monuments as sufficient research contributions have not been made. This paper presented two case studies that were monitored by means of MEMS accelerometers. They were masonry structures positioned in seismic-prone regions in Japan. A number of earthquakes were detected by the accelerometers during one year of monitoring. To examine the accuracy of the adopted MEMS accelerometers, dynamic identification tests were conducted using high-sensitivity strain-gauge accelerometers and servo velocity meters. Based on responses obtained from the tests, numerical simulation was performed. Nonlinear static analysis was performed. The numerical simulation permitted the comparison of reliability among sensors and test types. This paper provided suggestions for the dynamic identification tests of heritage structures.

1. Introduction

Natural disasters, including earthquakes, floods, hurricanes and volcanic eruptions, may affect historical buildings seriously [1,2]. Historical buildings often have limited seismic strength [3]. The recent seismic vulnerability assessment of historical masonry structures showed that they were vulnerable due to irregular masonry morphology [4], insufficient connections between structural elements [5] and interaction among adjacent buildings [6]. Although historical buildings may require strengthening, considering their historic and cultural values, interventions should be designed carefully on the basis of close observations of their behaviour [7,8,9].
Vibration tests are useful to examine the dynamic behaviour of historical structures [10,11]. The credibility of tests is highly dependent on factors, including structural types, sensors and input load types [10,12]. Tests are typically performed under artificial excitation and/or operational conditions [13,14,15]. Artificial excitation may explicitly exhibit the dynamic behaviour of the tested structures [14,16]. Tests under operational conditions are often performed for the study of historical structures [13,17]. Such tests usually last a certain period of timem and the obtained waveforms may need to be examined carefully to identify the dynamic behaviour of the studied structures [18]. In addition, to perform tests with accuracy, sensitive sensors are necessary [19]. Piezoelectric accelerometers are often employed to measure the vibration of masonry buildings as they have high resolution that permits the observation of low vibration amplitudes [20,21]. Although servo sensors are highly precise, they are costly and heavy [22,23]. Strain gauges are used for a wide range of sensors, including accelerometers [24,25].
Health monitoring is performed to observe the long-term behaviour of infrastructure constructions and historical structures [26,27]. To this aim, MEMS (micro-electromechanical systems) sensors increasingly attract attention [28,29]. Thanks to investigation and practice with MEMS sensors in recent decades, MEMS technology has shown remarkable advances along with the development of information and communication technology [30,31,32]. Issues are seen, including noise levels at low-frequency ranges, to which historical structures are usually vulnerable [33]. Monitoring can track the seasonal changes of the behaviour [34,35] and has a possibility to observe the behaviour of the studied structure under earthquakes [36]. Long-term monitoring results in a large amount of data, and automated data processing can be an efficient tool to extract useful information [37,38].
Dynamic identification tests are often taken advantage of for the seismic assessment of masonry structures [39,40]. Numerical analysis can be a useful tool to closely observe the behaviour of historical structures [41,42,43]. Nonetheless, the seismic analysis of masonry structures still faces challenges, including the discretisation of joint behaviour between structural elements [41], a trade-off between the complexity of analysis and the accuracy of results [42] and the calibration of models based on updating elastic modulus [43]. The rigorous calibration of numerical models is essential to perform reliable seismic assessment [44,45]. The calibrated models permitted the observation of interaction with adjacent structures [46] and with soil [47] and the evaluation of retrofitting schemes [48].
Two historic masonry buildings in Japan were chosen as the case studies in this paper. Their behaviour was observed by vibration testing and health monitoring. For the vibration testing, strain-gauge-based accelerometers and servo velometers were used. For the monitoring, MEMS accelerometers were adopted. To examine the reliability of the results obtained from the two tests, pushover analysis was performed by numerical simulation. The seismic vulnerabilities of the studied structures were discussed based on dynamic identification tests and numerical analysis. Comparison between the vibration testing and monitoring highlighted their advantages and limitations as the dynamic identification tests of historical structures. This paper contributed to the dynamic testing of historical structures.

2. Research Methodologies

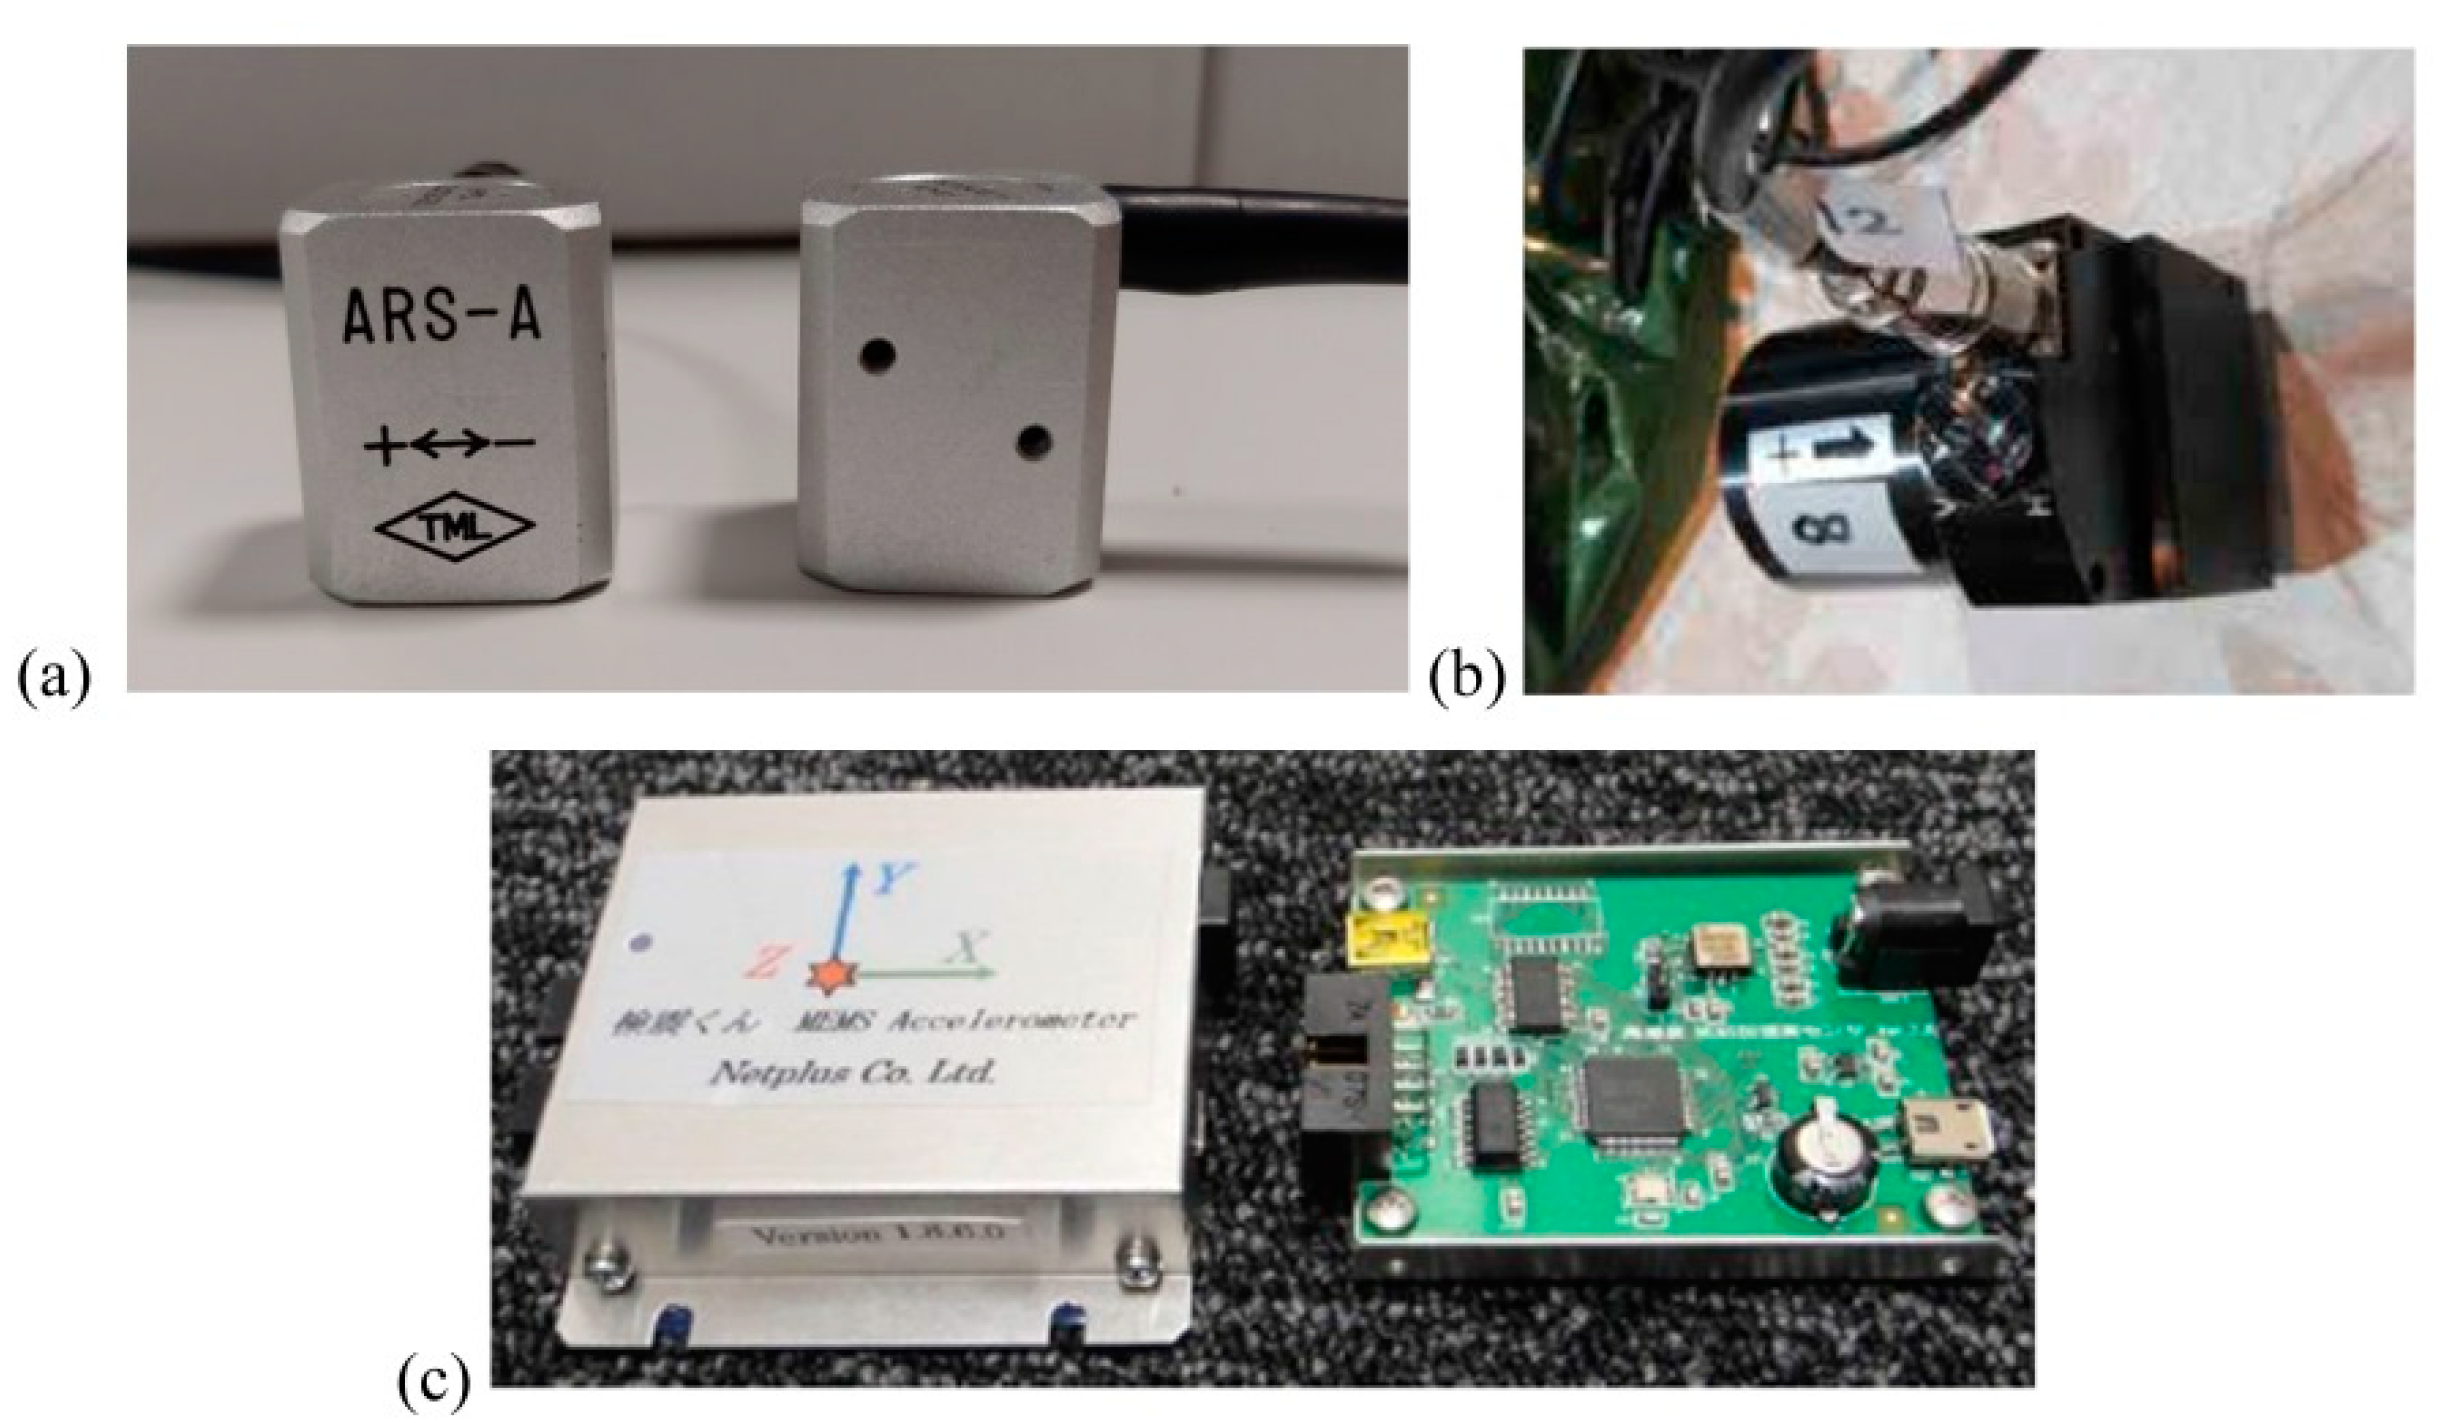
2.1. Dynamic Identification Tests

Dynamic identification tests, vibration testing and monitoring were performed. As for vibration testing, ambient and forced vibration tests were conducted. Strain-gauge accelerometers and servo velocity meters were used. The frequency range of the strain-gauge-based accelerometers was from 0 to 30 Hz [49] (Figure 1a). The measuring range was ±10 m/s2. The resolution level was 0.0333 cm/s2. It is added that the used accelerometers were developed particularly for the vibration testing of buildings [49]. The frequency range of the servo velocity meters was from 0.2 to 70 Hz [50] (Figure 1b). The measuring range was ±0.1 m/s. The resolution level was 10−5 cm/s2. These sensors excel in the measurement of low-frequency ranges that are usually observed as the fundamental frequency of historical structures [50].
Health monitoring was performed with MEMS sensors (Figure 1c). The used sensors were developed by one of the authors (Yasushi Niitsu), and studies have been performed to examine its applicability to historical structures [51,52]. One of their advantages is a data recording method. Data recording can be controlled by assigning trigger acceleration. In case the difference between the minimum and maximum acceleration values within a second is larger than the assigned value, data is stored according to the specified sample rate. Otherwise, only the maximum and minimum values are stored every second. An acceleration sensor, ADXL-355(Analog Devices, Norwood, MA, USA), was installed [53]. It functions tri-axially with 20-bit resolution digital outputs. The measurable frequency range is 0 to 30 Hz. In this study, the measuring range was set at ±20 m/s2. For this range, the resolution level was 0.005 cm/s2. In this study, the trigger level was set as 0.01 m/s2. Table 1 compares the specifications of the three sensors used in this study.

2.2. Research Procedures

The present research was composed of three tasks. First, vibration testing was performed on two case studies. They are introduced in Section 3.1. Second, monitoring was conducted. It was continued for at least a year (2020.08–2021.08). Third, numerical analysis was performed on the two case studies. The used numerical models were calibrated according to results obtained from the abovementioned vibration testing and monitoring. Nonlinear static analysis was adopted to the calibrated models to examine the seismic vulnerabilities of the case studies.

3. Case Study Description

3.1. Description of the Structures

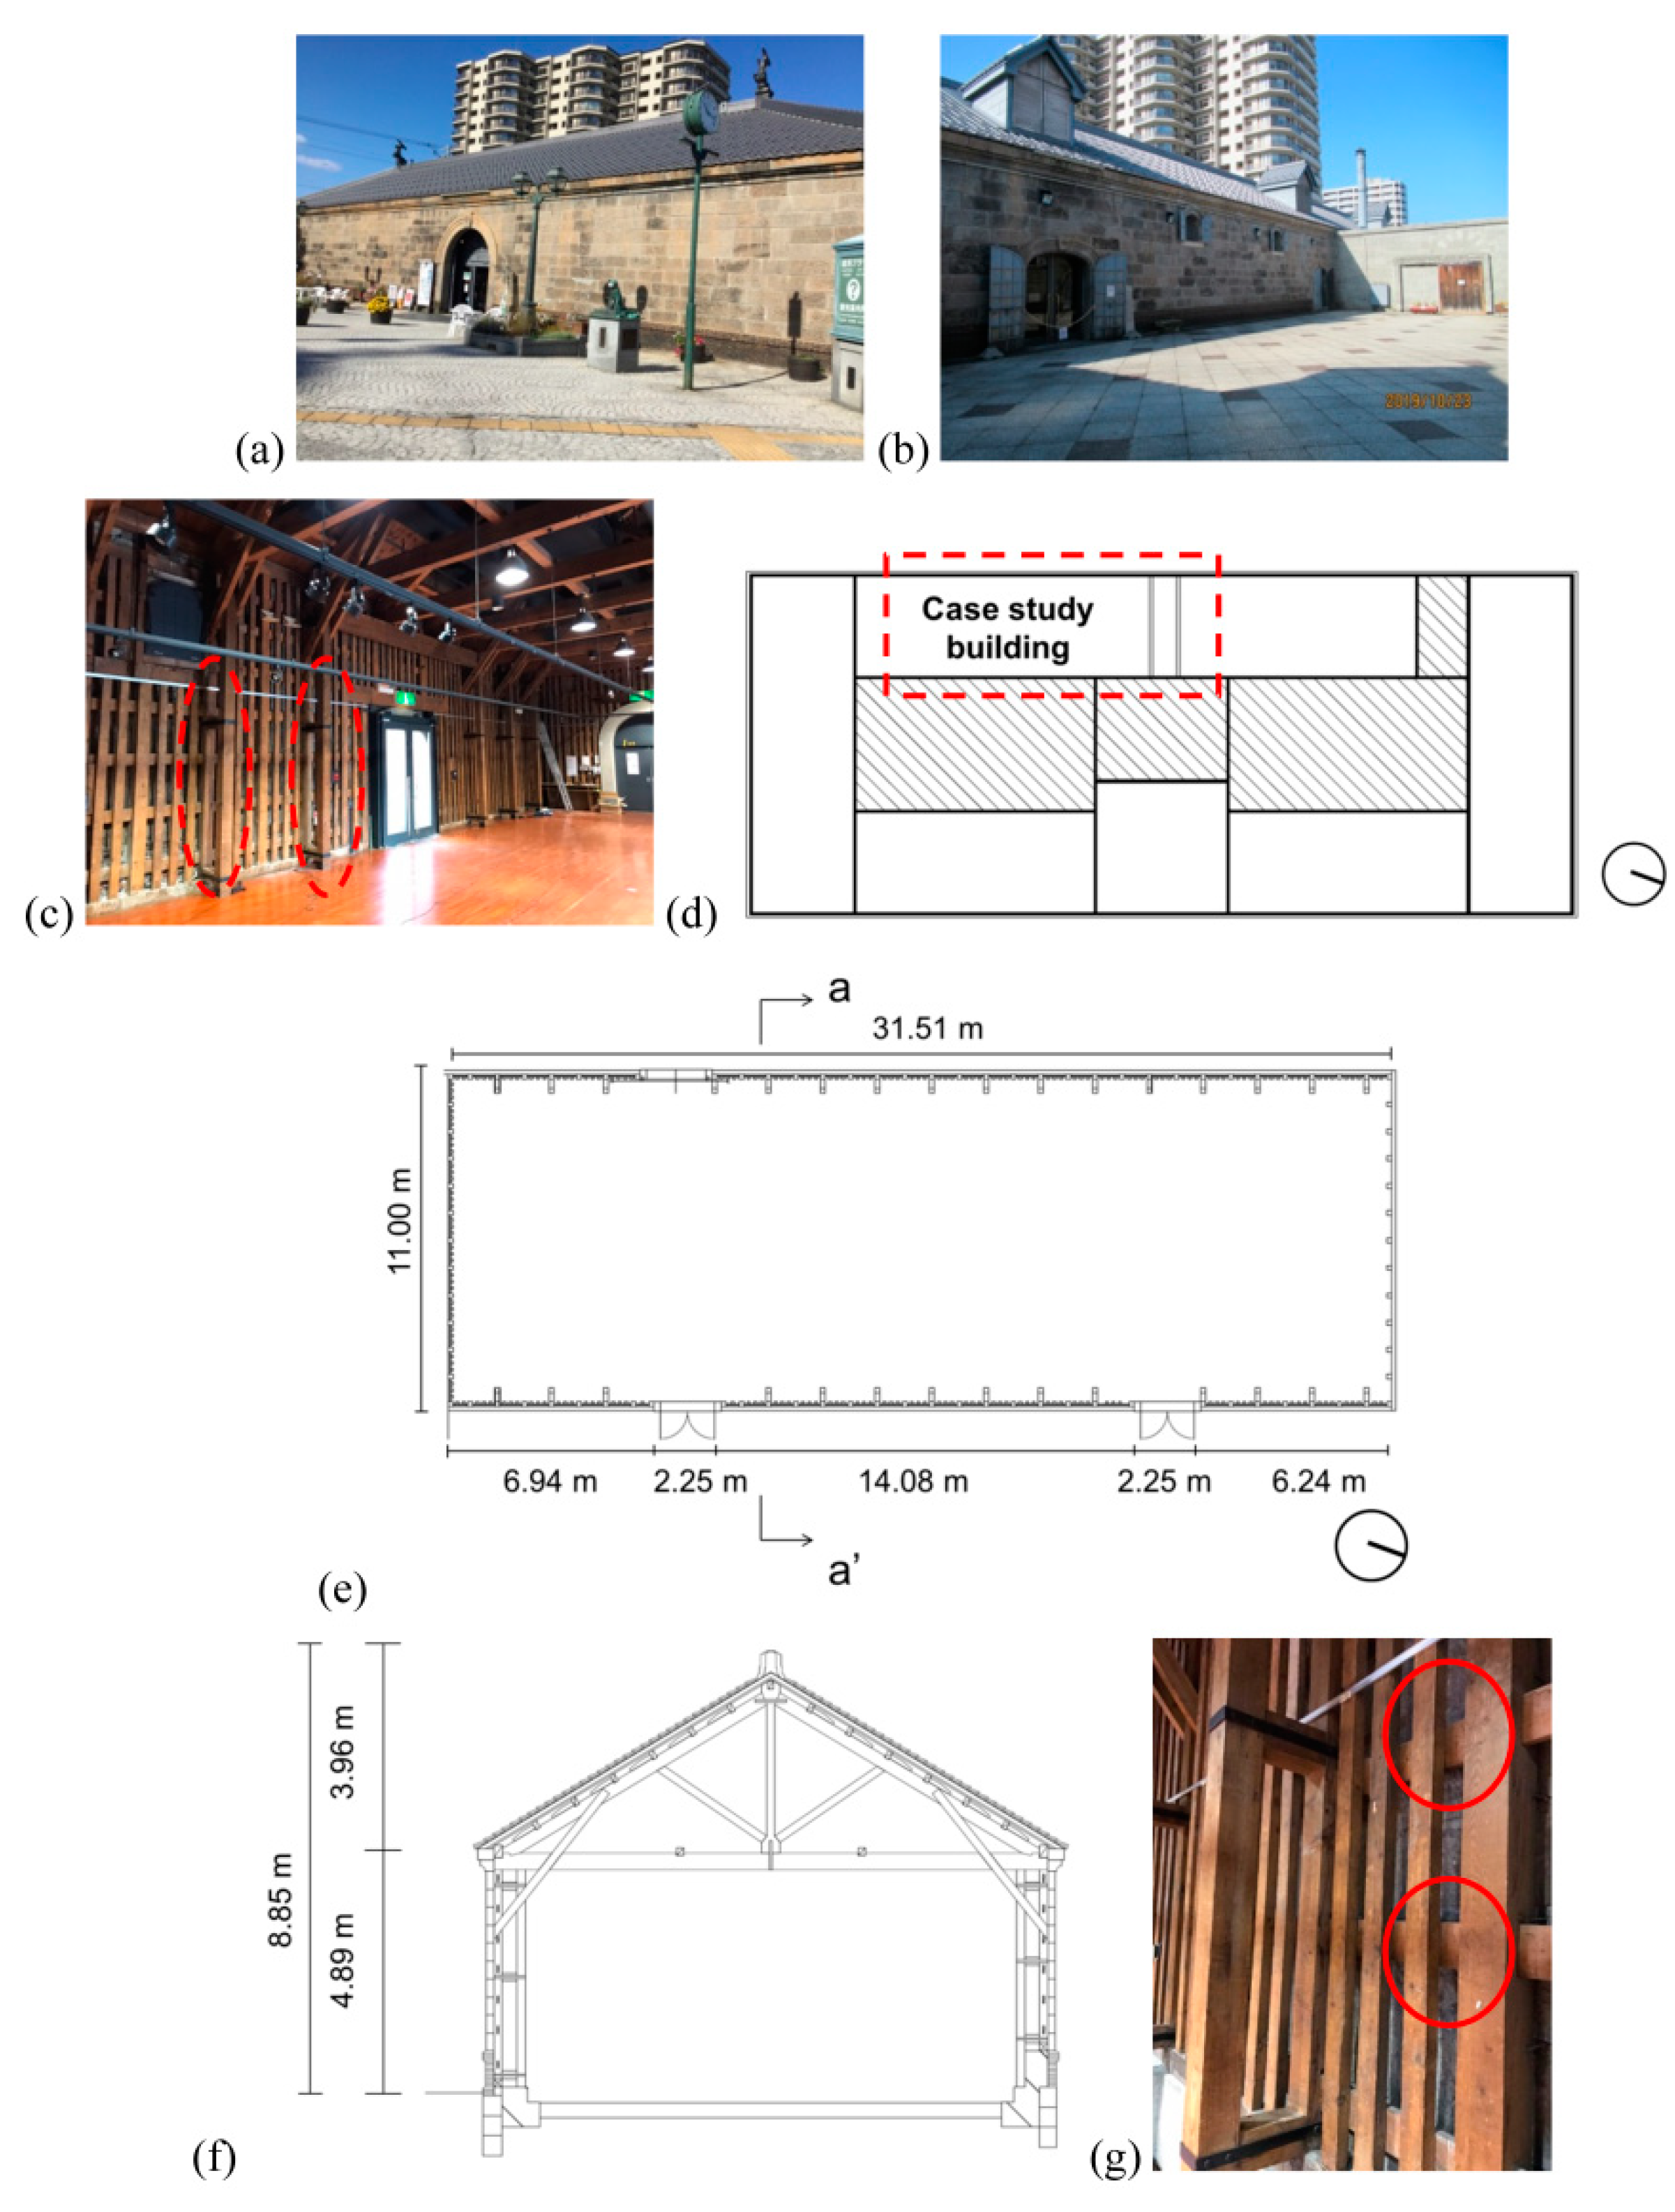
3.1.1. Otaru Warehouse

The first case study is a warehouse in Otaru city, Japan. It is part of a complex composed of five warehouses, an office building and an exposition hall (Figure 2a). It was built around in the late 19th century [54,55]. It has been inscribed as a local monument by the Otaru city since 1985 for its cultural and historical significance [56]. This paper focused on a storehouse in the south-west corner (Figure 2b,d). In this paper, it is called the Otaru warehouse. It is a one-storey building. The walls are composed of welded tuff and cement mortar. Tuff and welded tuff were often used for construction works, and nearly 300 masonry monuments are present in the city [56]. The building is 31.5 m wide and 10.9 m deep. It is 8.85 m tall (Figure 2e). The wall is 4.89 m tall (Figure 2f). Entrances and windows are present in the east and west elevations. The dimensions of the entrances are 2.24 × 2.4 m2. The dimensions of the windows are 0.91 × 1.20 m2. The walls are one-leaf and 15 cm thick. The bottom parts of the walls are 31 cm thick. This difference in wall thickness is attributed to the existence of timber frames. The interior side of the walls is covered with timber frames (Figure 2c). The frames are composed of timber girts and studs. The cross-section of the girts is 135 × 35 mm2 while that of the studs is 160 × 160 mm2. Girts are coupled with studs by penetrating them without the use of nails (red circles in Figure 2g). Such a construction technique is called nuki joints [57]. Nuki joints were typically used for medieval Buddhism temples in Japan [58]. The studs stand on the bottom parts of masonry walls. The studs are connected to the external walls by iron pegs. The iron pegs are positioned beneath the nuki joints. The roofs are composed of timber trusses, timber boards and ceramic tiles. As for the roof trusses, the cross-section of beams is 280 × 165 mm2 while that of joists 155 × 100 mm2. Jezo spruce (Picea jezoensis) is used for timber frames and trusses. In the 1980s, as part of strengthening, timber columns were added (see red circles in Figure 2c). They were connected to the existing studs via timber noggings (Figure 2f). Secure connections between the columns and studs were provided by steel plates (see Figure 2g). According to a 27-meter borehole survey conducted on the ground close to the site of the case study in 2014, the subsoil is mainly composed of sand [59]. It was considered type II ground according to the Japanese building standard law [60]. The ground is categorised into three types. Type I denotes rock ground and while type III denotes soft loam. Type II is between the two abovementioned types.

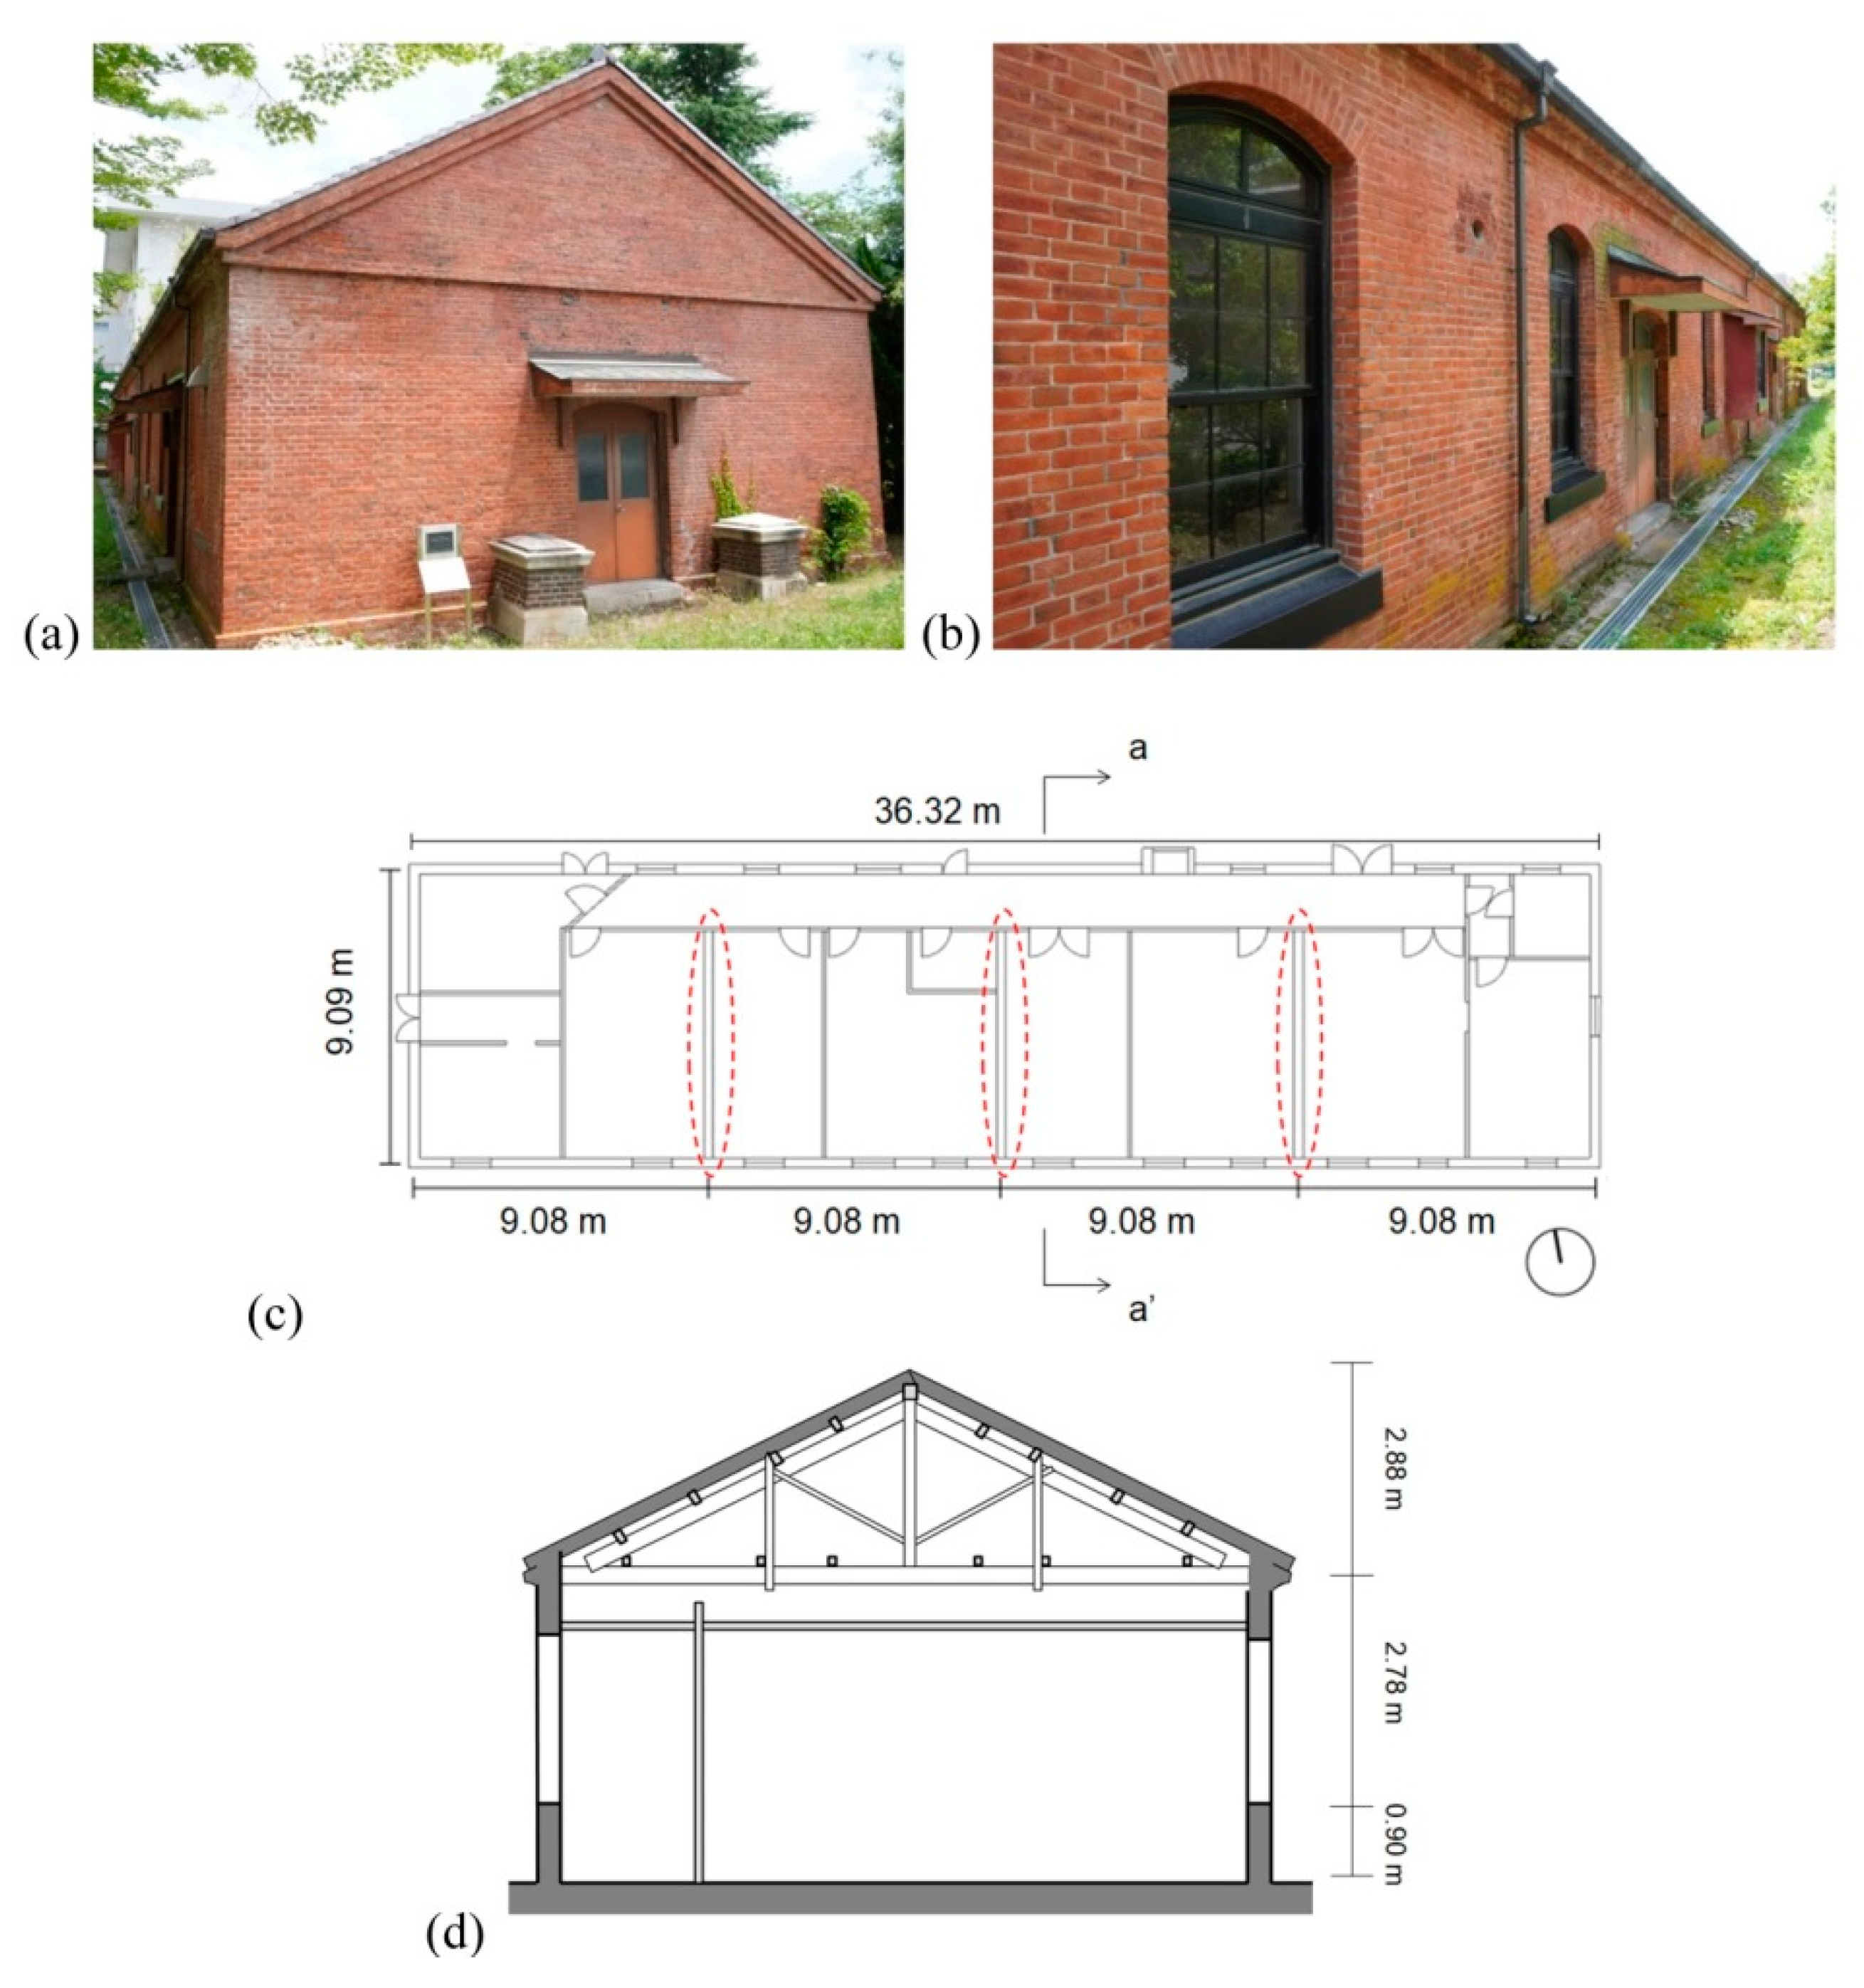
3.1.2. Matsumoto Storehouse

The second case study is a former military storehouse in Matsumoto city, Japan (Figure 3a,b). In this paper, it is called the Matsumoto storehouse. It was built in 1908. It has been inscribed as a national registered tangible cultural property since 2012 for its historic value [61,62]. It was originally built as a military storehouse. It is currently used as a university depository. It is a single storey, and is covered with gabled roofs. The walls are built of fired solid bricks and cement mortar. The building is 36.32 m long and is 9.09 m wide (Figure 3c). The height is 6.56 m (Figure 3d). The walls are 3.68 m high. Originally, the building was divided into four rooms by three interior brick masonry walls (walls in red broken line circles in Figure 3e). In 1959, the four rooms were divided into nine by adding partition concrete block walls. The exterior walls are one and a half leaves and 0.35 m thick. The interior brick walls are one leaf and 0.3 m. The interior concrete block masonry walls are 0.1 m thick. The entrances are located in the west and north elevations. The dimensions are 1.43 × 2.25 m2. The dimensions of the windows are 1.15 × 2 m2. The roof trusses are covered with timber boards and ceramic tiles. Japanese cedar (Cryptomeria) is used for the roof trusses. According to a 17-meter borehole survey performed on nearby ground in 2001, the soil is mainly composed of silts [59]. It is type II ground [60].

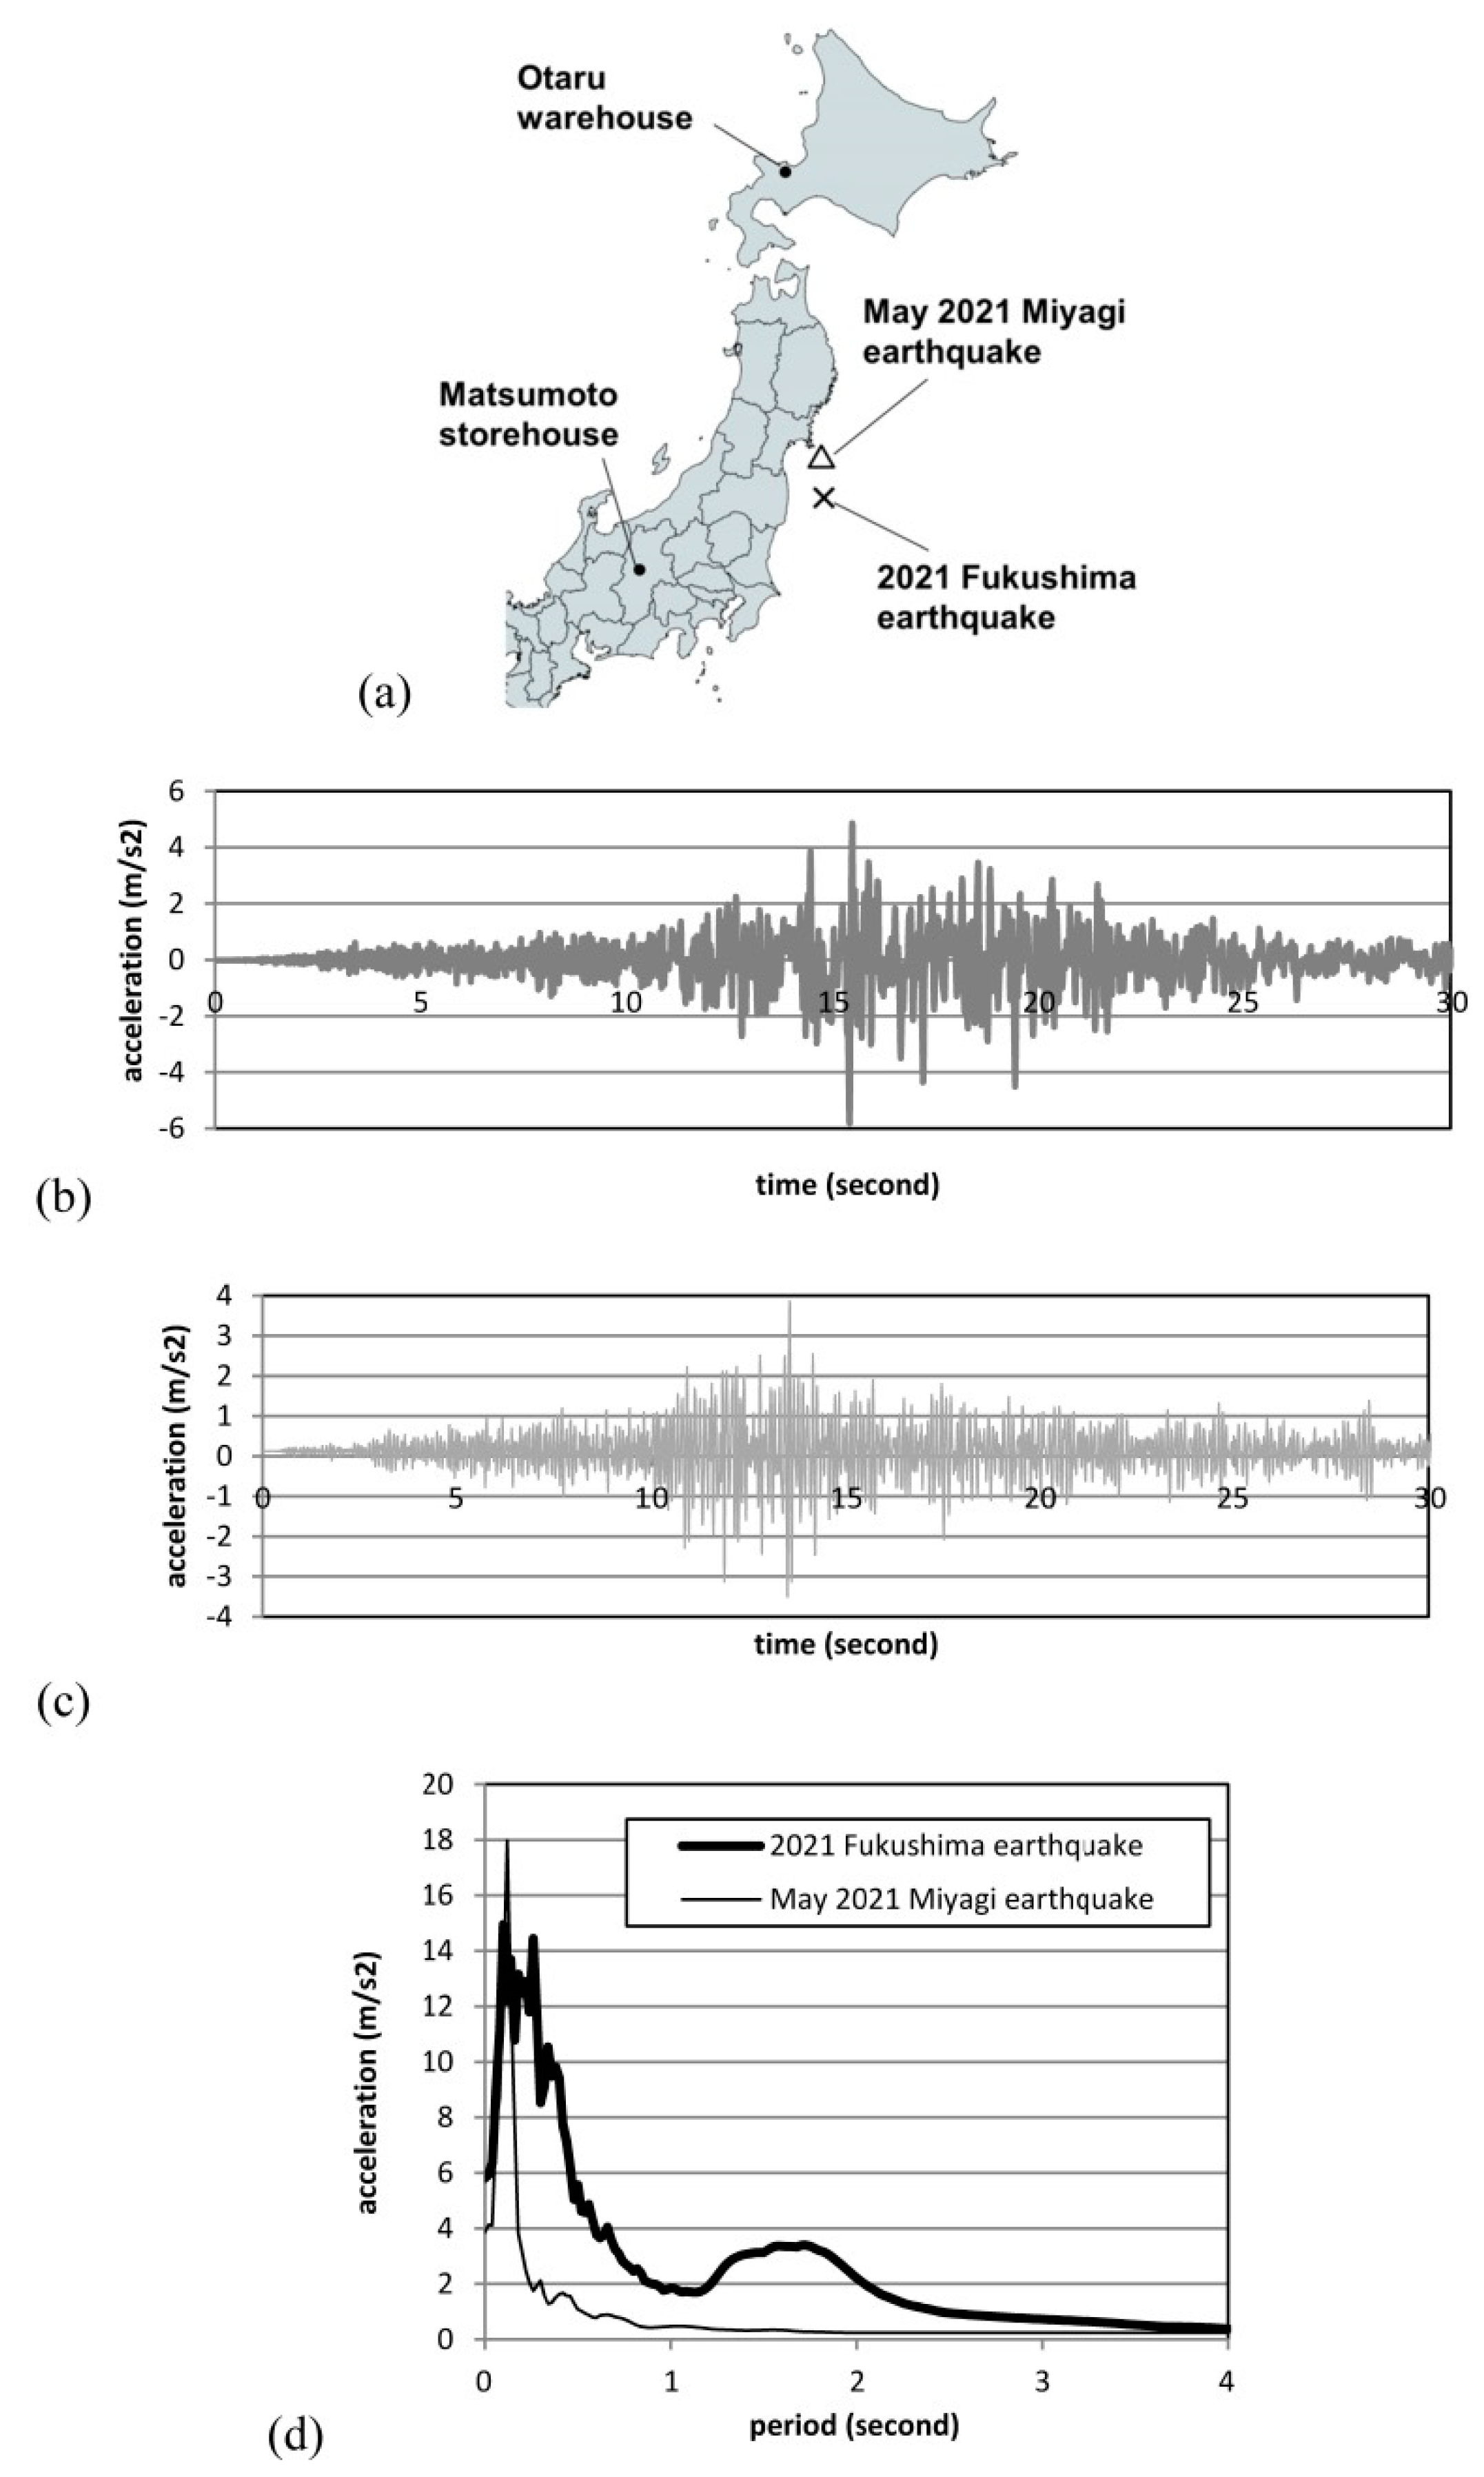
3.2. Occurrence of Earthquakes during the Monitoring Period

Earthquake records were taken from the website of the Japan Meteorological Agency (JMA) [63]. A number of moderate and strong earthquakes were recorded around Japan. However, most of them caused minor vibrations to the regions in which the studied structures are located. Among them, two strong earthquakes occurred (Figure 4a). One hit in a northern region on 13 February 2021. It was called the 2021 Fukushima earthquake. The magnitude was 7.1 Mw [64]. The peak ground acceleration (PGA) was 5.8 m/s2 in the EW direction (Figure 4b). The epicentre was 611.2 km from the Otaru warehouse and 376.6 km from the Matsumoto storehouse. The other occurred on 1 May 2021. It was named the May 2021 Miyagi earthquake. The magnitude was 6.8 Mw [64]. The PGA was 3.9 m/s2 in the EW direction (Figure 4c). The epicentre was 558.3 km from the Otaru warehouse and 387.6 km from the Matsumoto storehouse. Figure 4d presents the response spectra generated from the accelerograms of the two earthquakes. The 2021 Fukushima earthquake showed high spectral accelerations at periods between 0.06 and 0.4 s. The May 2021 Miyagi earthquake presented peak spectral accelerations at a period of 0.12 s.

4. Experimental Results

4.1. Vibration Testing

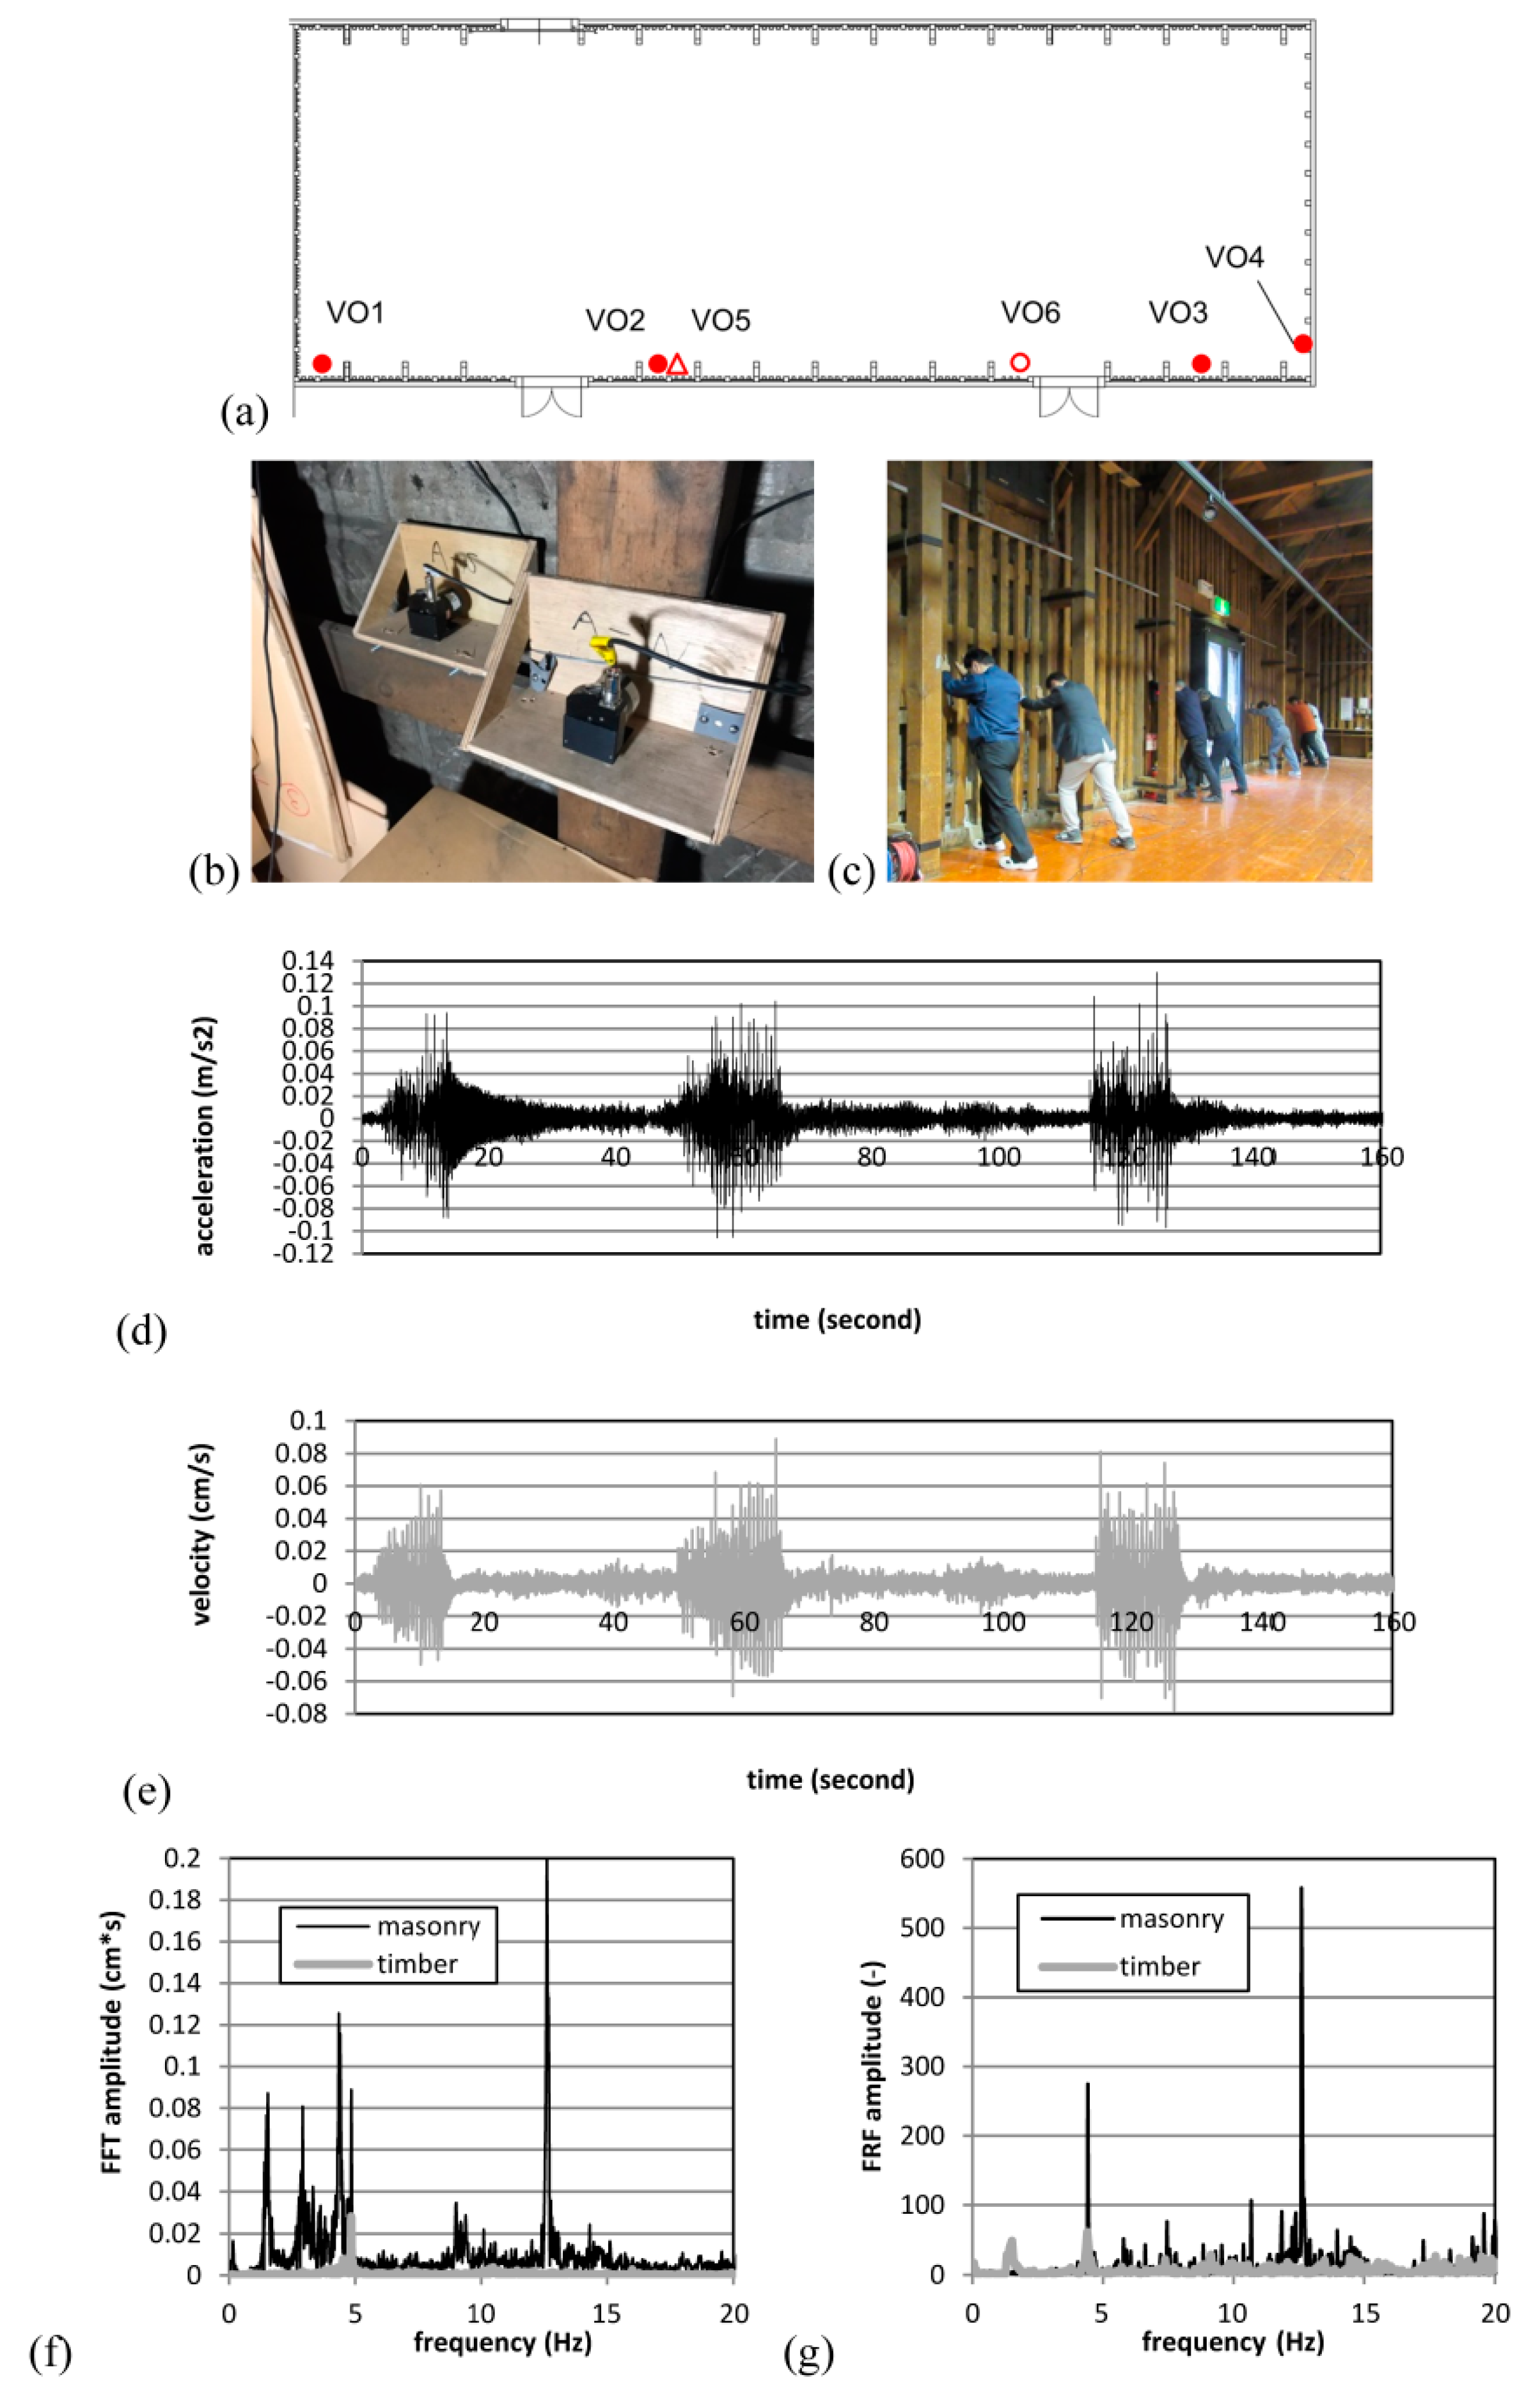
4.1.1. Otaru Warehouse

The vibration testing of the Otaru warehouse was conducted with servo velocity meters. Five sensors were placed on the walls at the height of 3.5 m (VO1–5) (Figure 5a). The VO1–5 sensors were placed on wooden containers to avoid damage to the structure (Figure 5b). The VO1–4 sensors were attached to the walls. The VO1–3 sensors were placed on the west wall at 0.4, 11.1 and 29.3 m from the south wall. The VO5 sensor was located very close to the VO2 sensor. This sensor was attached to a timber stud. The VO6 sensor was located on the floor. The positions of the sensors were chosen so that the mode shapes and natural frequencies of the east wall were captured properly. Ambient and forced vibration tests were performed. For both tests, the measurement continued for 160 s. The sampling rate was set as 200 samples/second. As for the forced vibration test, the west wall was pushed outwards from the interior side of the wall by 10 people every second for 20 s (Figure 5c). The excitations were repeated three times. The excitations were given at around the height of 1.5 m. The tests were performed on 22 October 2019.
The time history of acceleration of VO2, five sensors are presented in Figure 5d,e. Their Fourier spectrum is calculated by Fast Fourier Transform (FFT) (Figure 5f). Frequency transfer functions (FRFs) (VO2/VO6, VO5/VO6) presented that the fundamental eigenvalue was 4.78 Hz in the EW direction (Figure 5g). A timber stud also showed a peak at the same frequency. It is noted that the east wall showed a peak at 12.6 Hz, although a timber stud did not present a peak at this frequency. It is added that ambient tests did not show as evident peak amplitudes as forced vibration tests.

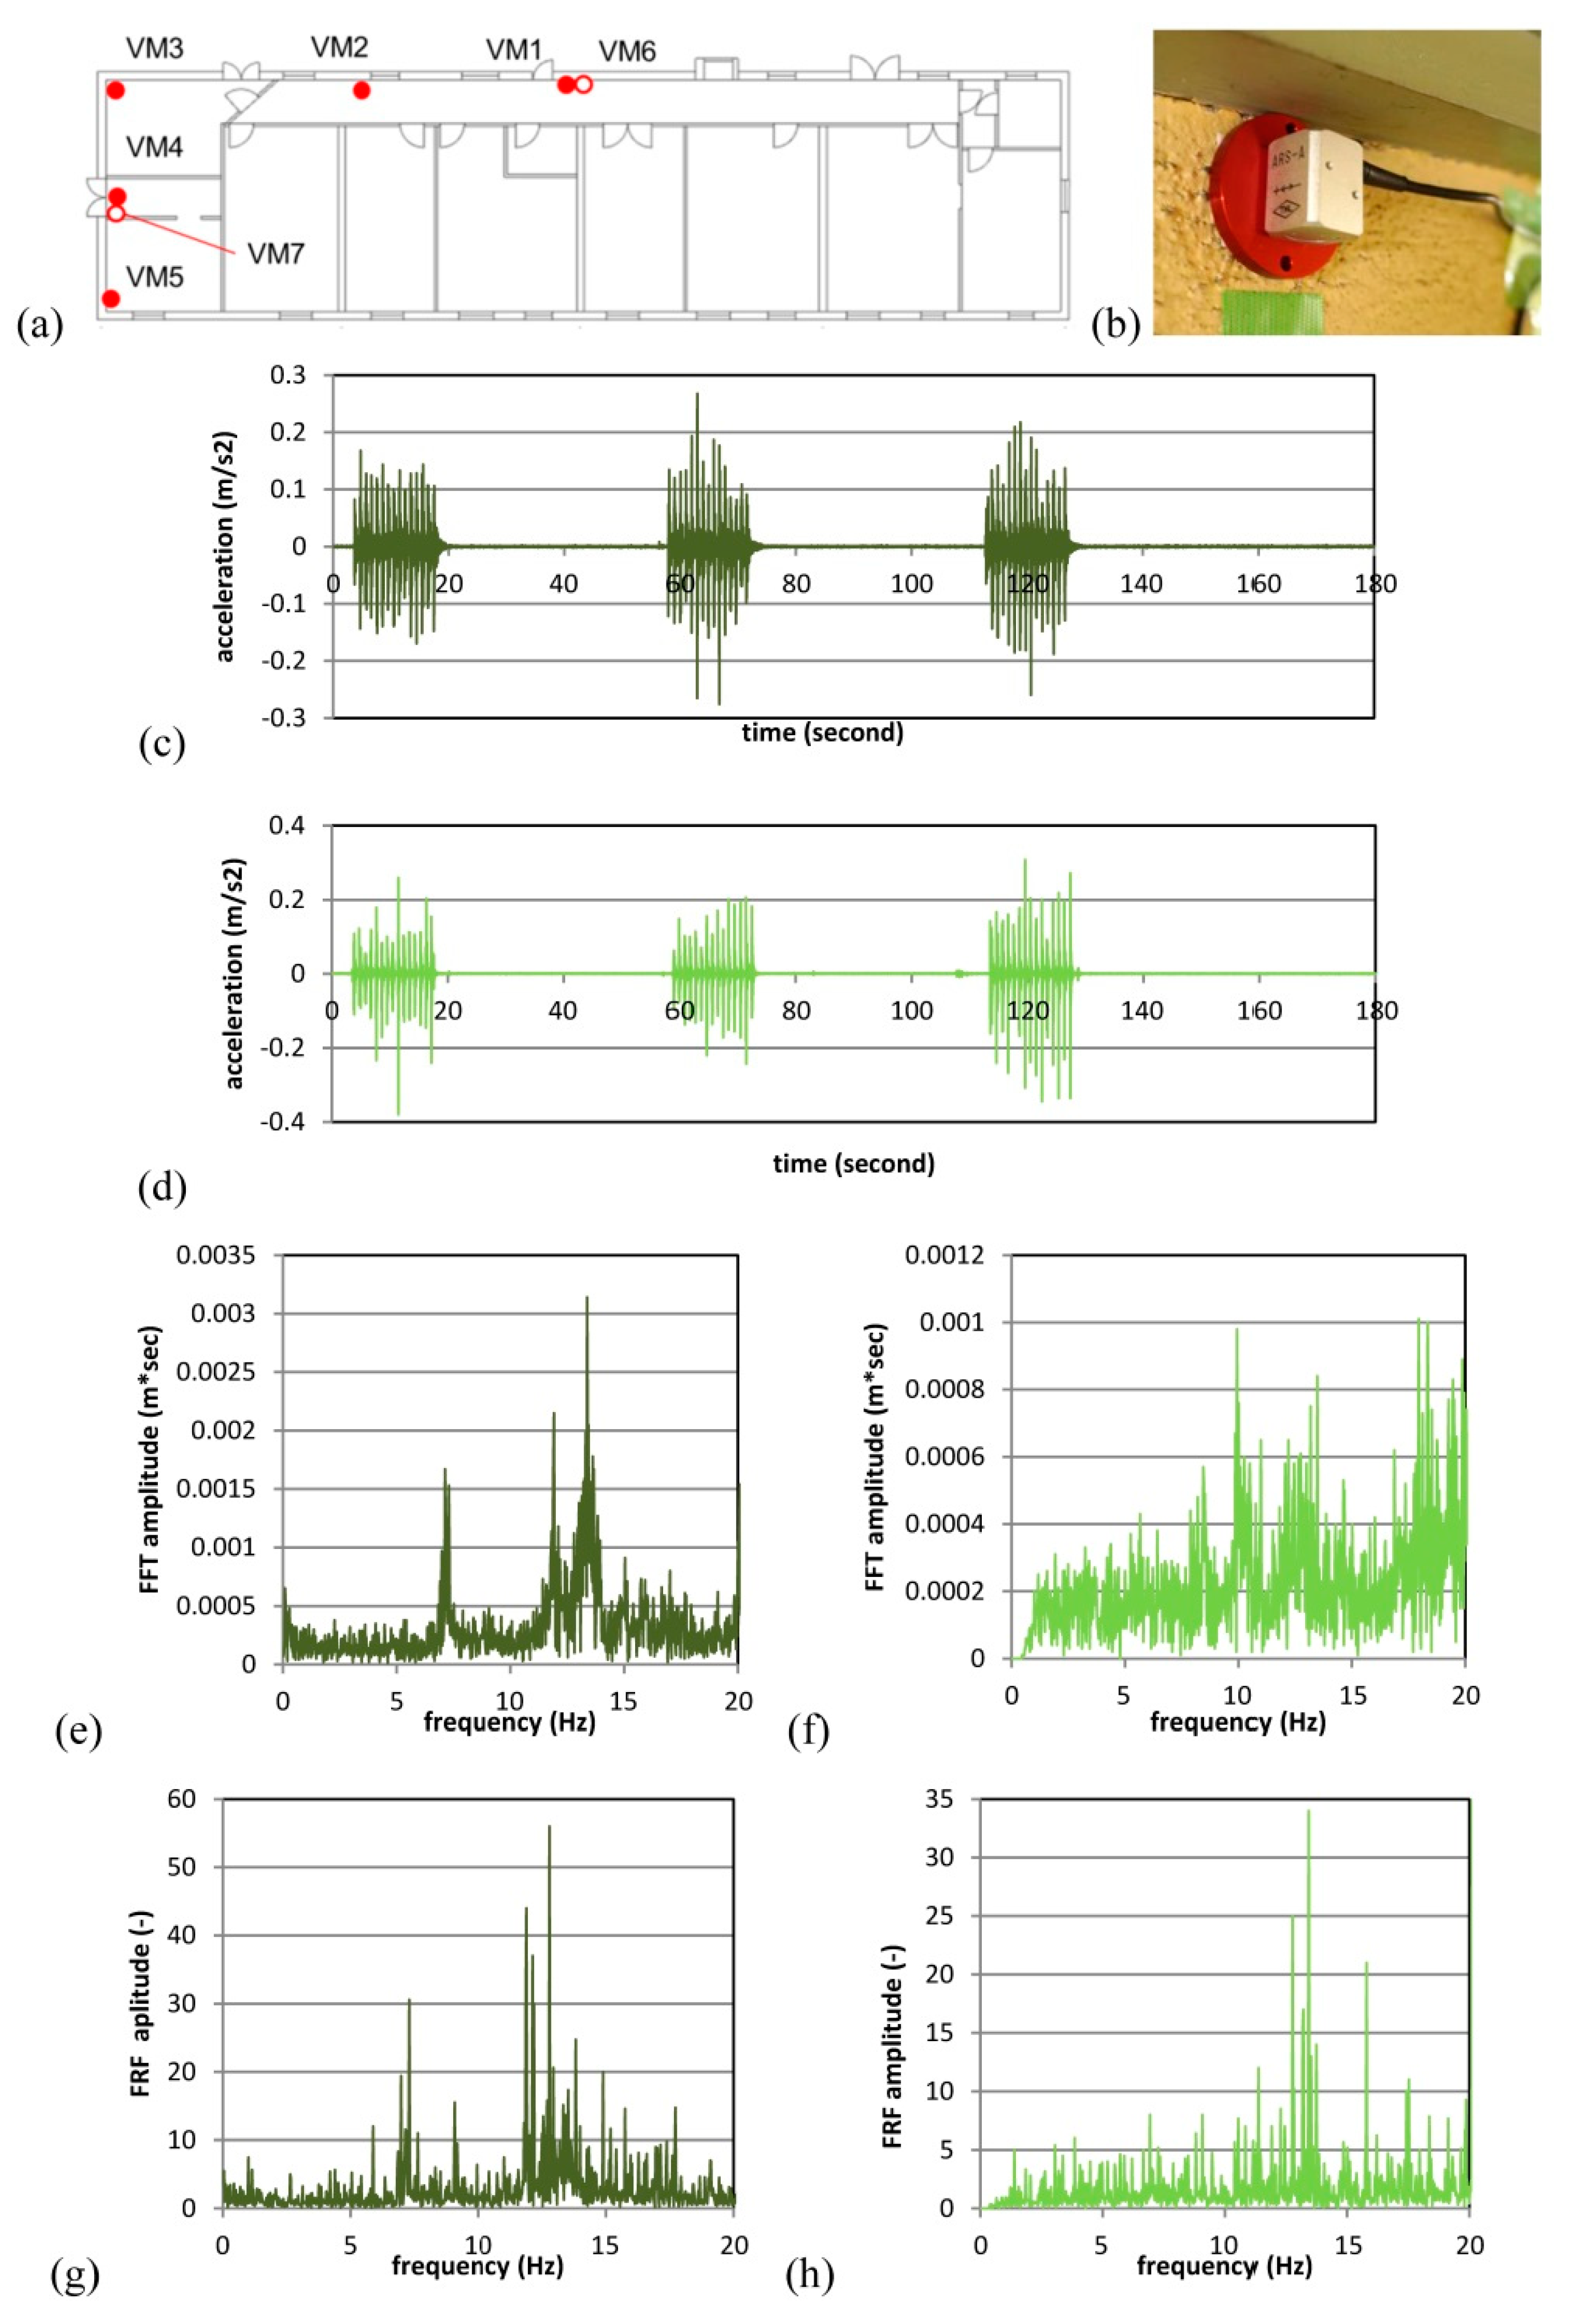
4.1.2. Matsumoto Warehouse

The vibration testing of the Matsumoto storehouse was conducted with strain-gauge accelerometers. Five uniaxial sensors (VM1–5) were placed on walls at the height of 3.2 m (Figure 6a). The VM1 sensor was located at the mid-span of the north wall. The VM3 sensor was positioned at the corner of the north and west walls. The VM2 sensor was positioned in the middle between the VM1 and VM3 sensors. The VM4 sensor was placed at the mid-span of the north wall. Two sensors (VM6, 7) were located on a floor slab. The positions of the sensors were chosen to capture the movements of the north and west walls so that the mode shapes and natural frequencies of the walls were detected. They were attached with circular steel plates to avoid damage to the sensors and walls during the removal of the sensors (Figure 6b). Ambient vibration and forced vibration tests were performed. The forced vibration tests were performed in the same procedure as the Otaru warehouse, as discussed in Section 4.1.1. The excitations were applied to the north wall for measurement in the NS direction and to the west wall for measurements in the EW direction at the height of 1.5 m, respectively. The tests were performed on November 18, 2020. It is noted that the sensors were located only on the west side of the structure due to inaccessibility to the east side. Ambient vibration tests did not present the peaks of amplitudes as clearly as force vibration tests.
The time histories of acceleration obtained by the force vibration tests are shown in Figure 6c,d. Fourier spectra are presented in Figure 6e,f. The FRFs (VM1/VM6, VM4/VM7) detected the natural frequencies equal to 12.2 and 13.4 Hz in the NS and EW directions, respectively (Figure 6g,h). A peak was seen at around 7.2 Hz. This was considered to be derived from the movement of concrete block walls. They are thinner than the interior brick masonry walls and could have shown flexible movements.

4.2. Monitoring

4.2.1. Otaru Warehouse

Three sensors (HO1–3) were installed (Figure 7a). The HO1 sensor was located on the east wall at the same position as the VO3 sensor (see Figure 5a). The HO2 sensor was attached to a timber stud. It was located very close to the HO1 sensor. The HO3 sensor was placed on the floor at the same position as the VO5 sensor. During the monitoring period, 11 earthquakes were detected. Among them, the sensors captured excitations caused by the two earthquakes introduced in Section 3.2. Figure 7b shows the vibration observed during the 2021 Fukushima earthquake, while Figure 7c shows the May 2021 Miyagi earthquake. The FRFs (HO1/HO3, HO2/HO3) are presented in Figure 7d,e. Both results showed a peak at around 4.9 Hz, as it corresponds to vibration testing, as discussed in Section 4.1.1. A peak was seen at around 2.4 Hz in both cases. As this peak was observed by both cases, it was considered to be relevant to noises picked up by sensors. Compared to the vibration test presented in Section 4.1.1, a timber stud showed peaks at a number of frequencies. It is speculated that they were picked up due to a combination of reasons, including the flexible movements of timber elements and the sensitivity of the MEMS sensors.

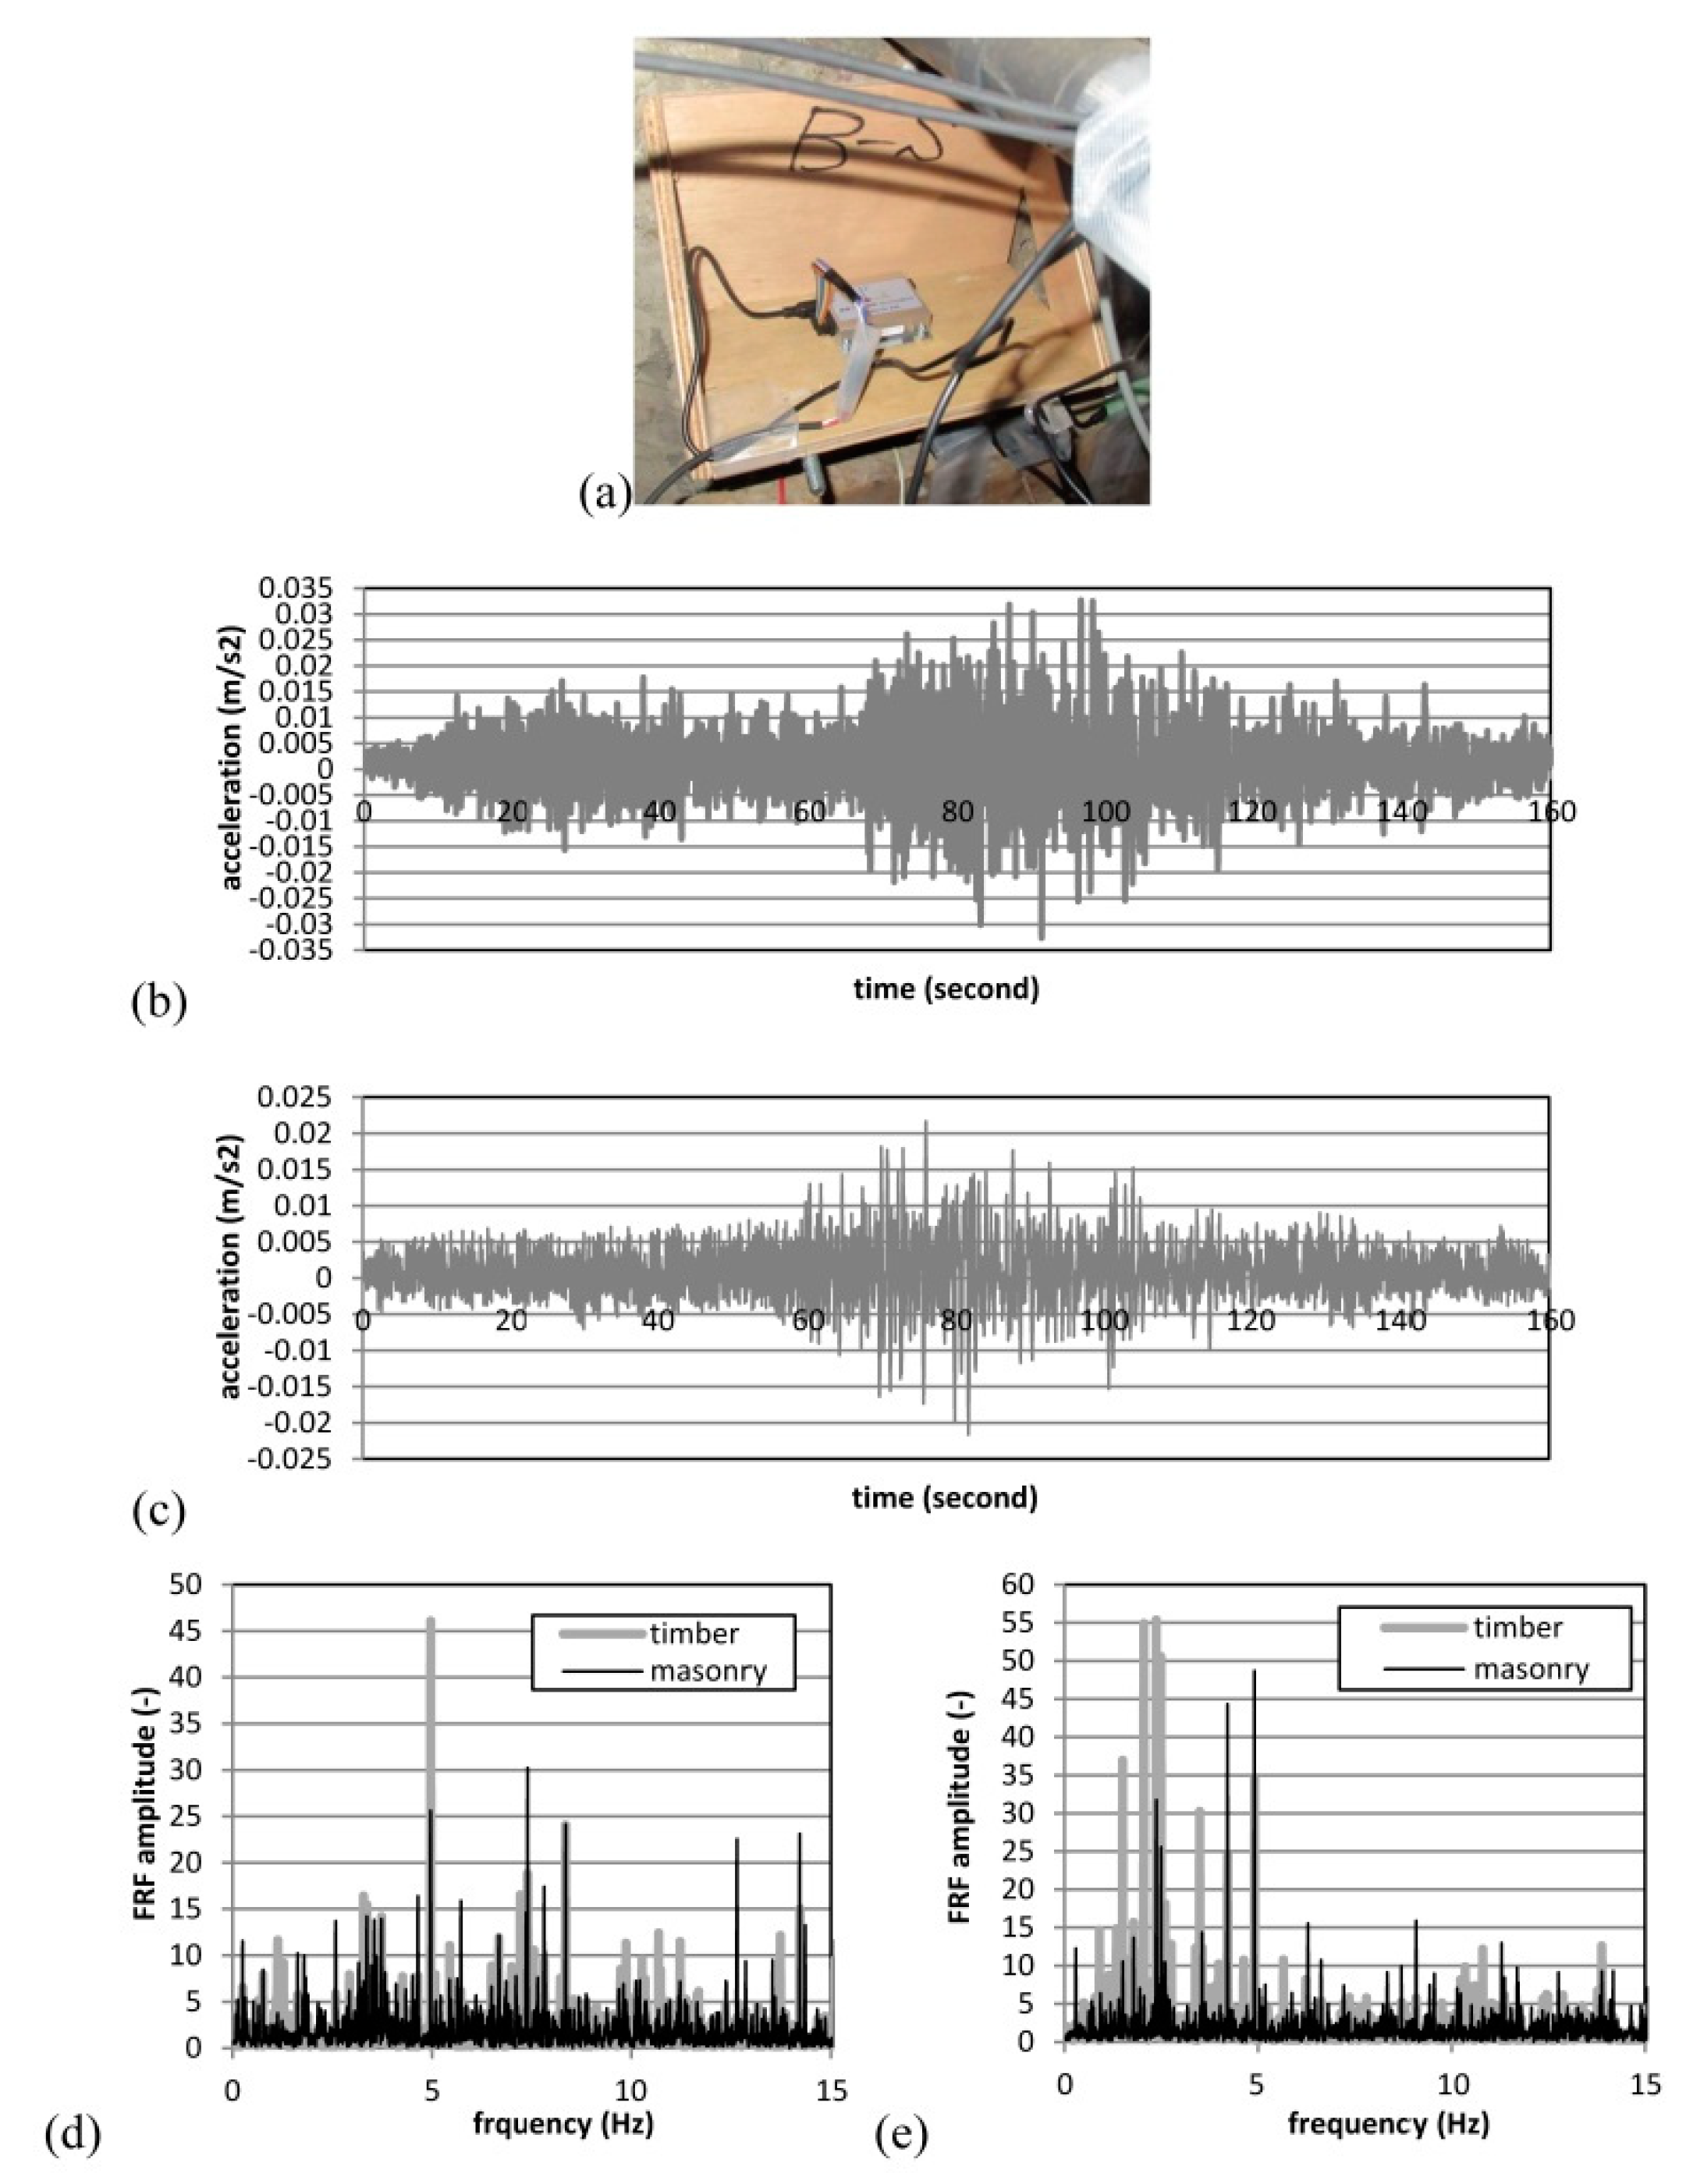
4.2.2. Matsumoto Storehouse

The monitoring of the Matsumoto storehouse was performed with MEMS accelerometers. Four sensors (HM1-4) were installed (Figure 8a). They were located in the same locations as vibration testing (Figure 8b, see Figure 6a). The HM4 sensor was put on the floor. However, no earthquakes were detected by the installed sensors during the monitoring period (Figure 8c). It is speculated that no earthquakes caused vibration that was higher than 0.01 m/s2 despite the occurrence of a number of earthquakes, as discussed in Section 3.2.
As an alternative measurement, the vibration test discussed in Section 4.1.2 was also recorded by the MEMS accelerometers. Acceleration time histories are presented in Figure 8c,d. The FRFs (HM1/HM4, HM3/HM4) presented a peak at around 12 and 14 Hz in the NS and EW directions, respectively (Figure 8e–f). These values are close to those observed in the vibration test discussed in Section 4.1.2. It is added that a peak was also seen at 1.8 Hz in both directions. It is probably relevant to noises picked up by the MEMS accelerometers, as such a peak was not observed by the vibration testing (see Figure 6g,h).

5. Numerical Simulation

5.1. Description of the Numerical Models

A commercial package, TNO DIANA, was used for the numerical analysis presented in this section [67]. The numerical model of the Otaru warehouse was composed of welded tuff masonry walls, timber studs, timber strengthening columns and timber beams. The weight of the roof panels and ceramic tiles was included by increasing the density of the timber beams. The model was composed of 15,375 nodes, 2906 two-node beam elements and 12,934 quadrilateral shell elements (Figure 9a). It is noted that the timber girts were not discretised, but only their dead weight was included in the model. Hinge connections were applied to connections between timber studs and walls. They were constrained translationally in the three axes and rotationally around the z-axis. The decisions on the omission of the girts and the application of the hinge connections were taken, taking into account the limited contributions of nuki joints and iron pegs to masonry walls based on relevant references on timber joint behaviour [68,69,70,71]. Rigid connections were applied to connections between orthogonal walls and those between a wall and timber beams. The longitudinal walls were translationally constrained in the x-direction, taking into account the building was sided by warehouses on both sides.
The numerical model of the Matsumoto storehouse was composed of brick masonry walls, concrete block masonry walls, timber beams and timber roof trusses. The roof trusses were composed of beams, joists, posts and ridges. The weight of the roofs was included by increasing the density of the roof joists. The model was composed of 24,002 nodes, 19,436 four-node quadrilateral shell elements and 1155 two-node beam elements (Figure 9b). Both models were fully fixed at the bottom of the structure. In this paper, the upper structures were only discretised for two reasons. First, this study focused on the behaviour of upper structures. Second, information on the soil of the studied structures was not sufficient for the accurate discretisation of soil behaviour.
Material properties are presented in Table 2. The properties of the masonry materials were determined considering standards of masonry [72,73,74,75,76], recent studies on welded tuff stone masonry [77,78,79,80,81,82], on brick masonry [83,84] and on concrete block masonry [85,86,87]. It is added that the modulus of elasticity of the masonry materials was determined, considering that the models showed close eigenvalues to the real structures. The tensile strength of concrete block masonry was assumed to be higher than that of brick and welded tuff masonry, considering the alleged contribution of reinforcement in concrete block masonry walls. The properties of timber were chosen, referring to typical values [88,89].
A smeared crack model was adopted to the masonry materials. The rotating total strain-based crack model was considered. In this model, crack orientations are in parallel with the axes of principal strains in each load step [90,91]. This coaxial stress-strain approach permits examining stress-strain relationships in the principal directions of strains. As uniaxial behaviour, linear tension softening was adopted while parabolic hardening was adopted in compression. The compressive fracture energy was 16,000, 16,000 and 8,000 N/m for brick, concrete block and welded tuff masonry, respectively, while the tensile fracture energy was 50, 150 and 50 N/m. The von Mises criterion was adopted for the timber materials.

5.2. Eigenvalue Analysis

5.2.1. Otaru Warehouse

Free vibration eigenvalue analysis was performed to calibrate the numerical model of the Otaru warehouse. Eight modes were identified in the y-direction. The sum of the participation factors was equal to 95%. A mode shape at the fundamental frequency is shown in Figure 10a. A modal assurance criterion (MAC) was examined by comparing mode shapes between numerical models and the real structure. The mode shape of the real structure was calculated as the ratio of FRF amplitudes. Considering the observed natural frequencies and MAC value, the real structure and FE model showed good agreement (Table 3). It is added that the numerical model did not present evident torsional modes in this eigenvalue analysis. Presumably, it was due to a low wall height for the dimensions of a plan and the symmetric distributions of the walls in the plan.

5.2.2. Matsumoto Storehouse

Free vibration eigenvalue analysis was performed to calibrate the numerical model of the Matsumoto storehouse. Two and three modes were identified in the x and y-directions, respectively. The sum of the participation factors reached 95% in each direction. It is noted that torsional modes were not found in the abovementioned modes. Taking into account the obtained natural frequencies and MAC values, the real structure and FE model showed good agreement (Table 4). The model shape of the fundamental eigenvalue is presented in Figure 10b,c. Participation factors in the x-direction were low compared to those in the y-direction. Presumably, it is attributed to the existence of partition walls that are in parallel with the east and west walls.

5.3. Nonlinear Static Analysis

5.3.1. Otaru Warehouse

Nonlinear static analysis was performed on the numerical model of the Otaru warehouse in the positive y-direction. It is noted that the structure is constrained by adjacent buildings in the x-direction. The incremental forces proportional to the masses of the structure were applied. The model showed extensive horizontal damage around the bottoms of the east and west walls (Figure 11a). Damage also appeared horizontally in the east wall at mid-height. This damage was considered due to the constraining effect of strengthening columns. The maximum base acceleration was equal to 5.9 m/s2, and the corresponding displacement was 29.1 and 26.1 mm at the top of the east wall and of the west wall at mid-span, respectively (Figure 11b).

5.3.2. Matsumoto Storehouse

Nonlinear static analysis was applied in the positive x-and negative y-direction, respectively. The forces were applied in the same manner as presented in Section 5.3.1. In the positive x-direction, the failure was due to the out-of-plane movement of the east and west walls (Figure 12a). The concrete block masonry walls showed slight damage in spite of noticeable deformation (Figure 12c). The maximum base acceleration was 5.8 m/s2, and the corresponding displacement was 4.2 and 2.7 mm at the top of the east and west walls at mid-span, respectively. In the negative y-direction, the failure was seen due to the out-of-plane movement of the south wall (Figure 12b). The maximum base acceleration was 4.3 m/s2, and the corresponding displacement was 3.8 mm at the top of the south wall at mid-span (Figure 12d).

6. Discussion

6.1. Usefulness of the Acquisition of Natural Frequencies under Different Conditions

This paper discussed dynamic identification tests performed on two masonry heritage structures. Measurement was conducted by means of MEMS accelerometers, servo velocity meters and strain-gauge accelerometers. The MEMS accelerometers were used for long-term monitoring, while the servo velocity meters and strain-gauge accelerometers were used for vibration testing. As excitation inputs, three different conditions were considered. They were ambient vibration, manual excitations and earthquakes. The last two conditions captured the fundamental mode clearly.
For accurate measurement, sensors may need to be selected in accordance with their sensitivity, excitation conditions and the dynamic characteristics of structures. In this study, servo velocity meters presented results with higher precision than strain-gauge accelerometers and MEMS accelerometers. Long-term monitoring was successfully performed with the used MEMS accelerometers. Nonetheless, it is added that MEMS accelerometers showed noises in frequencies around 2 Hz.

6.2. Calibration of Numerical Models Based on Dynamic Identification Tests

Numerical analysis indicated that the tested structures were vulnerable to out-of-plane movement. This is considered reasonable, taking into account that they are single-storey buildings with few openings. The observed maximum base acceleration was satisfactory, considering the risk of earthquakes that may hit the studied structures according to seismic hazard specified by the Japanese seismic code [60]. However, to examine the safety of the structures in detail, further assessment is essential, including the capacity spectrum method. The modulus of elasticity was adjusted by calibrating numerical models based on the fundamental frequencies of the real structures. Mode shapes were also compared between the numerical model and the real structure. As for the Otaru warehouse, deflections were comparable at the top of the east wall (Figure 13a). In the figure, the horizontal axis represents the distance from the corner of the walls. The north and east walls of the Matsumoto storehouse presented different deflections around corners (Figure 13b,c). It is considered to be derived from the definition of macro-modelling models discretised with shell elements. Such models have the possibility to over-stiffen corners. In fact, this over-stiffening effect of a macro-modelling approach was pointed out [41,43]. This discussion might suggest that the application of a macro-modelling approach to historical structures requires particular treatment for discretisation around corners.

7. Conclusions

This study examined the effectiveness and accuracy of sensors for the study of the dynamic behaviour of historical structures. The used sensors successfully demonstrated the fundamental frequency of the studied structures. The results obtained from dynamic identification tests permitted the calibration of numerical models. The comparison of natural frequencies and modal shapes permitted the close observation of the dynamic behaviour of the studied structures. The numerical models detected the vulnerabilities of the studied structures to out-of-plane movement. Nevertheless, it is noted that eigenvalue analysis showed over-stiffening influences around the corners of walls due to the nature of a macro-modelling approach.
Monitoring tests captured the vibration of the tested structures under earthquakes. However, some of the earthquakes were not recorded. In addition, data processing was not straightforward due to the presence of noises in low frequencies. This may suggest that microelectromechanical system (MEMS) sensors need to be carefully set up for the monitoring of historical structures. As further research, it is advisable to apply MEMS sensors to other types of structures, including historical multi-storey buildings, for long-term monitoring tests. It is also suggested to perform analyses taking into account soil interaction. To this aim, it is appropriate to measure microtremors with high sensitivity sensors along with dynamic identification tests.

Author Contributions

Conceptualization, Y.E.; methodology, Y.E.; software, Y.E.; validation, Y.E.; formal analysis, Y.E.; investigation, Y.E., Y.W. and Y.N.; resources, Y.E., Y.N. and T.H.; data curation, Y.E.; writing—original draft preparation, Y.E.; writing—review and editing, Y.E.; visualization, Y.E.; supervision, Y.E.; project administration, Y.E.; funding acquisition, Y.E. All authors have read and agreed to the published version of the manuscript.

Funding

Japan Society for the Promotion of Science (Tokyo), grant number: 18KK0124.

Institutional Review Board Statement

Not applicable.

Informed Consent Statement

Not applicable.

Data Availability Statement

Not applicable.

Conflicts of Interest

The authors declare no conflict of interest.

References

  1. Migoń, P.; Pijet-Migoń, E. Natural disasters, geotourism, and geo-interpretation. Geoheritage 2019, 11, 629–640. [Google Scholar] [CrossRef] [Green Version]
  2. Ortiz, P.; Antunez, V.; Martín, J.M.; Ortiz, R.; Vázquez, M.A.; Galán, E. Approach to environmental risk analysis for the main monuments in a historical city. J. Cult. Herit. 2014, 15, 432–440. [Google Scholar] [CrossRef]
  3. Diaferio, M.; Foti, D.A. procedure for the seismic risk assessment of the cultural heritage. Bull. Earthq. Eng. 2021, 19, 1027–1050. [Google Scholar] [CrossRef]
  4. Brando, G.; De Matteis, G.; Spacone, E. Predictive model for the seismic vulnerability assessment of small historic centres: Application to the inner Abruzzi Region in Italy. Eng. Struct. 2017, 153, 81–96. [Google Scholar] [CrossRef]
  5. Ruggieri, S.; Tosto, C.; Rosati, G.; Uva, G.; Ferro, A. Seismic vulnerability analysis of Masonry Churches in Piemonte after 2003 Valle Scrivia earthquake: Post-event screening and situation 17 years later. Int. J. Archit. Herit. 2020, 1–29. [Google Scholar] [CrossRef]
  6. Leggieri, V.; Zagari, G.; Ruggieri, S.; Uva, G. Appraising seismic vulnerability of masonry aggregates through an automated mechanical typological approach. Autom. Constr. 2021, 132, 103972. [Google Scholar] [CrossRef]
  7. Guzmán, P.C.; Roders, A.R.P.; Colenbrander, B.J.F. Measuring links between cultural heritage management and sustainable urban development: An overview of global monitoring tools. Cities 2017, 60, 192–201. [Google Scholar] [CrossRef]
  8. Risbøl, O.; Briese, C.; Doneus, M.; Nesbakken, A. Monitoring cultural heritage by comparing DEMs derived from historical aerial photographs and airborne laser scanning. J. Cult. Herit. 2015, 16, 202–209. [Google Scholar] [CrossRef] [Green Version]
  9. Agapiou, A.; Lysandrou, V.; Alexakis, D.D.; Themistocleous, K.; Cuca, B.; Argyriou, A.; Sarris, A.; Hadjimitsis, D.G. Cultural heritage management and monitoring using remote sensing data and GIS: The case study of Paphos area, Cyprus. Comput. Environ. Urban. Syst. 2015, 54, 230–239. [Google Scholar] [CrossRef]
  10. Makoond, N.; Pelà, L.; Molins, C.; Roca, P.; Alarcón, D. Automated data analysis for static structural health monitoring of masonry heritage structures. Struct. Control. Health Monit. 2020, 27, e2581. [Google Scholar] [CrossRef]
  11. Votsis, R.A.; Kyriakides, N.; Chrysostomou, C.Z.; Tantele, E.; Demetriou, T. Ambient vibration testing of two masonry monuments in Cyprus. Soil Dyn. Earthq. Eng. 2012, 43, 58–68. [Google Scholar] [CrossRef]
  12. Diaferio, M.; Foti, D.; Potenza, F. Prediction of the fundamental frequencies and modal shapes of historic masonry towers by empirical equations based on experimental data. Eng. Struct. 2018, 156, 433–442. [Google Scholar] [CrossRef]
  13. Roselli, I.; Malena, M.; Mongelli, M.; Cavalagli, N.; Gioffrè, M.; De Canio, G.; de Felice, G. Health assessment and ambient vibration testing of the “Ponte delle Torri” of Spoleto during the 2016–2017 Central Italy seismic sequence. J. Civ. Struct. Health Monit. 2018, 8, 199–216. [Google Scholar] [CrossRef]
  14. Atamturktur, S.; Hemez, F.M.; Laman, J.A. Uncertainty quantification in model verification and validation as applied to large scale historic masonry monuments. Eng. Struct. 2012, 43, 221–234. [Google Scholar] [CrossRef]
  15. Dolce, M.; Nicoletti, M.; De Sortis, A.; Marchesini, S.; Spina, D.; Talanas, F. Osservatorio sismico delle strutture: The Italian structural seismic monitoring network. Bull. Earthq. Eng. 2017, 15, 621–641. [Google Scholar] [CrossRef] [Green Version]
  16. Ceroni, F.; Sica, S.; Pecce, M.R.; Garofano, A. Evaluation of the natural vibration frequencies of a historical masonry building accounting for SSI. Soil Dyn. Earthq. Eng. 2014, 64, 95–101. [Google Scholar] [CrossRef]
  17. Ramos, L.F.; Marques, L.; Lourenço, P.B.; De Roeck, G.; Campos-Costa, A.; Roque, J. Monitoring historical masonry structures with operational modal analysis: Two case studies. Mech. Syst. Signal Process. 2010, 24, 1291–1305. [Google Scholar] [CrossRef] [Green Version]
  18. Torres, W.; Almazán, J.L.; Sandoval, C.; Boroschek, R. Operational modal analysis and FE model updating of the Metropolitan Cathedral of Santiago, Chile. Eng. Struct. 2017, 143, 169–188. [Google Scholar] [CrossRef]
  19. Ihsan, E.B.; Dais, D.; Smyrou, E.; Sarhosis, V. Monitoring of a historical masonry structure in case of induced seismicity. Int. J. Archit. Herit. 2021, 15, 187–204. [Google Scholar]
  20. Aras, F.; Krstevska, L.; Altary, G.; Tashkov, L. Experimental and numerical modal analyses of a historical masonry palace. Constr. Build. Mater. 2011, 25, 81–91. [Google Scholar] [CrossRef]
  21. Drozg, A.; Rogelj, J.; Čepon, G.; Boltežar, M. On the performance of direct piezoelectric rotational accelerometers in experimental structural dynamics. Measurement 2018, 127, 292–298. [Google Scholar] [CrossRef]
  22. Azzara, R.M.; Girardi, M.; Iafolla, V.; Lucchesi, D.; Padovani, C.; Pellegrini, D. Ambient vibrations of age-old masonry towers: Results of long-term dynamic monitoring in the historic centre of Lucca. Int. J. Archit. Herit. 2021, 15, 5–21. [Google Scholar] [CrossRef] [Green Version]
  23. Gattulli, V.; Lepidi, M.; Potenza, F. Dynamic testing and health monitoring of historic and modern civil structures in Italy. Struct. Monit. Maint. 2016, 3, 71–90. [Google Scholar] [CrossRef]
  24. Carr, J.J. Sensors and Circuits: Sensors, Transducers, and Supporting Circuits for Electronic Instrumentation, Measurement, and Control; Prentice Hall: Hoboken, NJ, USA, 1993. [Google Scholar]
  25. Kumar, R.; Hossain, A. Experimental performance and study of low power strain gaugewireless sensor node for structure health monitoring. Wirel. Pers. Commun. 2018, 101, 1657–1669. [Google Scholar] [CrossRef]
  26. Bedon, C.; Bergamo, E.; Izzi, M.; Noè, S. Prototyping and Validation of MEMS Accelerometers for Structural Health Monitoring—The Case Study of the Pietratagliata Cable-Stayed Bridge. J. Sens. Actuator Netw. 2018, 7, 30. [Google Scholar] [CrossRef] [Green Version]
  27. Milne, D.; Pen, L.L.; Watson, G.; Thompson, D.; Powrie, W.; Hayward, M.; Morley, S. Proving MEMS technologies for smarter railway infrastructure. Procedia Eng. 2016, 143, 1077–1084. [Google Scholar] [CrossRef] [Green Version]
  28. Dumont, M.; Wolf, D. Usage of MEMS capacitive acceleration sensors for structural monitoring. Dyn. Civ. Struct. 2019, 2, 77–89. [Google Scholar]
  29. Sabato, A.; Niezrecki, C.; Fortino, G. Wireless MEMS-based accelerometer sensor boards for structural vibration monitoring: A review. IEEE Sens. J. 2016, 17, 226–235. [Google Scholar] [CrossRef]
  30. Lammel, G. The future of MEMS sensors in our connected world. In Proceedings of the 28th IEEE International Conference on Micro Electro Mechanical Systems (MEMS 2015), Estoril, Portugal, 18–22 January 2015. [Google Scholar]
  31. Norris, A.; Saafi, M.; Romine, P. Temperature and moisture monitoring in concrete structures using embedded nanotechnology/microelectromechanical systems (MEMS) sensors. Constr. Build. Mater. 2008, 22, 111–120. [Google Scholar] [CrossRef]
  32. Akyildiz, I.F.; Su, W.; Sankarasubramaniam, Y.; Cayirci, E. Wireless sensor networks: A survey. Comput. Netw. 2002, 38, 393–422. [Google Scholar] [CrossRef] [Green Version]
  33. Potenza, F.; Federici, F.; Lepidi, M.; Gattulli, V.; Graziosi, F.; Colarieti, A. Long-term structural monitoring of the damaged Basilica, S. Maria di Collemaggio through a low-cost wireless sensor network. J. Civil. Struct. Health Monit. 2015, 5, 655–676. [Google Scholar] [CrossRef]
  34. Cabboi, A.; Gentile, C.; Saisi, A. From continuous vibration monitoring to FEM-based damage assessment: Application on a stone-masonry tower. Constr. Build. Mater. 2017, 156, 252–265. [Google Scholar] [CrossRef]
  35. Ubertini, F.; Cavalagli, N.; Kita, A.; Comanducci, G. Assessment of a monumental masonry bell-tower after 2016 Central Italy seismic sequence by long-term SHM. Bull. Earthq. Eng. 2018, 16, 775–801. [Google Scholar] [CrossRef]
  36. Aloisio, A.; Alaggio, R.; Fragiacomo, M. Dynamic identification of a masonry façade from seismic response data based on an elementary ordinary least squares approach. Eng. Struct. 2019, 197, 109415. [Google Scholar] [CrossRef]
  37. Barsocchi, P.; Bartoli, G.; Betti, M.; Girardi, M.; Mammolito, S.; Pellegrini, D.; Zini, G. Wireless sensor networks for continuous structural health monitoring of historic masonry towers. Int. J. Archit. Herit. 2021, 15, 22–44. [Google Scholar] [CrossRef]
  38. Tronci, E.M.; De Angelis, M.; Betti, R.; Altomare, V. Vibration-based structural health monitoring of a RC-masonry tower equipped with non-conventional TMD. Eng. Struct. 2020, 224, 111212. [Google Scholar] [CrossRef]
  39. Ramos, L.F.; Lourenço, P.B. Modeling and vulnerability of historical city centers in seismic areas: A case study in Lisbon. Eng. Struct. 2004, 26, 1295–1310. [Google Scholar] [CrossRef] [Green Version]
  40. Lepidi, M.; Gattulli, V.; Foti, D. Swinging-bell resonances and their cancellation identified by dynamical testing in a modern bell tower. Eng. Struct. 2009, 31, 1486–1500. [Google Scholar] [CrossRef]
  41. Solarino, F.; Oliveira, D.V.; Giresini, L. Wall-to-horizontal diaphragm connections in historical buildings: A state-of-the-art review. Eng. Struct. 2019, 199, 109559. [Google Scholar] [CrossRef]
  42. Shabani, A.; Kioumarsi, M.; Zucconi, M. State of the art of simplified analytical methods for seismic vulnerability assessment of unreinforced masonry buildings. Eng. Struct. 2021, 239, 112280. [Google Scholar] [CrossRef]
  43. Aşıkoğlu, A.; Vasconcelos, G.; Lourenço, P.B.; Pantò, B. Pushover analysis of unreinforced irregular masonry buildings: Lessons from different modeling approaches. Eng. Struct. 2020, 218, 110830. [Google Scholar] [CrossRef]
  44. Maccarini, H.; Vasconcelos, G.; Rodrigues, H.; Ortega, J.; Lourenço, P.B. Out-of-plane behavior of stone masonry walls: Experimental and numerical analysis. Constr. Build. Mater. 2018, 179, 430–452. [Google Scholar] [CrossRef]
  45. Başaran, H.; Demir, A.; Ercan, E.; Nohutçu, H.; Hökelekli, E.; Kozanoğlu, C. Investigation of seismic safety of a masonry minaret using its dynamic characteristics. Earthq. Struct. 2016, 10, 523–538. [Google Scholar] [CrossRef]
  46. Clementi, F.; Pierdicca, A.; Formisano, A.; Catinari, F.; Lenci, S. Numerical model upgrading of a historical masonry building damaged during the 2016 Italian earthquakes: The case study of the Podestà palace in Montelupone (Italy). J. Civ. Struct. Health Monit. 2017, 7, 703–717. [Google Scholar] [CrossRef]
  47. de Silva, F.; Pitilakis, D.; Ceroni, F.; Sica, S.; Silvestri, F. Experimental and numerical dynamic identification of a historic masonry bell tower accounting for different types of interaction. Soil Dyn. Earthq. Eng. 2018, 109, 235–250. [Google Scholar] [CrossRef]
  48. Ercan, E. Assessing the impact of retrofitting on structural safety in historical buildings via ambient vibration tests. Constr. Build. Mater. 2018, 164, 337–349. [Google Scholar] [CrossRef]
  49. Tokyo Measuring Instruments Laboratory. Available online: https://tml.jp/e (accessed on 31 August 2021).
  50. Tokyo Sokushin. Available online: http://www.to-soku.co.jp/en/ (accessed on 31 August 2021).
  51. Netplus. Available online: https://netplus-3d.co.jp (accessed on 31 August 2021).
  52. Endo, Y.; Niitsu, Y. Health monitoring tests of heritage structures: Application of mems accelerometers to two multi-tier pagodas. In Proceedings of the 12th International Conference on Structural Analysis and Historical Constructions, Barcelona, Spain, 30 September–1 October 2021; pp. 3264–3271. [Google Scholar]
  53. Analog Devices. Available online: https://www.analog.com/media/en/technical-documentation/data-sheets/adxl354_adxl355.pdf (accessed on 31 August 2021).
  54. Japan National Trust. Otaru Canal and Masonry Storehouses; Houei Printing: Tokyo, Japan, 1979. [Google Scholar]
  55. Hokkaido Division. Architectural Institute of Japan. In Heritage buildings in Otaru; Otaru City Educational Committee: Hokkaido, Japan, 1994. [Google Scholar]
  56. Otaru City Council. Available online: https://www.city.otaru.lg.jp/ (accessed on 31 August 2021).
  57. Engel, H. Measure and Construction of the Japanese House; Tuttle Publishing: Clarendon, VT, USA, 1985. [Google Scholar]
  58. Nishi, K.; Hozumi, K. What Is Japanese Architecture? (Horton H Trans.); Kodansha International: Tokyo, Japan, 1985. [Google Scholar]
  59. Geospatial Information Authority of Japan. Available online: http://www.kunijiban.pwri.go.jp/viewer/ (accessed on 15 October 2021).
  60. Information Network of Earthquake Disaster Prevention Technologies. Available online: https://iisee.kenken.go.jp/net/seismic_design_code/japan/japan.htm (accessed on 15 October 2021).
  61. Japanese Agency for Cultural Affairs. 2021. Available online: https://kunishitei.bunka.go.jp/ (accessed on 31 August 2021).
  62. Tsuchimoto, T. Recommendation for Registered Tangible Cultural Properties, the 50th Infantry Regiment Storehouse (Shinshu University Medical Information Room); Shinshu University: Nagano, Japan, 2011. [Google Scholar]
  63. Japan Meteorological Agency. Available online: http://www.data.jma.go.jp/svd/eqdb/data/shindo/index.html (accessed on 31 August 2021).
  64. United States Geological Survey. Available online: https://earthquake.usgs.gov/earthquakes/eventpage/us7000dz5t/executive (accessed on 31 August 2021).
  65. Mapchart. Available online: https://mapchart.net/ (accessed on 31 August 2021).
  66. National Research Institute for Earth Science and Disaster Resilience (NIED). NIED K-NET, KiK-net, National Research Institute for Earth Science and Disaster Resilience. 2019. Available online: http://www.kyoshin.bosai.go.jp/kyoshin/docs/kyoshin_index.html (accessed on 31 August 2021). [CrossRef]
  67. Ferreira, D.; Manie, J. DIANA Documentation Release 10; DIANA FEA: Delft, The Netherlands, 2019. [Google Scholar]
  68. Xue, J.; Ren, G.; Qi, L.; Zhang, X. Lateral behavior of glued-laminated timber frame infilled with light-wooden-frame wall hybrid system: Experimental and numerical analysis. Structures 2021, 30, 352–367. [Google Scholar] [CrossRef]
  69. Chang, W.S.; Shanks, J.; Kitamori, A.; Komatsu, K. The structural behaviour of timber joints subjected to bi-axial bending. Earthq. Eng. Struct. Dyn. 2009, 38, 739–757. [Google Scholar] [CrossRef]
  70. Kłosowski, P.; Pestka, A.; Krajewski, M.; Lubowiecka, I. Experimental and computational study on mechanical behaviour of carpentry corner log joints. Eng. Struct. 2020, 213, 110515. [Google Scholar] [CrossRef]
  71. Tsai, P.H.; D′Ayala, D. Performance-based seismic assessment method for Taiwanese historic Dieh-Dou timber structures. Earthq. Eng. Struct. Dyn. 2011, 40, 709–729. [Google Scholar] [CrossRef]
  72. Eurocode 6—Design of Masonry Structures. General Rules for Reinforced and Unreinforced Masonry Structures. EN 1996–1–1; European Committee for Standardization: Brussel, Belgium, 2005. [Google Scholar]
  73. BSI Standards Publication. Specification for Masonry Units. EN 771; European Committee for Standardization: Brussel, Belgium, 2011. [Google Scholar]
  74. BSI Standards Publication. Specification for Masonry Units—Part 2: Calcium Silicate Masonry Units EN 771-2; European Committee for Standardization: Brussel, Belgium, 2011. [Google Scholar]
  75. BSI Standards Publication. Specification for Masonry Units—Part 3: Aggregate Concrete Masonry Units (Dense and Light-Weight Aggregates) EN 771-3; European Committee for Standardization: Brussel, Belgium, 2003. [Google Scholar]
  76. Slovenian Institute for Standardization. Methods of Testing Cement—Part. 1: Determination of Strength EN 196-1; European Committee for Standardization: Brussel, Belgium, 2016. [Google Scholar]
  77. Lakshani, M.M.T.; Jayathilaka, T.K.G.A.; Thamboo, J.A. Experimental investigation of the unconfined compressive strength characteristics of masonry mortars. J. Build. Eng. 2020, 32, 101558. [Google Scholar] [CrossRef]
  78. Guadagnuolo, M.; Aurilio, M.; Basile, A.; Faella, G. Modulus of Elasticity and Compressive Strength of Tuff Masonry: Results of a Wide Set of Flat-Jack Tests. Buildings 2020, 10, 84. [Google Scholar] [CrossRef]
  79. Selçuk, L.; Beyaz, T. Welding intensity assessment of pyroclastic units based on engineering quality requirements. Arab. J. Geosci. 2021, 14, 382. [Google Scholar] [CrossRef]
  80. Nakamura, D.; Goto, T.; Suzuki, T.; Ito, Y.; Yamashita, S. Basic Study on Frost Susceptibility of Rock Understanding the mechanism of frost heave based on comparison of the internal structure and the physical properties of rock. Min. Mater. Process. Inst. Jpn. 2008, 124, 231–239. [Google Scholar]
  81. Nishina, K.; Matsuda, Y.; Matsueda, H.; Takeuchi, K.; Ohgane, T.; Sugawara, Y.; Takami, M.; Kitajima, T. Geology of subaqueous volcanic rocks and stone material of historic buildings, in Otaru, Hokkaido. J. Geol. Soc. Jpn. 2019, 125, 387–402. [Google Scholar] [CrossRef] [Green Version]
  82. Kodama, J.I.; Goto, T.; Fujii, Y.; Yoshida, Y.; Itakura, K.I. Creep deformation and creep life of Noboribetsu welded tuff under air-dried and water-saturated conditions. J. Min. Mater. Process. Inst. Jpn. 2001, 117, 718–724. [Google Scholar]
  83. Moayedian, S.M.; Hejazi, M. Stress-strain relationships for scaled gypsum mortar and cement mortar brick masonry. J. Build. Eng. 2021, 33, 101861. [Google Scholar] [CrossRef]
  84. Garzón-Roca, J.; Marco, C.O.; Adam, J.M. Compressive strength of masonry made of clay bricks and cement mortar: Estimation based on Neural Networks and Fuzzy Logic. Eng. Struct. 2013, 48, 21–27. [Google Scholar] [CrossRef]
  85. Zahra, T.; Thamboo, J.; Asad, M. Compressive strength and deformation characteristics of concrete block masonry made with different mortars, blocks and mortar beddings types. J. Build. Eng. 2021, 38, 102213. [Google Scholar] [CrossRef]
  86. Haach, V.G.; Vasconcelos, G.; Lourenço, P.B. Experimental analysis of reinforced concrete block masonry walls subjected to in-plane cyclic loading. J. Struct. Eng. 2010, 136, 452–462. [Google Scholar] [CrossRef]
  87. Mohamad, G.; Lourenço, P.B.; Roman, H.R. Mechanics of hollow concrete block masonry prisms under compression: Review and prospects. Cem. Concr. Compos. 2007, 29, 181–192. [Google Scholar] [CrossRef] [Green Version]
  88. Architectural Institute of Japan. Standard for Structural Design of Timber Structures; Maruzen Publishing: Tokyo, Japan, 2006. [Google Scholar]
  89. Howard, S. Materials Data Book, 2003rd ed.; Cambridge University: Cambridge, UK, 2003. [Google Scholar]
  90. Vecchio, F.J.; Collins, M.P. The modified compression-field theory for reinforced concrete elements subjected to shear. ACI J. 1986, 83, 219–231. [Google Scholar]
  91. Selby, R.G.; Vecchio, F.J. A constitutive model for analysis of reinforced concrete solids. Can. J. Civil Eng. 1997, 24, 460–470. [Google Scholar] [CrossRef]
Figure 1. Sensors used in this study: (a) strain gauge accelerometer, (b) servo velocity meter and (c) MEMS accelerometer.
Geohazards 02 00018 g001
Figure 2. Otaru warehouse complex: (a) south elevation, (b) the studied warehouse, (c) interior view, (d) site plan, (e) plan of the studied warehouse, (f) a–a’ section and (g) nogging coupling stud and column.
Geohazards 02 00018 g002
Figure 3. Matsumoto storehouse: (a) west elevation; (b) north elevation; (c) plan and (d) a–a’ section.
Geohazards 02 00018 g003
Figure 4. Occurrence of earthquakes during the monitoring period: (a) locations of the two earthquakes; acceleration time history of the 2021 Fukushima earthquake (b) and of the May 2021 Miyagi earthquake (c,d) response spectra ((a) originally from [65], modified by the authors, (bd) from [66]).
Geohazards 02 00018 g004
Figure 5. Vibration testing of the Otaru warehouse: (a) location of the velocity meters, (b) installation of velocity meters to a stud and wall, (c) manual excitation during forced vibration tests, the acceleration time history of VO2 sensor (d) and of VO5 sensor (e,f) Fourier spectrum of sensors and (g) wall/stud to floor frequency response functions.
Geohazards 02 00018 g005
Figure 6. Vibration testing of the Matsumoto storehouse: (a) location of the accelerometers, (b) installation of an accelerometer, the acceleration time history of forced vibration test of sensor VM1 (c) and VM4 (d), Fourier spectrum of sensor VM1 (e) and of sensor VM4 (f), frequency response function of VM1/VM6 sensors (g) and of VM4/VM7 sensors (h).
Geohazards 02 00018 g006
Figure 7. Monitoring of the Otaru warehouse: (a) Installed MEM sensor, acceleration time history of the HO1 sensor during the 2021 Fukushima earthquake (b) and during the May 2021 Miyagi earthquake (c), wall/stud to floor frequency response functions obtained from the 2021 Fukushima earthquake (d) and from the May 2021 Miyagi earthquake (e).
Geohazards 02 00018 g007
Figure 8. Monitoring of the Matsumoto storehouse: (a) instillation of a MEMS sensor, (b) locations of sensors, the acceleration time history of the HM1 sensor (c) and the HM3 sensor (d), frequency response function of HM1/HM4 (e) and of HM3/HM4 (f).
Geohazards 02 00018 g008
Figure 9. Numerical models: (a) the Otaru warehouse and (b) the Matsumoto storehouse.
Geohazards 02 00018 g009
Figure 10. Mode shapes identified by eigenvalue analysis: (a) fundamental mode shape of the Otaru warehouse, fundamental mode shapes of the Matsumoto storehouse in the x-direction (b) and in the y-direction (c).
Geohazards 02 00018 g010
Figure 11. Nonlinear static analysis of the Otaru warehouse: (a) principal positive strain distribution contours close to the failure of the structure and (b) relations between base acceleration and displacement.
Geohazards 02 00018 g011
Figure 12. Nonlinear static analysis of the Matsumoto storehouse: principal positive strain distribution contours close to the failure of the structure in the x-direction (a) and in the y-direction (b), relations between base acceleration and displacement in the x-direction (c) and in the y-direction (d).
Geohazards 02 00018 g012
Figure 13. Comparison of the mode shape between the experiment and numerical analysis: (a) Otaru warehouse, east wall, Matsumoto storehouse, north wall (b) and west wall (c).
Geohazards 02 00018 g013
Table 1. Specifications of sensors.
Specifications Strain-Gauge AceerometersServo Velocity
Meters
MEMS Sensors
Frequency range0 to 30 Hz0.2 to 70 Hz0 to 30 Hz
Resolution level0.0333 cm/s210−5 cm/s20.005 cm/s2
Measuring range±10 m/s2±0.1 m/s±20 m/s2
Table 2. Material properties adopted to the numerical models.
ParametersBrick MasonryConcrete Block MasonryWelded Tuff MasonryTimber
Density (kg/m3)180022001300430
Compressive strength (MPa)1010520
Modulus of elasticity (MPa)7000700050007000
Tensile strength (MPa)0.20.50.220
Poisson ratio (-)0.20.20.20.3
Table 3. Eigenvalue comparison of the Otaru warehouse.
Eigenvalue Comparison1st Mode
Real structure (Hz)4.78
Numerical model (Hz)4.78
Participation factors (%)33.2
Modal assurance criterion (-)0.97
Table 4. Eigenvalue comparison of Matsumoto storehouse.
Eigenvalue Comparisonx-directiony-direction
Real structure (Hz)13.412.2
Numerical model (Hz)13.212.7
Participation factors (%)2.97.53
Modal assurance criterion (-)0.920.92
Publisher’s Note: MDPI stays neutral with regard to jurisdictional claims in published maps and institutional affiliations.

