1. Introduction
Earthquake-triggered landslides and surface collapses are among the most destructive secondary geohazards associated with seismic events [
1]. While coseismic landslide inventories have been extensively studied, the temporal evolution of collapses in the immediate days after an earthquake has received far less attention, particularly for moderate-magnitude events (M5–6). Under such research circumstances, the M5.2 doublet earthquake investigated in this study took place in a typical karst geomorphic area and induced large-scale concentrated surface collapse phenomena. This earthquake event accordingly creates favorable natural conditions for exploring the short-term evolutionary behaviors of seismically triggered surface collapses in karst regions.
Internationally, earthquake-induced ground failures—including shallow surface collapses, sinkholes, and related karst ground deformations—have been systematically documented in both global reviews and regional case studies. The classic synthesis of Keefer [
2] first established that earthquakes trigger ground failures across a wide range of geological settings, while later worldwide inventories have further quantified the diversity, magnitude, and spatial distribution of such phenomena [
3,
4]. In carbonate karst terrains, where dissolution cavities and fractured rock masses constitute pre-existing zones of weakness, moderate-magnitude earthquakes have repeatedly produced localized collapses and sinkhole development, as exemplified by the extensive cover-collapse sinkhole phenomena triggered by the 2020–2021 Petrinja earthquake sequence in Central Croatia [
5] and by seismological, InSAR, and geophysical evidence linking the October 2020 Capena earthquake to reactivation of the Lago Puzzo sinkhole in Italy [
6]. Comprehensive reviews of karst geohazards further indicate that such earthquake-induced sinkholes are recurrent phenomena in carbonate settings worldwide [
7]. Moreover, recent investigations emphasize that earthquake-induced ground failures commonly persist after the mainshock, with post-seismic rainfall and progressive strength degradation sustaining collapse development for days to years [
1]. These international observations underscore the importance of multi-temporal monitoring for characterizing the full life cycle of earthquake-triggered surface collapses, particularly in karst landscapes.
Post-seismic karst collapse development is a dynamic evolutionary process. Seismic shaking damages karst rock masses via fracture propagation and rock dilatancy, pre-conditioning these media for delayed surface collapse under gravitational loadings [
8]. Rainfall further accelerates collapse initiation and expansion by elevating pore-water pressure and degrading the shear strength of fractured rock and overlying regolith [
9]. Field surveys of this M5.2 earthquake doublet confirmed extensive coseismic and post-seismic surface collapses that occurred under continuous post-earthquake rainfall. Accordingly, it is essential to elucidate the evolutionary mechanism of karst collapses triggered by this earthquake doublet.
Unmanned aerial vehicles (UAVs) provide centimeter-resolution orthophotos with flexible acquisition scheduling [
10], making multi-temporal surveys feasible. In recent years, UAV-based photogrammetry has been increasingly employed for post-earthquake geohazard investigations, enabling rapid and high-resolution documentation of surface deformation and terrain change [
11,
12]. UAV technologies are capable of generating high-resolution digital orthophoto maps (DOMs) to identify building collapses, ground ruptures and coseismic landslides [
13,
14,
15]. Meanwhile, high-precision digital surface models (DSMs) derived from UAV surveys can be adopted to quantitatively assess building damage severity, displacement magnitudes of ground fractures, as well as the volume of sliding masses via multi-temporal differential analysis [
16,
17]. For moderate-magnitude earthquakes (M5–6), which occur more frequently than large events but often receive less systematic post-event investigation, UAV surveys offer a particularly valuable means of capturing the subtle and spatially dispersed ground failures that may escape satellite-based detection. Studies following the 2015 Gorkha earthquake (Mw 7.8) demonstrated that multi-temporal UAV surveys could quantify post-seismic sediment transfer and landslide reactivation rates at unprecedented resolution [
18]. Similarly, investigations of the 2021 Madoi earthquake (Mw 7.4) utilized UAV-derived orthophotos and DEMs to yielded the imagery of coseismic surface ruptures across the Qinghai–Tibetan Plateau interior, and faithfully recording ephemeral mole tracks, open fissures, surface fracture geometries, surface fault breakout patterns and off-fault damage [
14]. Despite these advances, multi-temporal UAV surveys at daily intervals within the first post-seismic week—capturing the critical early phase of collapse evolution—remain exceptionally rare, particularly for earthquake-triggered ground collapses in karst terrain.
For this seismic event, we conducted UAV surveys on 20, 23, and 24 May to document post-seismic surface collapse evolution. This Brief Report aims to: (1) quantify temporal changes in collapse area and affected units; (2) characterize expansion vs. delayed initiation patterns; (3) report depth measurements of these collapses; and (4) discuss mechanisms in the context of karst geology and rainfall.
2. Study Area and Methods
2.1. Study Area and Earthquake Event
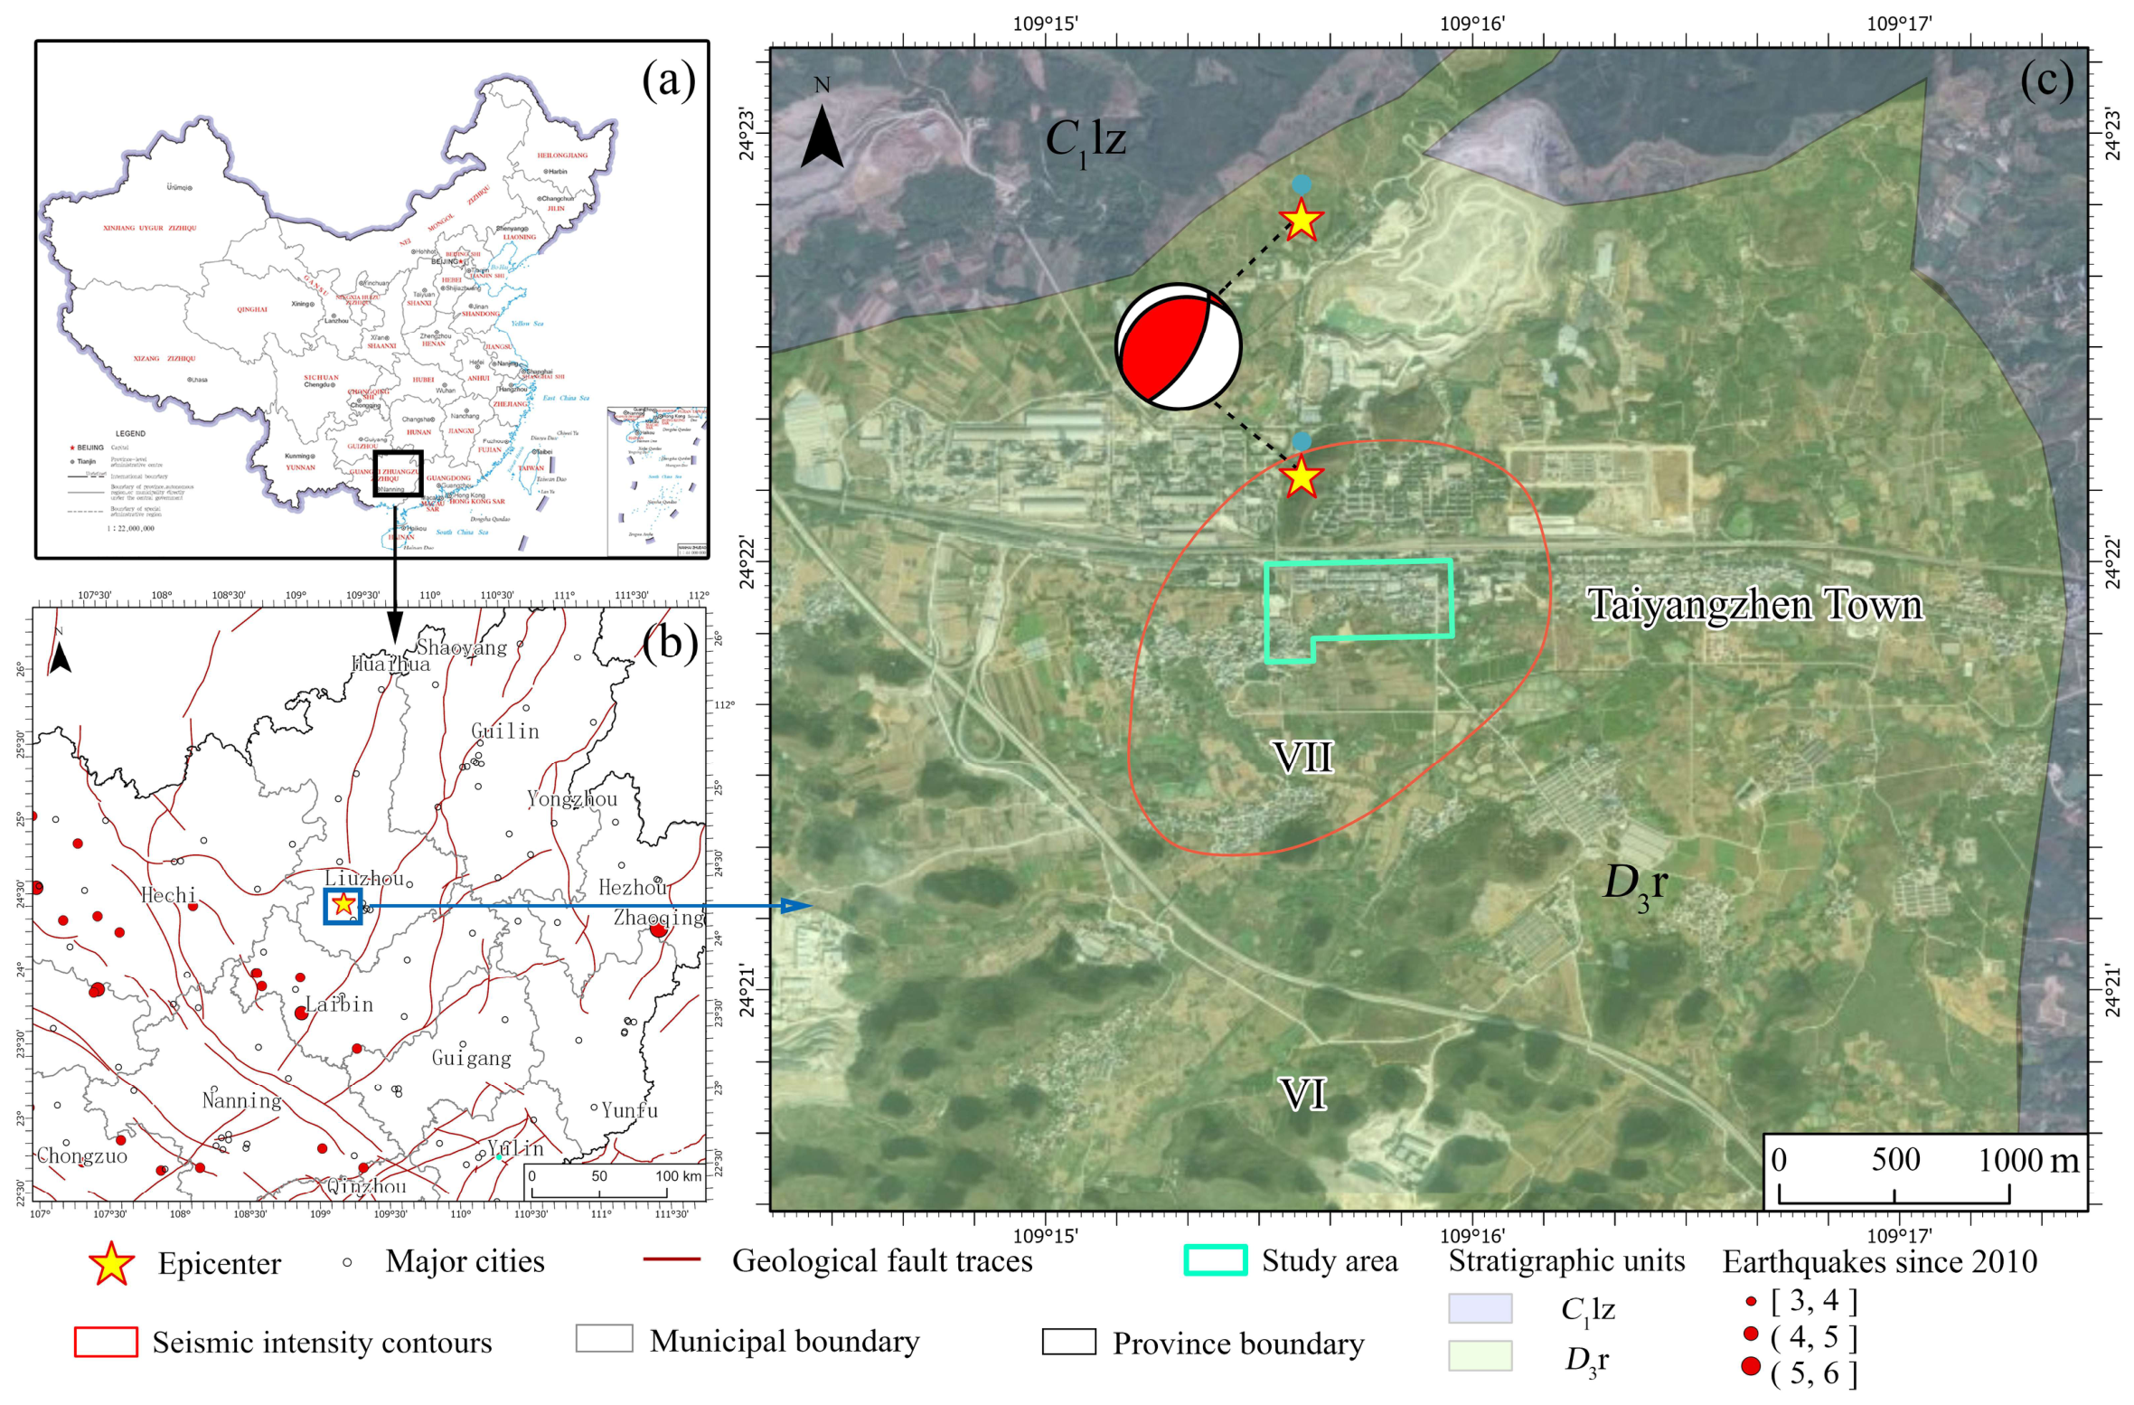
The study area is situated in Taiyangzhen Town, Liunan District of Liuzhou City, Guangxi Zhuang Autonomous Region, within the fault–fold belt of the Guizhong Depression, as shown in
Figure 1. Affected by multi-stage Indosinian, Yanshan, and Himalayan tectonic movements, this region has undergone intense crustal compression and faulting, forming multidirectional fault–fold systems mainly comprising the nearly N-S Taiyangcun composite box anticline (cored by Upper Devonian Rongxian Formation limestone), the arcuate Shatang Syncline, and the E-W-trending Changtang Anticline. Two dominant stratigraphic units are exposed in the area: the Upper Devonian Rongxian Formation (
D3r) and the Lower Carboniferous Luzhai Formation (
C1lz). The Rongxian Formation is dominated by medium-thick calcarenite and algal boundstone, interbedded with various limestones, pyrite-bearing shale, wormkalk, and carbonaceous mudstone, while the Luzhai Formation primarily consists of thin-bedded mudstone intercalated with siliceous rock and limestone [
19]. Such carbonate–clastic lithologic assemblages, combined with complex fault structures, create favorable conditions for the development of typical subtropical karst landforms, featured by widespread caves, underground water systems, and uneven shallow overlying soils with weak interlayers [
20].
According to the China Earthquake Networks Center (CENC), on 18 May 2026, two successive M5.2 earthquakes (earthquake doublet) struck the research region [
21]. The meizoseismal area of this earthquake sequence attained Grade VII in accordance with the Chinese Seismic Intensity Scale. The first earthquake happened at Beijing Time 00:21:04, with its epicenter located at 24.38° N, 109.26° E; the second M5.2 earthquake took place at Beijing Time 21:44:25 at an epicenter of 24.37° N, 109.26° E. The two M5.2 events share nearly identical focal mechanisms: both are NE–SW-striking thrust earthquakes with high dip angles, and their strike, dip, and rake angles differ only slightly. Centroid depth estimates place both ruptures in the shallow upper crust, at 4.4 km and 4.9 km, respectively. These similarities indicate that the two events either ruptured the same NE–SW-striking thrust fault or involved two adjacent, kinematically consistent thrust faults; discrimination between these two scenarios requires further geophysical and geological investigation [
22].
Regionally, Liuzhou lies within the northeastern boundary zone of the Youjiang secondary block of the South China Block. This boundary is defined to the south by the Red River active fault, to the west by the Xiaojiang active fault, and to the southeast by the Nanning–Guilin fault; its northeastern segment comprises the Weining–Shuicheng fault in the northwest and, in the southeast, a diffuse zone of short NW-trending faults of which the Bama–Bobai fault is the most representative. The 2026 doublet occurred within this diffuse southeastern boundary zone, suggesting that the events may represent reactivation of the block-boundary fault system. This interpretation is consistent with the background seismicity of the region: although no destructive earthquake has been historically recorded in Liuzhou, small earthquakes are common. At the local scale, faults trending NE, N–S, and NW intersect the study area, and three ancient major faults—the Hechi–Yishan, Nanning–Guilin, and Sanjiang–Rongan faults—lie near the epicentral region. Although the doublet did not occur directly on one of these major faults, the network of fractured carbonate strata and long-term karst dissolution provide abundant weak zones capable of hosting moderate earthquakes.
Meteorological data document substantial rainfall during the survey period. Between 18 and 24 May, total precipitation reached 98.7 mm, with the heaviest rainfall (54.4 mm) occurring on 20 May—the day of the first UAV survey. An additional 27.8 mm fell between 21 and 22 May, resulting in 76.4 mm of rainfall between 20 May and 23 May. The pre-earthquake period (13–17 May) had already delivered 76.4 mm of rainfall, saturating the shallow soil profile before the double-shock sequence.
2.2. UAV Surveys and Orthophoto Generation
Three UAV surveys were conducted on 20, 23, and 24 May; each flight covered ~0.5 km2 over Taiyangzhen and Shangdengtun. All surveys used a DJI MATRICE 4E UAV equipped with a multispectral sensor, flown at 100 m altitude with 70% forward overlap and 80% side overlap. Orthophoto mosaics were generated using SfM photogrammetry in DJI TERRA at 3 cm GSD.
2.3. Collapse Interpretation and Depth Measurement
Surface collapse patches were visually interpreted from UAV orthophoto mosaics. Each collapse polygon was digitized and area was computed for all three dates. Where possible, collapse depth was measured from the orthophoto-derived digital surface model. Collapse depth was measured as the maximum vertical distance from the mean elevation of the collapse rim (defined by the upper perimeter of the exposed failure surface) to the lowest point within the collapse polygon on the orthophoto-derived digital surface model. This maximum depth value is reported as the collapse depth for each unit and each survey date. Units with standing rainwater were recorded as ponding. Surface collapses in the study area were categorized into two types: Type A collapses, which were identifiable in the first survey on 20 May (two days after the earthquake) and experienced continuous expansion afterward, and Type B collapses, which newly emerged in the second survey on 23 May and were absent in the initial observation, indicating delayed post-earthquake failure initiation. The classification is based on the temporal detectability of each unit across the three survey epochs: Type A units were identified in the first survey (20 May, two days after the mainshock) and therefore represent failures that initiated during or immediately after the earthquake (coseismic type); Type B units were absent in the first survey but became detectable in the second survey (23 May), representing failures that initiated later in the post-seismic period (delayed type). This binary classification therefore reflects the timing of collapse initiation relative to the mainshock, providing a framework for analyzing the different triggering mechanisms of coseismic versus delayed failures.
3. Results
3.1. Overview of Collapse Distribution
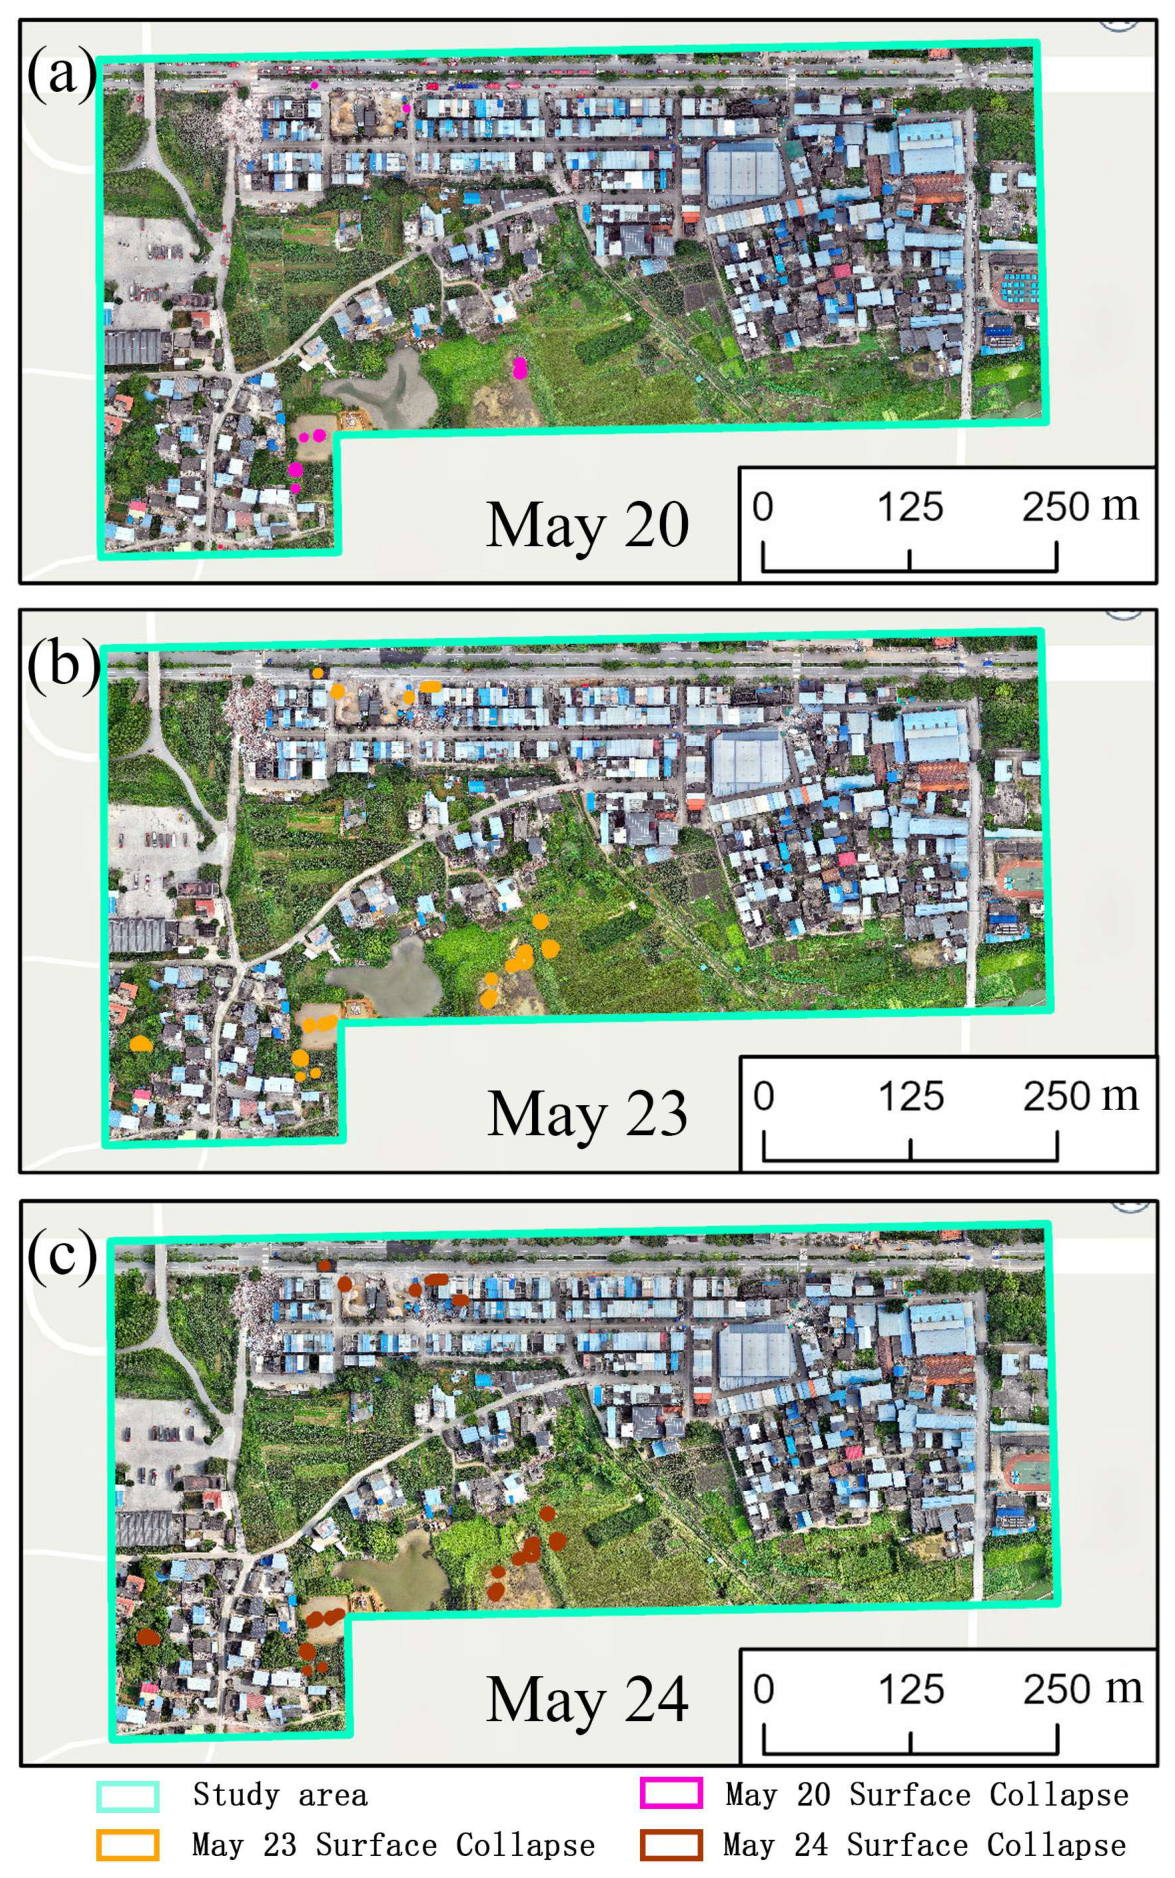
Spatially, the 17 collapse monitoring sites are scattered over an area of roughly 0.5 km
2 inside the meizoseismal zone, as shown in
Figure 2.
As illustrated in the imagery, surface collapses are primarily concentrated in two zones: the densely built-up northern district adjacent to roads, as well as cultivated land and bare ground on the eastern and western sides of the pond in the southern study area. Obvious distinctions in collapse distribution can be identified from UAV orthophotos. Five collapse units are located along the roadside area; two of these collapses developed on the ground surface to the north and south of buildings, accompanied by building collapses in the adjacent zones, whereas the other three occurred on pavements and open ground. Multiple collapse units are distributed around both flanks of the pond, where low-lying topography facilitates water accumulation. Notably, the pond was nearly dry on 20 May with no ponded water inside collapse depressions, while rising water levels were observed on 23 May together with water pooling within sinkholes—this variation is strongly correlated with successive rainfall events. One additional collapse unit was detected within vegetated land in the southwestern village of the study area. Morphologically, most sinkholes present a circular geometry, while a small number exhibit quasi-rectangular outlines due to the constraints of surrounding buildings and vegetation coverage. Seventeen collapse monitoring units were analyzed (
Table 1). On 20 May, only 7 of 17 units (41%) showed detectable collapses; most had areas < 2.0 m
2 and the maximum was 29.94 m
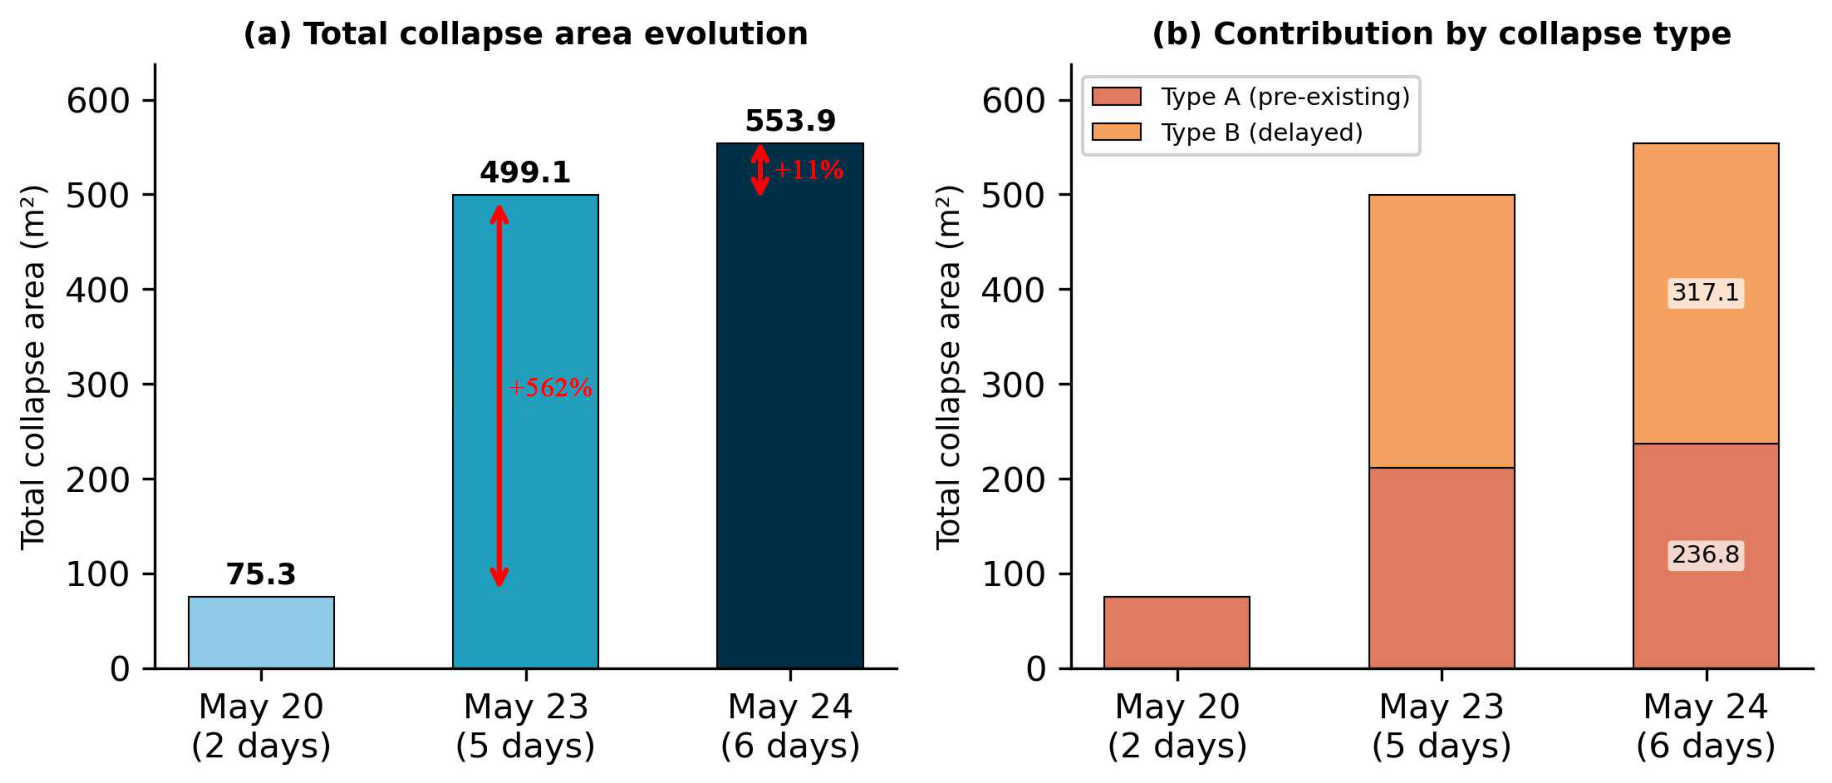
2. By 23 May, all 17 units (100%) exhibited collapses, with both the number of affected units and individual collapse areas increasing markedly. On 24 May, all 17 units showed further expansion. The total collapse area increased from 75.3 m
2 (20 May) to 499.1 m
2 (23 May, +562%) to 553.9 m
2 (24 May, +635%). Individual collapse areas ranged from 3.32 to 86.91 m
2 by 24 May.
3.2. Temporal Evolution Patterns
Various categories of ground collapse display differentiated spatiotemporal evolutionary trends, as shown in
Figure 3.
Type A (n = 7): 7 units had collapses on 20 May (combined 75.3 m2). By 23 May their combined area reached 211.2 m2 (+180% mean expansion). Small initial patches (Units 2, 3, 11, 14; initial < 3 m2) showed extreme growth (41–3329%), while larger patches (Units 8, 12, 13; initial > 14 m2) showed moderate expansion (63–187%). After 23 May, most Type A areas stabilized (mean change +12%).
Type B (n = 10): 10 units first appeared on 23 May with a combined area of 288.0 m2 (58% of total on that date). Between 23 and 24 May, their combined area increased to 317.1 m2 (mean change +10.1%), with continued expansion in several units (e.g., Units 4, 5, 15, 16).
Notably, all 17 monitoring units exhibited detectable collapses by 23 May—just 5 days after the mainshock—indicating that the post-seismic collapse initiation phase was largely complete within this short window.
3.3. Depth Characteristics and Ponding Water
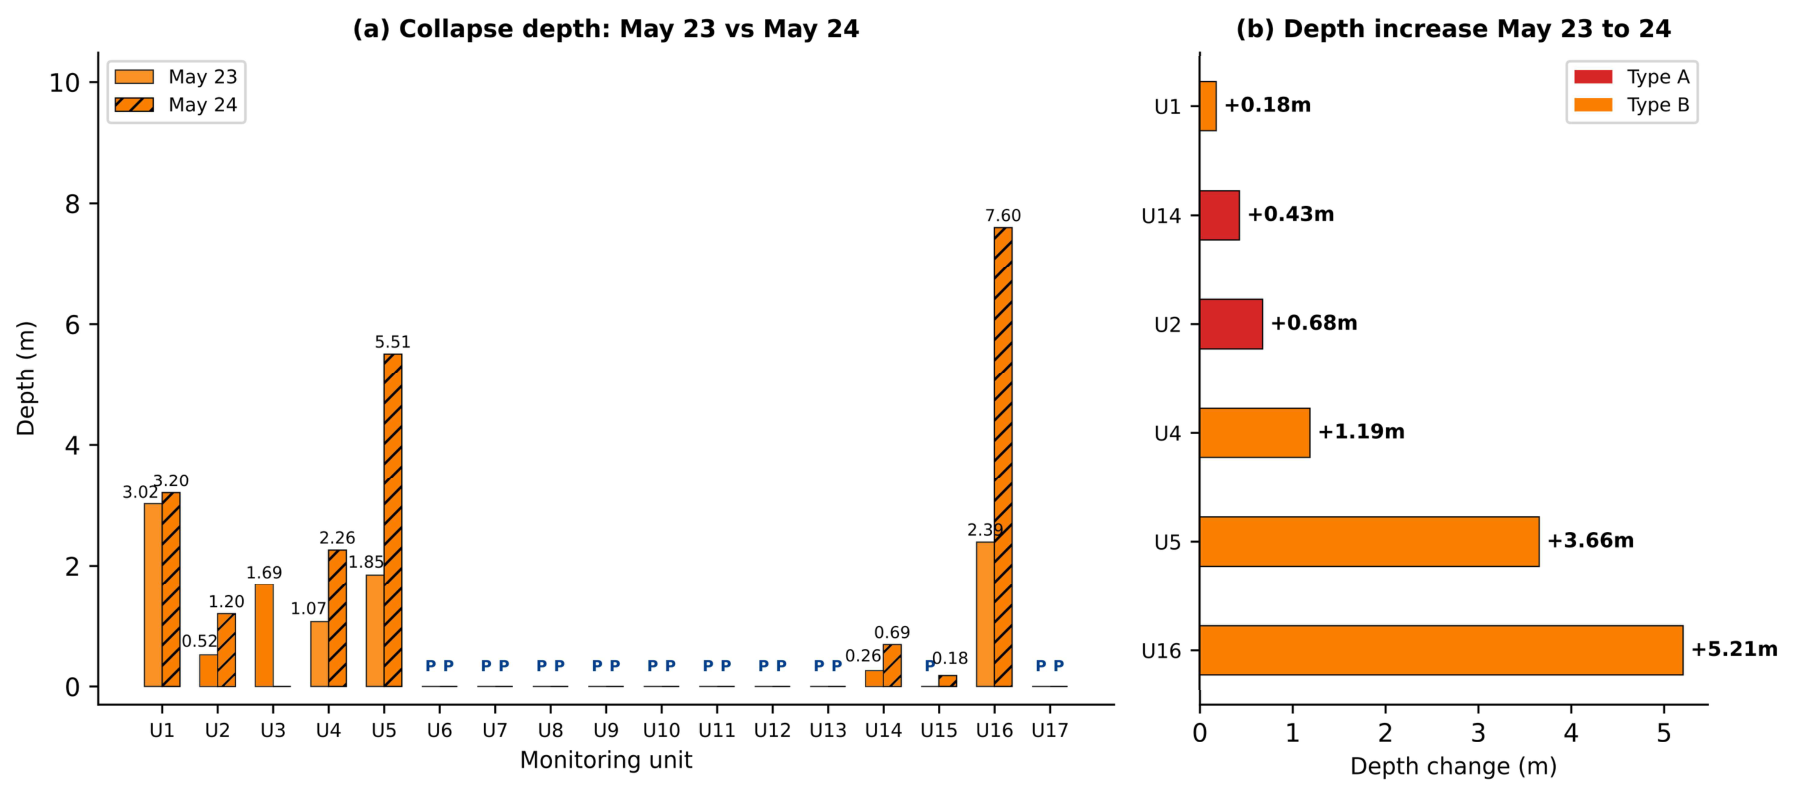
Collapse depth was measurable for 7 units on 24 May, ranging from 0.18 m (Unit 15) to 7.60 m (Unit 16), with a mean of 2.95 m (
Figure 4). Unit 16 exhibited the greatest measured depth (7.60 m), followed by Unit 5 (5.51 m) and Unit 1 (3.20 m). These deeper collapses are notably among the Type B (delayed) categories, suggesting that deeper failure planes may require more cumulative dynamic loading or post-seismic weakening to fully develop.
For the 6 units with measurable depth on both 23 May and 24 May (Unit 16, Unit 5, Unit 4, Unit 2, Unit 14, Unit 1), all showed depth increases from 23 May to 24 May. Unit 16 (2.39 m to 7.60 m, +5.21 m), Unit 5 (1.85 m to 5.51 m, +3.66 m), Unit 4 (1.07 m to 2.26 m, +1.19 m), Unit 2 (0.52 m to 1.20 m, +0.68 m), Unit 14 (0.26 m to 0.69 m, +0.43 m), Unit 1 (3.02 m to 3.20 m, +0.18 m). This consistent deepening trend indicates that the collapse cavities continued to develop internally even after the surface area expansion had largely stabilized, a process likely driven by progressive raveling of the seismically weakened collapse walls and rainfall infiltration along newly formed fractures.
Ponding water was observed in 9 of 17 units (53%) on 24 May and in 10 units (59%) on 23 May, indicating rainfall accumulation in collapse depressions. The decrease in ponded units from 23 May to 24 May (10 to 9) is consistent with partial evaporation of standing water. The rainfall likely contributed to continued expansion of existing collapses and emergence of new failures through increased pore water pressure and reduced shear strength. Notably, Unit 12 showed a decrease in interpreted area from 23 May to 24 (40.59 m2 to 37.38 m2), attributed to evaporation of ponded water. The presence of standing water is consistent with the low-permeability clay-rich soils typical of weathered karst terrain.
4. Discussion
Multi-temporal UAV surveys reveal rapid post-seismic collapse evolution following a M5.2 double earthquake in karst terrain. The 635% increase in total area over six days (75.3–553.9 m2) and expansion from 7 to all 17 affected units demonstrate that even moderate earthquakes can trigger a prolonged collapse development phase.
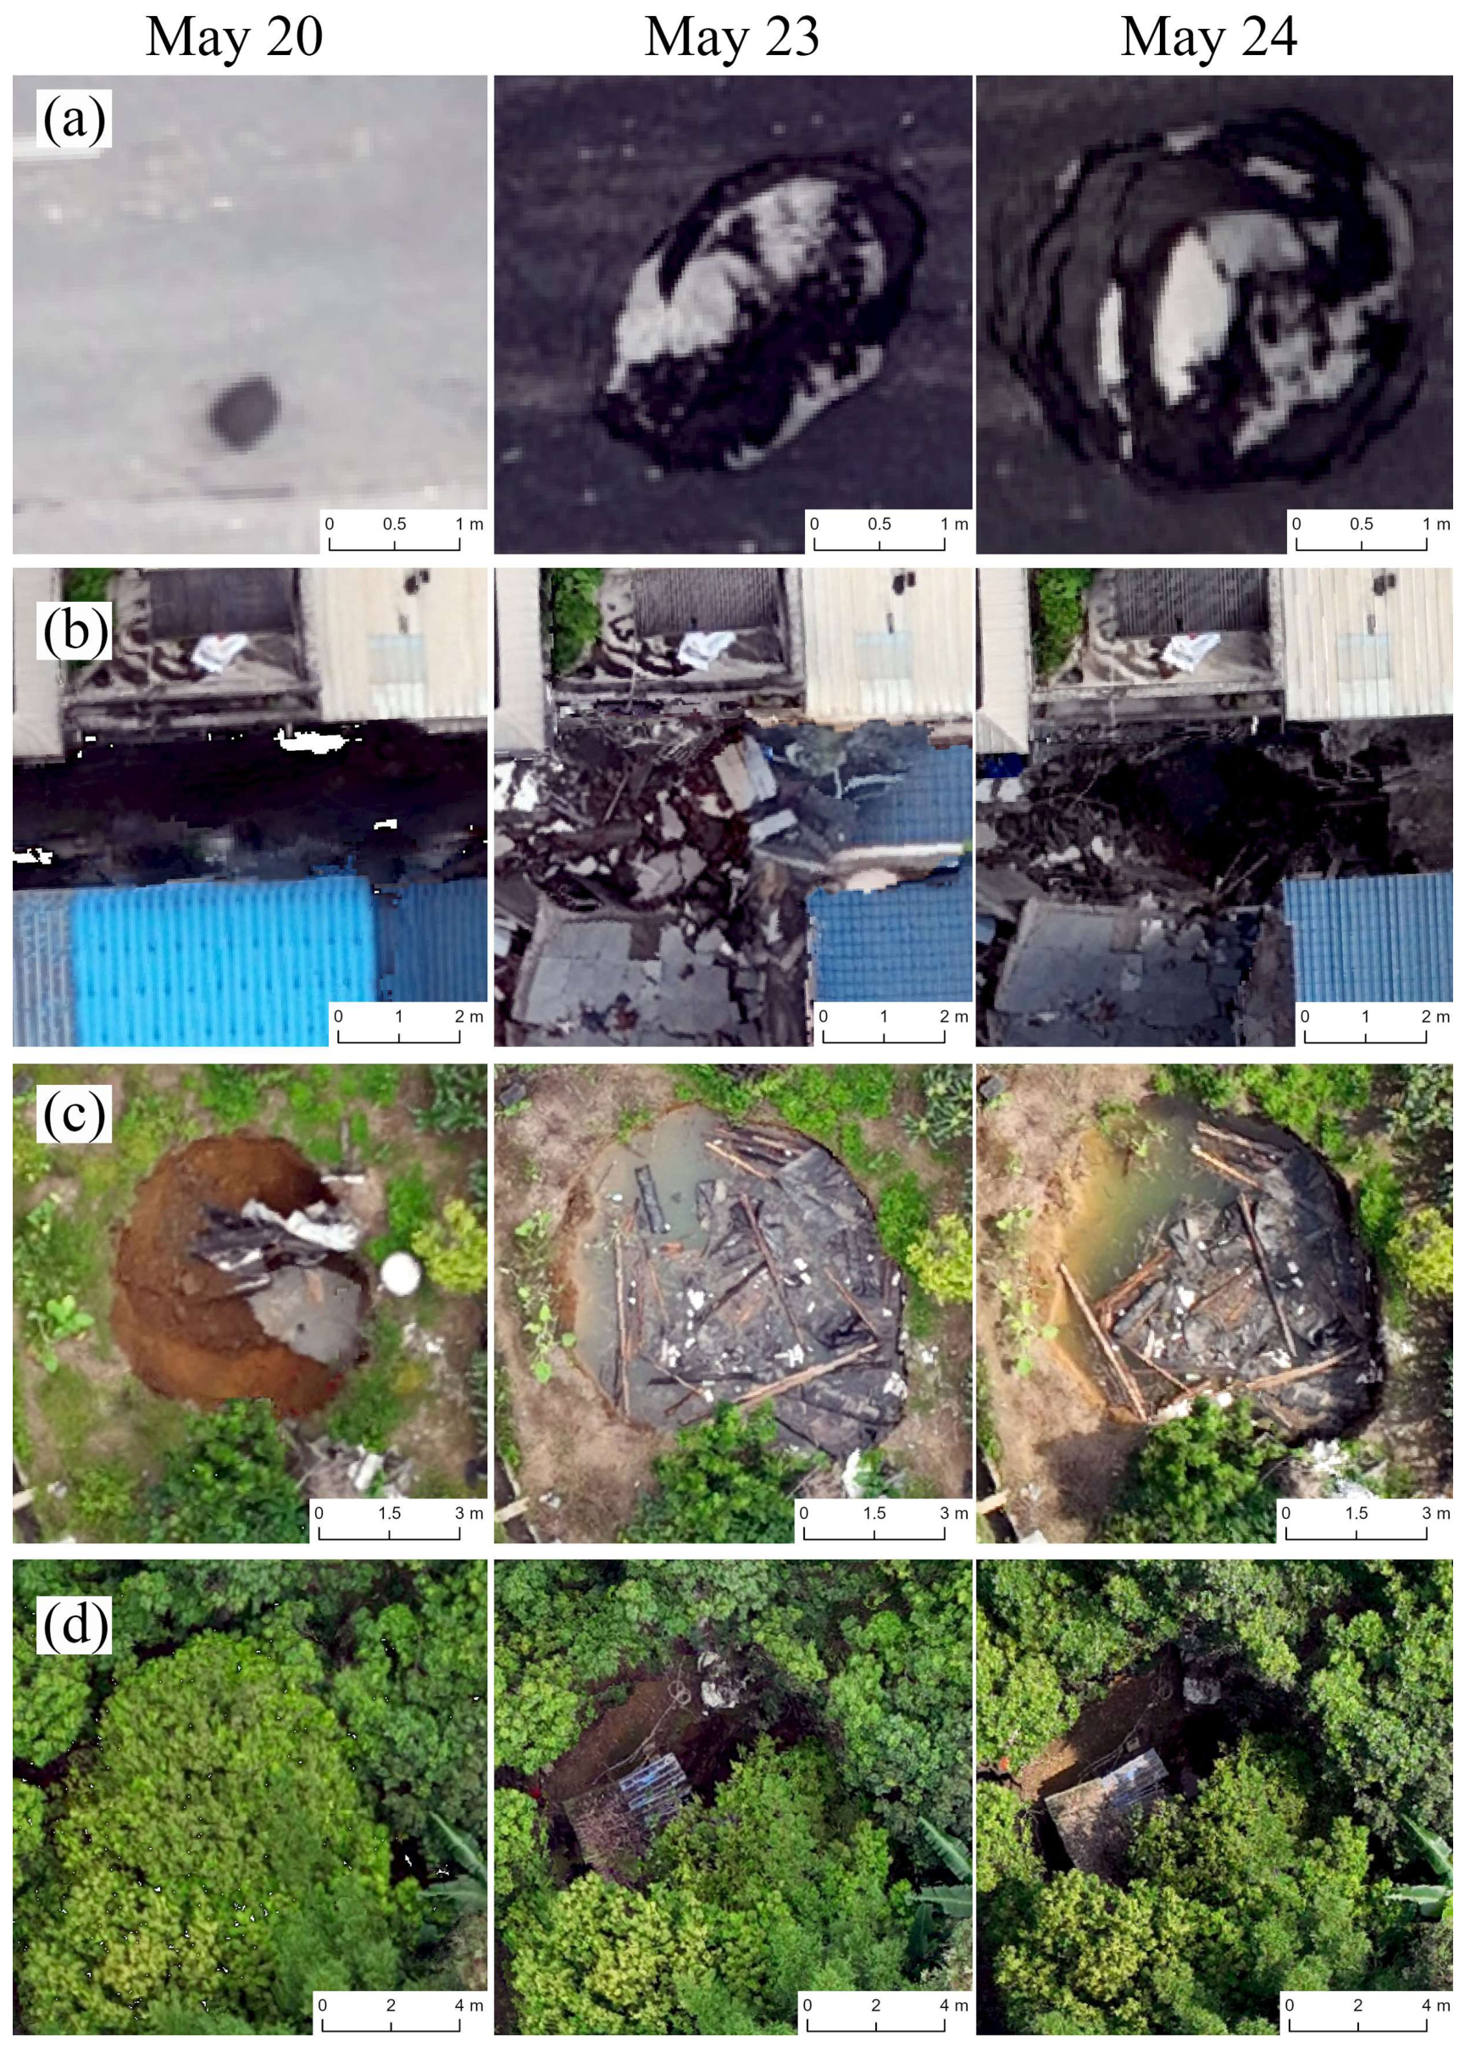
The dominant contribution came from Type A expansion (180% mean increase) and the emergence of 10 new Type B units between 20 and 23 May. Extreme growth of small initial patches suggests progressive unraveling of seismically weakened slope materials. The stabilization of most Type A units after 23 May implies that the initial relaxation phase was largely complete within 5 days. These contrasting evolutionary trajectories are exemplified by the four representative collapses shown in
Figure 5. Unit 2 (
Figure 5a) typifies the extreme growth of small initial patches: barely detectable at 0.18 m
2 on 20 May, it expanded over 40-fold to 7.40 m
2 by 24 May. In contrast, Unit 13 (
Figure 5c) represents the more moderate expansion of larger pre-existing failures, growing from 26.07 m
2 to 45.29 m
2 over the same period. Among the Type B delayed collapses, Unit 16 (
Figure 5d) exhibited the most dramatic development, appearing at 52.21 m
2 on 23 May and reaching 62.73 m
2 by 24 May with the greatest measured depth of 7.60 m. Unit 5 (
Figure 5b) similarly emerged as a delayed collapse on 23 May (12.20 m
2) and deepened to 5.51 m by 24 May. The contrasting behavior of Type A and Type B collapses can be attributed to their different initiation mechanisms. Type A collapses, which were already detectable two days after the mainshock, most likely formed when dynamic stresses from strong ground shaking directly exceeded the static strength of the karst roof over pre-existing dissolution cavities. The extreme enlargement of the smallest Type A units (up to 3329% area growth between 20 and 23 May) indicates that these were incipient cavities whose roofs were critically weakened during the double-shock sequence and then progressively collapsed as weakened blocks raveled into the underlying void. In contrast, Type B collapses, which emerged between 20 and 23 May, reflect time-dependent post-seismic failure processes: (i) static stress redistribution following the mainshock, which locally increased the driving stress on adjacent cavity roofs and fracture systems; (ii) progressive subcritical crack growth and fatigue damage accumulation in the seismically fractured carbonate rock mass under sustained gravitational loading [
19,
20]; and (iii) the 76.4 mm of rainfall that fell between 20 and 23 May, which raised pore water pressure, softened the clay-rich residual soil, and accelerated the collapse of weakened roof structures [
21,
22,
23]. The coexistence of coseismic (Type A) and delayed (Type B) failures in a single event, with the delayed type contributing 58% of the total collapse area by 23 May, demonstrates that post-seismic collapse hazard in karst terrain is not limited to the shaking phase but persists during the subsequent period of rainfall and progressive strength degradation.
Integrating the geological, hydrological, and seismological constraints, we identify three primary controlling factors for the observed collapse evolution. First, pre-existing karst cavities and fracture networks within Carboniferous–Permian carbonate sequences constitute mechanically weak zones prone to preferential activation under seismic loading [
20,
23], while shallow subsurface features in the study area (depth < 10 m), including dissolution voids, clay-infilled fractures and uneven bedrock morphology, readily induce localized strain concentration during seismic shaking [
7,
24]. Second, the day-and-night double-shock sequence subjected the already weakened rock mass to cumulative dynamic loading, with two M5.2 events within 21 h delivering repeated shear stress reversals that progressively reduced the residual strength of failure surfaces. Laboratory studies on carbonate rocks have proven that moderate-amplitude cyclic loading causes shear strength reduction [
25,
26]; accordingly, the two high-amplitude loading cycles produced by the earthquake doublet inevitably triggered prominent strength degradation within these pre-weakened karstified rock masses. Third, rainfall between surveys infiltrated through newly formed fractures and pre-existing cavities, increasing pore water pressure and reducing effective stress along failure planes [
27,
28]. The clay-rich weathered residual soil mantling the carbonate bedrock is particularly susceptible to strength reduction upon wetting [
29], explaining the pronounced deepening of collapse cavities between 23 and 24 May. The interaction of these three factors—seismic weakening, cumulative dynamic loading, and rainfall-induced pore pressure increase—provides a mechanistic framework that explains both the rapid surface expansion of pre-existing collapses (Type A) and the delayed emergence of new failures (Type B).
The evolution characteristics observed here are consistent with, yet distinct from, those documented in other seismically active karst regions worldwide. Following the 2008 Wenchuan earthquake (Mw 7.9), coseismic surface collapses in carbonate terrain exhibited long-term post-seismic activity lasting months to years, attributed to progressive fracture propagation and hydrologic forcing [
30,
31]. In comparison, the collapses in our study evolved over a much shorter timescale (days rather than months), which we attribute to the smaller magnitude (M5.2 vs. Mw 7.9) and the shallower failure depth (<8 m vs. tens of meters). Studies of the 2016 Kumamoto earthquake sequence (M7.0), which also involved a doublet, documented similar patterns of delayed slope failures in the days following the mainshock, with rainfall acting as a proximate trigger [
32]. The consistent enhancement of post-seismic surface collapse activity during rainy periods across different field settings reveals a close linkage between seismic disturbance and hydrological processes. More broadly, the occurrence of widespread karst collapses following a moderate earthquake is not unique to Liuzhou but is characteristic of southern China’s karst regions: the 2005 M5.7 Jiujiang–Ruichang earthquake, for instance, produced extensive ground fissures and localized collapses in carbonate terrain despite low historical seismicity, demonstrating that moderate-magnitude shaking (M5–6) can trigger severe ground-collapse damage where pre-existing dissolution cavities, shallow groundwater, and clay-rich residual soils coincide—conditions amplified in Liuzhou by the well-developed cavity network in the D
3r and C
1lz carbonate strata and intense rainfall before and after the earthquake.
5. Conclusions
Three-phase UAV surveys over six days following the 2026 M5.2 Liuzhou double earthquake document rapid post-seismic collapse evolution in karst terrain. Total collapse area increased from 75.3 m2 (20 May) to 499.1 m2 (+562%) to 553.9 m2 (+635%). Affected monitoring units rose from 7 to all 17. The evolution was driven by expansion of 7 pre-existing collapses and progressive emergence of 10 new collapses over the first 5 days post-earthquake. Depth measurements revealed collapses up to 7.60 m deep, and ponding water in up to 59% of units indicated rainfall accumulation in collapse depressions.
Beyond the interpretation of the present seismic event, this paper provides universal implications for the study of karst seismic hazards. First, moderate-magnitude earthquakes (M5–6) within karst terrains can trigger prolonged collapse evolution lasting at least six days. Second, the rapid cavity deepening and extensive rainfall ponding highlights the critical role of precipitation in sustaining continuous collapse development, a factor frequently underestimated in conventional post-earthquake hazard reconnaissance. This study demonstrates that multi-temporal UAV monitoring is indispensable for accurate and comprehensive post-seismic geohazard assessment, especially in complex karst landscapes.