Article

Evolution of Glacial Lakes and GLOF Hazards to Transportation Routes in the Southeastern Tibetan Engineering Corridor


1
State Grid Economic and Technological Research Institute, Beijing 102209, China
2
Institute of Geomechanics, Chinese Academy of Geological Sciences, Beijing 100081, China
3
Key Laboratory of Active Tectonics and Geological Safety, Ministry of Natural Resources, Beijing 100081, China
*
Author to whom correspondence should be addressed.
GeoHazards 2026, 7(3), 97; https://doi.org/10.3390/geohazards7030097
Submission received: 6 July 2026 / Revised: 7 August 2026 / Accepted: 10 August 2026 / Published: 12 August 2026

Abstract

The southeastern Tibetan engineering corridor hosts the densest transportation network in Tibet, China, and is traversed by large-scale railway and power corridor projects under construction. This region is home to numerous glacial lakes, some of which are prone to glacial lake outburst floods (GLOFs), posing potential threats to the infrastructure. However, the spatiotemporal evolution and GLOF susceptibility of these lakes remain unclear. Using Landsat 5–9 and Sentinel-2 satellite imagery, we analyzed the spatiotemporal characteristics of glacial lakes from 1990 to 2020. Based on historical GLOF events, we established a susceptibility assessment criterion and determined the susceptibility levels of all glacial lakes in the study area. Results show that the number and area of glacial lakes increased by 40.4% and 26.2%, respectively, from 1990 to 2020, with expansion rates of 2.47 lakes/year and 0.26 km2/year. We identified 31 very highly and 48 highly susceptible lakes, mainly distributed along the Gongrigabu River and the Parlung Tsangpo River. Among them, 35 lakes are most likely to impact National Highways G219 and G318 within the study area. Additionally, three channels with glacial lake clustering amplification effects were found, which may lead to the superposition and amplification of flood impacts, significantly increasing GLOF risks and hazards. Our findings provide crucial references for ensuring the safe operation of local transportation networks and reducing GLOF risks in ongoing large-scale construction projects.

1. Introduction

The engineering corridor area at the southeastern edge of the Tibetan Plateau has the densest road network in the Tibet region of China [1,2], which serves as an important link connecting eastern and western China [3]. The under-construction large-scale railway will also pass through this area [4,5,6]. Furthermore, with the accelerated progress of power corridor projects [7], the safe and smooth operation of the road network in this region is a crucial foundation for the construction of power transmission facilities. Consequently, the southeaster Tibetan engineering corridor encompasses highways, high-speed rail, and power transmission facilities, establishing it as the central hub for engineering construction throughout the Tibetan region of China [8,9,10]. The construction of these large-scale projects has significantly enhanced the transportation potential and economic growth prospects of western China [11,12]. However, due to active tectonic activity [13] and the humid, rainy climate characteristics [14], the geological conditions in the study area are complex, with frequent natural disasters such as earthquakes, landslides, glacier collapses, and glacial lake outburst floods (GLOFs) [15,16,17]. As a critical artery for the construction of other large-scale projects, the road network in the study area faces enormous challenges for safe operation year-round [18,19].
In the past half-century, global warming has significantly accelerated the retreat of glaciers in high-mountain Asia [20,21,22]. At the same time, climate change has also prompted rapid expansion of glacial lakes in this area, leading to the emergence of new glacial lakes [23,24,25]. Compared to other mountainous regions in Asia, the glaciers in the southeastern Tibetan Plateau are melting at a faster rate, which further accelerates the expansion of glacial lakes [26,27,28]. However, the increase in the size of these lakes significantly raises the risk of GLOFs [29,30]. GLOFs are sudden, highly dangerous natural disasters that can have far-reaching effects and are often accompanied by debris flows [31]. Proglacial lakes and ice-dammed lakes are the main sources of GLOF events. Ice collapses, rockfalls, avalanches, landslides, extreme precipitation events, glacier melting, and other destabilizing factors can gradually weaken the dam structure, ultimately leading to the rupture of the morainic dam [32,33,34]. The resulting rapid release of large volumes of lake water and sediment can trigger sudden flooding downstream, severely damaging local road infrastructure and disrupting downstream natural ecosystems [35,36]. It is noteworthy that the warming rate of the Tibetan Plateau over recent decades has been approximately twice the global average, making it one of the most climate-sensitive regions on Earth [20,21]. In the southeastern Tibetan engineering corridor, this accelerated warming has driven rapid glacier retreat [16]. However, the response of glacial lakes in this region to this accelerated warming process, along with their spatiotemporal evolution patterns and potential hazard risks, remain poorly understood.
Since 1984, over 214 GLOFs have been recorded in high-mountain Asia, and the frequency of GLOF occurrences has shown a significant upward trend [25]. Notably, approximately 15 million people worldwide face potential threats from GLOFs, with populations in high-mountain Asia being the most severely affected [24]. In 2020, the GLOF disaster at Jinweng Co in the southeastern Tibetan Plateau resulted in the destruction of 10 houses, damage to 8 bridges, and the washing away of 43.9 km of road, as well as severe damage to other buildings and farmland [37]. On 25 June 2020, a proglacial lake outburst occurred at Jiwen Co in Niyu Township, Jiali County, on the Tibetan Plateau, leading to the flooding or destruction of 382.43 acres of farmland, damage to 43.9 km of road, six steel bridges, one suspension bridge, and one concrete culvert [38]. Therefore, accurately and comprehensively understanding the evolution trends of glacial lakes and identifying lakes vulnerable to GLOFs is crucial for the safe construction and operation of large-scale engineering projects in the southeastern Tibetan engineering corridor. While previous studies have conducted assessments of GLOF susceptibility, most have focused on individual lakes [39,40,41], small watersheds [42,43,44], or entire high-mountain Asia [45,46,47], or even the global scale [24]. However, these studies lack detailed investigations specific to the southeastern Tibetan engineering corridor and have not sufficiently considered the potential risk of future GLOF events on critical infrastructure.
This study employs remote sensing imagery technology to conduct a comprehensive mapping and classification of glacial lakes in the southeastern Tibetan engineering corridor, thereby assessing the current GLOF susceptibility associated with these glacial lakes. The aim of this research is to analyze the spatial and temporal changes in glacial lakes and to evaluate the potential risks of GLOF events to the major transportation routes within the study area. The research focuses on the following three aspects: (1) using remote sensing data to reveal the trends in the number and area of glacial lakes between 1990 and 2020; (2) quantifying the susceptibility levels of glacial lakes by comparing differential indicators from past GLOF events with those of contemporary glacial lakes; and (3) conducting a detailed analysis of glacial lakes that pose potential risks to the major transportation routes in the study area, in relation to their expansion rates and susceptibility levels.

2. Materials and Methods

2.1. Study Area

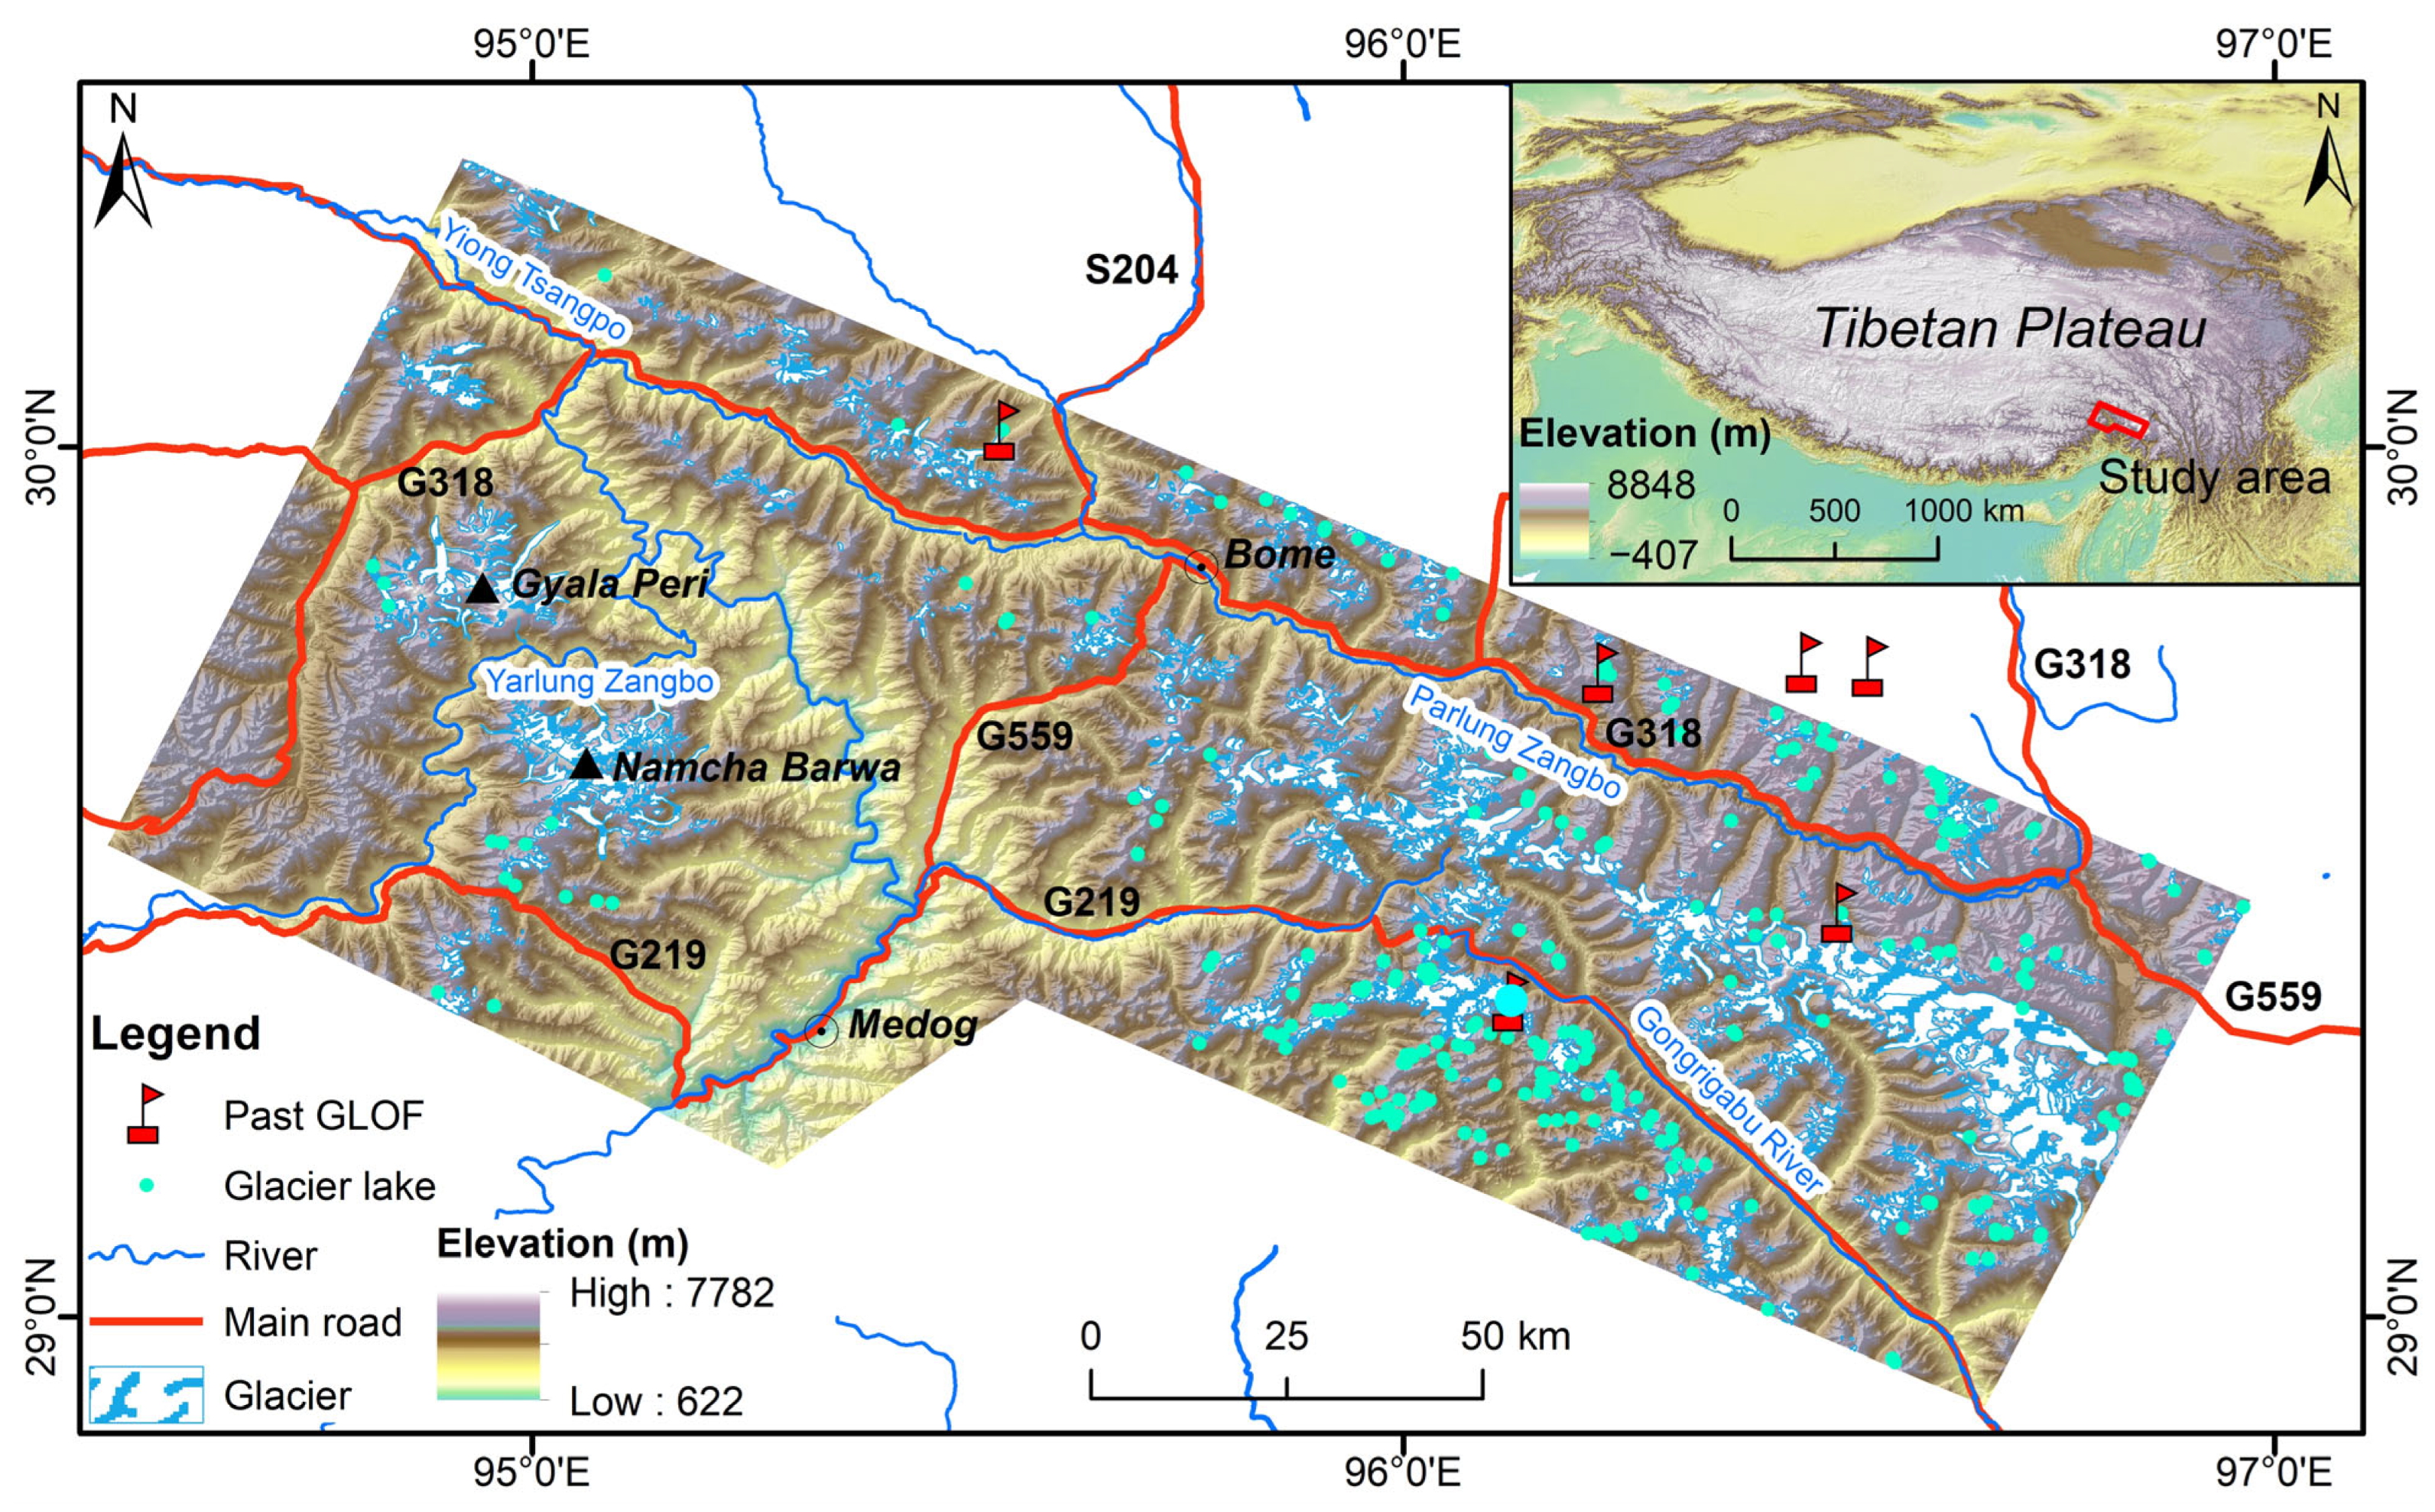
This study focuses on the engineering corridor area at the southeastern edge of the Tibetan Plateau, which is located within the latitude range of 28.9° to 30.3° N and longitude range of 97.0° to 94.5° E (Figure 1). This region features the most densely populated network of transportation routes on the southeastern Tibetan Plateau, where the G318, G559, and G219 highways converge, facilitating travel between eastern and western China. In the future, the large-scale railway and transmission corridors will also pass through this area. Therefore, this region is one of the most active areas for engineering activities on the southeastern Tibetan Plateau. The total area of the study region is approximately 18,218.5 km2, with an east–west span of about 240 km and a north–south span of about 150 km. The southeastern Tibetan engineering corridor is situated in the eastern Himalayan tectonic geomorphological zone, representing one of the most geodynamically active areas on Earth [13]. Additionally, the region encompasses the eastward-trending Himalayas and the eastern segment of the Nyainqêntanglha range, featuring two major rivers: the Yarlung Tsangpo and the Parlung Tsangpo. Due to rapid tectonic uplift (>5 mm/a) [13] and intense river erosion [14], the region has been shaped into a high-mountain gorge landscape characterized by steep peaks and deep valleys [48]. The area has a topography that is higher in the north and lower in the south, with altitudes generally above 5000 m and relative elevation differences reaching up to 2000 to 3000 m, averaging about 3800 m. The highest point is located on the western side at Namcha Barwa, which rises to 7782 m, while the lowest point, near Medog, is as low as 622 m.

2.2. Mapping and Classification of Glacial Lakes

In this study, glacial lakes are defined as those located within a 10 km radius of glaciers (RGI v6.0) [49]. Utilizing the Google Earth Engine (GEE) platform, the research employed optical remote sensing data from Landsat 5–9 satellites with cloud cover below 30% (Table S1). For glacial lake identification, we applied the band ratio method, which exploits the spectral differences between water and other land cover types. Specifically, for Landsat 5 and 7 (TM/ETM+), we used the ratio of band 2 (green) to band 5 (SWIR1), i.e., TM2/TM5; for Landsat 8 and 9 (OLI), we used the ratio of band 3 (green) to band 6 (SWIR1), i.e., OLI3/OLI6. These band combinations effectively enhance water bodies while suppressing the reflectance of ice, snow, and bedrock [50,51,52]. By meticulously examining the outlines of the glacial lakes and performing manual corrections, the spatial evolution characteristics of glacial lakes in the study area from 1990 to 2020 were successfully obtained, covering a time span of 30 years. Notably, the present study permits shifts in lake classification for an individual lake across different periods. For lake type identification at each time step, classification was not directly implemented using glacier outlines from the RGI v6.0 dataset. Instead, taking RGI v6.0 as a reference, we overlaid multi-temporal Landsat imagery and manually interpreted the spatial relationship between each lake and adjacent glaciers to determine the lake type.
This study further categorizes glacial lakes into three types—proglacial lakes, supraglacial lakes and detached lakes—according to their hydrological connection with their parent glaciers [53]. Only those glacial lakes with an area exceeding 0.005 km2 were mapped. Additionally, detailed attributes for each lake are annotated, including lake ID, type, geographic coordinates, elevation, and area. The parent glacier is defined as the largest glacier that is in direct contact with or supplies water to the glacial lake [54]. For topographic analyses, including lake elevation extraction and flood-pathway slope calculations, we used the Copernicus DEM 30 m (COP-DEM30) global elevation model, available at https://dataspace.copernicus.eu/ (accessed on 10 February 2025). This dataset provides a spatial resolution of approximately 30 m and a vertical accuracy of <4 m (absolute) and <2 m (relative) according to the Copernicus DEM Product Handbook.

2.3. GLOF Susceptibility Assessment

In the Tibetan Plateau and its surrounding areas, indicators such as the area/volume of glacial lakes, characteristics of parent glaciers, and the stability of slopes adjacent to lakes are commonly used to assess the susceptibility to GLOFs [30,54]. These indicators are based on the identification and quantification of historical GLOFs. However, due to the unclear mechanisms underlying most GLOFs, promoting the use of GLOF susceptibility assessment indicators poses significant challenges [35,43]. Moreover, the causes of GLOFs can differ significantly across geographical regions, highlighting clear regional disparities [25,53]. To determine appropriate GLOF susceptibility assessment indicators for the study area, this research reviewed the literature, analyzed Landsat imagery, and conducted field investigations of 12 historical GLOF events in the southeastern Tibetan engineering corridor and surrounding areas. The results indicate that ice collapse is the primary trigger for GLOFs, accounting for nine of these historical events. Additionally, one event was triggered by an upstream GLOF, while the remaining two were caused by the melting of morainic dams (Table 1).
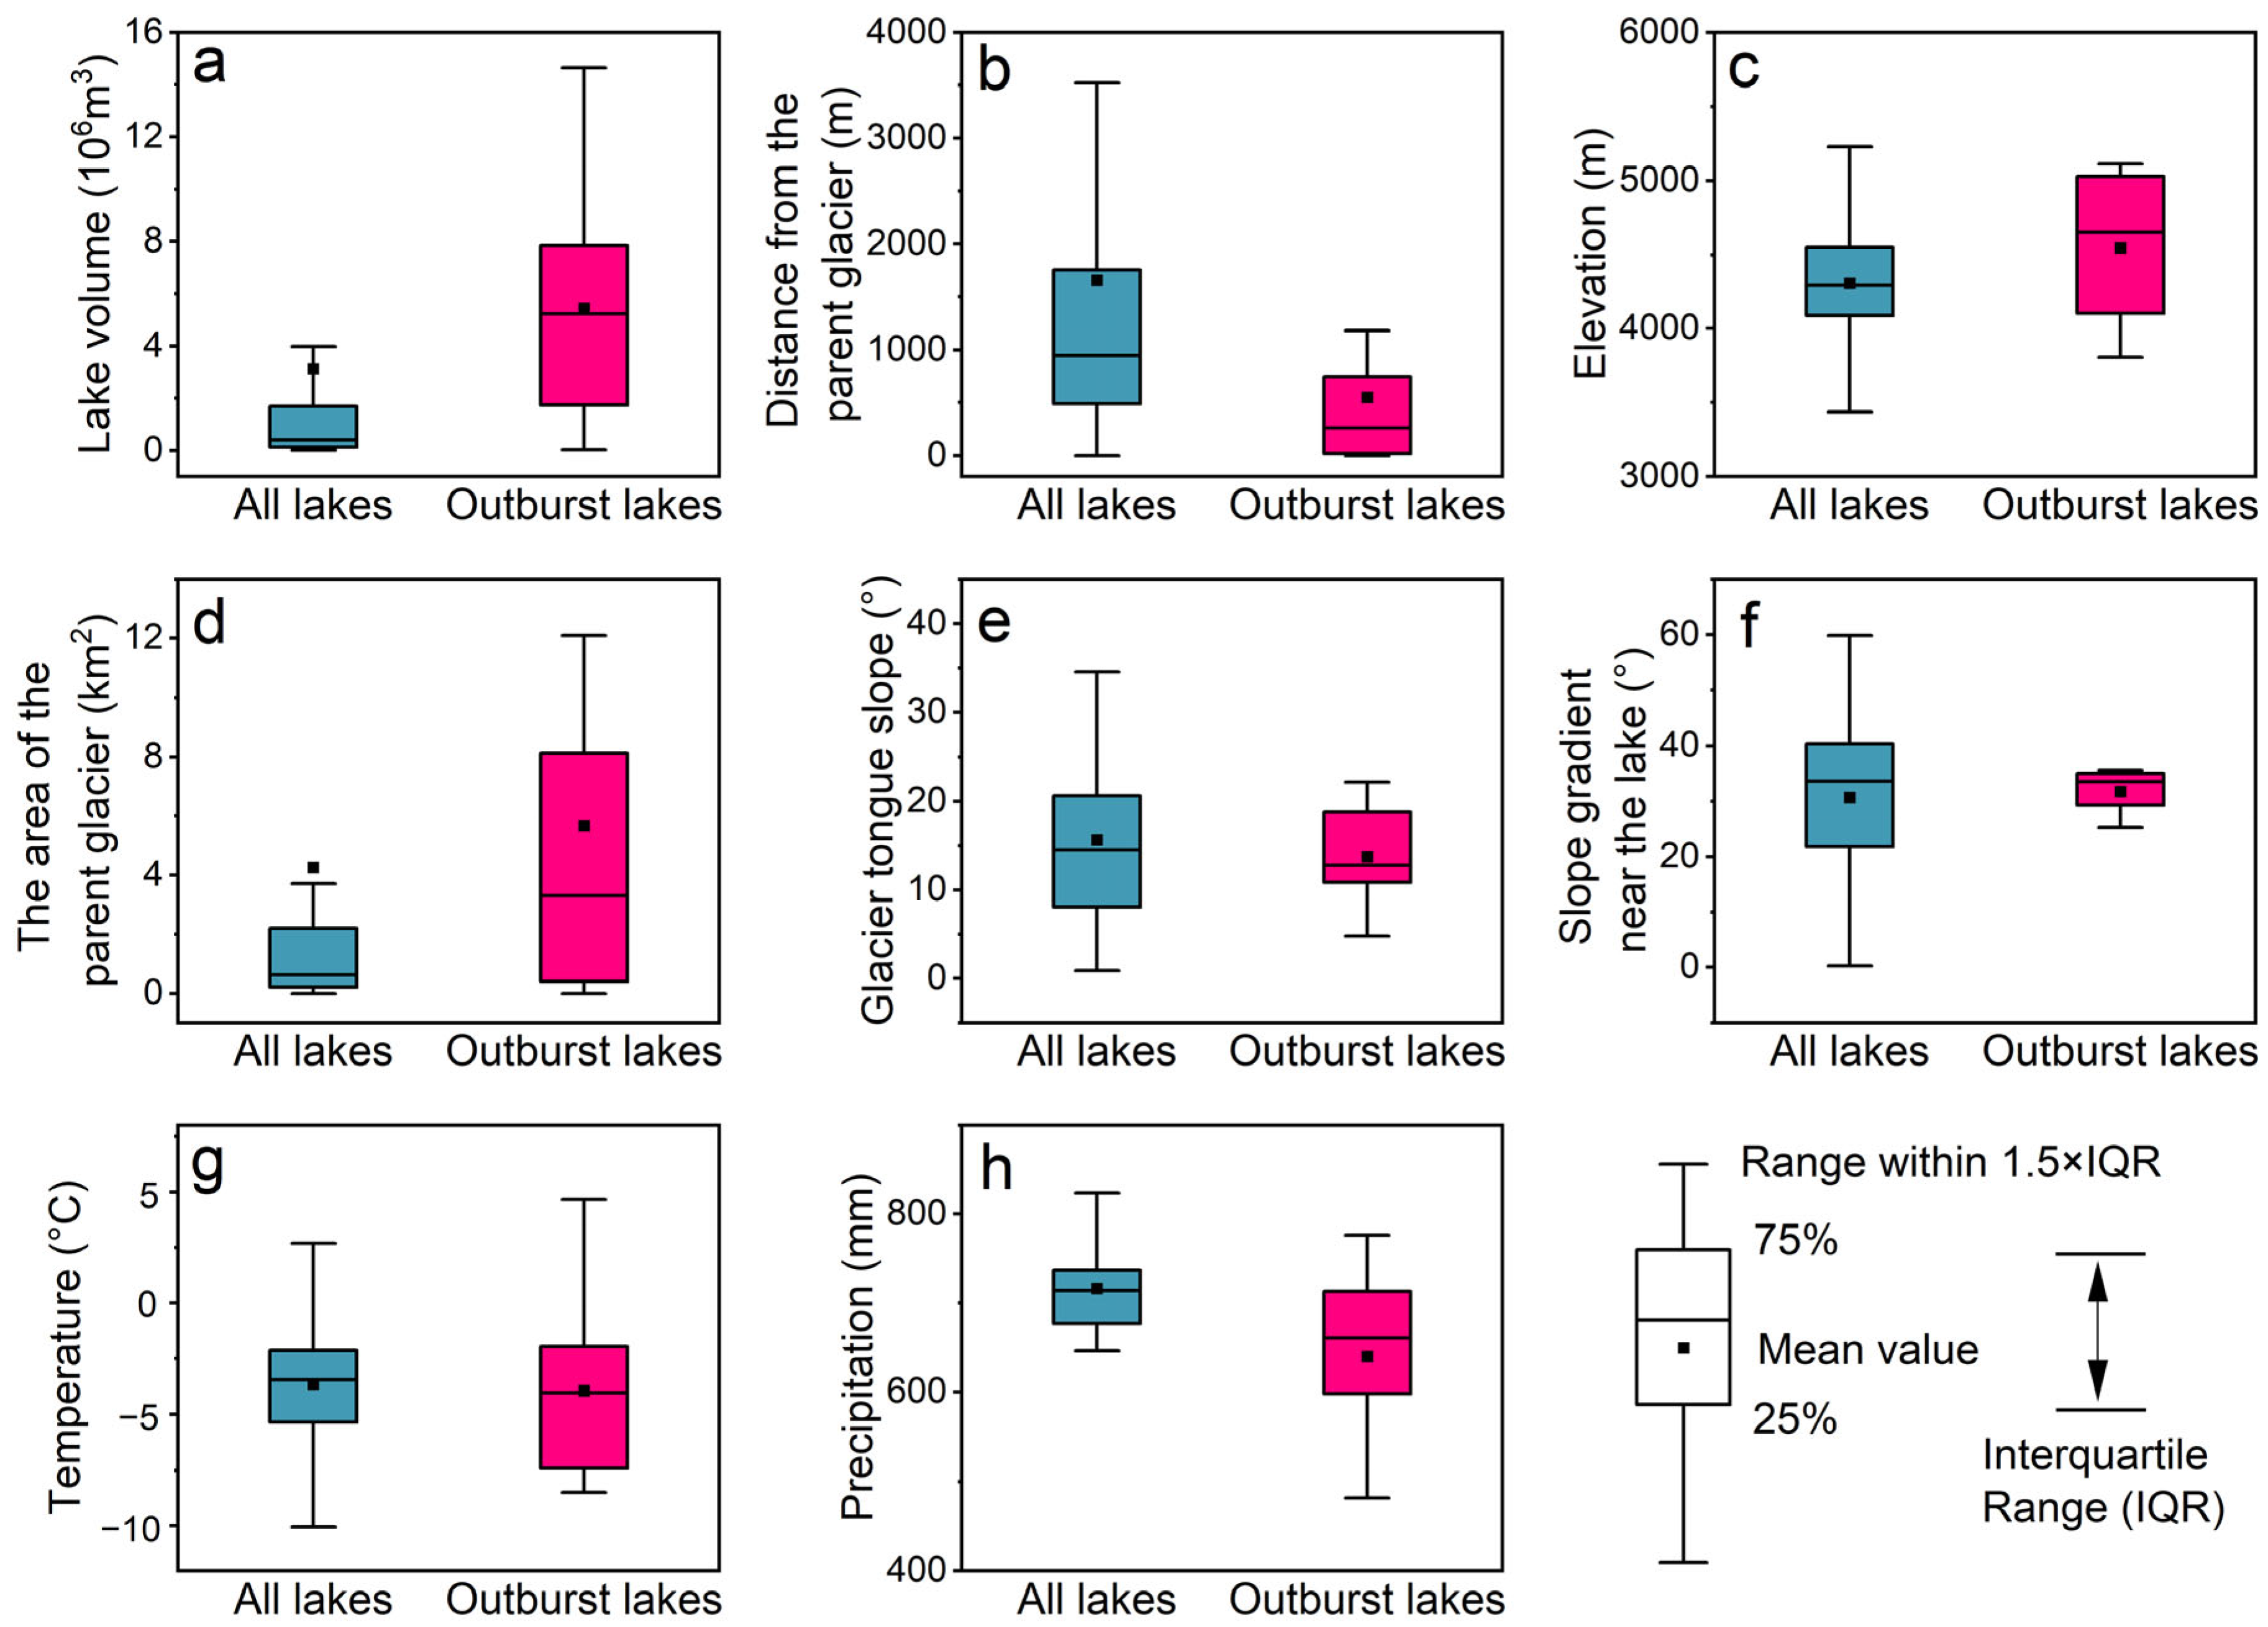
To further determine the GLOF susceptibility assessment indicators for the study area, we compared the characteristics of glacial lakes in the study area with those of previously documented glacial lakes that had experienced outburst events, as listed in Table 1. Glacial lakes that have experienced outbursts significantly differed from stable lakes in terms of volume, elevation, distance to the parent glacier, and the parent glacier area (Figure 2). To statistically evaluate the differences between historically outburst lakes and stable lakes across the candidate indicators, we employed the Mann–Whitney U non-parametric test (Supplementary Table S2). The results show that lake volume (U = 1568.0, Z = 4.702, p < 0.001), distance to the parent glacier (U = 2537.0, Z = 2.248, p = 0.025), and parent glacier area (U = 2350.5, Z = 2.713, p = 0.007) differ significantly between the two groups. In contrast, no statistically significant differences were detected for elevation, glacier tongue slope, slope near the lake, air temperature, or precipitation (p ≥ 0.05). Although elevation did not show a statistically significant difference between outburst and stable lakes in our dataset, we nonetheless retained it as a fourth indicator in the susceptibility assessment. Elevation is widely used as an important factor in GLOF susceptibility assessments [30,54,57]. Higher-altitude lakes are typically situated in steeper terrain, where the substantial elevation drop would significantly amplify flood velocity and reach in the event of an outburst [43]. Meanwhile, high-altitude regions are more sensitive to climate warming, with accelerated glacier retreat and more frequent ice avalanches indirectly increasing the likelihood of dam failure [44,45]. Given the well-established physical importance of elevation and its common use in previous GLOF assessments, we assigned it a lower weight (0.1) in the susceptibility score to reflect its relatively weaker discriminative ability in this regional context, while still accounting for its potential contribution to failure susceptibility. In summary, four indicators, namely lake volume, distance to the parent glacier, parent glacier area, and elevation, were selected for GLOF susceptibility assessment in this study. Furthermore, to more effectively focus on vulnerable glacial lakes and mitigate the impact of redundant data, this study conducted GLOF susceptibility assessments on glacial lakes with an area greater than 0.01 km2. This threshold excluded 19 lakes with areas between 0.005 km2 and 0.01 km2, which collectively account for less than 1.5% of the total glacial lake area and are considered to pose negligible GLOF hazard due to their limited water storage capacity [30,54].
Lake volume, which indicates the amount of water stored within a lake, is a key factor in determining the scale of flooding during GLOFs [58]. A larger lake volume implies a greater potential floodwater volume, as well as higher hydrostatic pressure exerted on the morainic dam [58]. In previous studies, lake volume has been recognized as an important indicator for assessing GLOF susceptibility [59]. There exists a certain correlation between the area and volume of glacial lakes, and various area–volume relationship equations have been proposed in earlier research. Table 2 lists commonly used area–volume relationship equations, which generally exhibit exponential relationships. In this study, we adopt the empirical formula proposed by [60] to estimate glacial lake volumes. Based on a comprehensive comparison of the sources, calibration datasets, and regional applicability of the formulas, the formula proposed by [60] was established using measured bathymetric data from 47 Himalayan lakes, representing the largest sample size and the broadest calibration range among currently available area–volume relationships for the Himalayan region. This calibration dataset is geographically and climatically closest to our study area, and this formula has been widely applied and validated in GLOF studies in the Himalaya. Therefore, we selected this formula as the volume estimation approach for this study.
In the southeastern Tibetan region, the large-scale movement of material from ice avalanches into lakes has historically been the primary cause of GLOF events [32]. Among the 12 recorded GLOF events in the southeastern Tibetan region, 9 were triggered by ice avalanches entering the lakes. This study assesses the sensitivity of glacial lakes to large-scale material movement from glaciers by calculating the distance between the glacial lakes and their parent glaciers, as well as the area of the parent glaciers. Additionally, elevation is another key factor in evaluating the susceptibility of GLOFs. High-altitude glacial lakes are often located in steep terrain, and the interaction between water storage volume and the potential energy of collapse significantly increases the risk of failure [65,66]. Figure 2c illustrates the statistical correlation between the elevation of glacial lakes and historical failure events, revealing the potential controlling mechanisms of elevation on the dynamics of glacial lake failures.
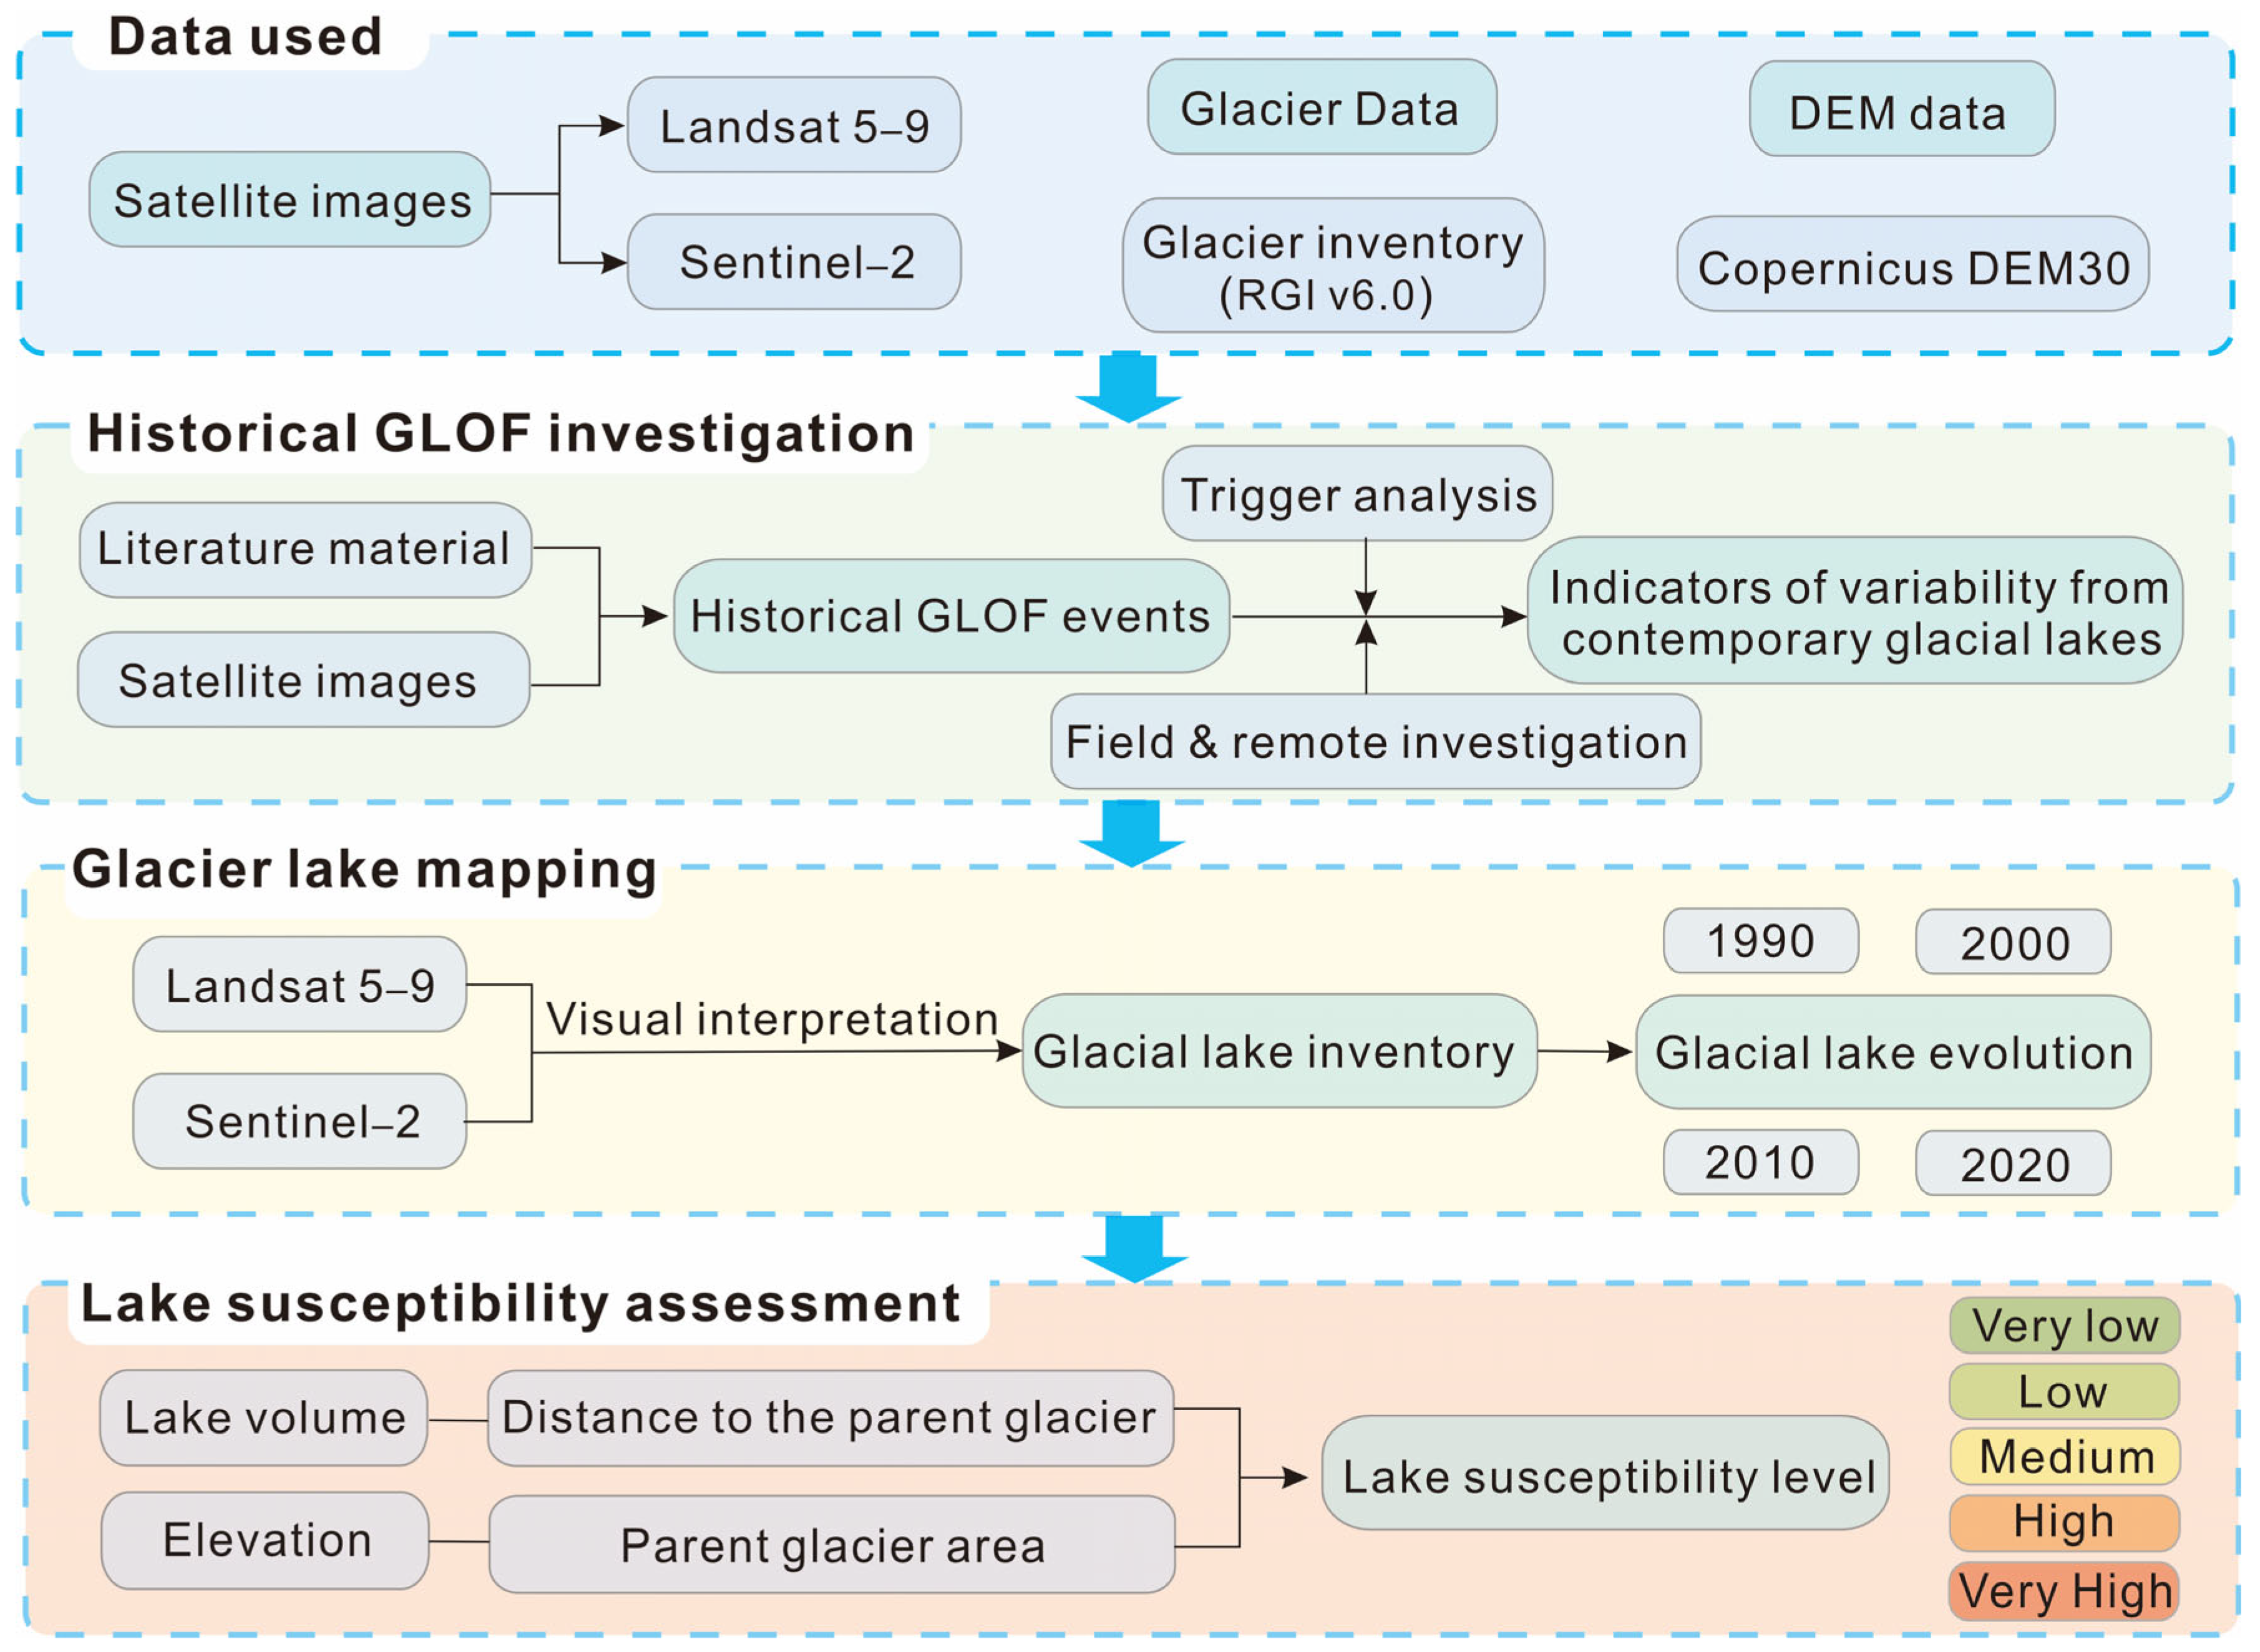
Each normalized indicator was discretized into five tiers (0.2, 0.4, 0.6, 0.8, 1.0) based on 20%, 40%, 60%, and 80% thresholds, with tier boundaries corresponding to these quantile values (Figure 3). Subsequently, based on a detailed analysis of historical GLOF events, the weights of four indicators—lake volume, distance from the parent glacier, area of the parent glacier, and elevation—were determined to be 0.4, 0.25, 0.25, and 0.1, respectively. The weight assignments for the four indicators were determined based on a comprehensive consideration of three aspects: statistical discriminability, physical contribution, and literature conventions (Figure 2; Table S2). In terms of statistical discriminability, the Mann–Whitney U test shows that lake volume has the highest discriminative power between outburst and stable lakes (p < 0.001), followed by distance to the parent glacier (p = 0.025) and parent glacier area (p = 0.007), while elevation exhibits the lowest discriminatory power (p = 0.304). Accordingly, the weights were assigned in decreasing order. In terms of physical contribution, lake volume directly determines the potential flood magnitude, distance to the parent glacier and parent glacier area control the likelihood and magnitude of ice avalanche impacts into the lake, whereas elevation primarily influences the potential energy conversion process of outburst floods, playing a relatively indirect role. Meanwhile, the weight assignments also drew upon literature conventions in regional GLOF susceptibility assessments [30,54,59], and were locally adjusted based on the characteristics of historical GLOF events in the study area. Finally, GLOF susceptibility scores for each lake were calculated based on Equation (1). Glacial lakes were assigned to five GLOF susceptibility levels (very low, low, moderate, high, and very high) through the natural breaks classification of their susceptibility scores.
S = 0.4 × T V + 0.25 × T D + 0.25 × T A + 0.1 × T E
where S is the GLOF susceptibility score of the glacial lake; TV is the normalized tier value of the lake volume indicator; TD is the normalized tier value of the distance to the parent glacier indicator; TA is the normalized tier value of the parent glacier area indicator; and TE is the normalized tier value of the elevation indicator.

2.4. Identification of Cascading Lake Clusters

On the basis of individual lake susceptibility assessment, we further identified potential cascading lake clusters, defined as clusters in which an outburst from an upstream lake may trigger successive failures of multiple downstream lakes along the same flow path. The identification was based on the following criteria. First, based on the flow direction extracted from the Copernicus DEM30 (30 m resolution), three or more glacial lakes with moderate or higher susceptibility were considered potentially connected if they are aligned along the same drainage line and if the downstream lakes lie within the potential outburst flood path of the upstream lake. On this basis, the straight-line distance between the outlet (or dam toe) of the upstream lake and the shoreline of the downstream lake was required to be less than 5 km, ensuring that flood propagation remains sufficiently concentrated to trigger cascading failures. Finally, all candidate clusters identified through the above criteria were further validated by manual visual interpretation of satellite imagery to exclude topographic barriers (e.g., ridges, moraine mounds) that might block flood propagation, thereby ensuring that the connectivity assumptions are realistic.

3. Results

3.1. The Distribution and Change in Glacial Lakes

3.1.1. Spatial Distribution of Glacial Lakes

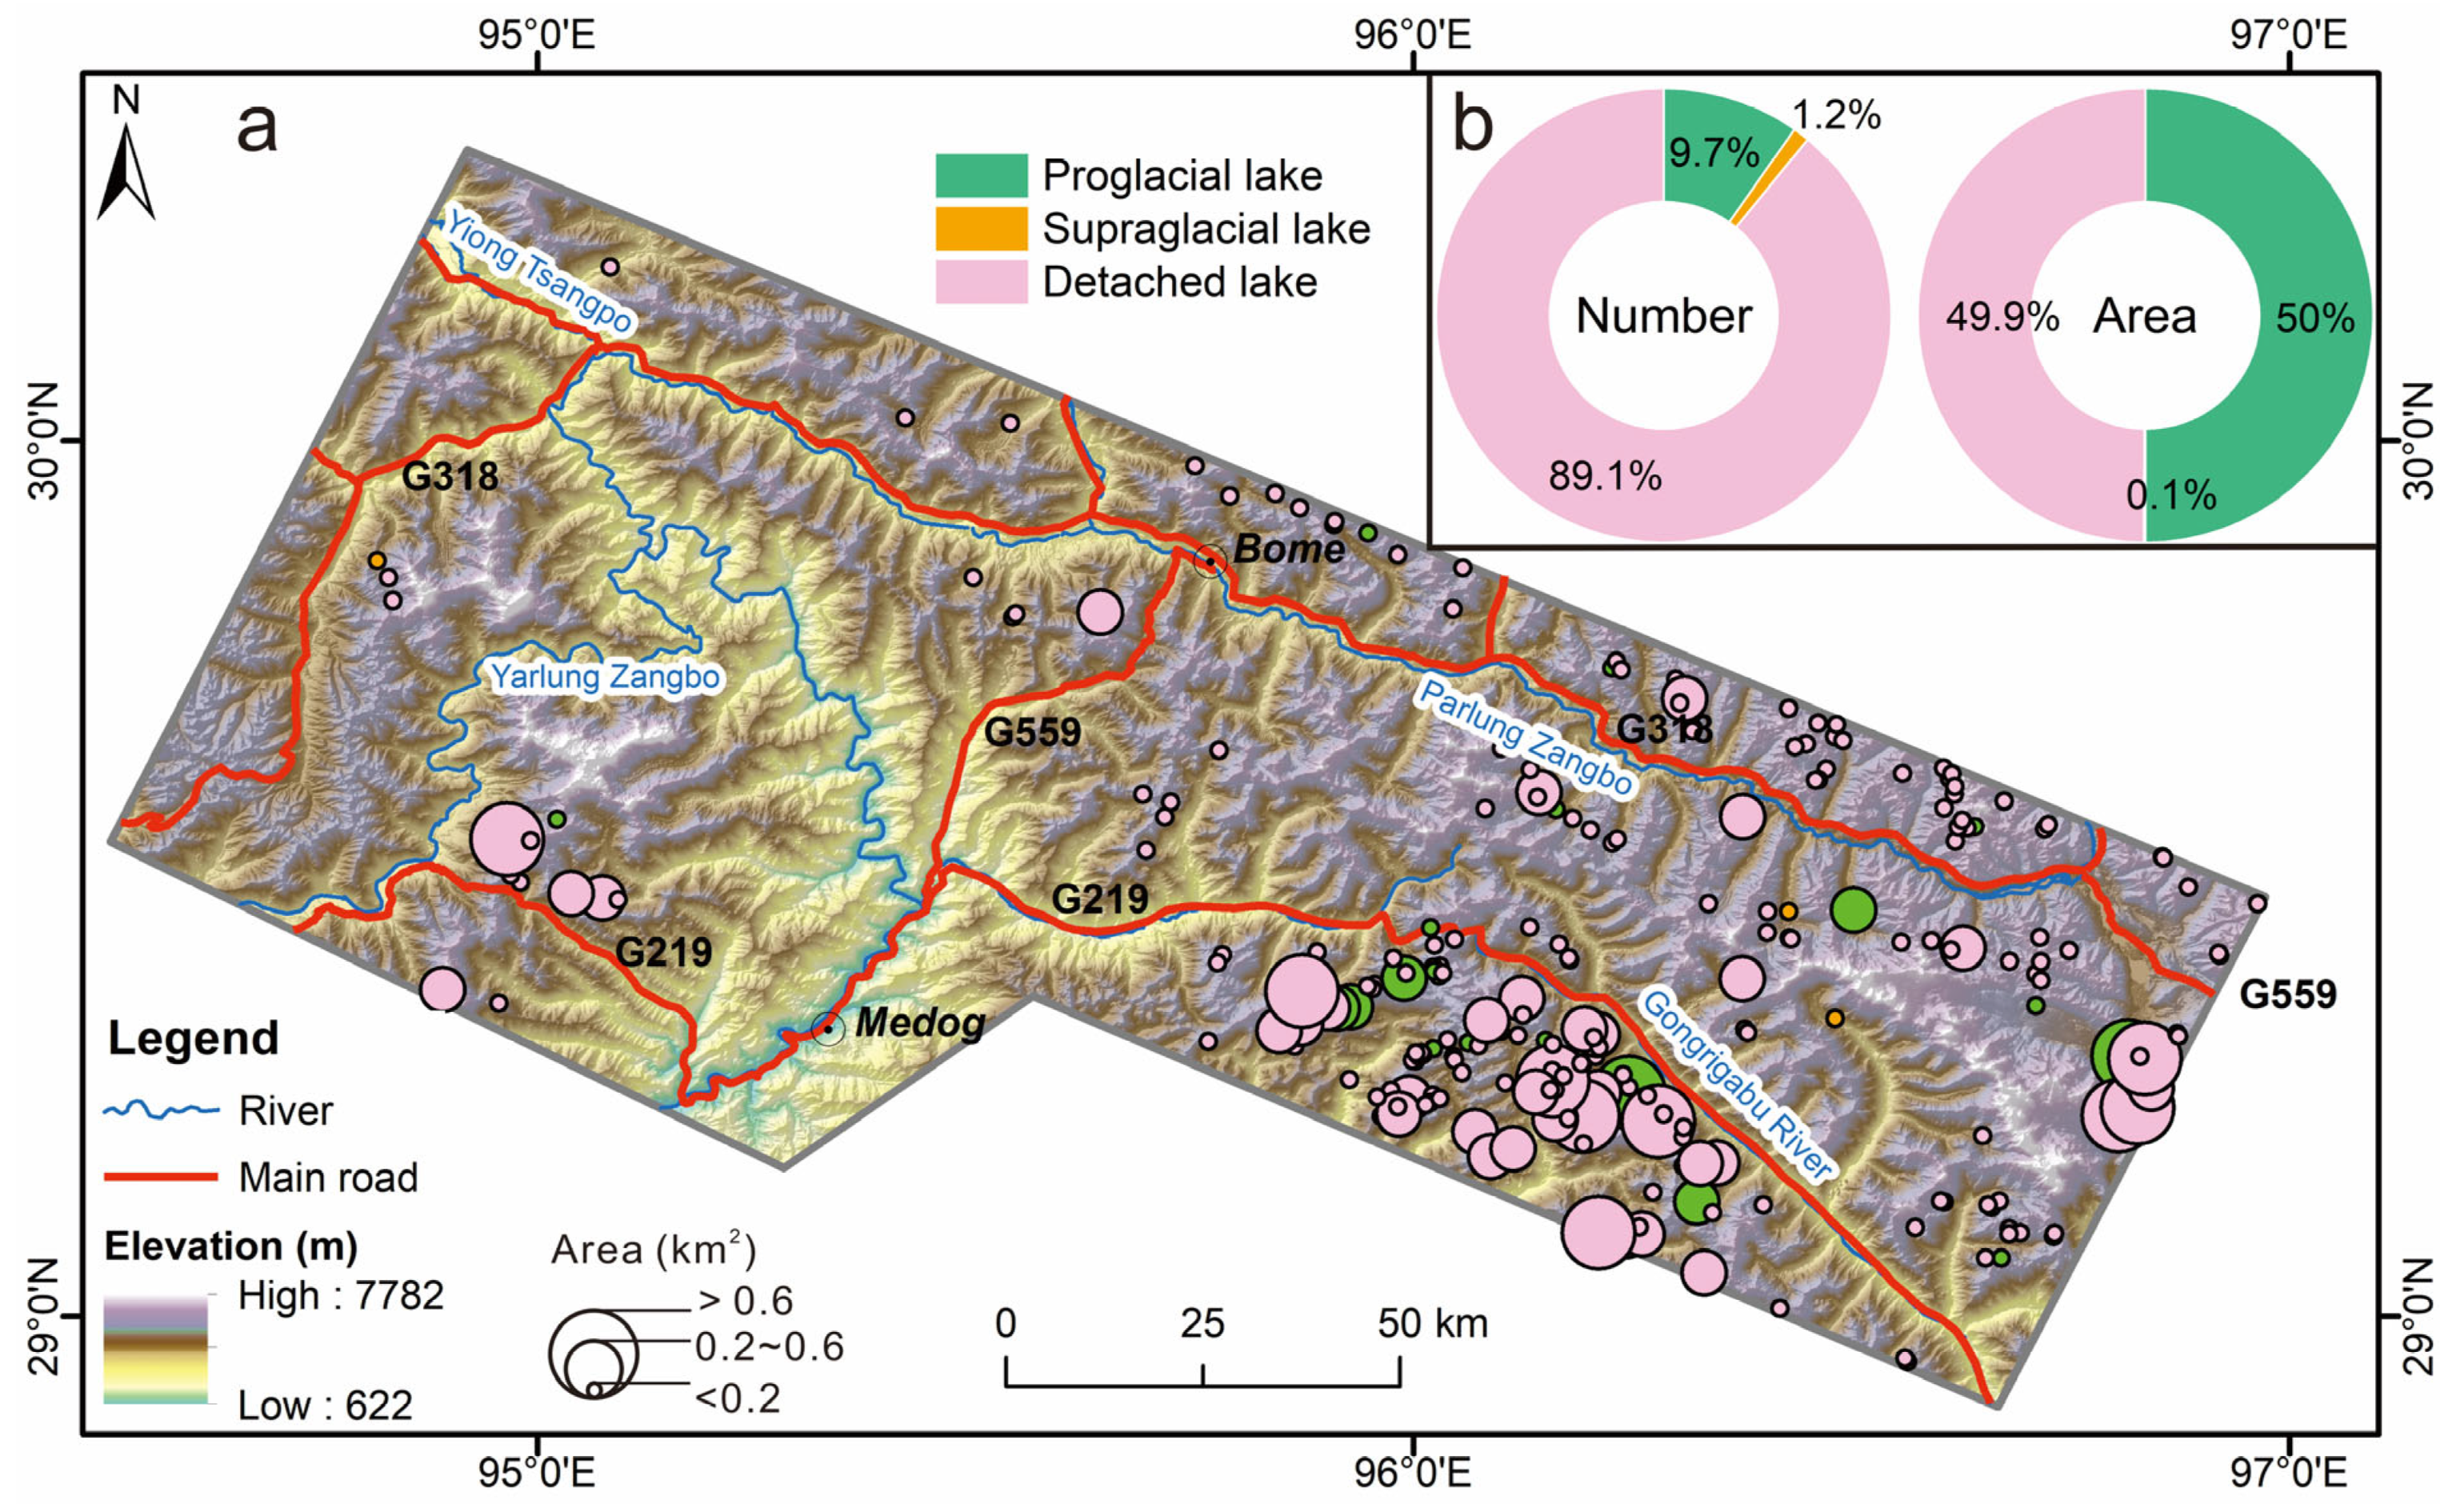
This study utilized multi-temporal Landsat series imagery, including data from 1990, 2000, 2010, and 2020, to extract and analyze glacial lake characteristics. In 2020, we identified a total of 257 glacial lakes in the study area, primarily concentrated on the southeastern side (Figure 4). The total area of these glacial lakes reached 37.89 km2, with a cumulative volume of approximately 1.8 × 10⁷ m3. Among all glacial lakes, detached lakes accounted for the largest proportion, representing 89.1% of the total number and 49.9% of the total area. Proglacial lakes came next, constituting 9.7% and 50% of the total number and area, respectively. Supraglacial lakes were relatively rare, comprising only 0.1% of the total area. This distribution pattern is primarily related to the slope of the glaciers, which hinders the accumulation of meltwater and snow on the glacier surface. Additionally, severe leakage caused by basin deformation and rupture further limits the stable formation of supraglacial lakes.
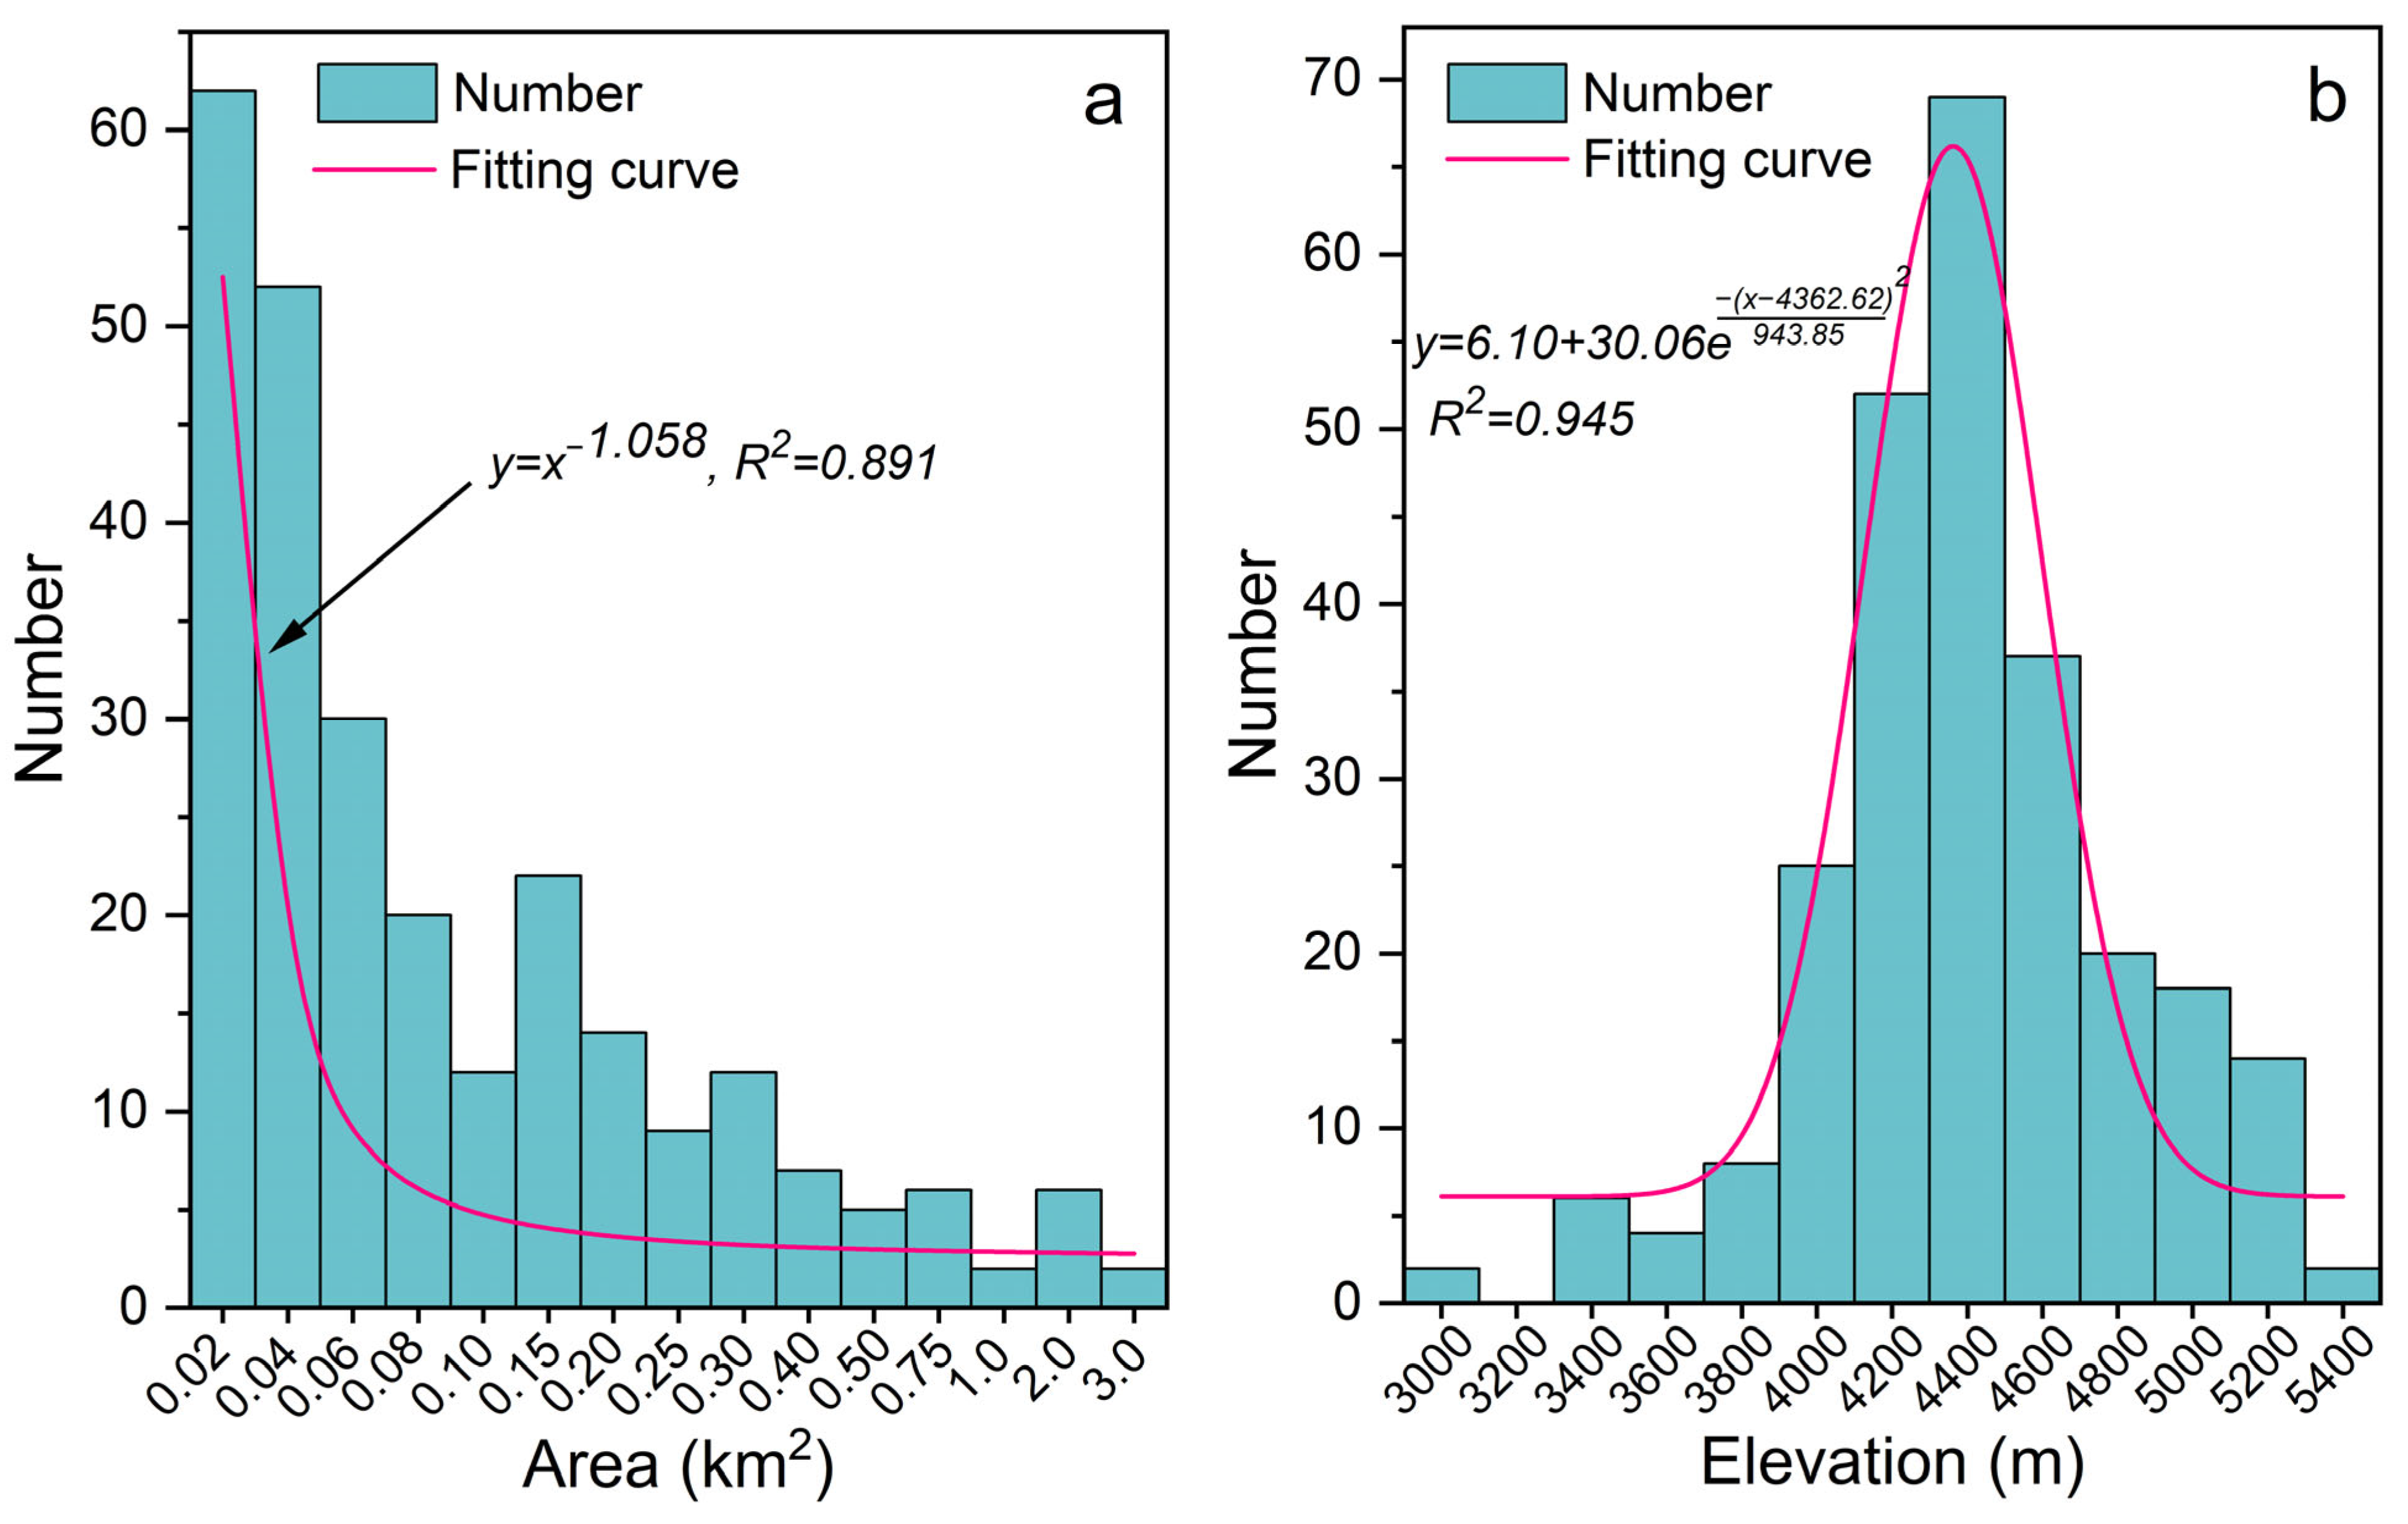
It is noteworthy that there are numerous small glacial lakes in the study area, while large glacial lakes are relatively scarce (Figure 5a). Glacial lakes with an area of less than 0.1 km2 account for 68.5% of the total number, but they comprise only 15.8% of the total glacial lake area in the study area. In contrast, glacial lakes larger than 1.0 km2 constitute only 3.9% of the total number, yet they represent 30.7% of the total glacial lake area in the study area. When analyzing the distribution of glacial lakes at different elevations, we found that glacial lakes are primarily located within the elevation range of 4000 to 5200 m. Moreover, the relationship between the number of glacial lakes and elevation exhibits a distinct normal distribution trend, with the elevation range of 4200 to 4400 m identified as a concentration zone for the development of glacial lakes in the study area (Figure 5b).

3.1.2. Evolutionary Trends of Glacial Lakes

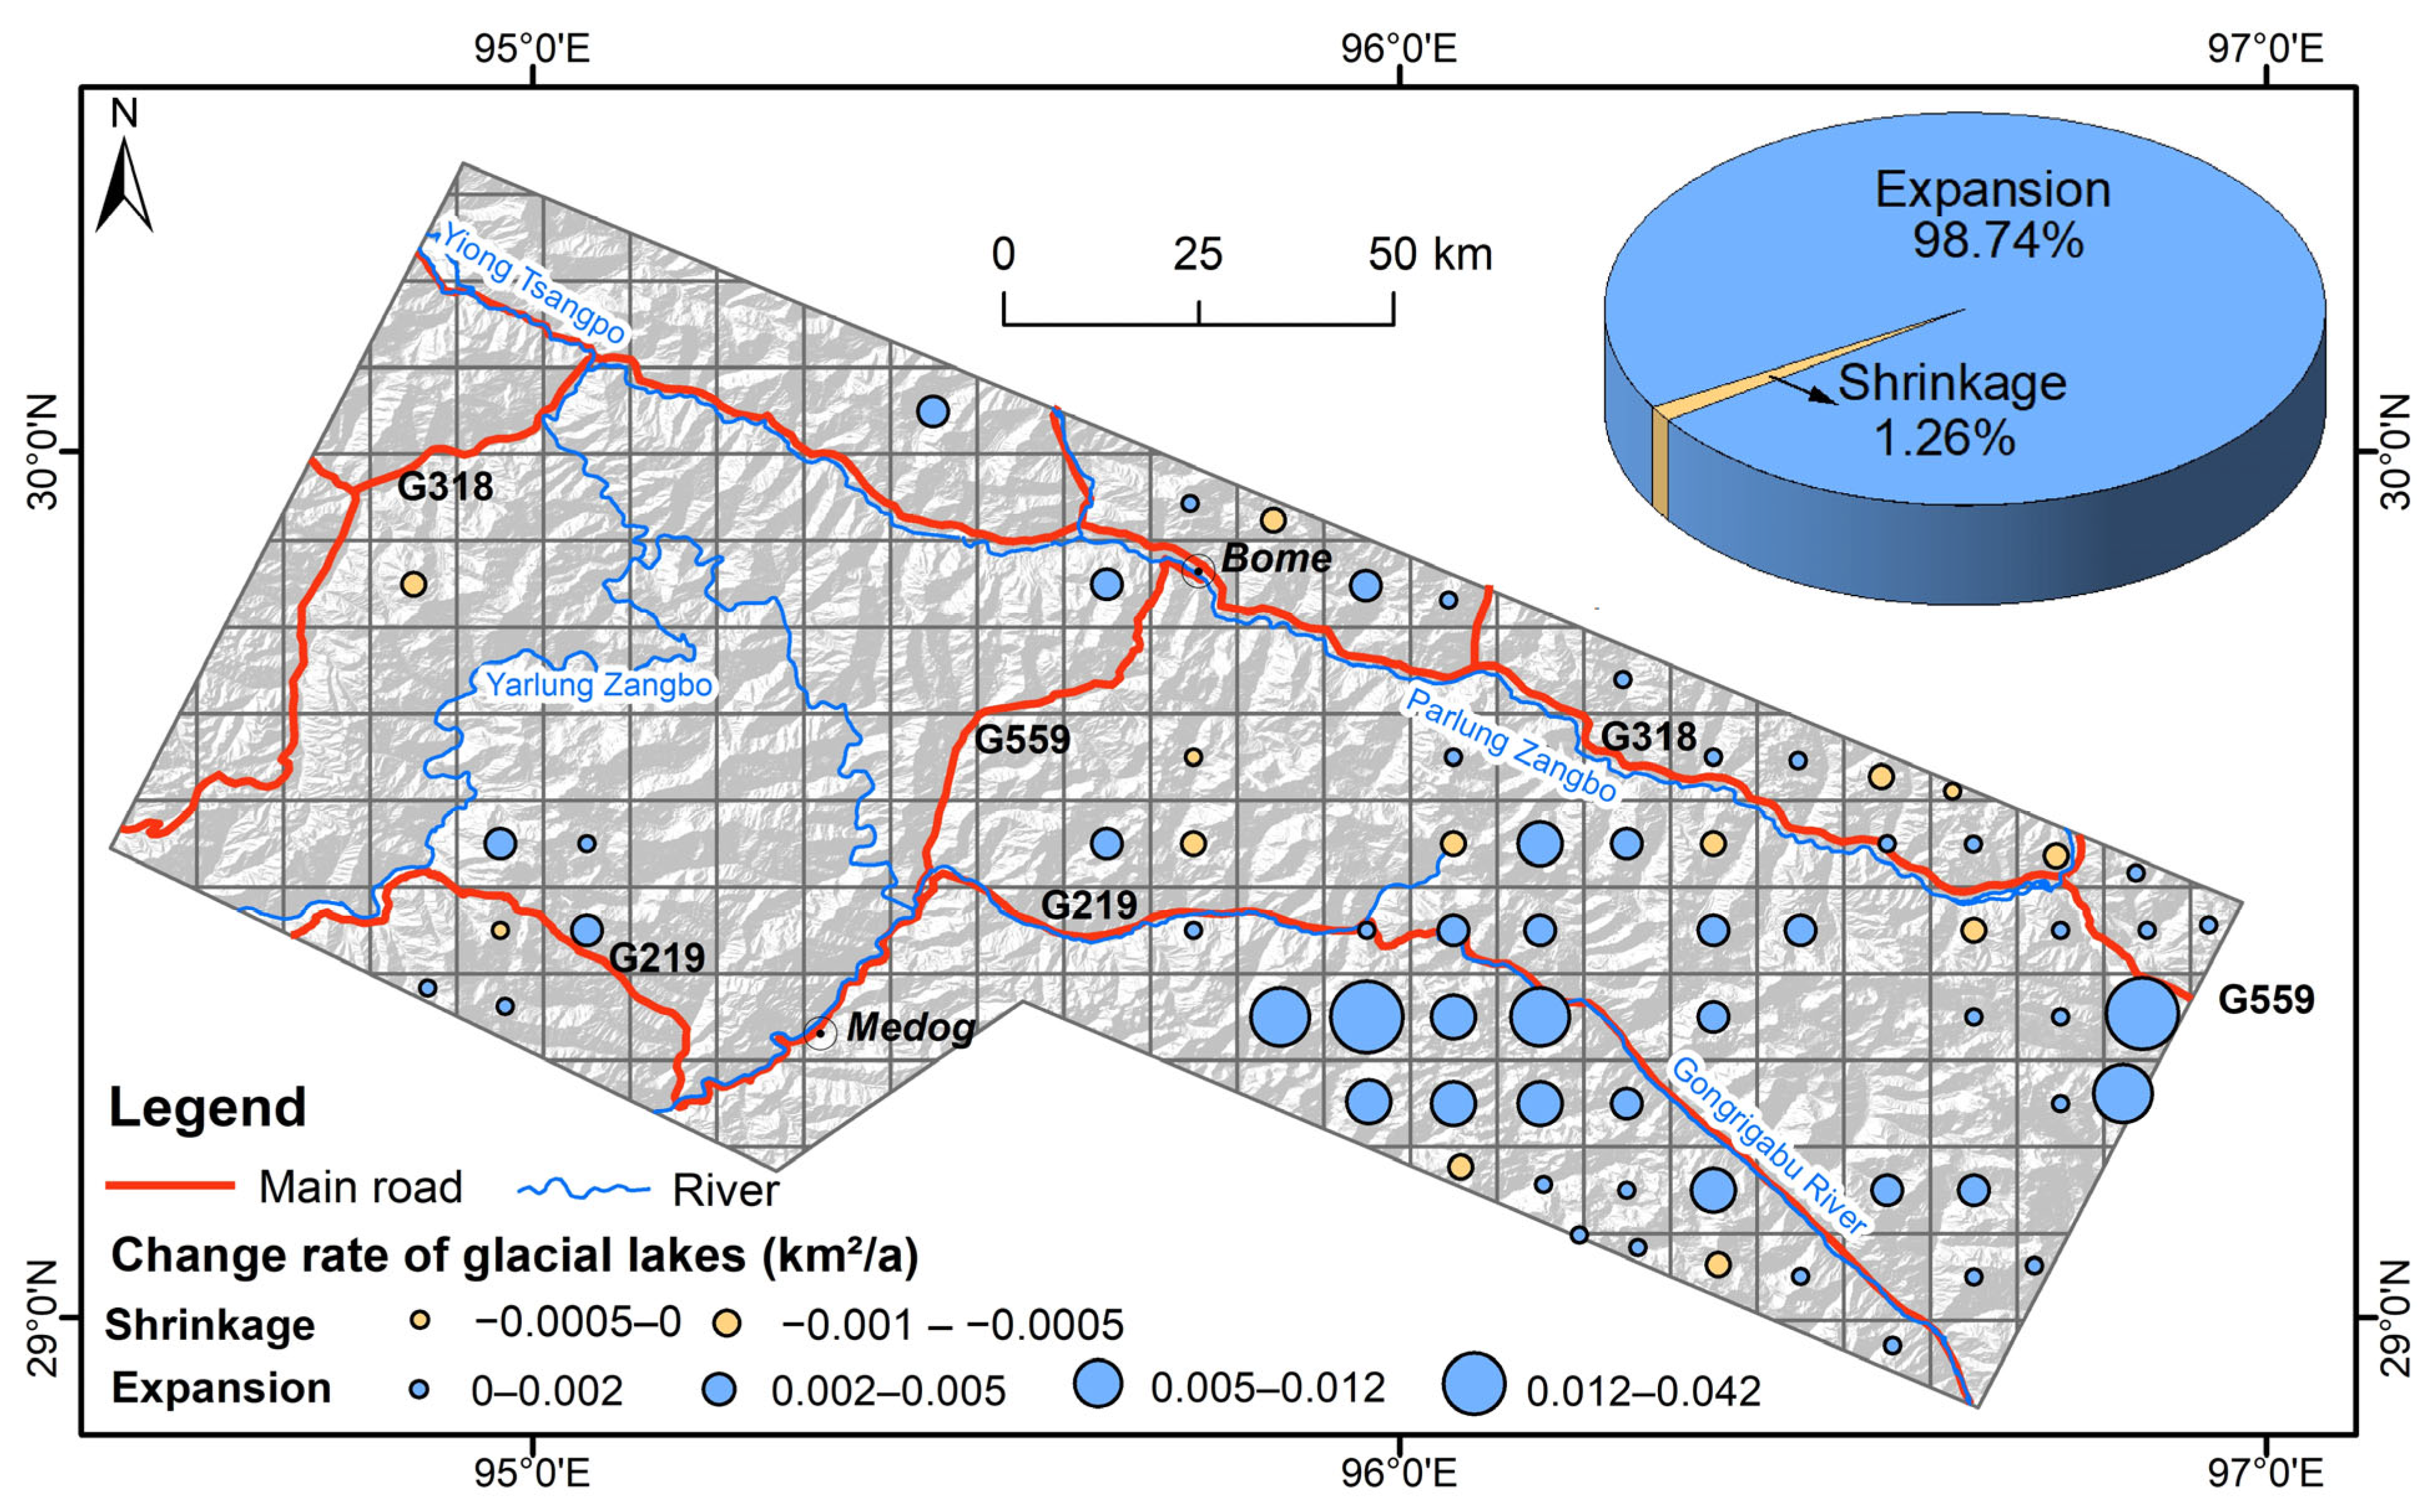
Spatial analysis reveals that the majority of glacial lakes in the study area, comprising 147 pre-existing lakes and 74 newly formed lakes, underwent expansion to varying degrees between 1990 and 2020, with their area changes representing 98.74% of the total change (Figure 6). In contrast, only 36 lakes are experiencing a reduction in area, which accounts for just 1.26% of the total area change. This trend is primarily attributed to two key factors: the loss of glacial mass and the subsequent increase in glacier meltwater [2]. Additionally, there are numerous small glacial lakes in the study area, and changes in their water volume are particularly sensitive to climate change, significantly impacting the overall changes in the total area of glacial lakes in the study area. The expanding glacial lakes are mainly concentrated on both sides of the Gongrigabu River, with the southern side exhibiting a greater rate of expansion.
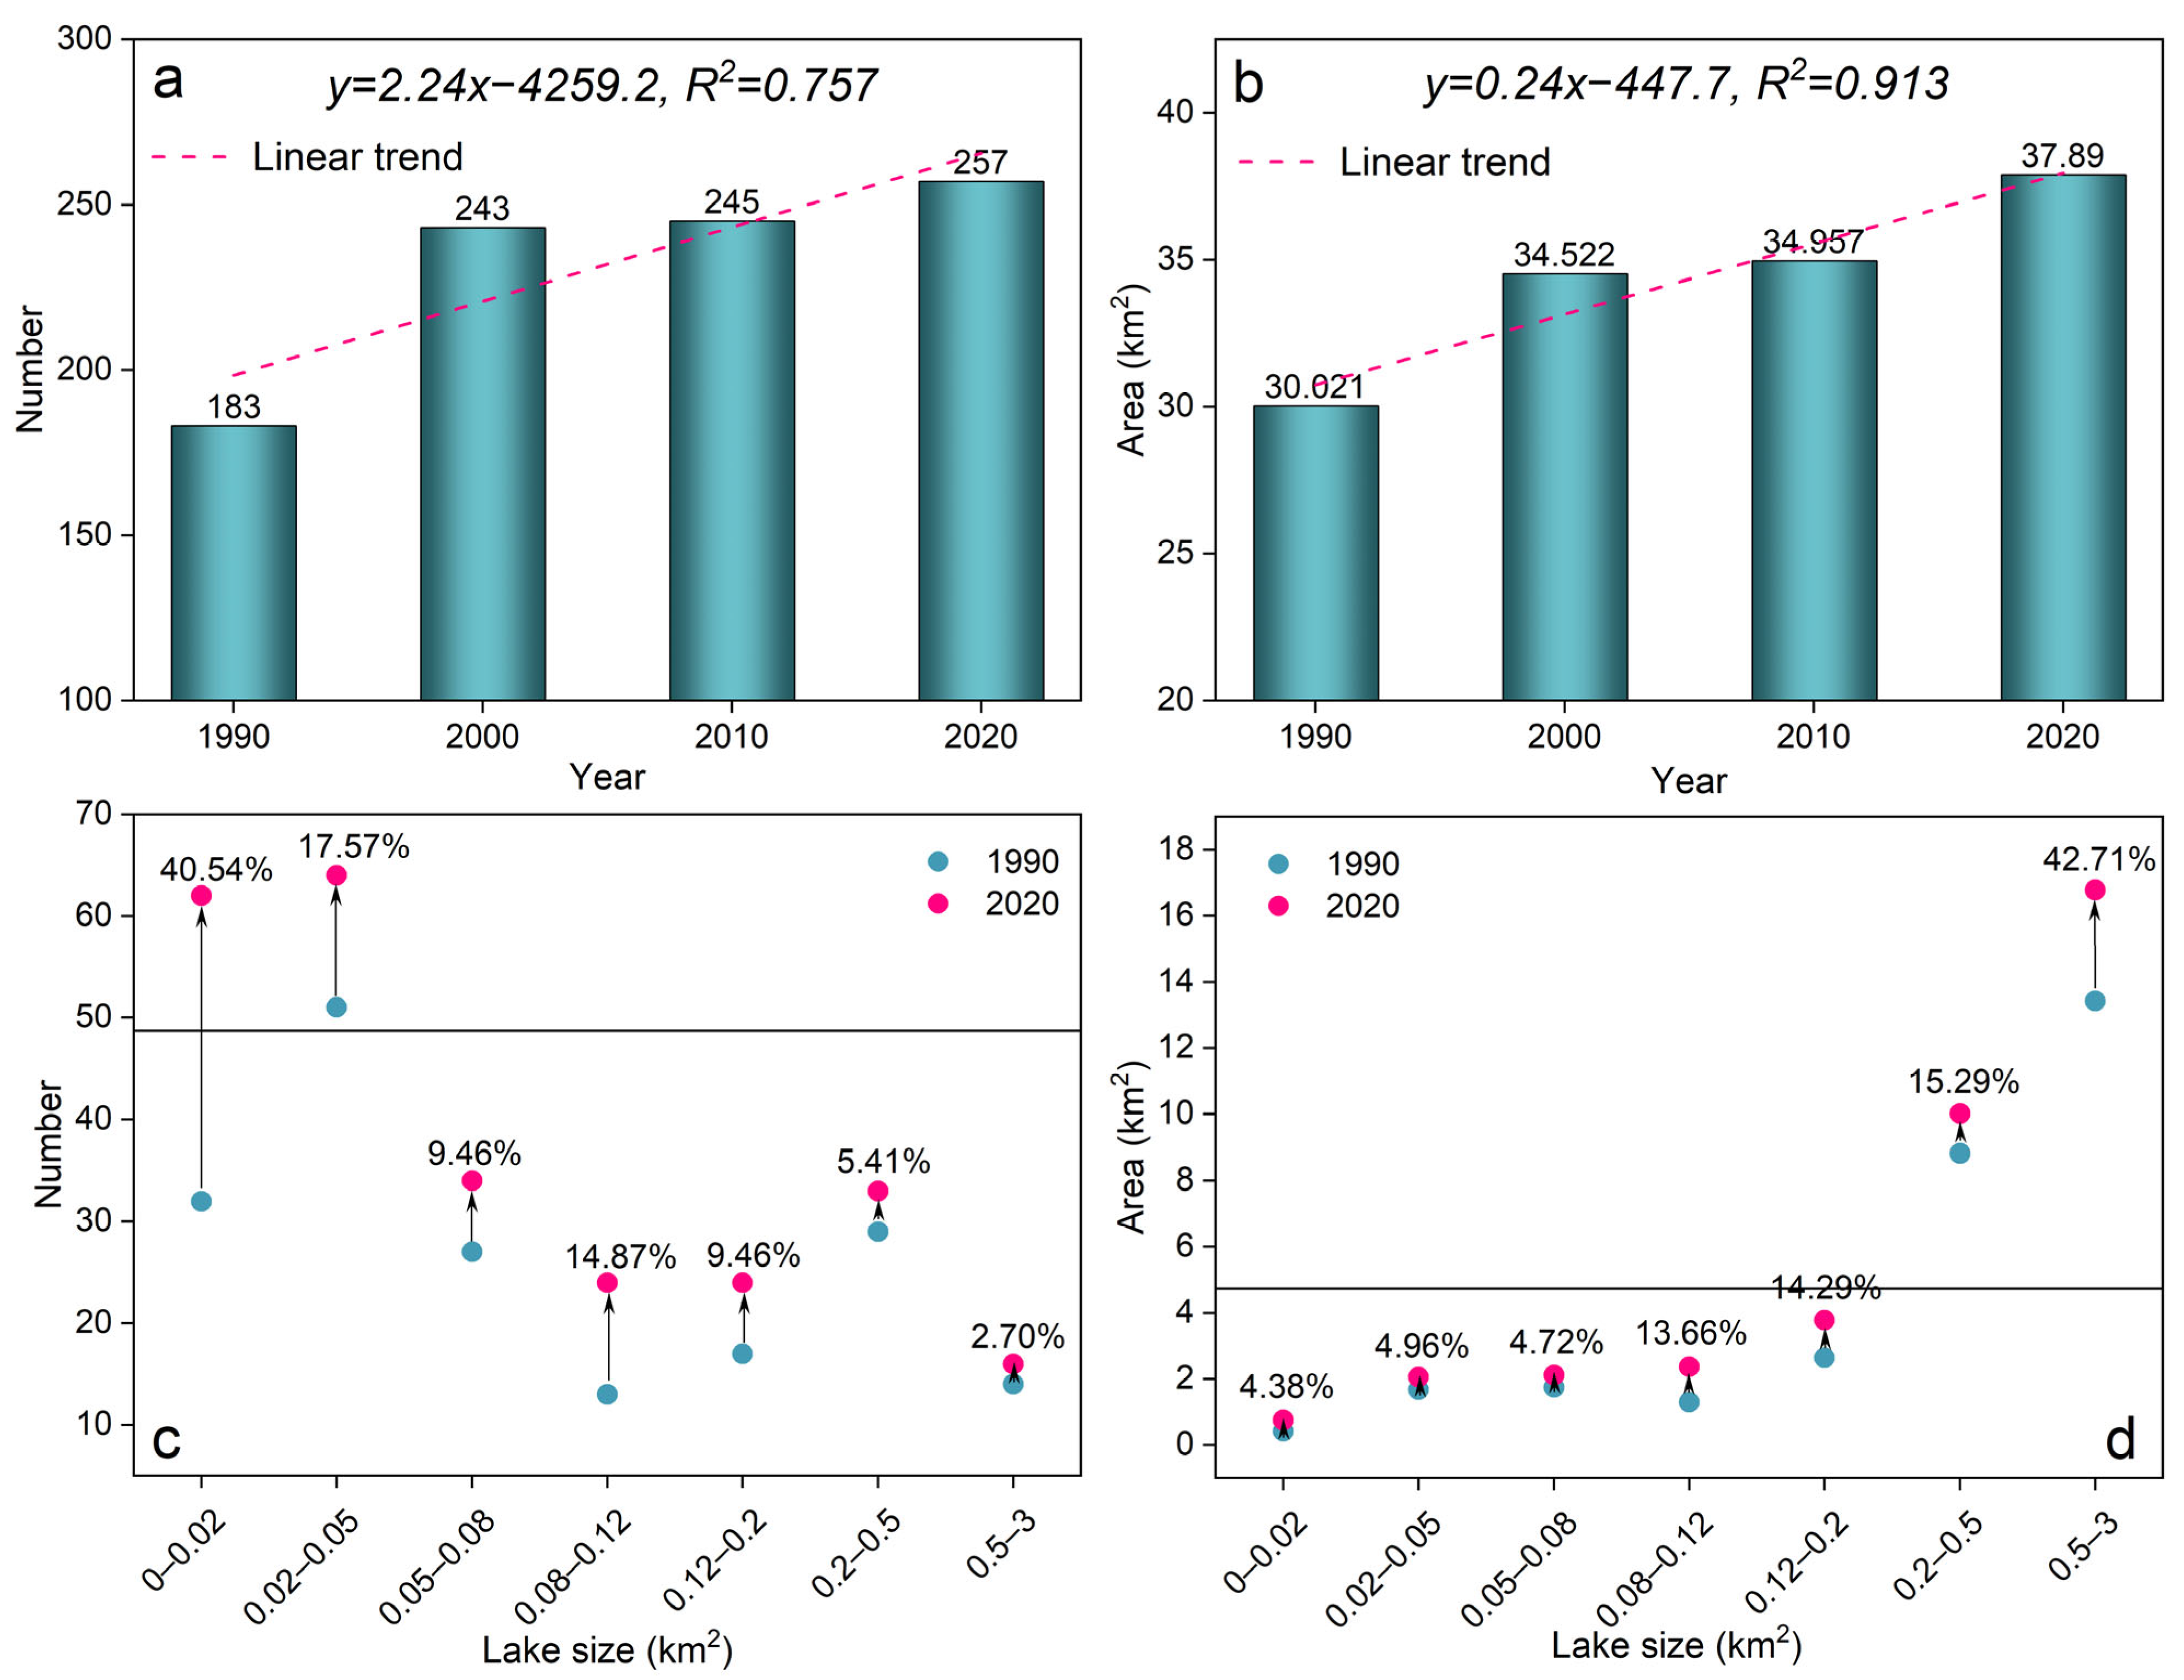
From 1990 to 2020, both the number and area of glacial lakes in the study area showed an increasing trend (Figure 7). The number of glacial lakes increased from 183 to 257, with an average rate of 2.47 lakes per year over the 30-year period (Figure 7a), while the total area increased from 30.021 km2 to 37.89 km2, with an average rate of 0.26 km2 per year (Figure 7b). The linear-fitted trends across the four epochs are 2.24 lakes/yr (R2 = 0.757) and 0.24 km2/yr (R2 = 0.913), as shown in Figure 7. Our findings indicate that the number and area of glacial lakes across various size categories in the study area demonstrate a significant upward trend. Small glacial lakes (<0.02 km2) experienced the largest increase in number; however, their contribution to the overall expansion area of glacial lakes is only 4.38% (Figure 7c). In contrast, large glacial lakes (>0.5 km2) showed the smallest increase in number, yet they contributed as much as 42.71% to the overall expansion area of glacial lakes (Figure 7d).

3.2. Potential GLOF Risks of Glacial Lakes

3.2.1. Spatial Distribution of GLOF-Susceptible Lakes

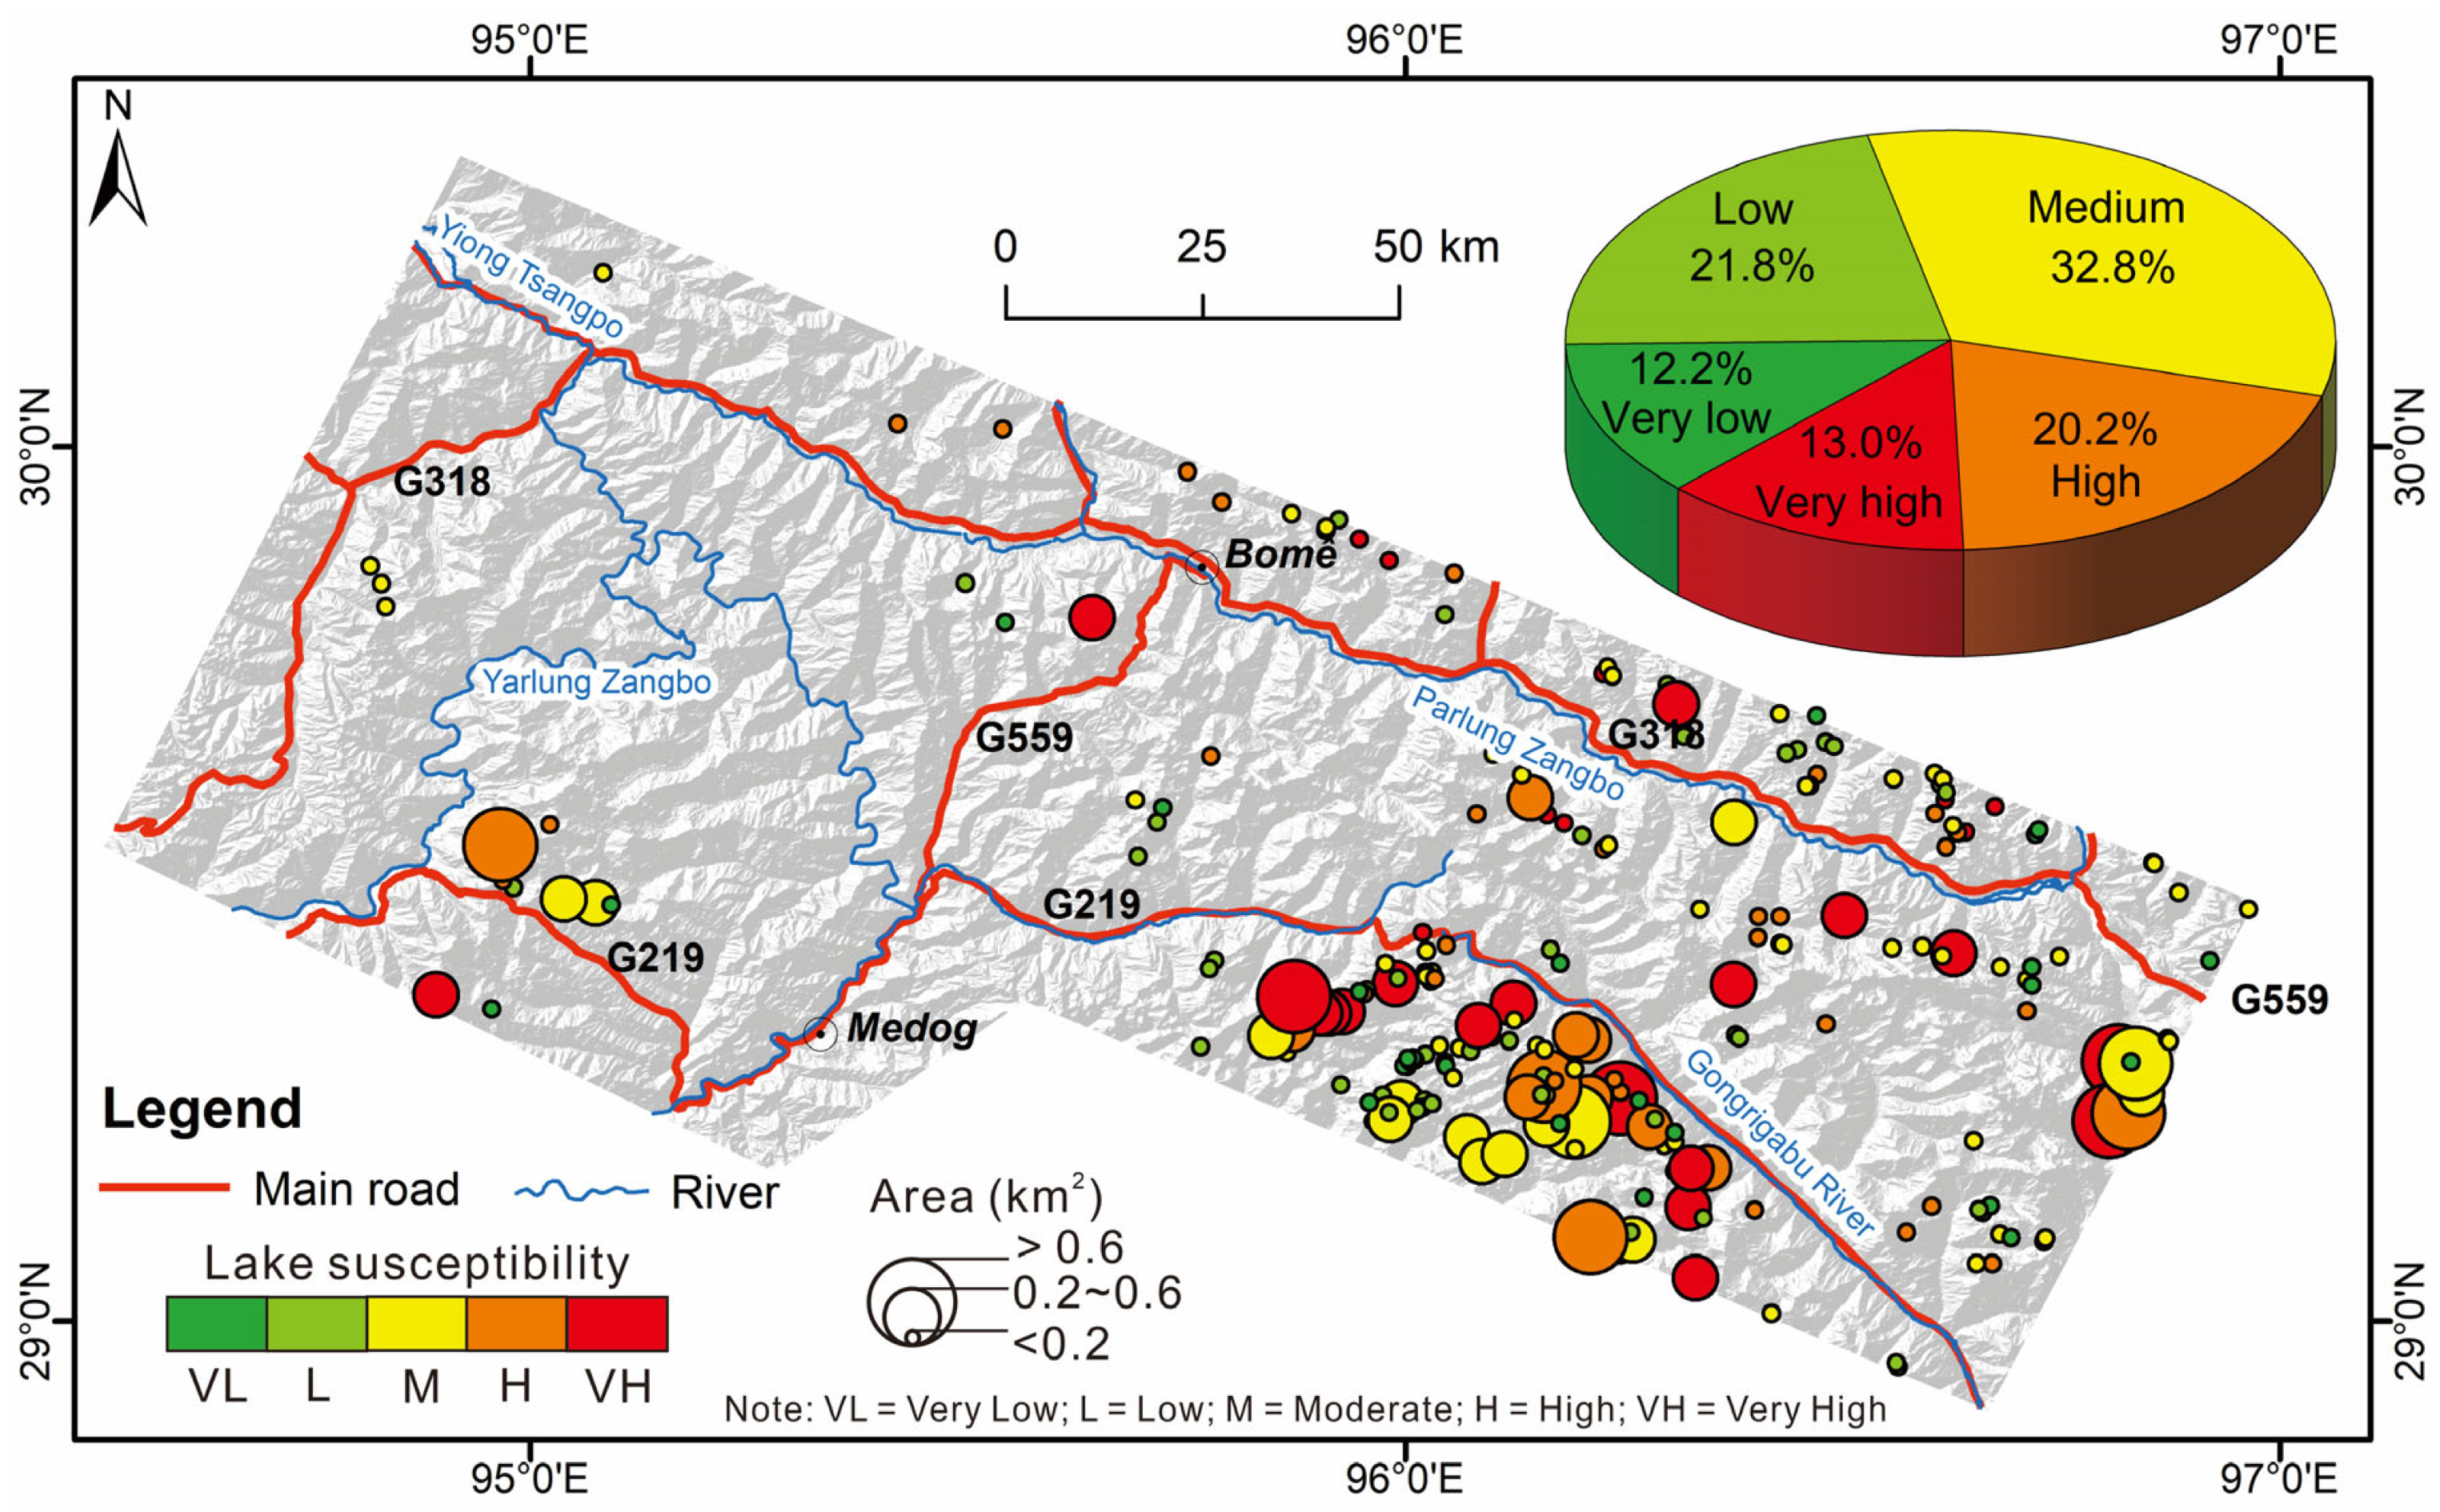
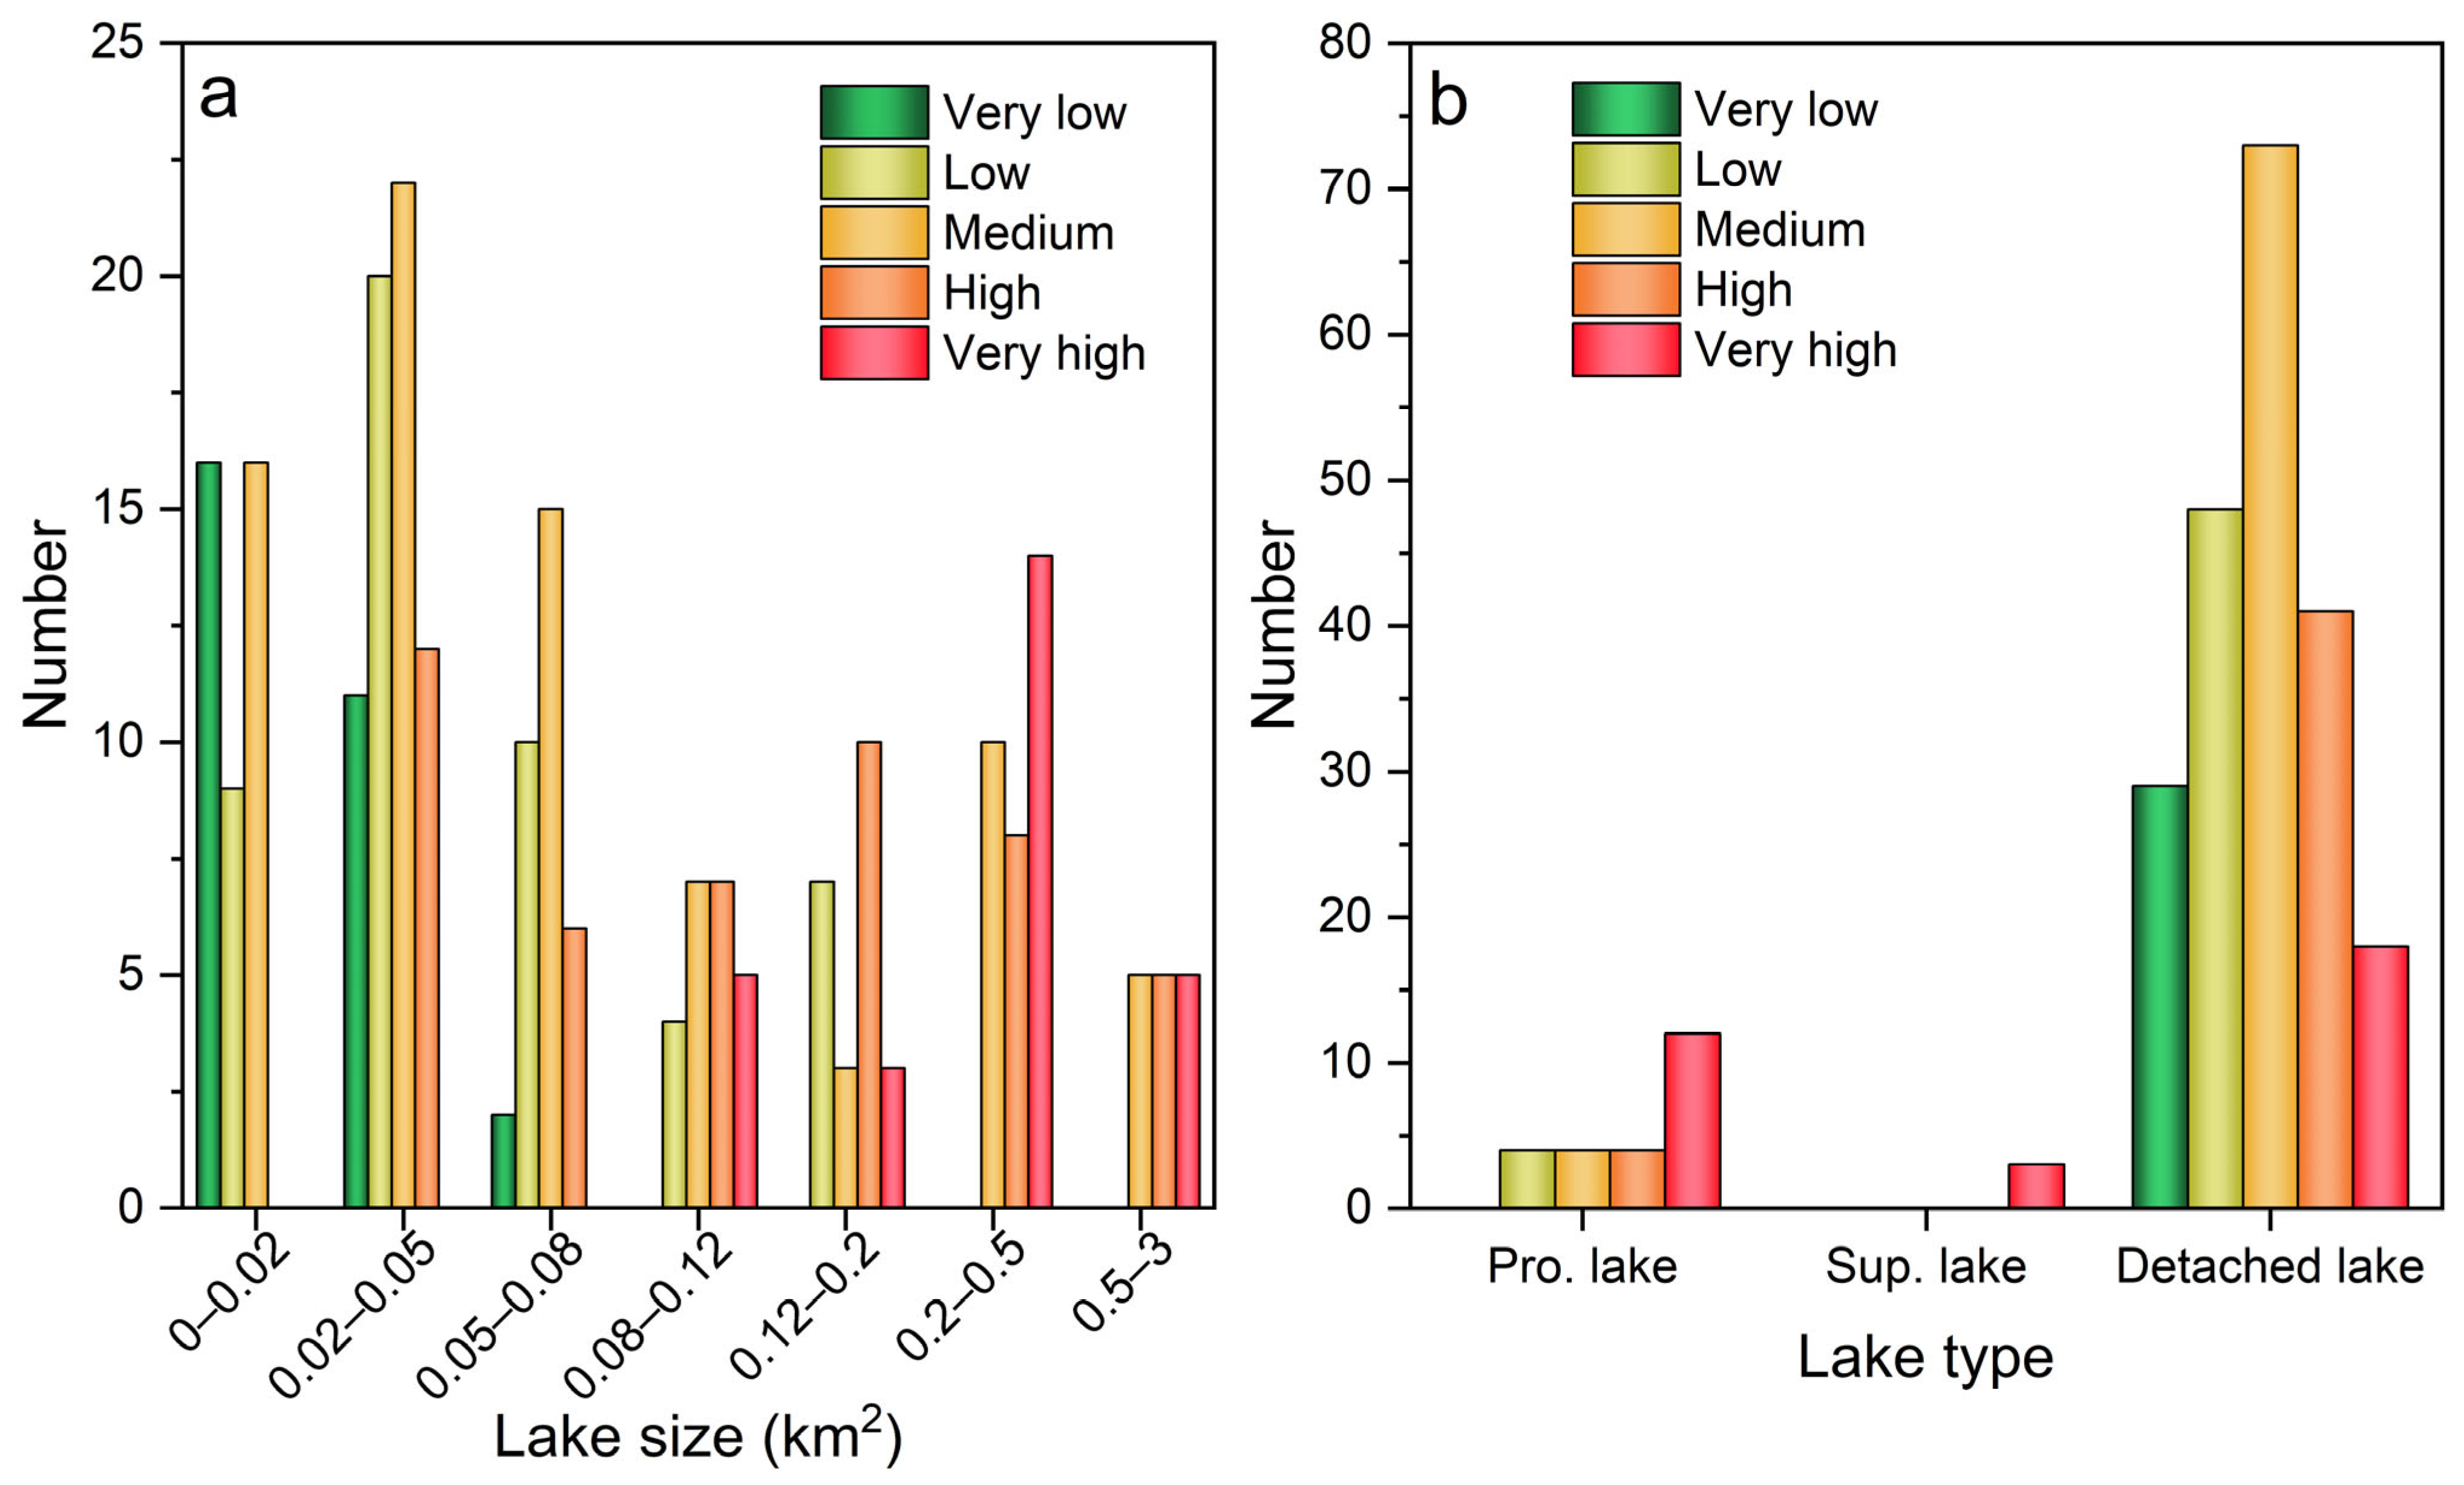
This study evaluated the susceptibility of 238 glacial lakes with areas greater than 0.01 km2 in the study area, with the results presented in Figure 8. It was found that glacial lakes classified as having high and very high GLOF susceptibility (Table S3) are located on both sides of the Parlung Tsangpo and Gongrigabu Rivers, with a total area of approximately 24.35 km2. Additionally, there are 29, 52, 78, 48, and 31 lakes categorized as having very low, low, moderate, high, and very high GLOF susceptibility, respectively (Figure 9a). Notably, the 31 glacial lakes classified as having very high susceptibility range in area from 0.08 km2 to 3 km2. Among the 79 lakes assessed as having high and very high GLOF susceptibility, 50 are detached lakes, 17 are proglacial lakes, and 2 are supraglacial lakes (Figure 9b).

3.2.2. Spatiotemporal Variation of Very Highly Susceptible GLOF Lakes

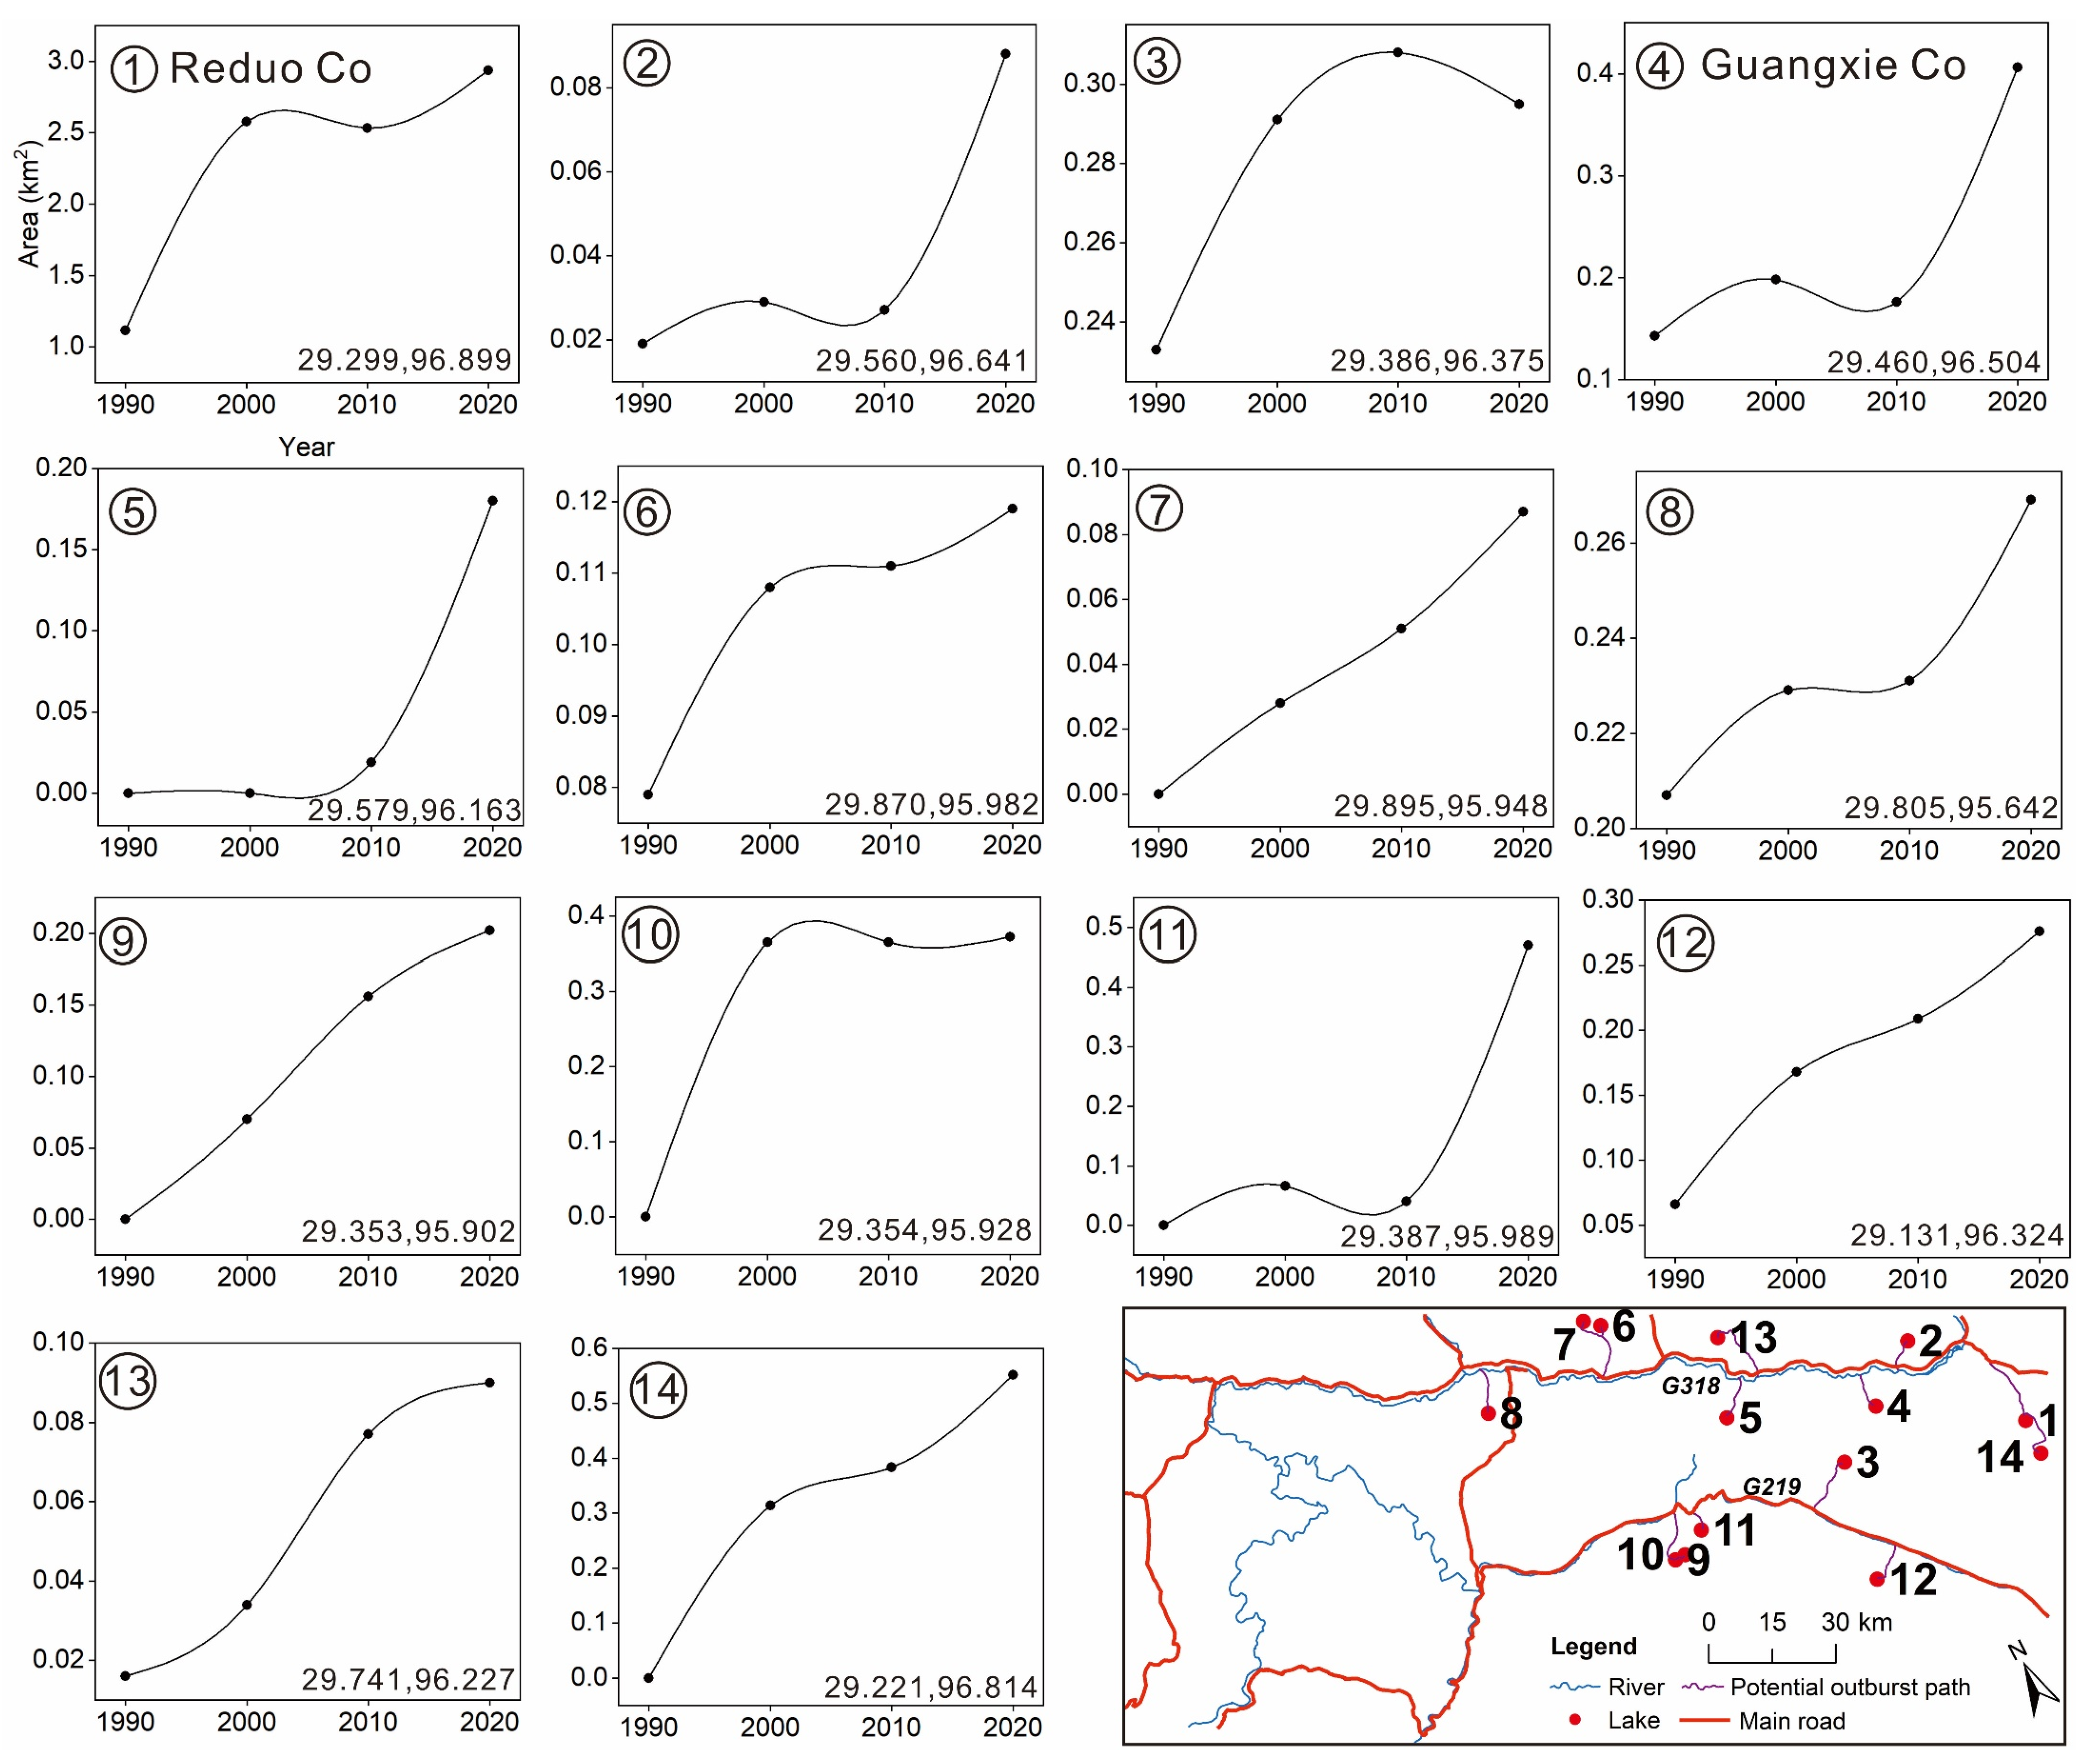
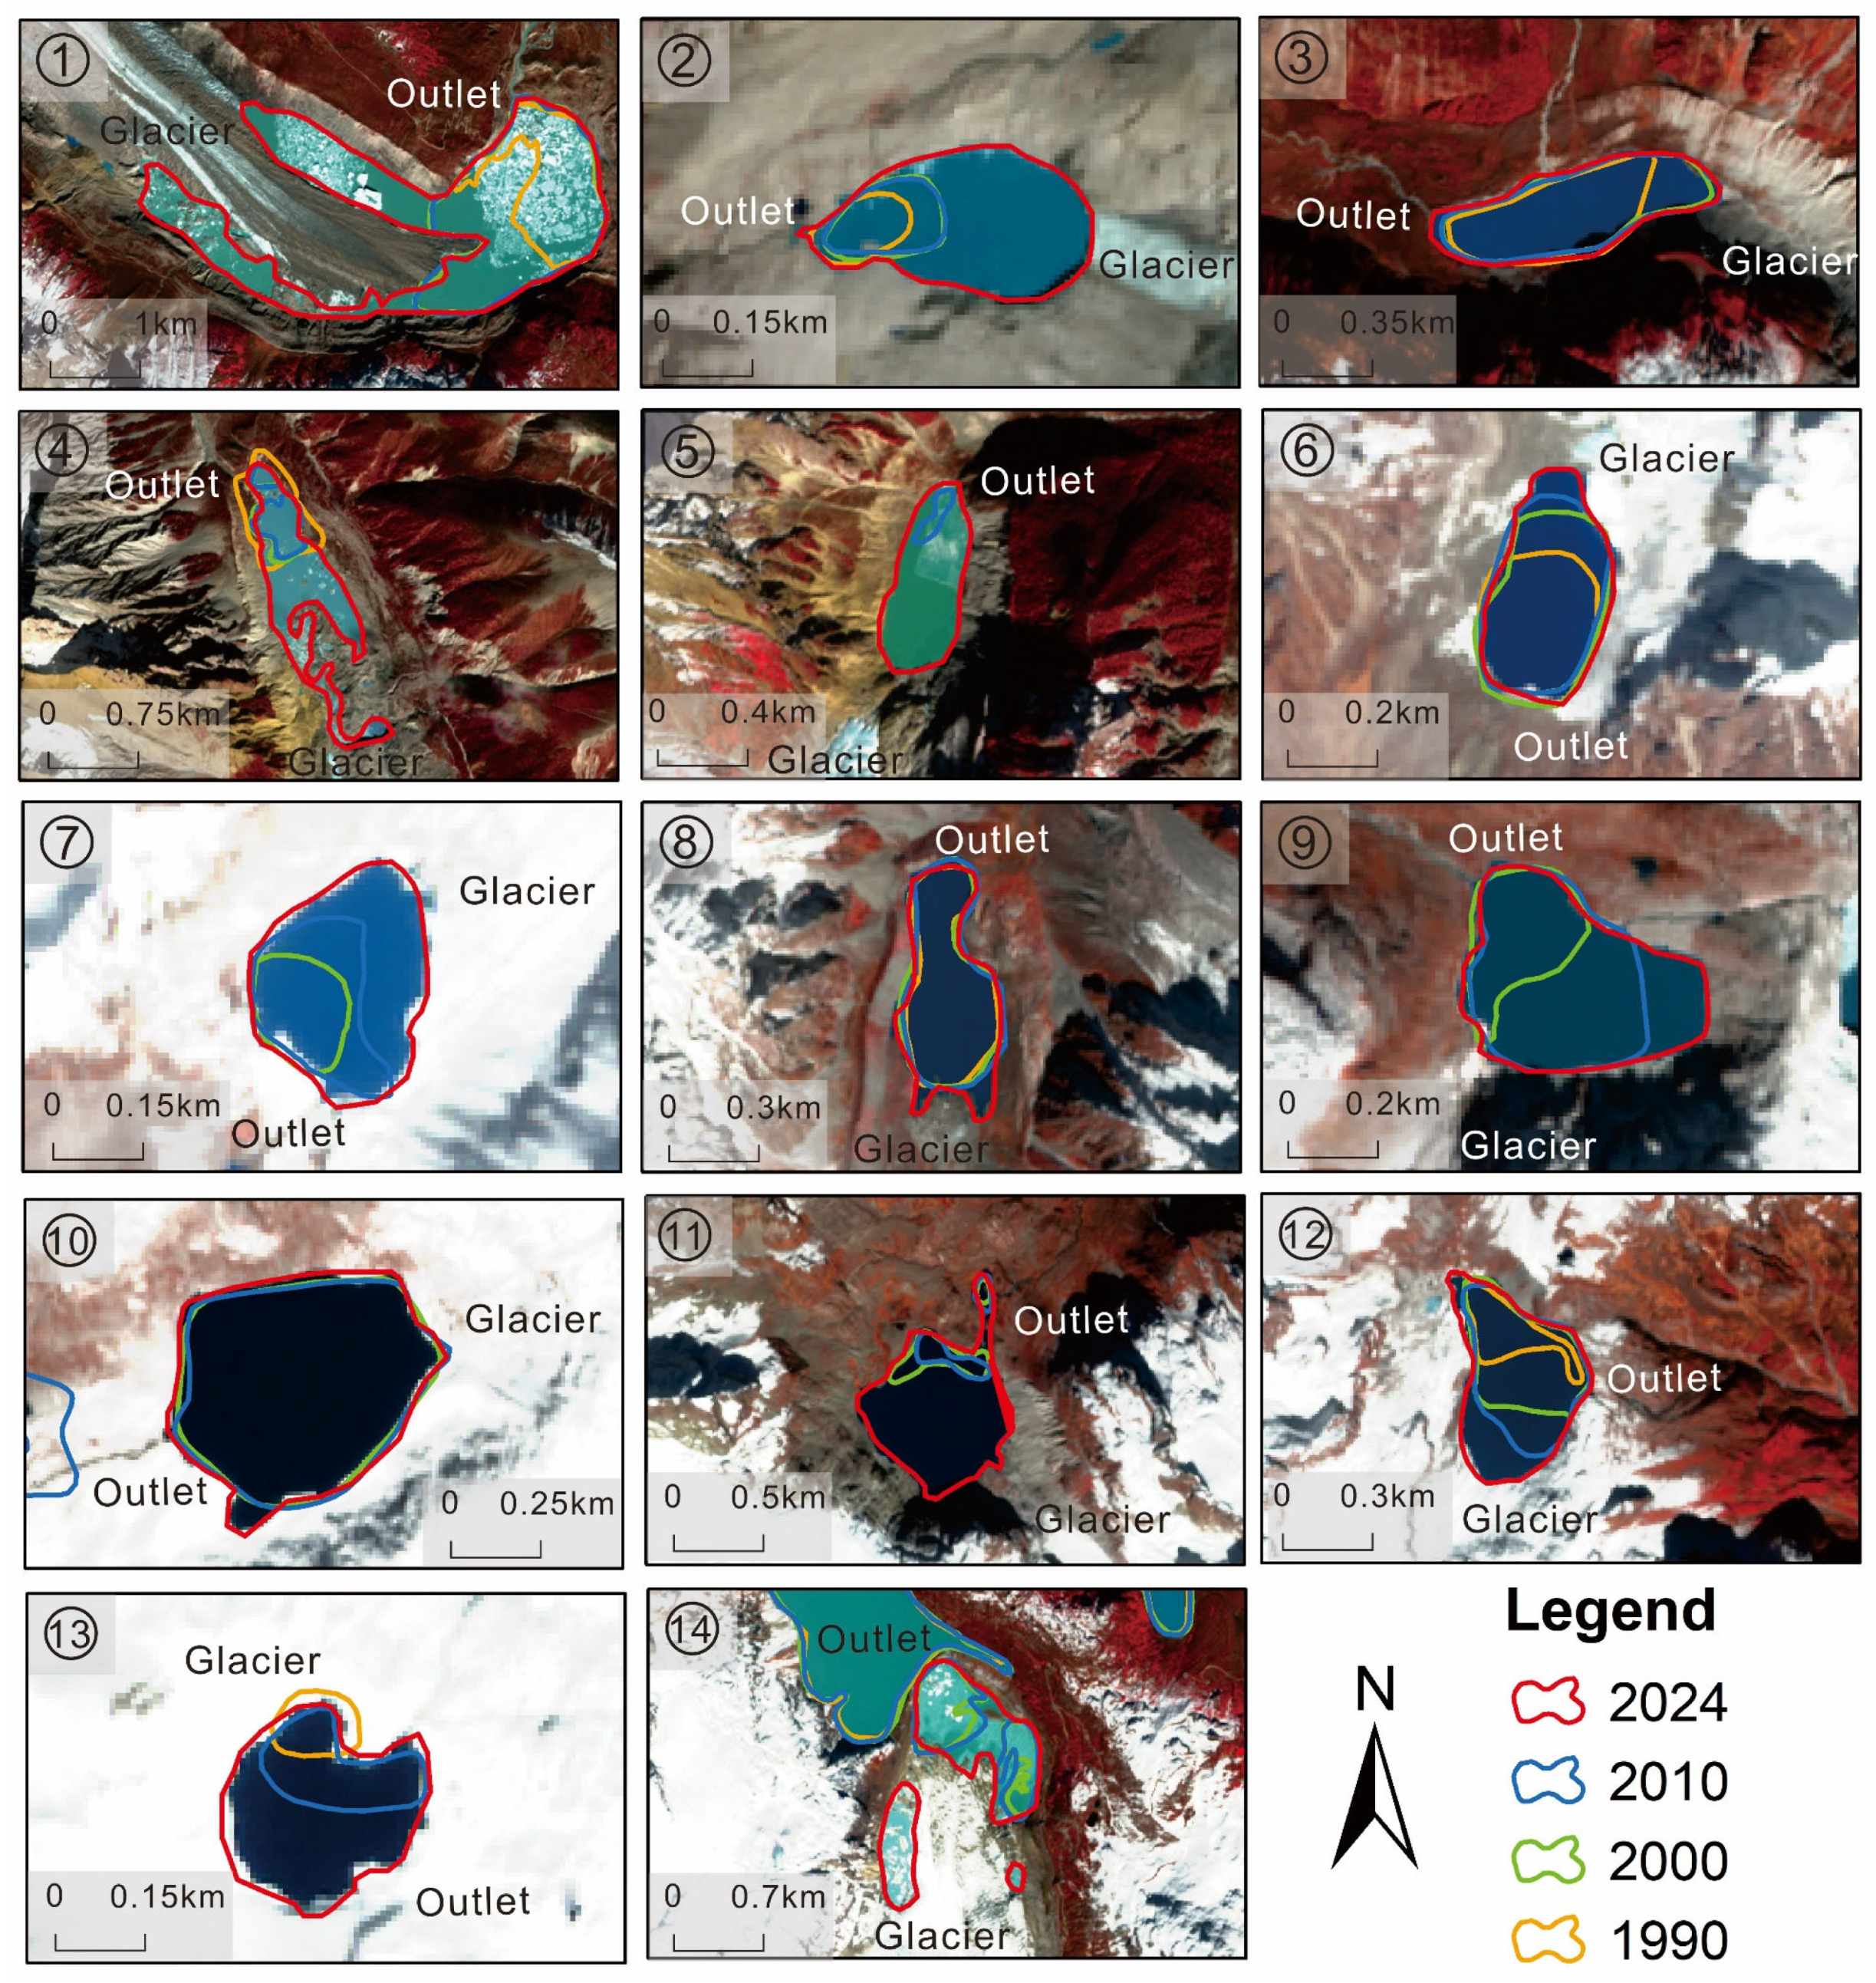
After comparing the expansion rates of the 31 glacial lakes with very high GLOF susceptibility, we selected 14 lakes with relatively high expansion rates for further analysis. The outflow and potential outburst paths of all these lakes ultimately converge into National Highways G318 and G219 (Figure 10). Most of these glacial lakes are steadily expanding, with 10 of them exhibiting exponential growth; only Lakes 3 and 10 have shown a significant slowdown in area after 2000 (Figure 10 and Figure 11). Lake 14 is expanding at the fastest rate of approximately 0.018 km2/a, marking the largest absolute increase in area. Lakes 5, 7, 9, 10, 11, and 14 were formed between 1990 and 2000, and these newly formed glacial lakes have a faster expansion rate compared to those that have existed for a longer period. Lakes 2, 4, 11, and 12 have the shortest outflow paths (7–10 km) to the major transportation routes, while Lakes 1 and 14 have the longest outflow paths, measuring 14 km.

3.2.3. Detailed Analysis of GLOF-Susceptible Lakes

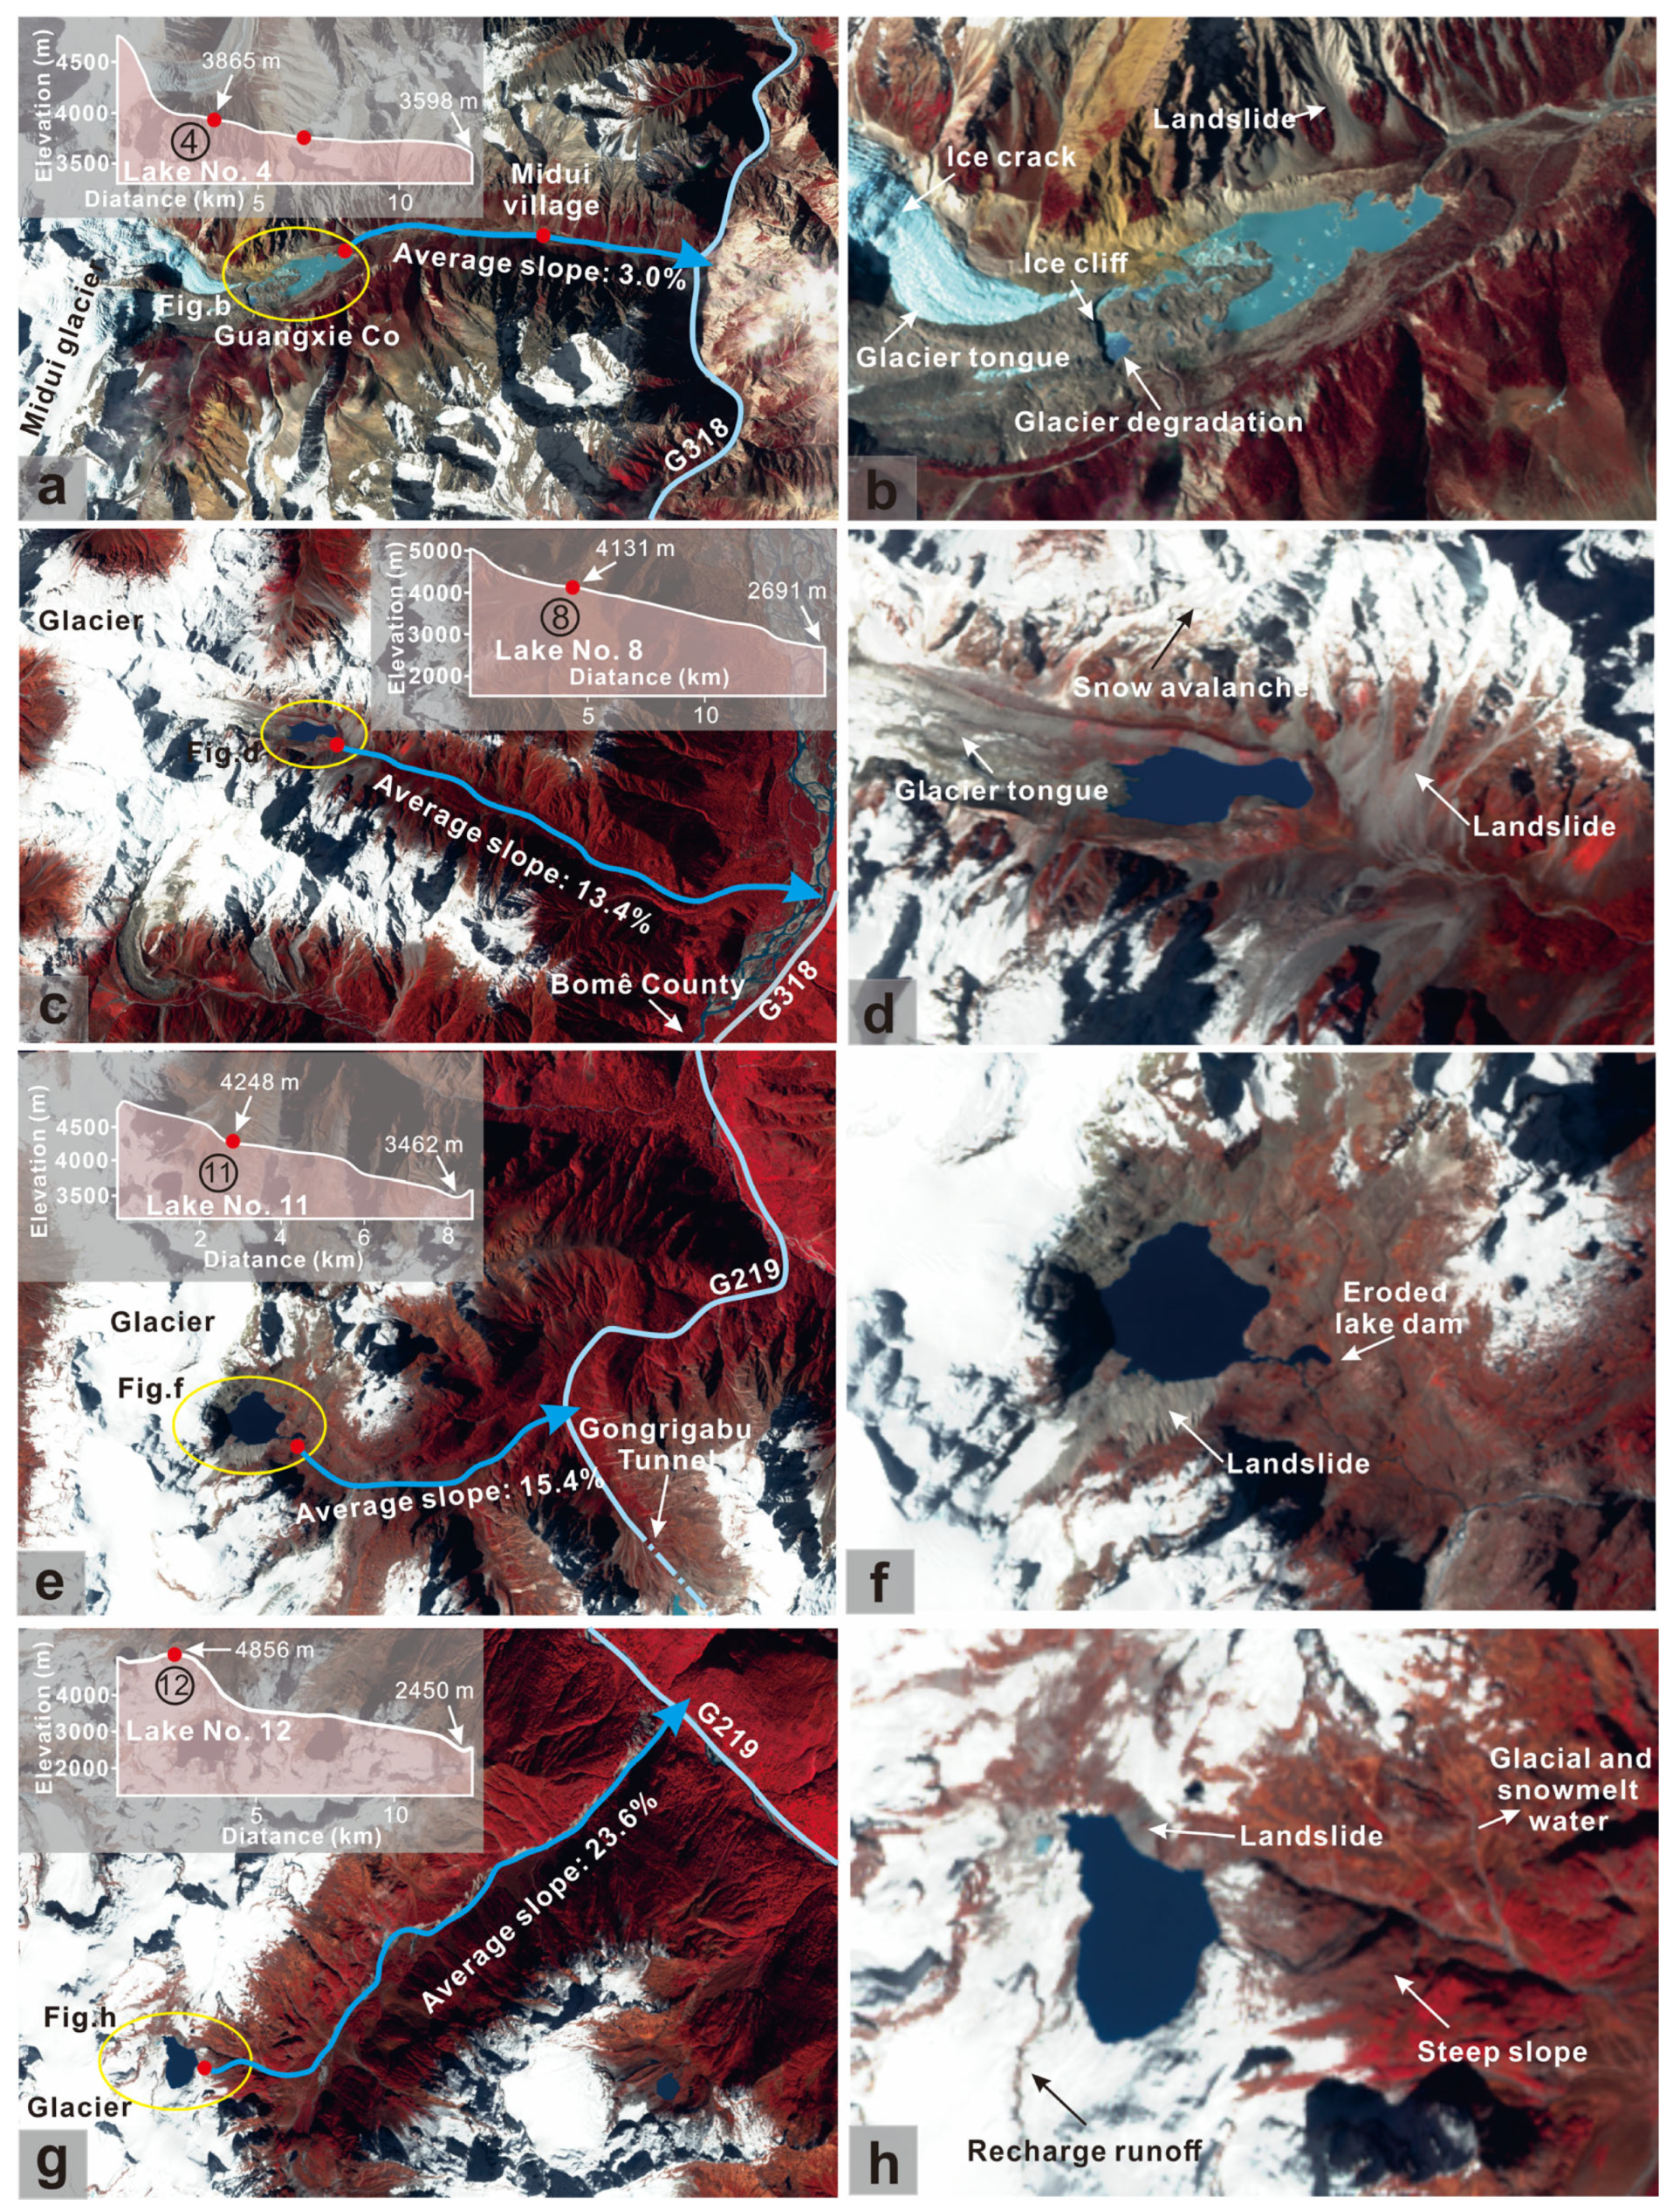
Combining the results of the GLOF susceptibility assessment for glacial lakes with potential outburst pathways, we identified a total of 35 lakes in the study area that pose a threat to transportation routes due to GLOFs, including 21 lakes at high and 14 lakes at very high susceptibility levels (Table S4). All of these lakes are located within 18 km of the roads, potentially threatening the safety of both roads and pedestrians. To assess potential threats to transportation infrastructure and inform future risk mitigation, we prioritized four glacial lakes for detailed analysis (Figure 12).
The flood pathway of Lake 4, Guangxie Co, is approximately 8 km long and passes through Midui Village. The elevation of the lake decreases from 3865 m to 3598 m, with an average slope of 3.0% (Figure 12a). There are significant crack zones in the tongue of the parent glacier of Guangxie Co, indicating that it is being subjected to compressive forces from above (Figure 12b). The Midui Glacier is experiencing severe retreat, and the ice cliffs at its front exhibit signs of ice collapse. Additionally, there are landslides present on both sides of the lake. These factors make the lake highly susceptible to flooding in the future. On 15 July 1988, rockfall and avalanche debris entered Guangxie Co, generating waves of approximately 5 m in height, which triggered an outburst flood. This disaster resulted in the deaths of five people, the destruction of 51 houses, and the devastation of a 6.7-hectare farm. In recent years, the area of Guangxie Co has rapidly expanded due to the retreat of the Midui Glacier (Figure 10 and Figure 11), making it highly likely that severe GLOF disasters will continue to occur in the future.
The average slope of the runoff of Lake 8 is 13.4%, with a significant elevation drop of approximately 1440 m (Figure 12c). Its outlet is located near the city of Bomi, allowing floodwaters to flow directly toward National Highway G318. The lake is directly connected to the glacier tongue of the parent glacier, which supplies water to the glacial lake (Figure 12d). Remote sensing image analysis indicates that avalanches are occurring upstream of the lake, and there are active landslides on both sides of the morainic dam.
Lake 11 is the closest to National Highway G219, located approximately 5 km away, with an average slope of 15.4% (Figure 12e). Additionally, landslide activity around the glacial lake is prominent, and the dam of the glacial lake has been increasingly eroded in recent years (Figure 12f). There is a high likelihood of GLOF disasters occurring in the future, necessitating close monitoring.
Lake 12 is located approximately 10 km from National Highway G219 and features the steepest runoff, with an average slope of about 23.6% (Figure 12g). The slope of the glacial lake dam is particularly steep, with local slopes reaching up to 45° (Figure 12h). This may increase the speed of flooding, thereby amplifying the destructive extent of GLOF disasters. Additionally, the surrounding geological structure of Lake 12 is indicated to be unstable, and the parent glacier provides ample supply to the glacial lake (Figure 12h).

4. Discussion

4.1. Comparison of the Glacial Lake Susceptibility Assessment with Previous Studies

Validating GLOF susceptibility assessments remains challenging due to the complex and stochastic nature of GLOF triggers [30,43,59]. Nevertheless, to test the performance of our assessment framework, we back-tested it against historically documented GLOF lakes within the study area. The results show that Guangxie Co, Lumu Co, and Anjue Zhuqulong glacial lakes were all classified as having “very high” susceptibility, while Zhuxigou glacial Lake was classified as having “high” susceptibility. All documented historical outburst lakes were correctly rated as having either “high” or “very high” susceptibility, supporting the capability of our framework to distinguish lakes prone to outburst. Since these lakes are among the 12 historical events used to construct the indicator system, this validation remains a back-testing exercise rather than an independent validation. The results merely indicate internal consistency of the assessment framework and are insufficient to robustly validate its predictive capability. A rigorous leave-one-out cross-validation awaits the accumulation of more GLOF records in the region, which we identify as a direction for future research. In addition, assessment indicators and methods inevitably vary across studies due to regional differences [32,43,54]. Nonetheless, two previous GLOF susceptibility assessments partially overlap with our study area, and comparing our results with these studies provides a more comprehensive regional perspective on GLOF risks.
In the study area of this paper, only six glacial lakes were assessed as having high and very high GLOF susceptibility according to the results of [60], whereas our research identified 48 and 31 lakes in those categories, respectively. The significant difference in results can be attributed to the varying scales of the study areas. The authors of [60] conducted their research at the scale of the entire Tibetan Plateau, leading to discrepancies in the quantity of assessed glacial lakes but not in their susceptibility classification. For instance, the six glacial lakes rated as having high and very high susceptibility in their study were all classified as having very high susceptibility in our analysis. Additionally, the study by [54] examined glacial lake identification and susceptibility assessment along the regional engineering corridor. Within the area overlapping with our study, they identified a total of 30 glacial lakes with high or very high susceptibility. Of these, 24 were also classified as having high or very high susceptibility in our study, indicating a high level of agreement (consistency is 80%) between the two studies in the overlapping region, which further supports the reliability of our assessment results. It can be observed that the differences in existing studies regarding high and very high GLOF susceptibility primarily stem from discrepancies in the identification of glacial lakes due to inconsistent research scales. In the overlapping regions with [54,60], only 34 and 43 glacial lakes larger than 0.02 km2 were identified, while our detailed localized study identified 157 lakes exceeding that area. Clearly, research conducted at a larger scale inevitably overlooks certain glacial lakes, highlighting the necessity of detailed localized studies.
Among the four typical glacial lakes shown in Figure 11, both previous studies and this research unanimously classify Guangxie Co as a glacial lake with very high susceptibility (Figure 12a,b) [54,60], while the other three lakes have been overlooked in earlier research (Figure 12c–h). Lake 8 is directly connected to the glacier tongue of its parent glacier, and there are active phenomena of avalanches and landslides in the surrounding area. This lake may experience sudden increases in water level due to ice, snow, or rock avalanches, leading to potential outburst events (Figure 12d). Lake 11 shows signs of long-term erosion by flowing water on its dam, which can undermine the dam’s stability in the long run (Figure 12f). Lake 12 is situated at the mountain peak, featuring a steep dam with an average slope of approximately 45° and a maximum slope reaching 55° (Figure 12h). However, it has two potential outburst outlets, which could still pose significant destructive risks despite the steep release slopes. The above analysis supports the assessment of this study. Therefore, it is appropriate to rate the GLOF susceptibility of Lakes 8, 11, and 12, which were previously overlooked by prior studies, as extremely high.

4.2. Possible Causes of Changes in Glacial Lakes

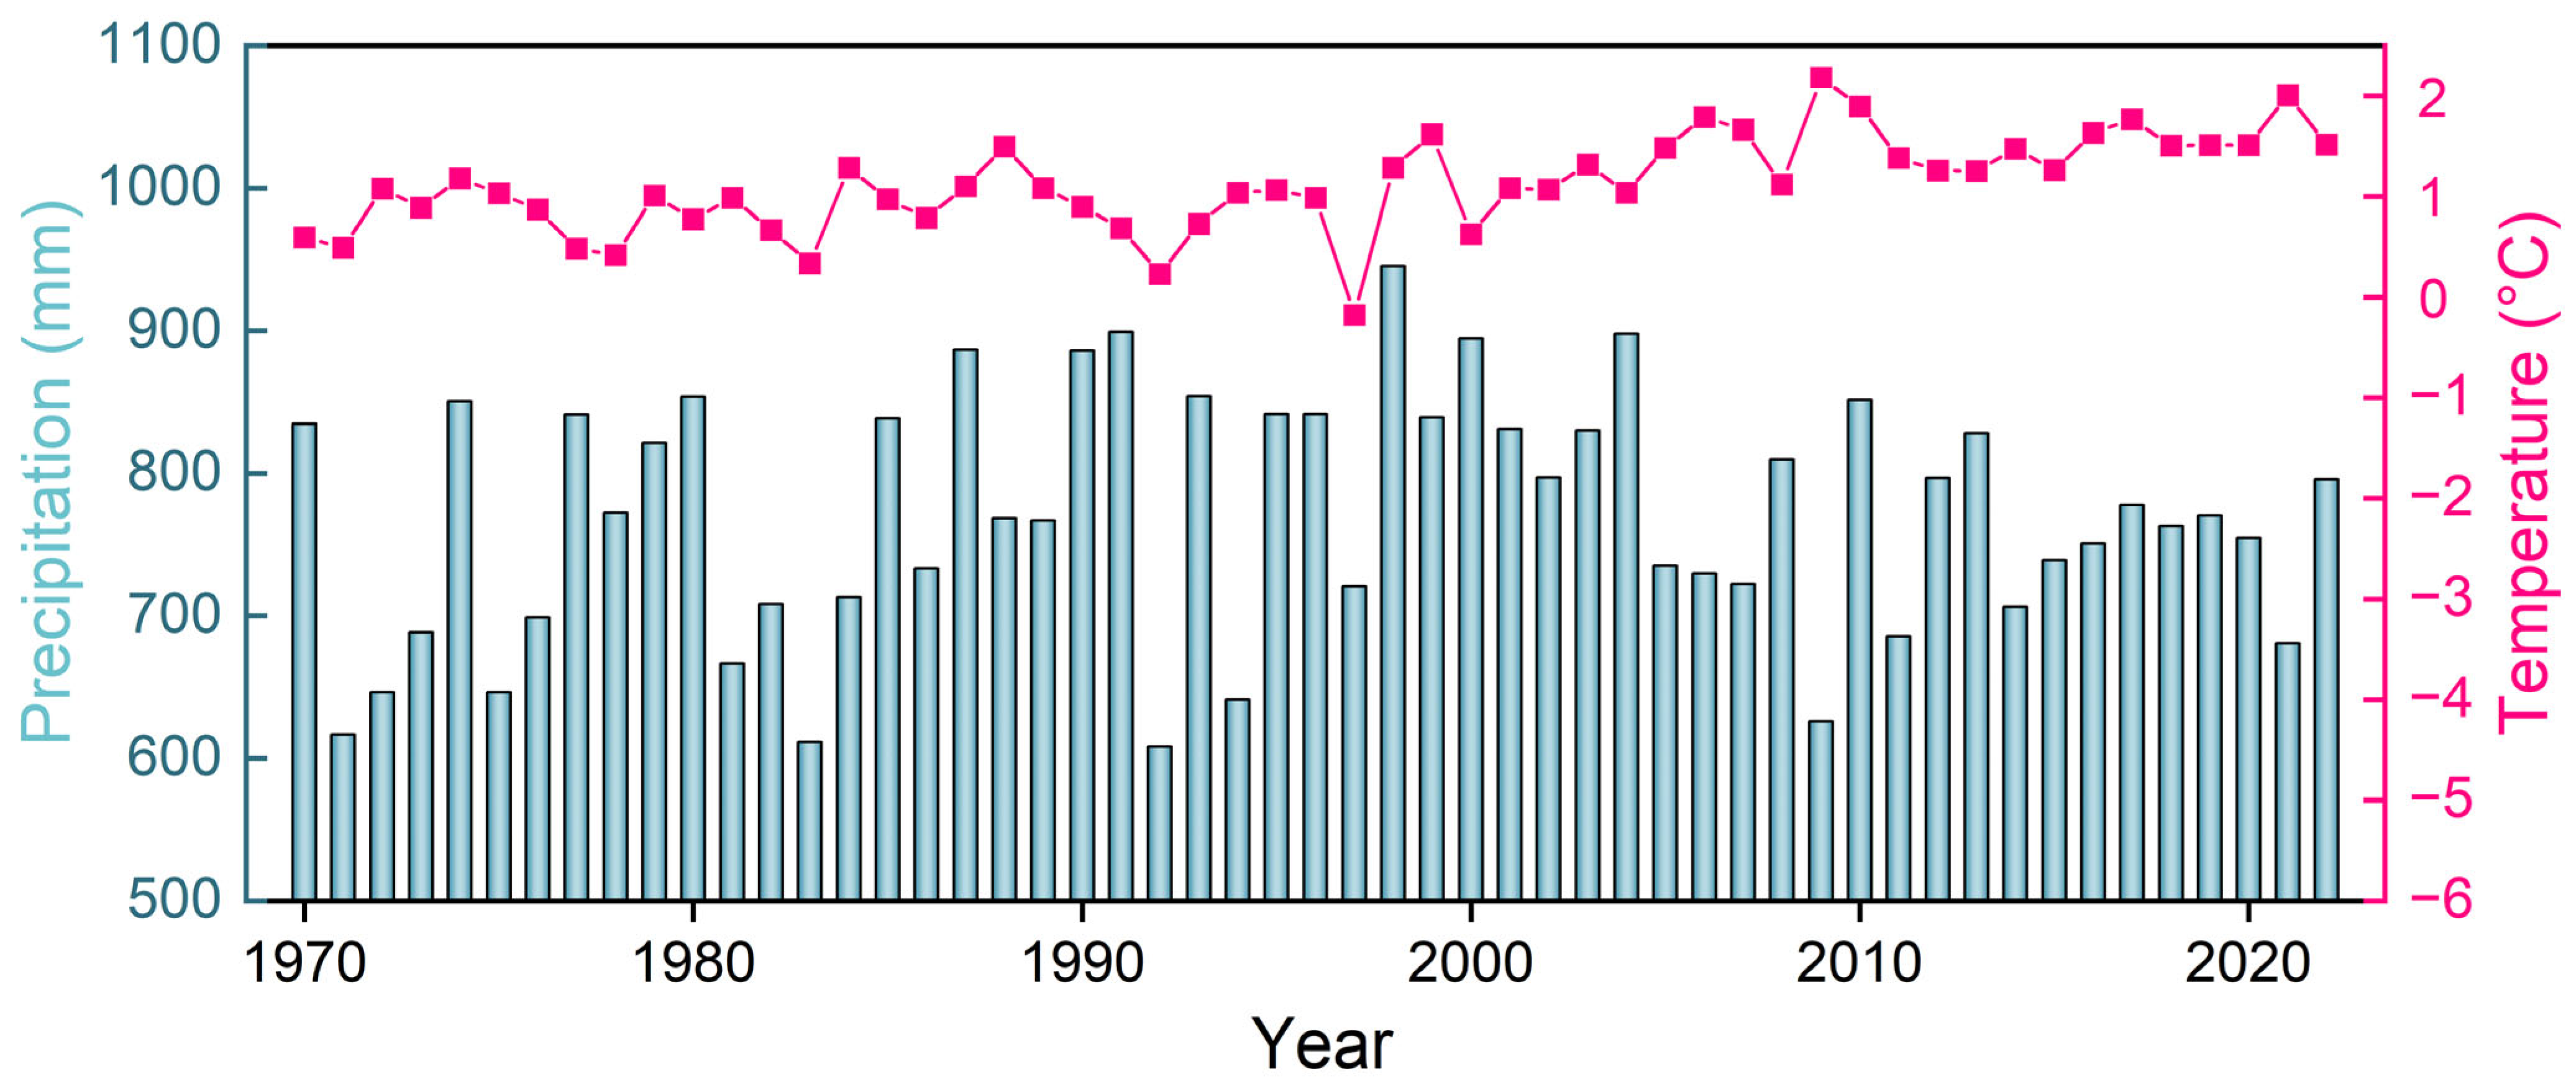
Climate change has been widely recognized as a significant background factor influencing the evolution of glaciers and glacial lakes in the southeastern Tibetan Plateau [23,24,25]. Based on the ECMWF Reanalysis v5 (ERA5), we obtained the annual average temperature evolution process for the study area from 1970 to 2022 (Figure 13). To detect long-term trends in the climatic time series, we employed the Mann–Kendall non-parametric trend test to evaluate statistical significance and the Sen’s Slope estimator to quantify trend magnitudes. The results reveal a highly significant warming trend in air temperature (Z = 6.65, p < 0.001), with a Sen’s Slope of 0.045 °C/yr. In contrast, the precipitation trend does not reach statistical significance (Z = 0.24, p ≥ 0.05), indicating that interannual variability, rather than a long-term directional change, dominates the precipitation regime. Climate change exerts direct influences on the hydrological balance of glacial lakes. The observed lake expansion is primarily attributable to regional warming, which accelerates glacier and snow melt and thereby supplies increased meltwater to glacial lakes [34,58,67]. No statistically significant contribution from precipitation changes to lake expansion was identified in this study.
Glacier retreat has a profound impact on the formation and development of proglacial lakes, as the thinning and retreat of glaciers provide both water sources and space for the formation and expansion of these lakes [27,28,68]. By comparing the average thinning rates of individual parent glaciers between 2000 and 2019, the study by [69] found that the thinning rate of parent glaciers for newly formed proglacial lakes (formed between 1960 and 2020) was 0.97 ± 0.19 m/a, slightly higher than the thinning rate of 0.86 ± 0.19 m/a for parent glaciers of proglacial lakes that have since separated from the glacier. In contrast, the thinning rate for parent glaciers of fully separated glacial lakes was the lowest, at 0.70 ± 0.21 m/a. This may be attributed to the relatively small total area of these glacial lakes, resulting in their gradual separation from the glacier during the study period. Consequently, the research suggests that the melting of parent glaciers is the primary driving force behind the expansion of proglacial lakes [55,69].

4.3. Amplified GLOF Risks from Clustered Glacial Lakes

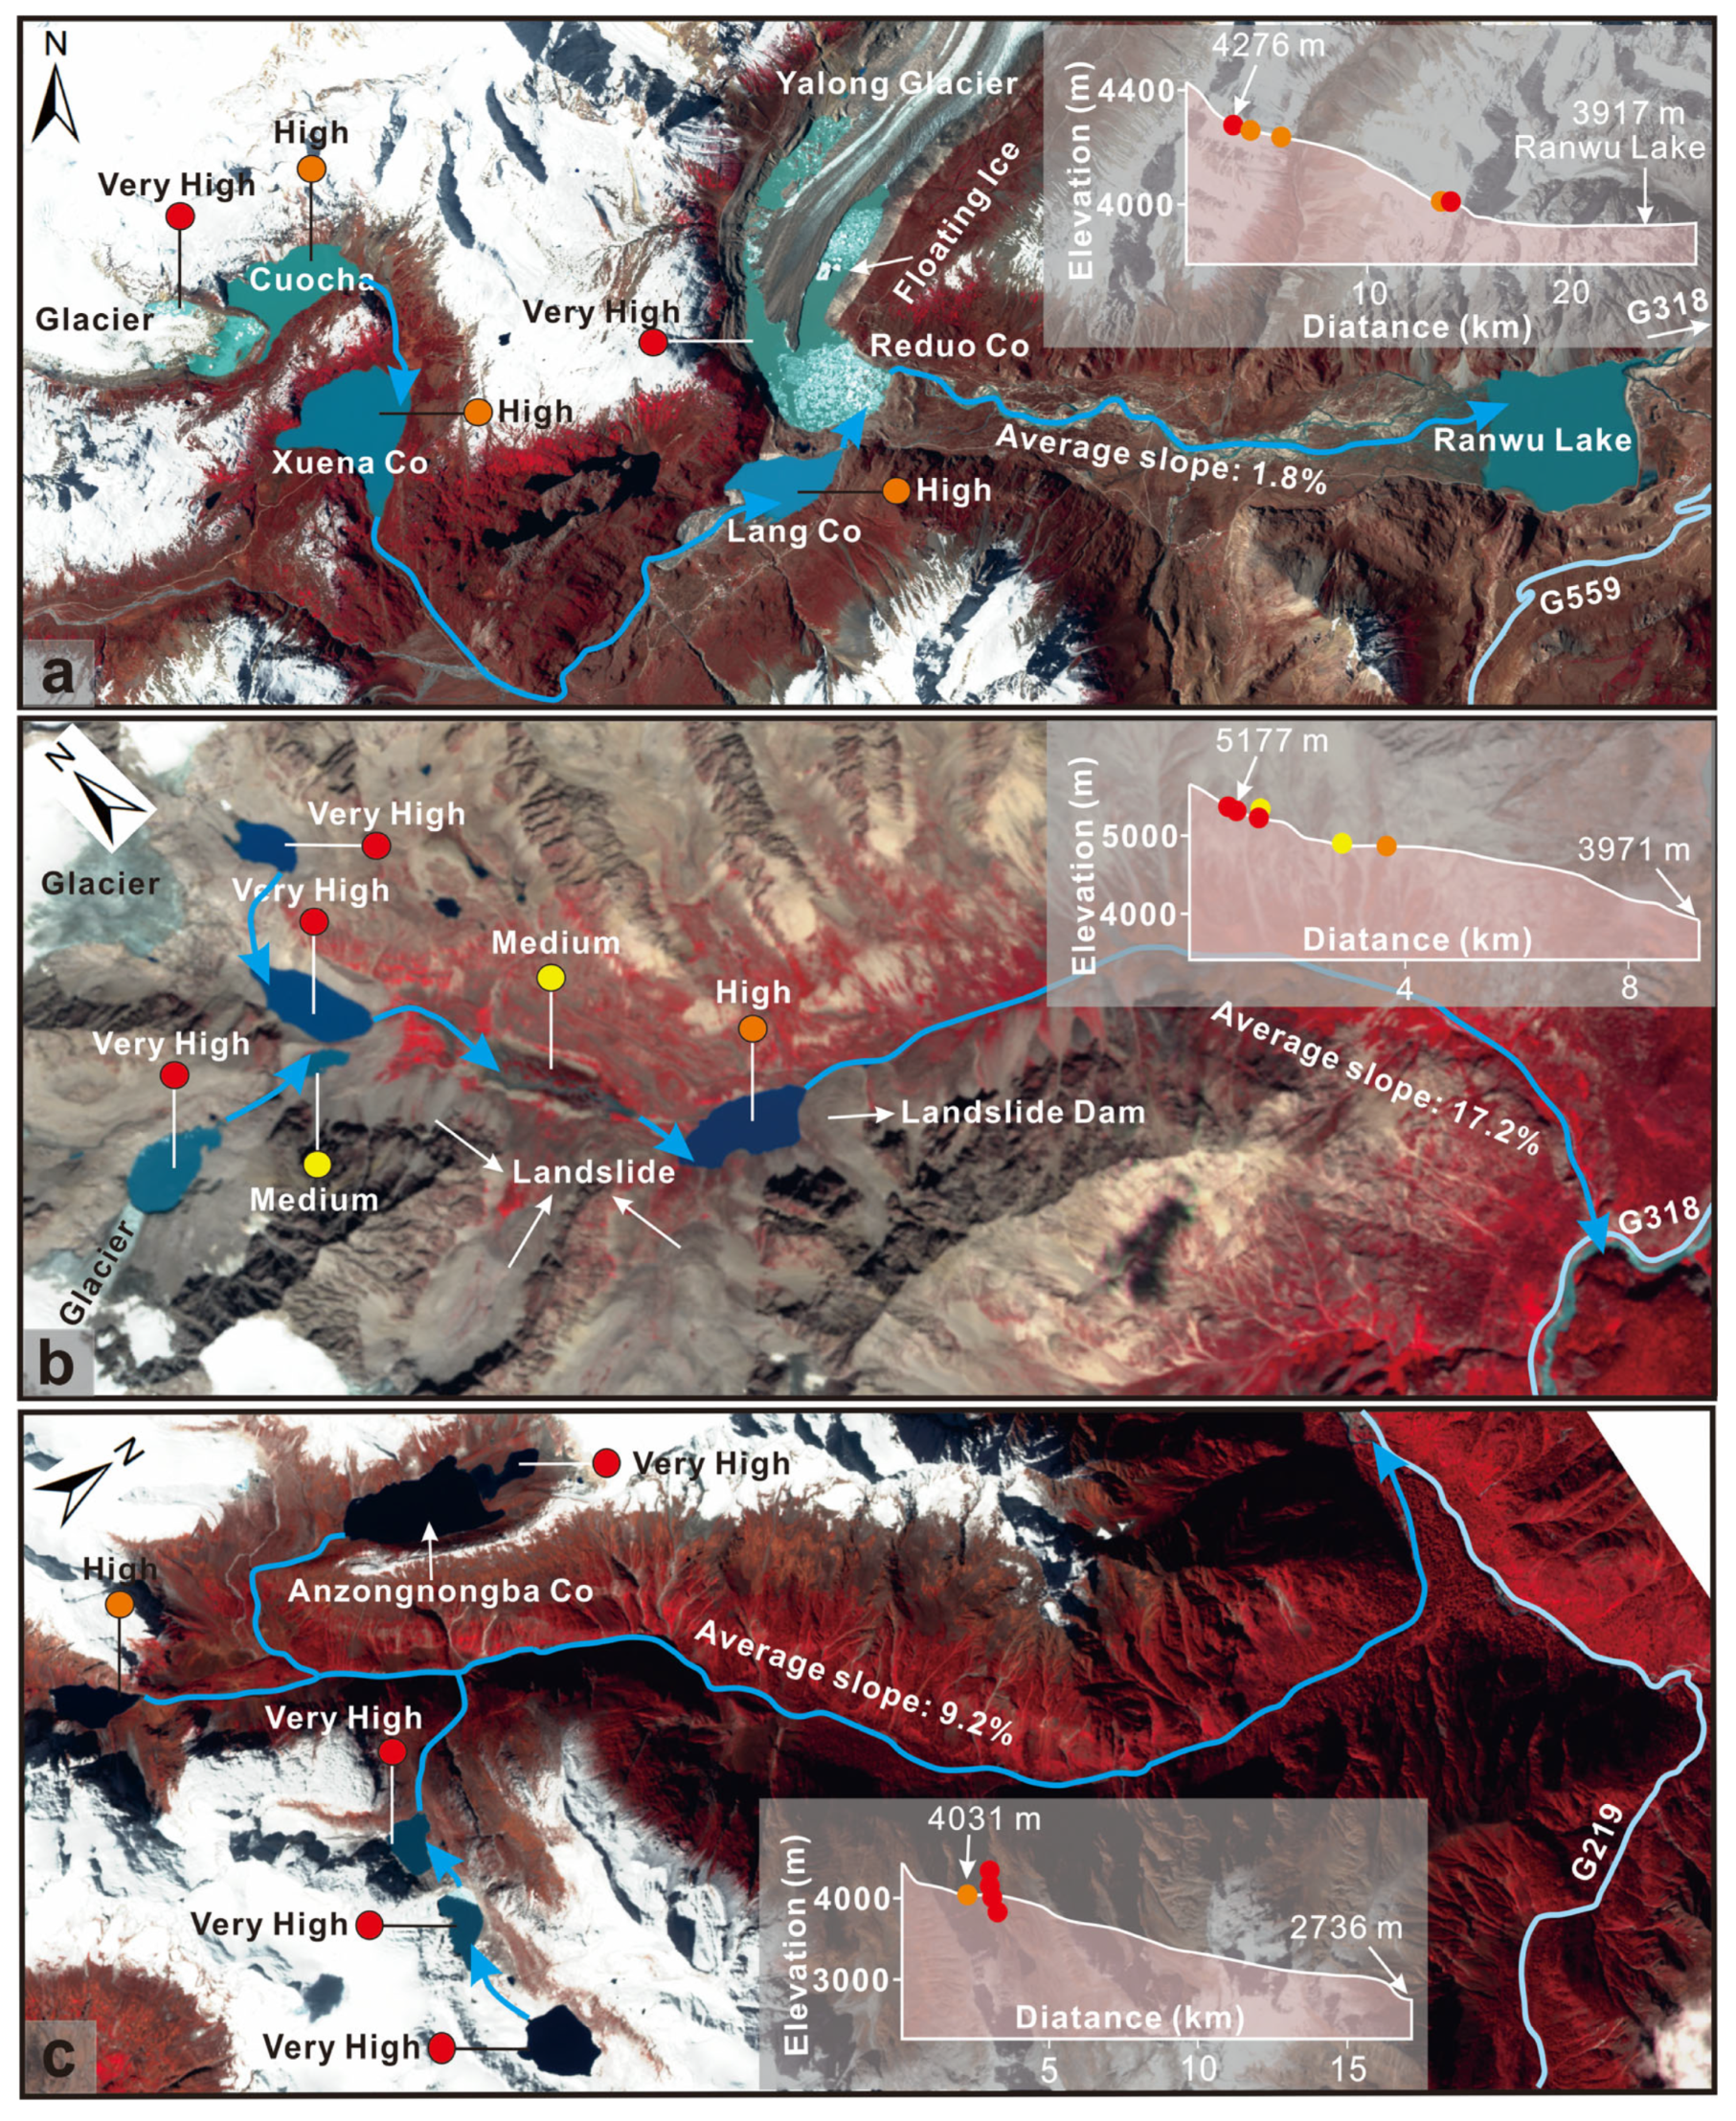
In the southeastern Tibetan engineering corridor, the presence of multiple glacial lakes along the same potential outburst pathways is particularly pronounced, significantly amplifying the risk associated with GLOFs. Through detailed analysis of satellite imagery, we found a clear spatial aggregation of these glacial lakes, with overlapping or nearby outburst paths. This arrangement implies that if one glacial lake experiences an outburst, the resulting flood could trigger a chain reaction, leading to successive outbursts of other glacial lakes and creating a larger-scale flooding event. Analysis of clustered glacial lakes assessed as having moderate or higher susceptibility identified a total of three channels within the study area where glacial lakes are aggregated, potentially increasing GLOF risk (Figure 14, Table S5). Upstream of Ranwu Lake, there are five sizeable and highly susceptible glacial lakes (Lake 14, Cuocha, Xuena Co, Lang Co, and Reduo Co) (Figure 14a). The potential outburst directions of these five glacial lakes align along the same trajectory, and they all have susceptibility levels classified as high or very high. If the upstream Lake 14 (0.55 km2) were to experience an outburst, the total water volume could reach a maximum of 452.36 × 10⁶ m3 after converging with the downstream Reduo Co (2.94 km2). This represents an increase of approximately 910% compared to a single outburst from Reduo Co, based on the volume estimation formula F5 [60]. It should be noted that this percentage is derived from a static summation of lake volumes and represents an extreme upper-bound scenario rather than a precise prediction of actual flood discharge. Their shared flow paths intersect with National Highway G559, located 12 km away. In extreme scenarios, it is also possible for the flood to converge with downstream Ranwu Lake, where the flooding and associated sediment could easily devastate Ranwu Town.
In addition, there is a channel upstream of the Parlung Zangbo River that aggregates six large glacial lakes, five of which share the same flow path (Figure 14b). The glacier in this area directly supplies water to two upstream glacial lakes (17.2%). Furthermore, landslides are very active in this region, with downstream glacial lakes directly forming typical landslide dams using the landslide deposits as dam structures. The landslide deposits are generally loose, making it easy for them to fail after the accumulation of upstream water. Given the steep gradient, floodwaters can easily breach the landslide dam and devastatingly impact National Highway G318, located 4.7 km away through a narrow canyon. The channel where Anzongnongba Co is located aggregates five large glacial lakes (Figure 14c); however, the largest lake, Anzongnongba Co, does not create a cascading effect with the other lakes due to its position on the opposite side of the mountain. This significantly reduces the risk of cascading outbursts at this channel mouth. Nevertheless, the other three glacial lakes meet the conditions for producing cascading outburst risks, and they all have very high susceptibility levels. Therefore, if any of the upstream glacial lakes were to experience an outburst, it would pose a significant threat to National Highway G219, located 13.4 km away, after merging with the two downstream glacial lakes.
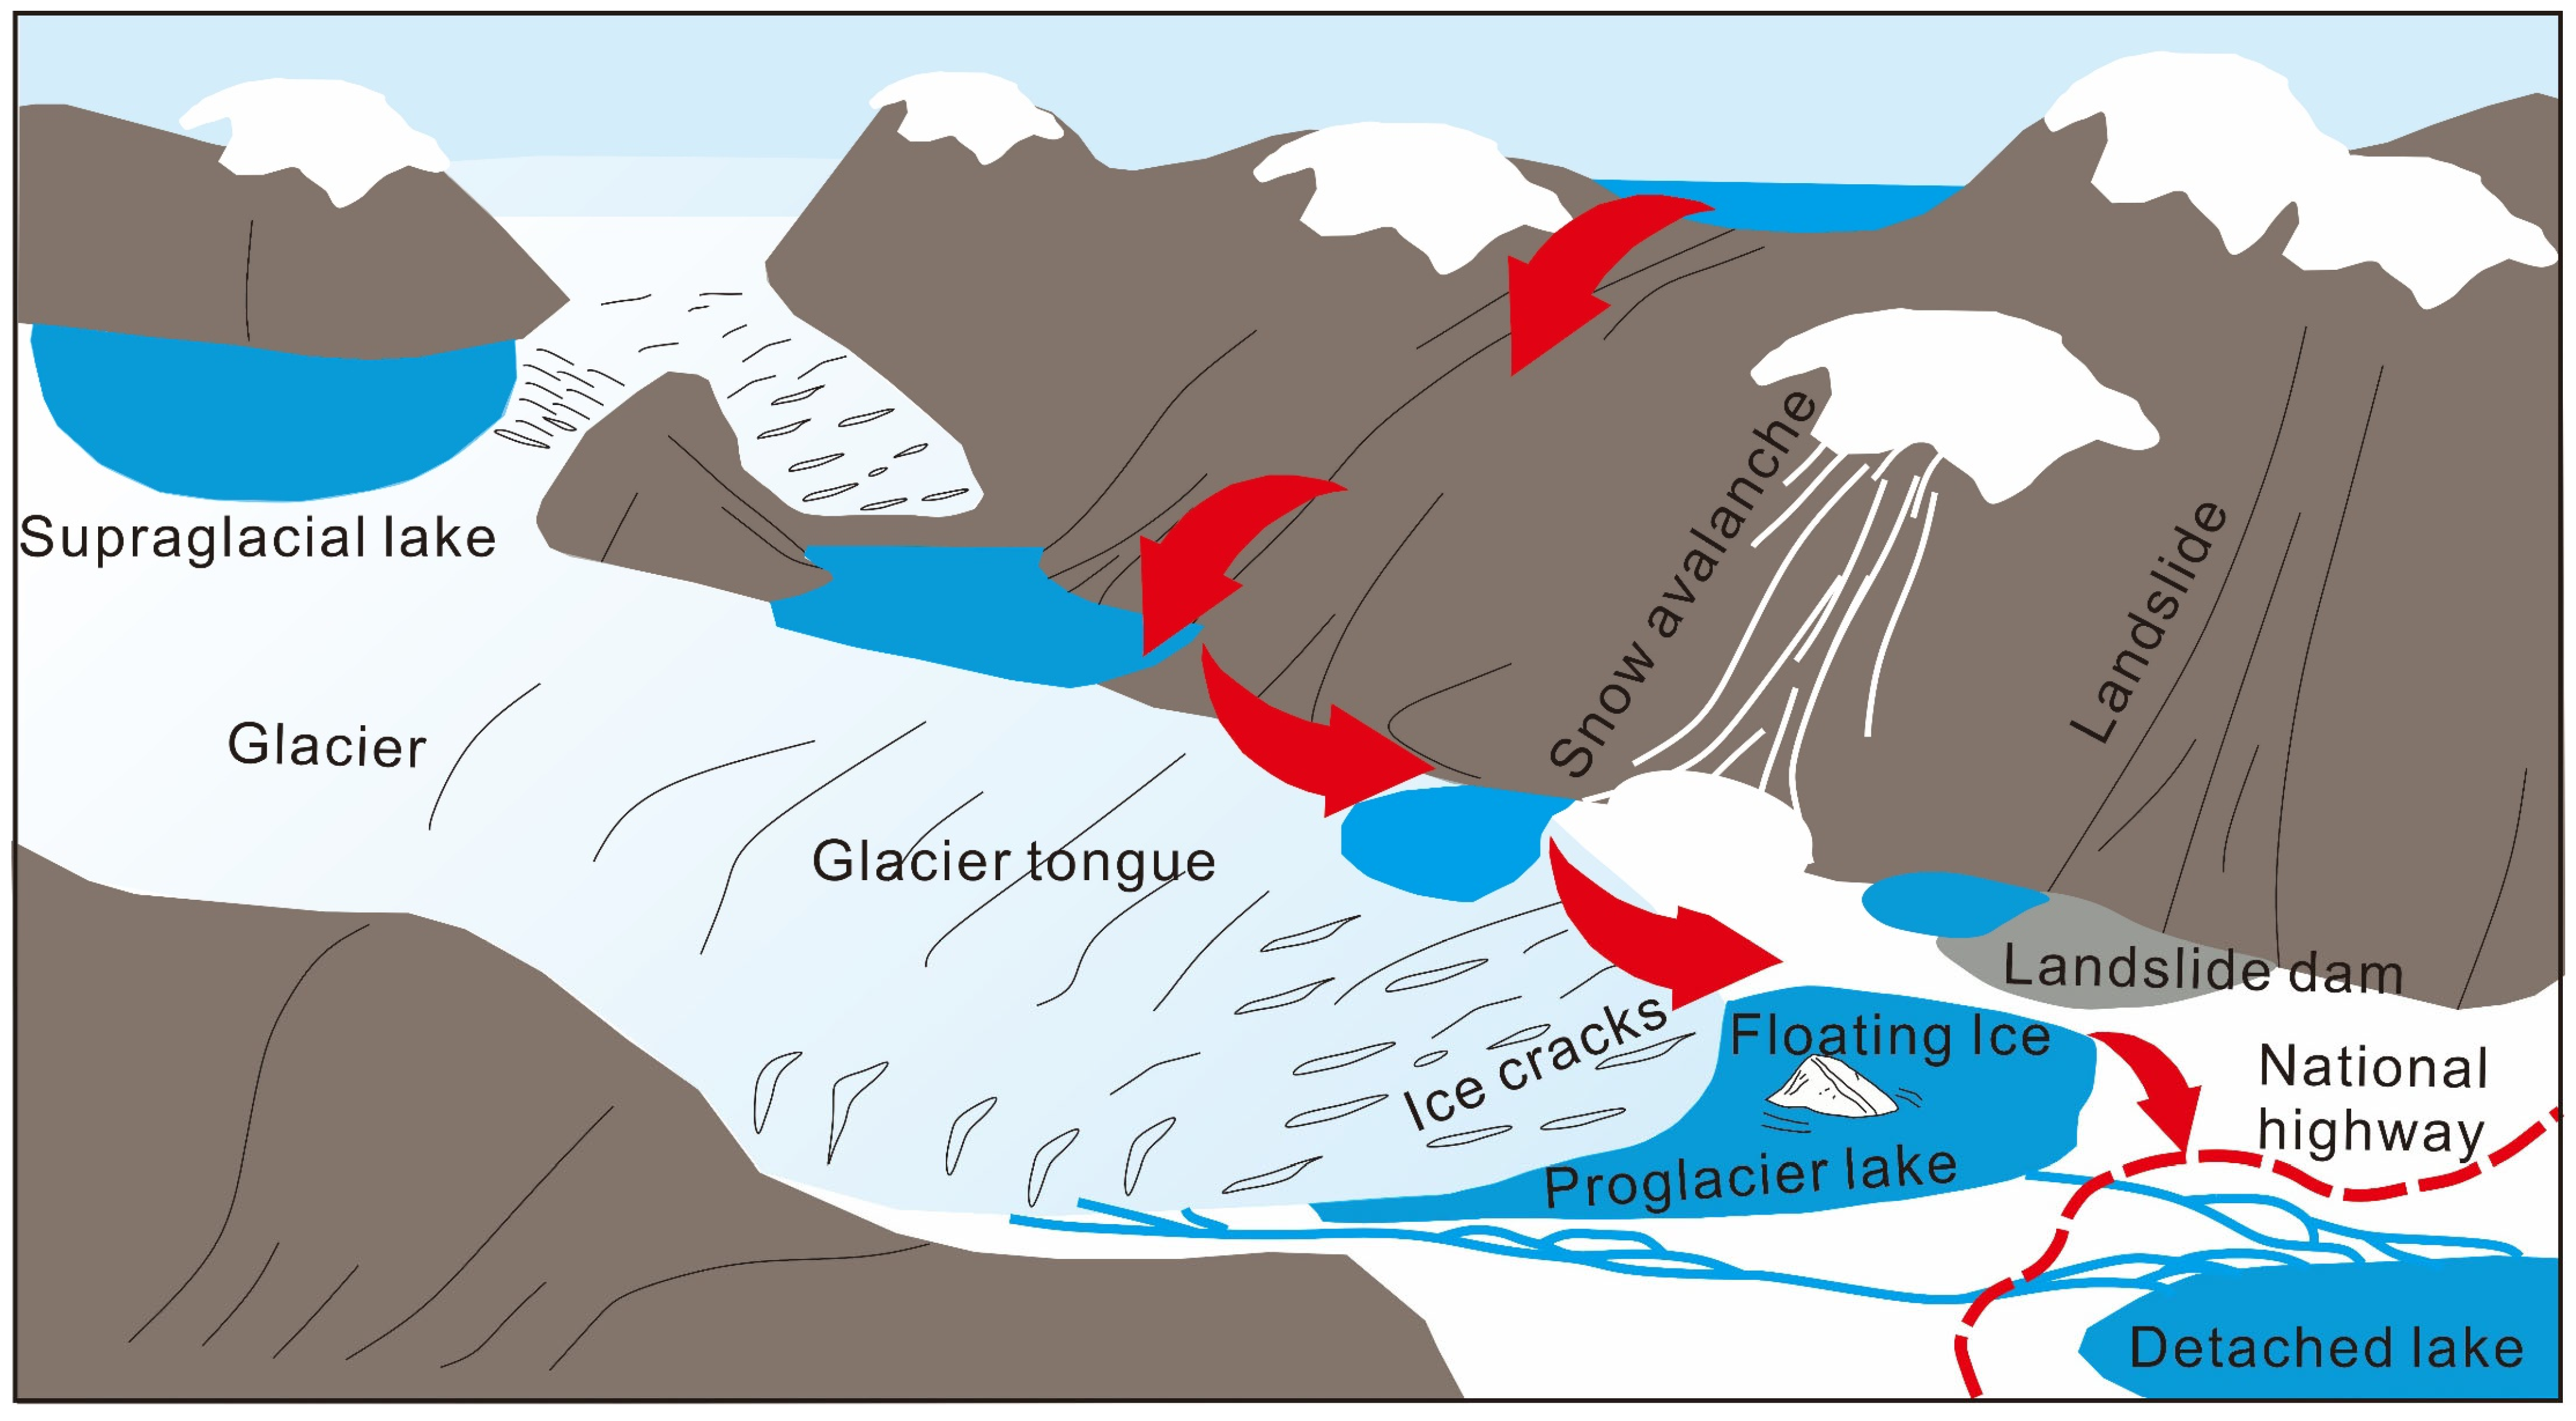
From the perspective of risk assessment, traditional single-lake evaluations underestimate the vulnerability of infrastructure and overlook the amplification effects of clustered high-susceptibility glacial lakes. The flood energy generated by the outburst of a single glacial lake is already sufficient to cause significant damage to transportation infrastructure, while the cascading outbursts of multiple glacial lakes will further amplify this energy, increasing both the flow rate and volume of the flood (Figure 15). This spatial synergy could also lead to cumulative effects along the flood pathway, causing the extent and depth of flooding to exceed predictions based on a single glacial lake outburst. Such cumulative effects render the risk assessment and prevention of GLOFs more complex and severe. Therefore, future research needs to place greater emphasis on the spatial distribution characteristics of clustered glacial lakes and develop risk assessment models capable of simulating the cumulative amplification effects of multi-lake outbursts. This will enable more accurate predictions of GLOF occurrence probabilities and impact ranges, providing a more reliable scientific basis for the planning and construction of large-scale projects.

4.4. Recommendations for Monitoring and Early Warning

Based on the susceptibility assessment results and the identification of clustered lake channels, we propose the following recommendations for future monitoring and early warning. First, the 14 glacial lakes with high expansion rates and very high susceptibility identified in Section 3.2.2 (Figure 10) should be included in the priority monitoring list, among which Guangxie Co (Lake 4) and Lakes 8, 11, and 12 (Figure 11) are of particular concern due to their proximity to National Highways G318 and G219 and the active geological hazards (landslides, ice avalanches, and moraine dam erosion) in their surrounding areas [70]. For in situ observations, we recommend installing automated water-level sensors in the priority lakes to continuously monitor water-level fluctuations [71]. Water depth is one of the primary indicators of lake stability, and anomalous water-level changes may serve as important precursors to outburst events. For cascading lake clusters, sensors should be deployed in both upstream and downstream lakes simultaneously to capture the dynamic chain-reaction processes. Such systems are structurally simple, low-cost, and can be powered by solar energy, making them suitable for long-term operation in remote areas. For remote sensing monitoring, we recommend acquiring high-resolution optical and SAR satellite imagery at monthly or sub-monthly intervals to track changes in lake area, glacier retreat dynamics, and the development of hazard precursors such as ice avalanches, moraine dam erosion, and landslide activity [72]. Remote sensing data can complement in situ sensor data, providing important evidence for the early identification of outburst events. For predictive modeling, the historical GLOF records and lake inventory data compiled in this study can provide valuable prior information for constructing probabilistic prediction models. Field-observed water-level and area-change data can be dynamically assimilated into these models to enable updated assessments of outburst risk. For sections of National Highways G219 and G318 that lie within 10 km of potential outburst pathways (Table S3), we recommend reinforcing bridges and culverts along these routes to enhance their resilience against potential flood impacts. Where conditions permit, diversion channels or debris-flow barriers could be constructed to mitigate the effects of outburst floods. In addition, we recommend coordinating with local transportation authorities to develop targeted emergency response plans.

4.5. Limitations

Several limitations of this study should be acknowledged when interpreting the results. First, the temporal resolution of our lake inventory (1990, 2000, 2010, and 2020) may not capture interannual variability or short-term rapid changes in lake area, particularly for small lakes that respond quickly to climatic fluctuations. Future studies with higher temporal resolution would help resolve this issue. Second, the lake volume estimation was based on an empirical area–volume relationship [60] calibrated on 47 Himalayan lakes. While this formula provides a reasonable approximation and was selected for its regional relevance and large calibration sample, we acknowledge that we did not perform a systematic sensitivity analysis across the five formulas listed in Table 2 to quantify the calibration uncertainty behind the reported volumes, including the cascading-flood totals in Section 4.3. The formula inevitably carries uncertainties, especially when applied to lakes whose geometric characteristics differ from the calibration dataset. Future bathymetric surveys of representative lakes in the study area would help refine volume estimates and reduce associated uncertainties. Third, this study focuses on GLOF susceptibility rather than comprehensive risk, the latter of which would require systematic assessments of exposure and vulnerability of downstream infrastructure, including bridge/culvert types and conditions, embankment resilience, and traffic exposure. Future studies integrating these components would contribute to a more complete risk assessment framework. Fourth, seasonal water-level fluctuations may lead to lake misclassification, particularly for small, shallow lakes whose water boundaries differ substantially between dry and wet seasons. To minimize this effect, we preferentially selected imagery from the summer–autumn months (June–October), when lake levels are relatively stable and lake boundaries are most discernible; nonetheless, residual seasonal variability cannot be entirely ruled out. Finally, while the cluster/cascade analysis provides a valuable qualitative assessment of flood amplification effects, quantitative simulation of cascading outburst dynamics would further strengthen hazard prediction capabilities.

5. Conclusions

We used Landsat 5–9 and Sentinel-2 satellite images to obtain the evolution characteristics of glacial lakes in the southeastern Tibet engineering corridor from 1990 to 2020. The results indicate that both the number and area of glacial lakes in the study area show a significant upward trend, with an increase of 40.4% in the number and 26.2% in the area of glacial lakes. The number of glacial lakes has expanded at a rate of 2.47 lakes per year, while the area has steadily increased at a rate of 0.26 km2 per year. Furthermore, the number of small-sized glacial lakes (<0.02 km2) has increased the most, while mid-to-large glacial lakes (>0.5 km2) have seen the most significant area expansion. Through the analysis of historical GLOF events and field surveys, we assessed the susceptibility of glacial lakes, identifying 31 lakes with very high susceptibility, 48 with high susceptibility, and 78 with moderate susceptibility. Glacial lakes with a large area expansion rate and high GLOF susceptibility are primarily distributed on both sides of the Gongrigabu River and the Parlung Zangbo River, corresponding to National Highways G219 and G318. This region requires increased attention and disaster mitigation measures to reduce the damage caused by GLOFs. Among the glacial lakes classified as having high and very high susceptibility, 35 are most likely to impact key transportation routes within the study area. Additionally, three areas exhibit clustering effects of glacial lakes, which could amplify the risk of flooding. This spatial synergy among glacial lakes may lead to cumulative amplification effects along flood pathways, significantly increasing GLOF risks and severity. This study provides a preliminary examination of the evolution and GLOF susceptibility levels of glacial lakes in the southeastern Tibet engineering corridor and identifies the locations of glacial lakes that may threaten transportation routes. Future detailed field investigations should be conducted to confirm the susceptibility of the most affected glacial lakes. Moreover, future hydrological modeling should consider the cumulative flooding effects resulting from glacial lake aggregation to simulate the dynamics of GLOFs.

Supplementary Materials

The following supporting information can be downloaded at https://www.mdpi.com/article/10.3390/geohazards7030097/s1, Table S1: Satellite scenes used in this study for glacial lake mapping and base maps; Table S2: Comparison of indicators between stable and historically outburst glacial lakes; Table S3: The details of high- and very-high-susceptibility glacier lakes, including information of location, elevation, and area; Table S4: The detailed information on the lake most threatening to major roads; Table S5: Glacial lakes that are clustered in distribution and thus have a risk-amplifying effect; Table S6: Sensitivity analysis of weight assignments for GLOF susceptibility assessment.

Author Contributions

Conceptualization, J.L. and X.T.; methodology, J.L.; software, S.Z.; validation, J.L., X.T. and Y.W.; formal analysis, S.Z.; investigation, X.T.; resources, Y.W.; data curation, Z.Z.; writing—original draft preparation, J.L.; writing—review and editing, X.T.; visualization, S.Z.; supervision, X.Y.; project administration, X.Y.; funding acquisition, X.Y. All authors have read and agreed to the published version of the manuscript.

Funding

This work was supported by the Science and Technology Project of State Grid Corporation of China (5200-202356393A-2-4-KJ).

Data Availability Statement

The multi-temporal glacial lake inventory data (1990, 2000, 2010, and 2020) and the GLOF susceptibility assessment results generated in this study have been deposited in the Mendeley Data repository and are publicly available at https://data.mendeley.com/preview/xt5t28zym8?a=7d529408-94bd-41b2-888b-25cfc56073e0 (accessed on 7 August 2026) (DOI: 10.17632/xt5t28zym8.1).

Conflicts of Interest

The authors declare no conflicts of interest.

References

  1. Sha, A.; Ma, B.; Wang, H.; Hu, L.; Mao, X.; Zhi, X.; Chen, H.; Liu, Y.; Ma, F.; Liu, Z.; et al. Highway constructions on the Qinghai-Tibet Plateau: Challenge, research and practice. J. Road Eng. 2022, 2, 1–60. [Google Scholar] [CrossRef] [Scilit]
  2. Yang, S.; Zhang, L.; Zhu, G. Effects of transport infrastructures and climate change on ecosystem services in the integrated transport corridor region of the Qinghai-Tibet Plateau. Sci. Total Environ. 2023, 885, 163961. [Google Scholar] [CrossRef] [Scilit]
  3. Yang, X.; Qiu, X.; Fang, Y.; Xu, Y.; Zhu, F. Spatial variation of the relationship between transport accessibility and the level of economic development in Qinghai-Tibet Plateau, China. J. Mt. Sci. 2019, 16, 1883–1900. [Google Scholar] [CrossRef] [Scilit]
  4. Lu, C.; Cai, C. Challenges and Countermeasures for Construction Safety during the Sichuan–Tibet Railway Project. Engineering 2019, 5, 833–838. [Google Scholar] [CrossRef] [Scilit]
  5. Cui, P.; Ge, Y.; Li, S.; Li, Z.; Xu, X.; Zhou, G.G.D.; Chen, H.; Wang, H.; Lei, Y.; Zhou, L.; et al. Scientific challenges in disaster risk reduction for the Sichuan–Tibet Railway. Eng. Geol. 2022, 309, 106837. [Google Scholar] [CrossRef] [Scilit]
  6. Zhang, D.; Sun, Z.; Fang, Q. Scientific problems and research proposals for Sichuan–Tibet railway tunnel construction. Undergr. Space 2022, 7, 419–439. [Google Scholar] [CrossRef] [Scilit]
  7. Tian, X.; Wang, Y.; Zhu, S.; Yao, X.; Li, X. Geological environment and main geological safety challenges in the northern segment of the southeast Xizang (Tibet) power transmission corridor. J. Geomech. 2025, 31, 91–108. [Google Scholar] [CrossRef]
  8. Wu, R.; Zhang, Y.; Guo, C.; Yang, Z.; Tang, J.; Su, F. Landslide susceptibility assessment in mountainous area: A case study of Sichuan–Tibet railway, China. Environ. Earth Sci. 2020, 79, 157. [Google Scholar] [CrossRef] [Scilit]
  9. Lan, H.; Tian, N.; Li, L.; Wu, Y.; Macciotta, R.; Clague, J.J. Kinematic-based landslide risk management for the Sichuan-Tibet Grid Interconnection Project (STGIP) in China. Eng. Geol. 2022, 308, 106823. [Google Scholar] [CrossRef] [Scilit]
  10. Jiang, Y.; Lu, X.; Liu, Z.; Wang, N.; Xu, P.; Li, P. Experimental study on the engineering properties and failure mechanism of moraine in Southeast Tibet under freeze–thaw cycles conditions. Eng. Fail. Anal. 2024, 163, 108551. [Google Scholar] [CrossRef] [Scilit]
  11. Xu, J.; Guo, J.; Sun, Y.; Tang, Q.; Zhang, J. Why China must build Sichuan-Tibet railway: From the perspective of regional comprehensive transportation network optimization. J. Intell. Fuzzy Syst. 2021, 40, 9741–9763. [Google Scholar] [CrossRef] [Scilit]
  12. Zhang, L.; Guo, Z.; Qi, S.; Zhao, T.; Wu, B.; Li, P. Landslide susceptibility evaluation and determination of critical influencing factors in eastern Sichuan mountainous area, China. Ecol. Indic. 2024, 169, 112911. [Google Scholar] [CrossRef] [Scilit]
  13. Ding, L.; Kapp, P.; Cai, F.; Garzione, C.N.; Xiong, Z.; Wang, H.; Wang, C. Timing and mechanisms of Tibetan Plateau uplift. Nat. Rev. Earth Environ. 2022, 3, 652–667. [Google Scholar] [CrossRef] [Scilit]
  14. Yang, Z.; Pang, B.; Dong, W.; Li, D.; Huang, Z. Interaction of landslide spatial patterns and river canyon landforms: Insights into the Three Parallel Rivers Area, southeastern Tibetan Plateau. Sci. Total Environ. 2024, 914, 169935. [Google Scholar] [CrossRef] [Scilit] [PubMed]
  15. An, B.; Wang, W.; Yang, W.; Wu, G.; Guo, Y.; Zhu, H.; Gao, Y.; Bai, L.; Zhang, F.; Zeng, C.; et al. Process, mechanisms, and early warning of glacier collapse-induced river blocking disasters in the Yarlung Tsangpo Grand Canyon, southeastern Tibetan Plateau. Sci. Total Environ. 2022, 816, 151652. [Google Scholar] [CrossRef] [Scilit] [PubMed]
  16. Li, Y.; Cui, Y.; Hu, X.; Lu, Z.; Guo, J.; Wang, Y.; Wang, H.; Wang, S.; Zhou, X. Glacier retreat in Eastern Himalaya drives catastrophic glacier hazard chain. Geophys. Res. Lett. 2024, 51, e2024GL108202. [Google Scholar] [CrossRef] [Scilit]
  17. Chu, D.; Liu, L.; Wang, Z. The Evolution and Impact of Glacier and Ice-Rock Avalanches in the Tibetan Plateau with Sentinel-2 Time-Series Images. GeoHazards 2026, 7, 10. [Google Scholar] [CrossRef] [Scilit]
  18. He, N.; Liu, X.; Wang, H.; Liu, W.; Zhang, M.; Cao, J.; Yang, Y. Hazard Assessment for Potential GLOF of JiongpuCo Glacial Lake, Southeastern Tibet. Water 2026, 18, 628. [Google Scholar] [CrossRef] [Scilit]
  19. Tian, X.; Yao, X.; Zhou, Z.; Chen, X.; Song, G.; Zhu, S.; Li, X. Snow Avalanche Release Area Identification and Hazard Assessment Based on GIS and RAMMS Modeling: A Case Study of the Galongla Section of the Zhamo Highway, Xizang. Earth Sci. 2026, 51, 620–633. [Google Scholar] [CrossRef] [Scilit]
  20. Miles, E.; McCarthy, M.; Dehecq, A.; Kneib, M.; Fugger, S.; Pellicciotti, F. Health and sustainability of glaciers in High Mountain Asia. Nat. Commun. 2021, 12, 2868. [Google Scholar] [CrossRef] [Scilit] [PubMed]
  21. Bhattacharya, A.; Bolch, T.; Mukherjee, K.; King, O.; Menounos, B.; Kapitsa, V.; Neckel, N.; Yang, W.; Yao, T. High Mountain Asian glacier response to climate revealed by multi-temporal satellite observations since the 1960s. Nat. Commun. 2021, 12, 4133. [Google Scholar] [CrossRef] [Scilit] [PubMed]
  22. Verma, S.K.; Vijay, S. Potential of ICESat-2 and multispectral satellite imagery for estimating the depth of shallow glacial lakes in the Himalaya. Remote Sens. Appl. Soc. Environ. 2025, 38, 101577. [Google Scholar] [CrossRef] [Scilit]
  23. Li, S.; Li, C.; Li, Z.; Li, L.; Wang, W. Ice Avalanche-Triggered Glacier Lake Outburst Flood: Hazard Assessment at Jiongpuco, Southeastern Tibet. Water 2025, 17, 2102. [Google Scholar] [CrossRef] [Scilit]
  24. Taylor, C.; Robinson, T.R.; Dunning, S.; Rachel Carr, J.; Westoby, M. Glacial lake outburst floods threaten millions globally. Nat. Commun. 2023, 14, 487. [Google Scholar] [CrossRef] [Scilit] [PubMed]
  25. Lützow, N.; Veh, G.; Korup, O. A global database of historic glacier lake outburst floods. Earth Syst. Sci. Data 2023, 15, 2983–3000. [Google Scholar] [CrossRef] [Scilit]
  26. Li, S.; Li, C.; Li, P.; Shu, Y.; Li, Z.; Wang, Z. Numerical Investigation of the Erosive Dynamics of Glacial Lake Outburst Floods: A Case Study of the 2020 Jinwuco Event in Southeastern Tibetan Plateau. Water 2025, 17, 2837. [Google Scholar] [CrossRef] [Scilit]
  27. Zhao, F.; Long, D.; Li, X.; Huang, Q.; Han, P. Rapid glacier mass loss in the Southeastern Tibetan Plateau since the year 2000 from satellite observations. Remote Sens. Environ. 2022, 270, 112853. [Google Scholar] [CrossRef] [Scilit]
  28. Lemot, F.; Sabatier, P.; Chevalier, M.-L.; Crouzet, C.; Kermagoret, L.; Rioual, P.; Bai, M.; Jacq, K.; Findling, N.; Replumaz, A. Proglacial lake response to Late-Holocene glacial fluctuations in Southeast Tibet. Glob. Planet. Change 2024, 232, 104347. [Google Scholar] [CrossRef] [Scilit]
  29. Sharma, A.; Sharma, N.; Gupta, S.; Gupta, M. Emergence and evolution of a new glacial lake during last climate normal by using remote sensing and GIS in Sikkim, India. Remote Sens. Appl. Soc. Environ. 2023, 32, 101047. [Google Scholar] [CrossRef] [Scilit]
  30. Gaikwad, D.; Tyagi, A.; Tiwari, R.K. Hybrid FR-AHP approach for GLOF hazard assessment in the Himalayan region. Remote Sens. Appl. Soc. Environ. 2024, 37, 101437. [Google Scholar] [CrossRef] [Scilit]
  31. Rather, A.F.; Ahmed, R.; Jun, C.; Bateni, S.M.; Ahmed, P.; Mir, R.A. Understanding Glacial Lake Evolution and the Associated GLOF Hazard in the Shyok Catchment of the Upper Indus Basin Using Geospatial Techniques. Nat. Hazards Rev. 2024, 25, 3. [Google Scholar] [CrossRef] [Scilit]
  32. Falátková, K. Temporal analysis of GLOFs in high-mountain regions of Asia and assessment of their causes. Acta Univ. Carol. Geogr. 2016, 51, 145–154. [Google Scholar] [CrossRef] [Scilit]
  33. Gao, J.; Du, J.; Bai, Y.; Chen, T.; Zhuoma, Y. The Impact of Climate Change on Glacial Lake Outburst Floods. Water 2024, 16, 1742. [Google Scholar] [CrossRef] [Scilit]
  34. Chen, M.; Chen, Y.; Fang, G.; Zheng, G.; Li, Z.; Li, Y.; Zhu, Z. Risk assessment of glacial lake outburst flood in the Central Asian Tienshan Mountains. npj Clim. Atmos. Sci. 2024, 7, 209. [Google Scholar] [CrossRef] [Scilit]
  35. Rinzin, S.; Zhang, G.; Sattar, A.; Wangchuk, S.; Allen, S.K.; Dunning, S.; Peng, M. GLOF hazard, exposure, vulnerability, and risk assessment of potentially dangerous glacial lakes in the Bhutan Himalaya. J. Hydrol. 2023, 619, 129311. [Google Scholar] [CrossRef] [Scilit]
  36. Che, Y.; Wang, S.; Wei, Y.; Pu, T.; Ma, X. Rapid changes to glaciers increased the outburst flood risk in Guangxieco Proglacial Lake in the Kangri Karpo Mountains, Southeast Qinghai-Tibetan Plateau. Nat. Hazards 2022, 110, 2163–2184. [Google Scholar] [CrossRef] [Scilit]
  37. Yang, L.; Lu, Z.; Zhao, C.; Kim, J.; Yang, C.; Wang, B.; Liu, X.; Wang, Z. Analyzing the triggering factors of glacial lake outburst floods with SAR and optical images: A case study in Jinweng Co, Tibet, China. Landslides 2022, 19, 855–864. [Google Scholar] [CrossRef] [Scilit]
  38. Peng, M.; Wang, X.; Zhang, G.; Veh, G.; Sattar, A.; Chen, W.; Allen, S. Cascading hazards from two recent glacial lake outburst floods in the Nyainqêntanglha range, Tibetan Plateau. J. Hydrol. 2023, 626, 130155. [Google Scholar] [CrossRef] [Scilit]
  39. Duan, H.; Yao, X.; Zhang, Y.; Jin, H.; Wang, Q.; Du, Z.; Hu, J.; Wang, B.; Wang, Q. Lake volume and potential hazards of moraine-dammed glacial lakes—A case study of Bienong Co, southeastern Tibetan Plateau. Cryosphere 2023, 17, 591–616. [Google Scholar] [CrossRef] [Scilit]
  40. Singh, H.; Varade, D.; de Vries, M.V.W.; Adhikari, K.; Rawat, M.; Awasthi, S.; Rawat, D. Assessment of potential present and future glacial lake outburst flood hazard in the Hunza valley: A case study of Shisper and Mochowar glacier. Sci. Total Environ. 2023, 868, 161717. [Google Scholar] [CrossRef] [Scilit] [PubMed]
  41. Jiang, L.; Fan, X.; Deng, Y.; Zou, C.; Feng, Z.; Djukem, D.L.W.; Wei, T.; Dou, X.; Xu, Q. Combining geophysics, remote sensing and numerical simulation to assess GLOFs: Case study of the Namulacuo Lake in the Southeastern Tibetan Plateau. Sci. Total Environ. 2023, 880, 163262. [Google Scholar] [CrossRef] [Scilit] [PubMed]
  42. Qi, M.; Liu, S.; Wu, K.; Zhu, Y.; Xie, F.; Jin, H.; Gao, Y.; Yao, X. Improving the accuracy of glacial lake volume estimation: A case study in the Poiqu basin, central Himalayas. J. Hydrol. 2022, 610, 127973. [Google Scholar] [CrossRef] [Scilit]
  43. Aslam, A.B.; Rana, I.A.; Shah, S.S.; Mohuddin, G. Climate change and glacial lake outburst flood (GLOF) risk perceptions: An empirical study of Ghizer District, Gilgit-Baltistan Pakistan. Int. J. Disaster Risk Reduct. 2022, 83, 103392. [Google Scholar] [CrossRef] [Scilit]
  44. Tian, X.; Yao, X.; Zhou, Z. Distribution patterns and risk assessment of potential ice avalanches and glacier lake outburst floods in southeastern Tibetan Plateau. Ecol. Indic. 2025, 179, 114217. [Google Scholar] [CrossRef] [Scilit]
  45. Zhou, B.; Zou, Q.; Jiang, H.; Yang, T.; Zhou, W.; Chen, S.; Yao, H. Process-driven susceptibility assessment of glacial lake outburst debris flow in the Himalayas under climate change. Adv. Clim. Change Res. 2024, 15, 500–514. [Google Scholar] [CrossRef] [Scilit]
  46. Tian, Z.; Yao, X.; Zhang, C.; Duan, H.; Zhang, J.; Ma, Q. Are Area Changes the Primary Indicator for Predicting Glacial Lake Outburst Risks?—A Case Study of the HMA Region. Res. Cold Arid. Reg. 2026, 18, 120–129. [Google Scholar] [CrossRef] [Scilit]
  47. Zhao, H.; Wang, D.; An, L.; Cheng, J.; Wang, S.; Zhang, M.; Tao, C. Dangerous Glacial Lakes Identification with Property-Spatial Associations in High Mountain Asia From 1990 to 2022. IEEE J. Sel. Top. Appl. Earth Obs. Remote Sens. 2025, 18, 9708–9722. [Google Scholar] [CrossRef] [Scilit]
  48. Schneider, R.A.A.; Blomdin, R.; Fu, P.; Xu, X.K.; Stroeven, A.P. Paleoglacial footprint and fluvial terraces of the Shaluli Shan, SE Tibetan Plateau. J. Maps 2021, 17, 439–452. [Google Scholar] [CrossRef] [Scilit]
  49. Chen, F.; Zhang, M.; Guo, H.; Allen, S.; Kargel, J.S.; Haritashya, U.K.; Watson, C.S. Annual 30m dataset for glacial lakes in High Mountain Asia from 2008 to 2017. Earth Syst. Sci. Data 2021, 13, 741–766. [Google Scholar] [CrossRef] [Scilit]
  50. Thakur, P.K.; Garg, V.; Nikam, B.R.; Aggarwal, S.P.; Aggarwal, S.; Singh, D. Snow, Glacier, and Glacier Lake Mapping and Monitoring Using Remote Sensing Data. In Water, Cryosphere, and Climate Change in the Himalayas: A Geospatial Approach; Taloor, A.K., Kotlia, B.S., Kumar, K., Eds.; Springer: Cham, Switzerland, 2021; pp. 57–84. [Google Scholar] [CrossRef] [Scilit]
  51. Singh, D.K.; Thakur, P.K.; Naithani, B.P.; Kaushik, S. Quantifying the sensitivity of band ratio methods for clean glacier ice mapping. Spat. Inf. Res. 2021, 29, 281–295. [Google Scholar] [CrossRef] [Scilit]
  52. Ali, S.; Ali, S.; Wang, L.; Ul Hassan, S.R.; Khan, G.; Ali, S.; Hussain, T.; Ali, D. Deep learning model to detect glacial lakes using high-resolution optical and radar satellite images. Remote Sens. Appl. Soc. Environ. 2025, 38, 101579. [Google Scholar] [CrossRef] [Scilit]
  53. Zhang, G.; Yao, T.; Xie, H.; Wang, W.; Yang, W. An inventory of glacial lakes in the Third Pole region and their changes in response to global warming. Glob. Planet. Change 2015, 131, 148–157. [Google Scholar] [CrossRef] [Scilit]
  54. Zhang, M.; Zhang, G.; Yu, J.; Wang, W.; Xu, F.; Rinzin, S. Potential threats of glacial lake changes to the Sichuan-Tibet Railway. J. Glaciol. 2024, 70, e76. [Google Scholar] [CrossRef] [Scilit]
  55. Liu, J.; Cheng, Z.; Li, Y. The 1988 glacial lake outburst flood in Guangxieco Lake, Tibet, China. Nat. Hazards Earth Syst. Sci. 2014, 14, 3065–3075. [Google Scholar] [CrossRef] [Scilit]
  56. Yao, X.; Liu, S.; Sun, M.; Zhang, X. Study on the glacial lake outburst flood events in Tibet since the 20th century. J. Nat. Resour. 2014, 29, 1377–1390. [Google Scholar] [CrossRef]
  57. Zhang, T.; Wang, W.; Gao, T.; An, B.; Shang, X. Glacial lake outburst floods on the High Mountain Asia: A review. J. Glaciol. Geocryol. 2021, 43, 1673–1692. Available online: http://www.bcdt.ac.cn/EN/10.7522/j.issn.1000-0240.2021.0066 (accessed on 7 August 2026).
  58. Cheng, X.; Shangguan, D.; Yang, C.; Li, W.; Zhou, Z.; Liu, X.; Li, D.; Zhang, X.; Ding, H.; Liu, Z.; et al. Temporal and spatial changes of glacial lakes in the central Himalayas and their response to climate change based on multi-source remote sensing data. Glob. Planet. Change 2025, 245, 104675. [Google Scholar] [CrossRef] [Scilit]
  59. Aggarwal, S.; Rai, S.C.; Thakur, P.K.; Emmer, A. Inventory and recently increasing GLOF susceptibility of glacial lakes in Sikkim, Eastern Himalaya. Geomorphology 2017, 295, 39–54. [Google Scholar] [CrossRef] [Scilit]
  60. Zhang, T.; Wang, W.; An, B.; Wei, L. Enhanced glacial lake activity threatens numerous communities and infrastructure in the Third Pole. Nat. Commun. 2023, 14, 8250. [Google Scholar] [CrossRef] [Scilit] [PubMed]
  61. Huggel, C.; Kääb, A.; Haeberli, W.; Teysseire, P.; Paul, F. Remote sensing based assessment of hazards from glacier lake outbursts: A case study in the Swiss Alps. Can. Geotech. J. 2002, 39, 316–330. [Google Scholar] [CrossRef] [Scilit]
  62. Fujita, K.; Sakai, A.; Takenaka, S.; Nuimura, T.; Surazakov, A.B.; Sawagaki, T.; Yamanokuchi, T. Potential flood volume of Himalayan glacial lakes. Nat. Hazards Earth Syst. Sci. 2013, 13, 1827–1839. [Google Scholar] [CrossRef] [Scilit]
  63. Patel, L.K.; Sharma, P.; Laluraj, C.M.; Thamban, M.; Singh, A.; Ravindra, R. A geospatial analysis of Samudra Tapu and Gepang Gath glacial lakes in the Chandra Basin, Western Himalaya. Nat. Hazards 2017, 86, 1275–1290. [Google Scholar] [CrossRef] [Scilit]
  64. Sharma, A.; Hamlet, A.F.; Fernando, H.J.S.; Catlett, C.E.; Horton, D.E.; Kotamarthi, V.R.; Kristovich, D.A.R.; Packman, A.I.; Tank, J.L.; Wuebbles, D.J. The Need for an Integrated Land-Lake-Atmosphere Modeling System, Exemplified by North America’s Great Lakes Region. Earth’s Future 2018, 6, 1366–1379. [Google Scholar] [CrossRef] [Scilit]
  65. Cenderelli, D.A.; Wohl, E.E. Flow hydraulics and geomorphic effects of glacial-lake outburst floods in the Mount Everest region, Nepal. Earth Surf. Process. Landf. 2003, 28, 385–407. [Google Scholar] [CrossRef] [Scilit]
  66. Zheng, G.; Allen, S.K.; Bao, A.; Ballesteros-Cánovas, J.A.; Huss, M.; Zhang, G.; Li, J.; Yuan, Y.; Jiang, L.; Yu, T.; et al. Increasing risk of glacial lake outburst floods from future Third Pole deglaciation. Nat. Clim. Change 2021, 11, 411–417. [Google Scholar] [CrossRef] [Scilit]
  67. Tang, M.; Xu, Q.; Wang, L.; Zhao, H.; Wu, G.; Zhou, J.; Li, G.; Cai, W.; Chen, X. Hidden dangers of ice avalanches and glacier lake outburst floods on the Tibetan Plateau: Identification, inventory, and distribution. Landslides 2023, 20, 2563–2581. [Google Scholar] [CrossRef] [Scilit]
  68. Khromova, T.; Nosenko, G.; Nikitin, S.; Muraviev, A.; Popova, V.; Chernova, L.; Kidyaeva, V. Changes in the mountain glaciers of continental Russia during the twentieth to twenty-first centuries. Reg. Environ. Change 2019, 19, 1229–1247. [Google Scholar] [CrossRef] [Scilit]
  69. Hugonnet, R.; McNabb, R.; Berthier, E.; Menounos, B.; Nuth, C.; Girod, L.; Farinotti, D.; Huss, M.; Dussaillant, I.; Brun, F.; et al. Accelerated global glacier mass loss in the early twenty-first century. Nature 2021, 592, 726–731. [Google Scholar] [CrossRef] [Scilit] [PubMed]
  70. Ge, Y.; Cui, P.; Su, F.; Zhang, J.; Chen, X. Case history of the disastrous debris flows of Tianmo Watershed in Bomi County, Tibet, China: Some mitigation suggestions. J. Mt. Sci. 2014, 11, 1253–1265. [Google Scholar] [CrossRef] [Scilit]
  71. Wang, W.; Zhang, T.; Yao, T.; An, B. Monitoring and early warning system of Cirenmaco glacial lake in the central Himalayas. Int. J. Disaster Risk Reduct. 2022, 73, 102914. [Google Scholar] [CrossRef] [Scilit]
  72. Winsvold, S.H.; Kääb, A.; Nuth, C.; Andreassen, L.M.; van Pelt, W.J.J.; Schellenberger, T. Using SAR satellite data time series for regional glacier mapping. Cryosphere 2018, 12, 867–890. [Google Scholar] [CrossRef] [Scilit]
Figure 1. Location of the study area.
Geohazards 07 00097 g001
Figure 2. Comparison of indicators between all glacial lakes and outburst lakes: (a) lake volume; (b) distance from the parent glacier; (c) elevation; (d) the area of the parent glacier; (e) glacier tongue slope; (f) slope gradient near the lake; (g) temperature; (h) precipitation.
Geohazards 07 00097 g002
Figure 3. The workflow chart of the research.
Geohazards 07 00097 g003
Figure 4. (a) Distribution of glacial lakes in the study area. (b) Statistical chart of the number and area of different types of glacial lakes (data derived from the 2020 inventory).
Geohazards 07 00097 g004
Figure 5. Number of glacial lakes across different (a) areas and (b) elevations in 2020.
Geohazards 07 00097 g005
Figure 6. Spatial variations in glacial lake area in the study region from 1990 to 2020.
Geohazards 07 00097 g006
Figure 7. Variation in glacial lake number and area across the four epochs (1990, 2000, 2010, and 2020). (a) Variation in the number of glacial lakes; (b) variation in the area of glacial lakes; (c) expansion rates of glacial lakes of different size classes in terms of number; (d) expansion rates of glacial lakes of different size classes in terms of area.
Geohazards 07 00097 g007
Figure 8. Spatial distribution of GLOF susceptibility assessment results for glacial lakes in the study area, based on the 2020 inventory.
Geohazards 07 00097 g008
Figure 9. Statistics of GLOF susceptibility. (a) Distribution of susceptibility quantities across different sizes of glacial lakes. (b) Distribution of susceptibility quantities across different types of glacial lakes.
Geohazards 07 00097 g009
Figure 10. Each subplot shows the area evolution of an individual lake from 1990 to 2020. Decimal latitude and longitude coordinates [°N, °E] of each lake are provided in the lower right corner of each subplot. The inset map shows the spatial distribution of the 14 lakes and their potential outburst flood paths toward National Highways G219 and G318.
Geohazards 07 00097 g010
Figure 11. Sentinel-2 images of the 14 fastest-expanding glacial lakes with very high GLOF susceptibility from 1990 to 2024 (the locations of these lakes are shown in Figure 10).
Geohazards 07 00097 g011
Figure 12. Potential outburst directions and environmental characteristics of glacial lakes (a,c,e,g) potential outburst directions (b,d,f,h) Environmental characteristics around the corresponding lakes. The locations of these lakes are shown in Figure 10.
Geohazards 07 00097 g012
Figure 13. Time series of precipitation and temperature in the study area from 1970 to 2022. The temperature series shows a statistically significant warming trend (Z = 6.65, p < 0.001), with a Sen’s Slope of 0.045 °C/yr. The precipitation series shows no statistically significant trend (Z = 0.24, p ≥ 0.05), with a Sen’s Slope of 0.03 mm/yr.
Geohazards 07 00097 g013
Figure 14. Typical environmental characteristics of areas surrounding glacial lakes with high and very high GLOF susceptibility in the study area. (a) Upstream area of Ranwu Lake, showing five glacial lakes (b) Upstream channel of the Parlung Zangbo River, showing six glacial lakes (c) Area around Anzongnongba Co, showing five glacial lakes.
Geohazards 07 00097 g014
Figure 15. Schematic illustration of the amplification of GLOF risks due to the clustering of glacial lakes.
Geohazards 07 00097 g015
Table 1. Historical GLOF events in the study area and surrounding regions.
Location (°N,°E)Lake NameOutburst DatePrimary TriggerLake TypeReference
29.7543, 96.5571Gebuma Co12 June 1991Upstream outburstDetached[54]
29.4655, 96.5013Guangxie Co15 July 1988Ice avalancheProglacial[55]
30.8317, 93.9996Cuoga29 July 2009Ice avalancheProglacial[56]
30.6822, 94.3228Jitang South19 October 2003Ice avalancheProglacial[57]
30.4742, 93.5347Ranzeria Co5 July 2013Ice avalancheProglacial[38]
30.1281, 93.8980Sanga North8 November 1987Ice avalancheProglacial[57]
29.6272, 93.5608Ouguchongguo Co21 October 2004Retreat of ice damProglacial[54]
29.5813, 92.7903Baitang Weat9 October 1991Ice avalancheDetached[57]
29.7415, 96.2267Lumu Co8 June 1931Ice avalancheProglacial[25]
29.3634, 96.1238Anjue Zhuqulong glacier lake16 June 1992Ice avalancheProglacial[25]
30.0204, 95.5396Zhuxigou glacial Lake2 June 2019Ice avalancheProglacial[25]
29.7530, 96.4609Dagonglongba Co1 September 2005Retreat of ice damProglacial[54]
Table 2. Summary of area–volume relationships for glacial lakes.
No.FormulaApplicabilityReference
1 V = 0.104 × A 1.42 Swiss Alps[61]
2 { D m = 55 × A 0.25 V = A × D m                 Himalaya[62]
3 { D m = 4 × 10 5 × A + 5.0564 V = A × D m                                                                 Western Himalaya[63]
4 V = 0.0522 × A 1.1766 Himalaya[64]
5 V = 42.95 × A 1.408 Himalaya[60]
Note: A is the area of the glacial lake (km2), V is the lake volume (×106 m3), and Dm is the mean lake depth (m).
Disclaimer/Publisher’s Note: The statements, opinions and data contained in all publications are solely those of the individual author(s) and contributor(s) and not of MDPI and/or the editor(s). MDPI and/or the editor(s) disclaim responsibility for any injury to people or property resulting from any ideas, methods, instructions or products referred to in the content.