Article

Climate Teleconnection Indices and Their Influence on Wildfire Activity in Serbia
1
Faculty of Forestry, University of Belgrade, 11000 Belgrade, Serbia
2
Faculty of Hotel Management and Tourism, University of Kragujevac, 36210 Vrnjačka Banja, Serbia
3
Geographical Institute “Jovan Cvijić”, Serbian Academy of Sciences and Arts, 11000 Belgrade, Serbia
*
Author to whom correspondence should be addressed.
GeoHazards 2026, 7(4), 102; https://doi.org/10.3390/geohazards7040102
Submission received: 10 June 2026 / Revised: 17 August 2026 / Accepted: 20 August 2026 / Published: 24 August 2026

Abstract

This study presents an integrated statistical framework for identifying representative large-scale climate teleconnection indices associated with total burned area and for supporting the selection of climate predictors in wildfire-related statistical models. A large set of seasonally resolved climate indices, including the North Atlantic Oscillation (NAO—two versions), the Arctic Oscillation (AO), the Atlantic Multidecadal Oscillation (AMO), the Mediterranean Oscillation (MO—two versions), the East Atlantic–West Russia pattern (EAWR), the Tropical North Atlantic (TNA), and the Atlantic Meridional Mode (AMM), was examined. Because many of these indices describe related atmospheric and oceanic processes, dimensionality reduction and predictor selection were required to limit multicollinearity. Principal component analysis (PCA) was first used to identify groups of interrelated climate indices, followed by partial correlation analysis to distinguish redundant predictors from those retaining independent information with respect to total burned area. Finally, LASSO regression was applied to evaluate the relative explanatory contribution of candidate indices and to perform automatic variable selection. The PCA solution identified ten rotated components explaining 82.31% of the total variance. The results indicate that several seasonal NAO and MO indices contain highly overlapping information, whereas selected indices, particularly MOI2 spring and MOI2 summer, retain comparatively stronger independent associations with total burned area. The integrated PCA–partial correlation–LASSO framework provides a systematic approach for reducing redundant climate predictors and identifying large-scale climate signals that may be informative for understanding variability in total burned area and for supporting statistical analyses of wildfire–climate relationships.

1. Introduction

In Serbia, forest fires represent a severe ecological and economic problem. Nevertheless, in terms of forest fires, Serbia does not belong to the most threatened countries in Europe, such as Portugal, Spain, France, Italy, and Greece [1,2]. According to official data, in Serbia (no data for AP Kosovo and Metohija), in the period 1970–2022, forest fires covered a total area of 82,274 ha (yearly average 1789 ha). The maximum was recorded in 2007 when 22,000 ha were burned, and the minimum was in 2005 (52 ha). In the 21st century, the worst forest fire seasons were in summer 2007 and 2012 [3].
Of the total area under forests in Serbia (2,252,400 ha), only 9.3% is under conifer stands [4]. Regardless of the relatively small presence of conifer species threatened by fire, the affected wood volume can be measured in tens of thousands of m3.
Research on the connection between climate and forest fires in Serbia in recent years was mainly based on the influence of temperature and precipitation [5], drought [6], and humidity [7,8], as well as extreme climatic conditions [9], but there is little research dealing with the influence of teleconnections. In general, the term teleconnection denotes the link between weather patterns and changes occurring in widely separated regions of the globe [10]. El Niño-Southern Oscillation (ENSO) teleconnections are an important predictability source for extratropical seasonal climate forecasts [11]. The link between ENSO and forest fires has been confirmed, among other regions, for Florida, USA [12], Mexico [13], Australia [14,15], Indonesia [16], and Chile [17]. In the southwestern (southeastern) USA, El Niño is associated with a later (earlier) wildfire season peak [18]. In California, the wildfire risk is heightened during specific BSISO phases, La Niña, and cool PDO [19]. As for Southern California, high values of burned area are significantly associated with severe droughts and Santa Ana winds, and they are connected with climate teleconnections (coupled effects of ENSO and AMO) [20].
As for other teleconnections, the Arctic Oscillation (AO) induces higher fire risk in northern Eurasia and central North America, and the Pacific-North American pattern (PNA) increases the fire danger across southern Asia and western North America [21]. It has been determined that there is a positive correlation between the Atlantic Multidecadal Oscillation (AMO) and national time series of extensive fires (≥10,000 ha), wildfire-related evacuations, and fire suppression expenditures in Canada (1975–2007). Still, there were also influences of AO and the Pacific Decadal Oscillation (PDO) [22]. The impact of AMO on fires in boreal forests has been determined for Northeast China [23]. In Europe, the connection between AMO and forest fires has been confirmed for France [24] and Portugal [25]. In Finland, there is a connection between the North Atlantic Oscillation (NAO) and forest fires [26]. In Romania, the influence of the Mediterranean Oscillation (MO) on forest fires has been confirmed [27].
The influence of teleconnections on forest fires in Serbia is primarily manifested through their effects on temperature, humidity, and precipitation. These factors play a significant role both immediately before and during wildfire events. High temperatures, low humidity, and the absence of precipitation create favorable conditions for fire ignition and accelerate fire spread. In addition, these climatic factors also affect the formation and persistence of surface fuels. In fires occurring at the beginning of the year, before the onset of the vegetation period, surface fuel also includes grass cover formed during the previous year. The amount of grassy vegetation depends both on summer conditions—since high temperatures and drought can inhibit vegetation growth—and on conditions after the vegetation period, when rainfall and snowfall contribute to its reduction.
NAO and AO have a significant influence on weather conditions in Serbia. The positive phase of the NAO is associated with higher temperatures and reduced precipitation, while the negative phase is linked to lower temperatures and increased precipitation [28]. NAO and AO have a strong influence on the precipitation regime in Serbia, especially during the winter season [29].
Bearing in mind the above, the main goal of this research was to determine the impact of teleconnections on forest fires in Serbia. This type of connection has already been confirmed for some areas in Serbia. For Deliblatska peščara, a connection between AMO and the annual number of fires was determined [30].
Large-scale atmospheric and oceanic circulation patterns can affect regional climate conditions over broad spatial and temporal scales. Climate indices such as the North Atlantic Oscillation (NAO), the Arctic Oscillation (AO), the Atlantic Multidecadal Oscillation (AMO), the Mediterranean Oscillation (MO), the East Atlantic–West Russia pattern (EAWR), the Tropical North Atlantic (TNA) and the Atlantic Meridional Mode (AMM) describe different modes of climate variability that may influence temperature, precipitation, atmospheric circulation, and moisture availability. Their effects on wildfire activity may vary seasonally, reflecting differences in the timing and strength of atmospheric circulation processes and their influence on regional fire-weather conditions. The research in the Western Mediterranean has demonstrated that large-scale atmospheric teleconnection patterns, particularly the NAO and Mediterranean-related circulation patterns, can significantly influence wildfire occurrence, burned area, and fire size, although their effects differ spatially and temporally across the region [31].
However, the simultaneous use of a large number of climate indices in predictive models presents an important methodological challenge. Many climate indices are strongly correlated because they describe related or overlapping atmospheric and oceanic processes. Including highly correlated predictors in regression models can result in multicollinearity, unstable parameter estimates, and difficulties in identifying the actual contribution of individual climate drivers. This issue is particularly relevant when several indices describe similar climate variability at different temporal or seasonal scales. Therefore, the identification of representative predictors that retain the largest amount of independent information is an important step in developing robust predictive models of wildfire activity.
A further challenge arises from the fact that simple correlation analyses cannot adequately distinguish between independent and redundant climate signals. A strong correlation between a climate index and burned area does not necessarily indicate that the index provides unique predictive information, particularly when it is strongly correlated with other climate indices. Consequently, a methodological framework that combines dimensionality reduction, assessment of conditional relationships, and multivariable predictor selection may provide a more reliable basis for identifying the dominant climate drivers of burned area [32].
In this context, principal component analysis (PCA) provides an effective approach for reducing the dimensionality of correlated climate predictors and identifying groups of indices that represent common underlying patterns of climate variability [33]. However, PCA alone does not determine which individual climate index within a component provides the greatest independent explanatory value for burned area. Partial correlation analysis can complement PCA by evaluating the relationship between a given climate index and burned area while controlling for the influence of another correlated index. This allows potentially redundant predictors to be distinguished from variables that retain an independent association with the response variable.
Nevertheless, partial correlation analysis is inherently limited because it primarily evaluates relationships between variables on a pairwise basis and does not quantify the simultaneous contribution of multiple predictors within a common predictive framework. To overcome this limitation, the Least Absolute Shrinkage and Selection Operator (LASSO) regression provides a useful complementary approach. By applying regularization and automatic variable selection simultaneously, LASSO can identify predictors that retain the greatest predictive value when all candidate variables are considered jointly [34,35]. The combination of PCA, partial correlation analysis, and LASSO therefore provides a hierarchical framework in which correlated climate indices are first grouped according to their underlying variability, subsequently evaluated in terms of their independent information, and finally assessed within a multivariable predictive model.
The aim of this study was therefore to identify representative climate indices associated with total burned area and to develop a robust predictive framework for assessing the contribution of large-scale climate variability to wildfire activity. Specifically, the study sought to (1) identify groups of highly correlated climate indices using PCA, (2) distinguish redundant from independently informative indices using partial correlation analysis, and (3) determine which climate predictors retain the greatest predictive contribution when considered simultaneously using LASSO regression. By integrating these complementary statistical approaches, the study provides a systematic strategy for reducing multicollinearity, improving predictor selection, and identifying the dominant large-scale climate signals associated with variations in burned area.

2. Materials and Methods

2.1. Study Area

Serbia is located in the central part of the Balkan Peninsula and occupies an important geographical position at the crossroads of major European natural and transportation routes. Its territory connects the Pannonian Plain with the Carpathian–Balkan mountain system, as well as Central Europe with the Aegean and Adriatic Seas [36,37]. The country covers an area of 88,361 km2, and its largest urban centers are Belgrade (the capital), Novi Sad, Niš, and Pristina.
In terms of relief, Serbia is characterized by pronounced geomorphological diversity, divided into three main physiographic units: the northern lowland region, the central hilly and mountainous belt, and the southern high-mountain areas. The northern part of the country is occupied by the Pannonian Plain, which covers most of the Autonomous Province of Vojvodina. Central Serbia is dominated by the hilly and mountainous landscape of Šumadija [37], while the southern part includes prominent mountain ranges such as Kopaonik, Stara Planina, Prokletije, and Šar Planina. Elevation ranges from only 28 m above sea level to a maximum of 2660 m [37].
Most of Serbia’s river network belongs to the Danube River basin. The Danube, the country’s most important watercourse, flows for approximately 588 km through Serbia and is one of Europe’s major international navigation corridors. Other important rivers include the Sava, Tisa, Drina, Ibar, and Velika Morava [37]. Serbia has a predominantly temperate continental climate with well-defined seasons. Winters are generally cold and snowy, whereas summers are warm and relatively dry. Mountainous regions experience a cooler subalpine climate, while the Pannonian Plain exhibits a typical continental climate with more pronounced temperature fluctuations [38]. From the perspective of land use and wildfire analysis, according to the 2022 satellite-based land use dataset, forests cover approximately 40% of Serbia’s territory, making wildfire research an important component of environmental management.
The combination of diverse climatic, geological, and hydrological conditions has led to high biodiversity and the development of numerous protected natural areas.
The research covers the period 1970–2022 and refers to the territory of the Republic of Serbia without the autonomous province of Kosovo and Metohija (there are no data after 1998). The lack of data from 1999 to the present in Kosovo and Metohija stems from the province’s temporary United Nations administration under Security Council Resolution 1244, as well as the absence of reliable and consistent forestry datasets [36]. In particular, official data regarding forest-growing stock and timber volume are not available for the territory of Kosovo and Metohija. According to available land cover assessments derived from satellite images from 2024, approximately 5120 km2 of the territory is covered by forests [37,38]. However, comprehensive forest inventory data remain inaccessible. The unavailability of these data is primarily related to the specific political and administrative situation, as Serbian forestry institutions and services responsible for forest management do not have access to official records, monitoring systems, or field investigations within the territory of Kosovo and Metohija. Consequently, it was not possible to obtain harmonized and verified forestry data necessary for inclusion in the present analysis.
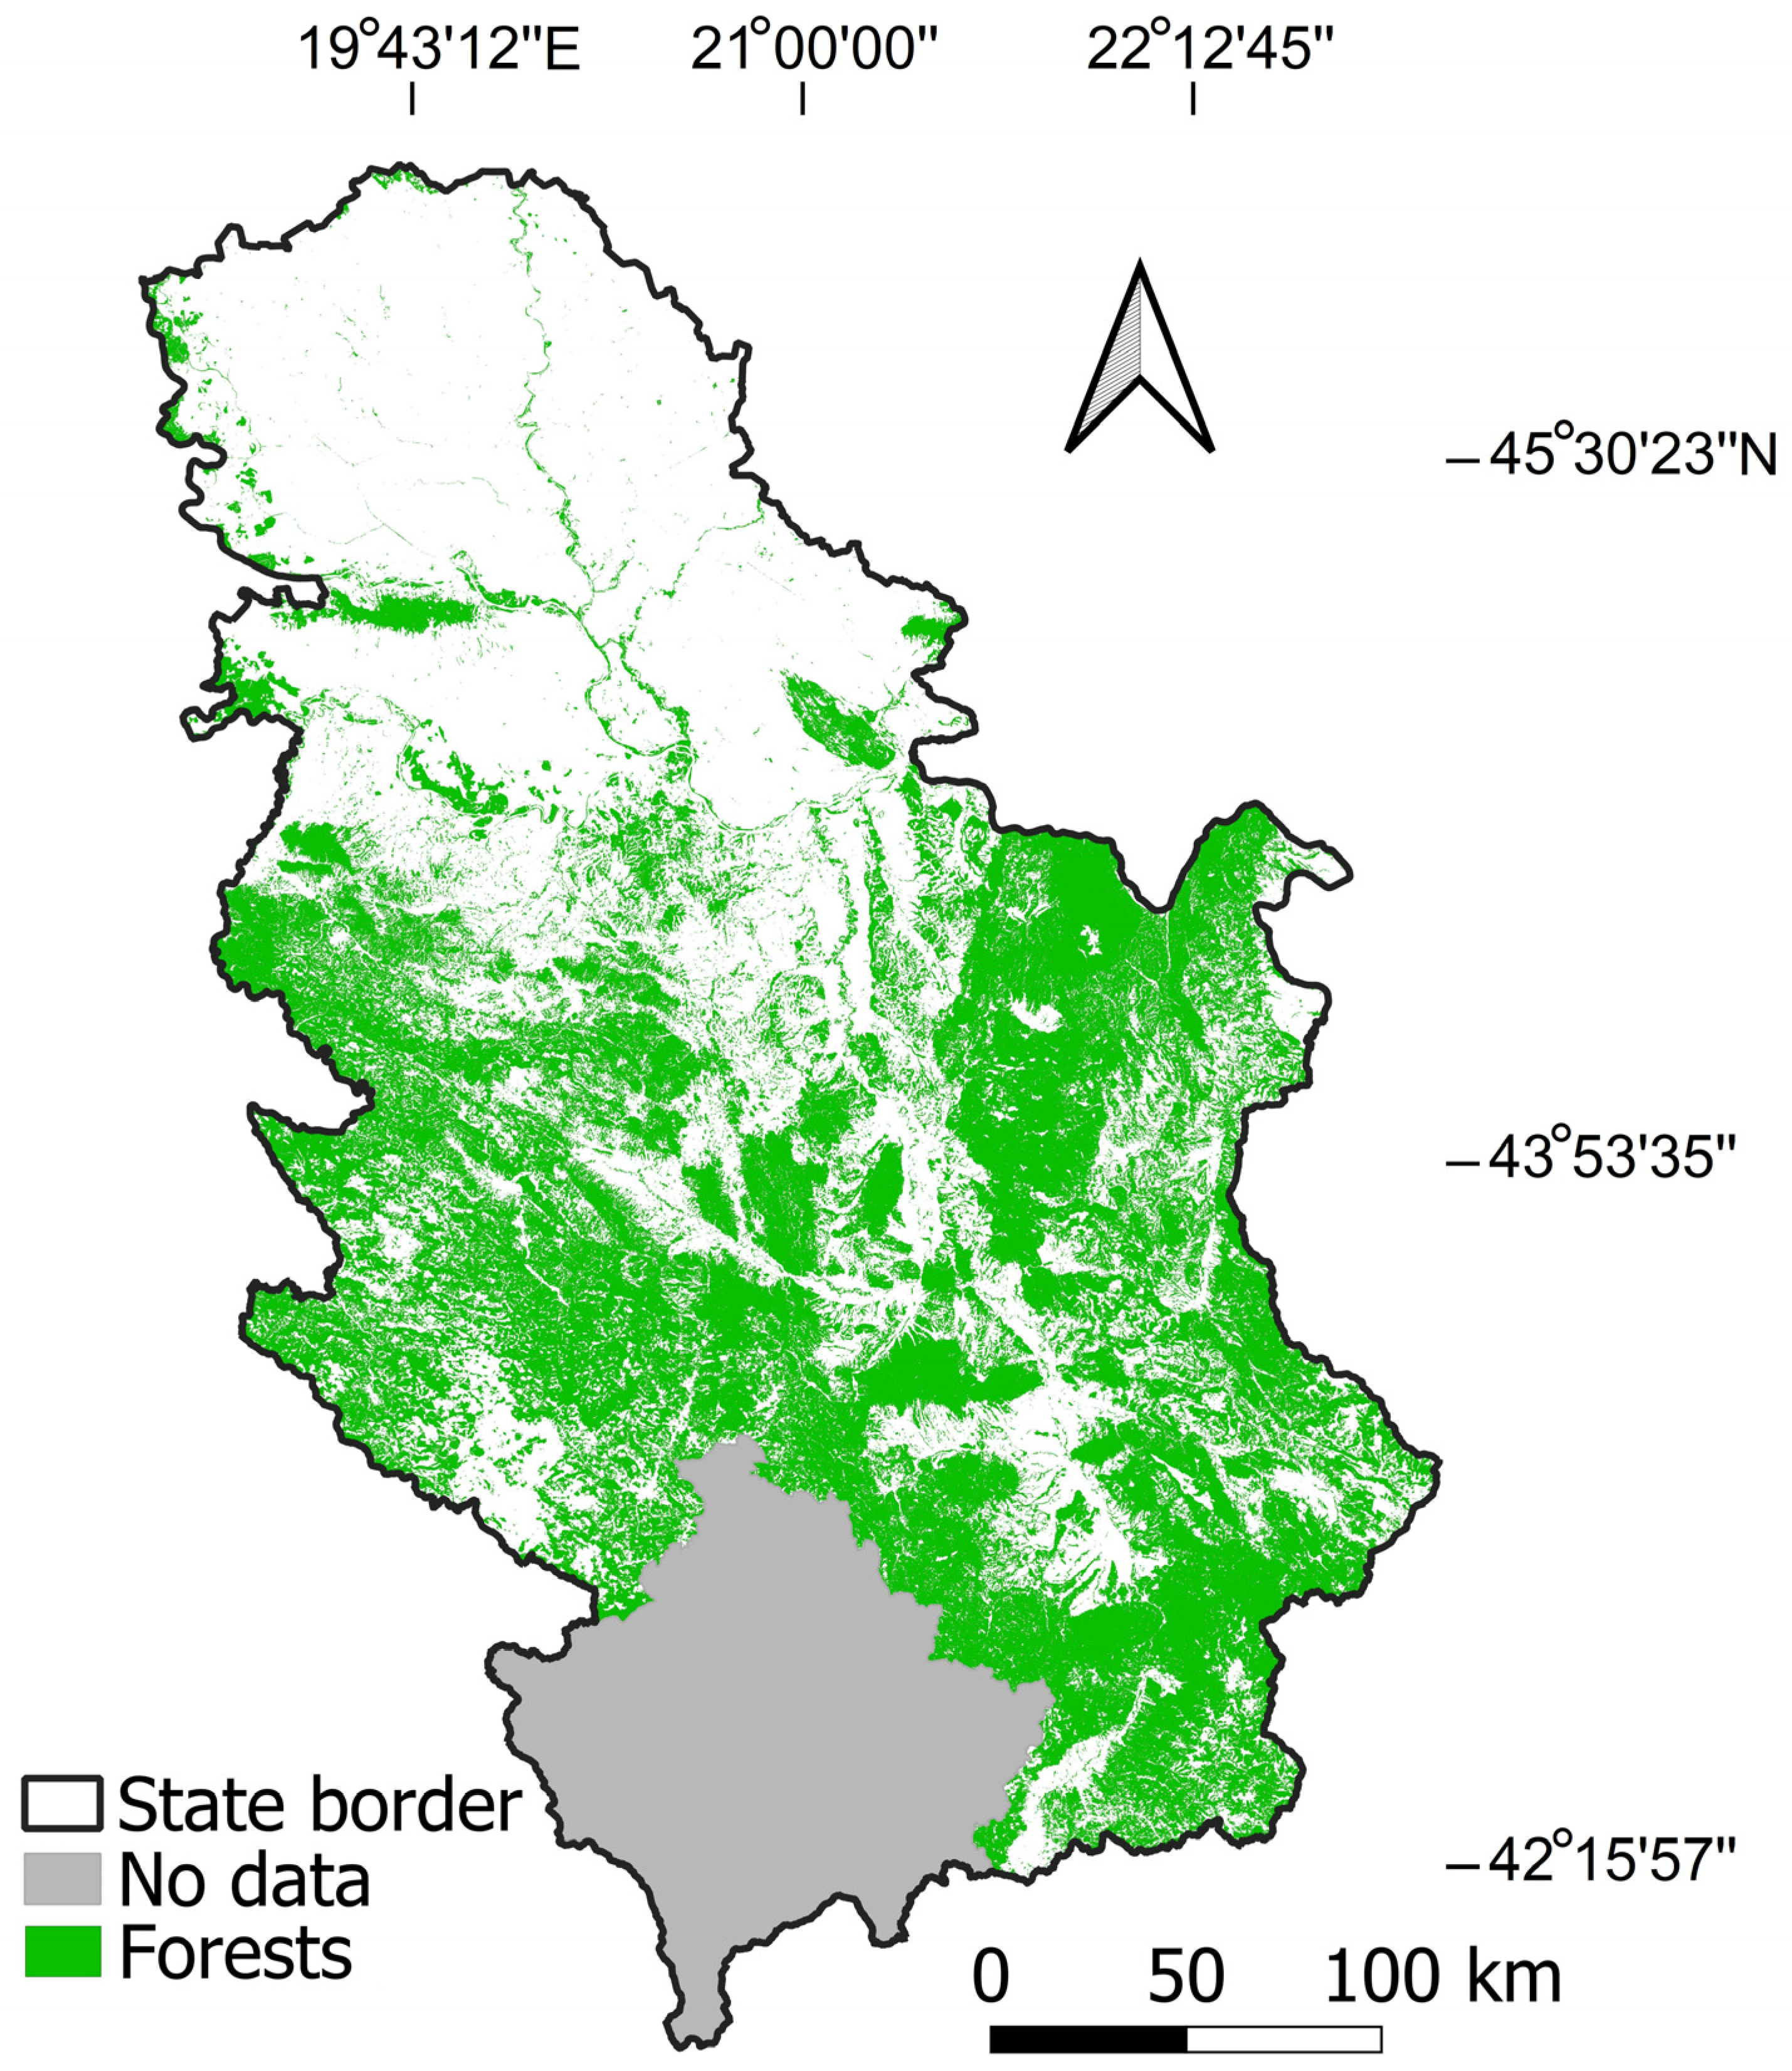
The area under forest in Serbia amounts to 2,252,400 ha (78.3% hardwood, 9.3% conifers and 2.4% mixed hardwood-conifers stands). The most common tree species are beech—Fagus sylvatica (29.3%) and Turkey oak—Quercus cerris (15.3%). Of the conifers, the most common are pines—Pinus spp. (5.6%), while spruce—Picea abies accounts for 3.8% [4]. These data refer to the year 2007 when the forest cover in Serbia was close to 30%. The largest areas under forest are in the central, western, eastern, and southern parts, while in the northern lowland areas (autonomous province of Vojvodina), the forests are less represented.

2.2. Data

The data on forest fires in Serbia include the total annual burned area (ha), as well as the total annual damage to wood volume (m3) and the source is the Statistical Office of the Republic of Serbia [3]. A particular problem in this research was the lack of more detailed official data on forest fires. In addition, monthly data do not exist, and annual data are only for the burned area and wood volume. Data on the number of fires, types of fire, causes, localities, species, etc., are missing. This kind of data could most likely be found in local forestry organizations, but they often collect the data on their own way. One of the important goals of this paper is to address this problem and to propose much more accurate data collection.
For the purposes of this study, only data on the total annual burned area were used. Data on the total annual damage to wood volume were not taken into consideration because they were primarily obtained from forestry organization reports and may not accurately reflect the actual conditions in the field.
For the purposes of creating Figure 1, vector data of state and provincial boundaries were obtained from the Geosrbija portal [39]. Data on forest coverage were generated from the geospatial database of Environmental Systems Research Institute (ESRI) for the year 2022 [40]. The map was created using the open-source software package QGIS 3.40.9 with GRASS [41].
Seasonal values of the teleconnection indices were used in the research. They were obtained as average of 3 monthly values of the season and they are indicated by adding “winter”, “spring”, “summer” and “autumn” or abbreviations “w”, “sp”, “su” and “a”. The data included the values of the same year (January to August) as well as for the previous year (June to December). The reason why the January-August period was taken for the current year is that the fire season practically ends with August. Although forest fires occur throughout the year, the main fire season is July August, when there are both the largest number of fires and the greatest damage from them. Data from the previous year (July December) were taken into consideration, bearing in mind their influence on the state of fuel material. Namely, it depends on the weather how long the ground fuel material will last until the next year. First of all, the amount of grass cover in the form of ground fuel material depends on the temperature and precipitation during the summer. During autumn and winter, its presence is most affected by the amount of snow cover. Furthermore, by retaining this cover and gradually melting the snow, favorable conditions are created for the decomposition of biomass. In this way, the ground fuel material disappears. These processes can continue until the appearance of a new grass cover at the beginning of the new vegetation.
Following teleconnections (climate indices) were used in the research:
  • NAO—North Atlantic Oscillation [42,43];
  • AO—Arctic Oscillation [44];
  • AMO—Atlantic Multidecadal Oscillation [45];
  • MO—Mediterranean Oscillation [46,47];
  • EA/WR—Eastern Atlantic/Western Russia [48];
  • TNA—Tropical Northern Atlantic Index [49];
  • AMM—Atlantic Meridional Mode [50].
Two different datasets were used for the NAO index. The first one, marked as NAO, was calculated based on the difference in sea surface air pressure between Iceland (low air pressure) and the Azores (high) [51]. The other one (NAO Jones) is defined as the normalized pressure difference between Gibraltar and Reykjavik (Iceland) [52]. The NAO positive phase is generally associated with stronger westerly winds, warmer and wetter winters in northern Europe, and drier conditions over the Mediterranean region [53].
The AO describes the dominant pattern of atmospheric circulation over the Northern Hemisphere, reflecting variations in sea-level pressure between the Arctic and the mid-latitudes. During its positive phase, stronger polar vortex circulation tends to confine cold air to high latitudes, whereas the negative phase allows cold Arctic air to penetrate farther south. Consequently, AO significantly affects winter temperature and precipitation anomalies and can influence the occurrence of climate-related hazards such as droughts and wildfires [54].
The AMO is calculated on the basis of a natural variation in SST (sea surface temperature) in the northern Atlantic Ocean [55]. Positive AMO phases are generally associated with warmer North Atlantic waters, altered atmospheric circulation, and changes in precipitation and temperature patterns over Europe and North America [56,57].
There were also two datasets for MO. The first one, MOI is established as the normalized pressure difference between Algiers and Cairo. The other one, MOI2, is calculated from Gibraltar’s Northern Frontier and Lod Airport in Israel. The MO describes atmospheric circulation variability over the Mediterranean region based on sea-level pressure differences. It is associated with variations in temperature, precipitation, and drought conditions across the Mediterranean Basin [58,59].
The EA/WR pattern is a major atmospheric teleconnection in the Northern Hemisphere, characterized by geopotential height anomalies extending from the North Atlantic to western Russia. It influences large-scale atmospheric circulation and affects temperature and precipitation variability across Europe, western Asia, and the Mediterranean, with the strongest impacts typically occurring during winter [60].
The TNA Index represents sea surface temperature anomalies over the tropical North Atlantic Ocean. It influences atmospheric circulation, moisture transport, and precipitation variability across the Atlantic basin, particularly affecting the climate of the Caribbean, Central America, and West Africa [61].
The AMM is a coupled ocean–atmosphere mode characterized by a meridional gradient in sea surface temperature and surface wind anomalies across the tropical Atlantic. It influences rainfall variability, the position of the Intertropical Convergence Zone (ITCZ), and tropical cyclone activity, making it one of the primary modes of climate variability in the tropical Atlantic [62].

2.3. Methodology

2.3.1. Climate Indices and Data Preparation

The analysis was designed to examine the statistical associations between large-scale climate variability and total burned area using a set of climate indices representing different modes of atmospheric and oceanic variability. The predictor set included seasonally resolved variants of the North Atlantic Oscillation (NAO—two versions), the Arctic Oscillation (AO), the Atlantic Multidecadal Oscillation (AMO), the Mediterranean Oscillation (MO—two versions), the East Atlantic–West Russia pattern (EAWR), the Tropical North Atlantic (TNA), and the Atlantic Meridional Mode (AMM). Seasonal variants were retained because the influence of large-scale circulation patterns on fire-weather conditions may differ substantially between winter, spring, summer, and other seasons.
Prior to multivariable statistical analysis, the climate-index dataset was screened for intercorrelation and dimensionality. Because multiple indices may represent overlapping aspects of the same large-scale climate variability, the analysis followed a sequential variable-selection strategy consisting of principal component analysis (PCA), partial correlation analysis, and LASSO regression. The response variable was total burned area.
To ensure comparability among predictors measured on different scales, climate indices were treated as standardized predictors where required for the regression analysis. The final manuscript should report the exact study region, observation period, source of burned-area data, source of climate-index data, temporal aggregation procedure, and any data-quality or missing-value treatment applied to the original dataset.

2.3.2. Principal Component Analysis (PCA)

Principal component analysis was applied to reduce the dimensionality of the climate-index dataset and to identify groups of variables representing common underlying patterns of climate variability. The suitability of the correlation matrix for PCA was assessed using Bartlett’s test of sphericity. The test was statistically significant, χ2(315) = 683.524, p < 0.001, indicating that the correlation matrix differed significantly from an identity matrix and that sufficient shared variance existed among the climate indices to justify dimension reduction.
A promax rotation was applied to facilitate interpretation of the resulting components. Because oblique rotation allows components to remain correlated, it is appropriate for climate indices that may be influenced by related large-scale circulation processes. Components were interpreted primarily on the basis of their dominant factor loadings and the seasonal structure of the indices assigned to each component.

2.3.3. Partial Correlation Analysis

Partial correlation analysis was subsequently used to determine whether individual climate indices within correlated groups retained an independent statistical association with total burned area. For each selected pair of strongly associated climate indices, the zero-order correlation between each predictor and burned area was compared with the corresponding partial correlation after controlling for the other predictor. A large reduction in the correlation after controlling for the second index was interpreted as evidence of overlapping statistical information, whereas a relatively stable partial correlation was interpreted as evidence that the index retained an independent association with total burned area.
This step complemented PCA by moving from the identification of statistically correlated groups to the assessment of their statistical associations with total burned area. The analysis was therefore used as a screening procedure for selecting representative indices before joint multivariable modelling.

2.3.4. LASSO Regression

The Least Absolute Shrinkage and Selection Operator (LASSO) regression was applied as the final variable-selection and regularization step. Unlike pairwise partial correlations, LASSO evaluates all candidate climate indices simultaneously while shrinking weak or redundant regression coefficients toward zero. This allows the method to identify a parsimonious subset of climate indices that retains non-zero regression coefficients after accounting for correlations among the candidate variables.
The LASSO model can be expressed conceptually as an ordinary least-squares loss function combined with an L1 penalty on the regression coefficients. The regularization parameter controls the strength of coefficient shrinkage. The optimal value of the regularization parameter should be selected using a predefined cross-validation procedure, and the final model should report the selected penalty parameter, non-zero coefficients, and regression coefficients and associated model diagnostics.

2.3.5. Integrated Statistical Framework

The analytical framework consisted of three sequential stages. First, PCA was used to identify latent groups of interrelated climate indices and to reduce the dimensionality of the predictor space. Second, partial correlation analysis was used to identify redundant indices and to select variables retaining independent information within the identified groups. Third, LASSO regression was applied to evaluate the remaining climate indices jointly within a regularized multivariable statistical model and to identify variables retaining non-zero regression coefficients after accounting for multicollinearity. This hierarchical strategy was designed to reduce multicollinearity while retaining representative climate indices that capture complementary statistical information related to total burned area.

3. Results and Discussion

3.1. Identification of Climate Variability Patterns Using PCA

The PCA results confirmed substantial shared variance among the climate indices. Bartlett’s test of sphericity was significant, χ2(315) = 683.524, p < 0.001, demonstrating that the correlation matrix was not an identity matrix and supporting the suitability of PCA for the dataset.
Ten rotated components were retained and together explained 82.31% of the total variance. The first component explained 24.83% of the variance after rotation, while the second and third components explained 13.33% and 6.99%, respectively. The cumulative variance explained by the first five rotated components was 57.55%, increasing to 63.72% after the sixth component and reaching 82.31% after the tenth component.
The loading structure revealed several interpretable groups of climate indices. The first component was dominated by AMO, TNA, AMM, and EAWR-related indices, indicating a broad North Atlantic climate-variability signal. The second component was strongly associated with winter NAO, AO, and MO indices, including NAOJ winter, MOI2 winter, NAO winter, MOI winter, and AO winter. The third component was dominated by spring MOI and NAO indices, particularly MOI2 spring and MOI spring, while the fourth component was characterized primarily by summer MOI indices, MOI2 summer and MOI summer. The sixth component represented a summer NAO/AO group, with strong loadings for AO summer, NAO summer, and NAOJ summer.
These results demonstrate that the original set of climate indices contains several clusters of strongly interrelated variables. For example, the winter NAO–MOI group is characterized by very high loadings across several indices, while the summer MOI group similarly shows strong loadings. Such patterns suggest that the inclusion of every index in a conventional regression model could introduce substantial multicollinearity. PCA therefore provided the first stage of predictor reduction by revealing the latent structure of the climate-index dataset (Table 1).

3.2. Identification of Redundant and Independent Climate Indices Using Partial Correlations

Partial correlation analysis was used to refine the PCA-based grouping by determining whether individual indices within the same component retained comparatively independent statistical information related to total burned area. The results revealed three characteristic patterns of predictor relationships.
The first pattern involved groups with very high mutual correlations. For the AMO/TNA/AMM indices and the winter NAO–MO block, controlling for one index substantially reduced or nearly eliminated the association of the other index with total burned area (Table 2). The NAOJ winter –MOI2 winter pair was particularly informative, with a mutual correlation of r = 0.831 (p < 0.001). After controlling for MOI2 winter, the partial correlation between NAOJ winter and burned area decreased from r = 0.182 to r = 0.023. Conversely, controlling for NAOJ winter reduced the MOI2 winter correlation from r = 0.203 to r = 0.095. This asymmetry suggests that the two indices contain a large amount of overlapping climate information, while MOI2 winter may retain a somewhat larger portion of the relevant climate variability information.
The second pattern was observed for the summer MO indices identified in RC4. MOI2 summer and MOI summer were strongly correlated (r = 0.705; p < 0.001). After controlling for MOI2 summer, the correlation between MOI summer and total burned area decreased from r = 0.174 to r = 0.041. In contrast, controlling for MOI summer reduced the MOI2 summer correlation from r = 0.207 to r = 0.121. This result indicates that MOI2 summer retained more independent information, whereas MOI summer largely overlapped with the signal represented by MOI2 summer. This interpretation is consistent with the PCA structure, where MOI2 summer showed the largest loading within RC4 (1.044).
The third pattern involved the RC3 spring indices. MOI2 spring and NAOJ spring were moderately correlated (r = 0.402; p = 0.003). However, controlling for NAOJ spring had virtually no effect on the correlation between MOI2 spring and burned area, which changed only from r = 0.245 to r = 0.244. By contrast, controlling for MOI2 spring eliminated the already weak relationship between NAOJ spring and burned area, reducing it from r = 0.055 to r = −0.049. This asymmetry suggests that MOI2 spring carries stronger independent statistical association within RC3, consistent with its largest factor loading of 1.094 (Table 3).
Taken together, PCA and partial correlation analysis produced a coherent variable-selection structure. PCA identified groups of indices representing common climate variability, while partial correlations helped distinguish redundant indicators from those retaining independent information relevant to burned area. The results support the use of representative indices rather than including every highly correlated climate variable in the subsequent multivariable statistical analysis.

3.3. LASSO Regression and Predictive Contribution of Climate Indices

The LASSO stage was designed to provide a final multivariable assessment of the relative importance of climate indices within the regularized statistical model after the initial dimensionality reduction and partial-correlation screening. Whereas PCA describes the internal structure of the climate predictors and partial correlations evaluate conditional pairwise relationships, LASSO evaluates the remaining candidate variables simultaneously. This makes it particularly useful for determining whether the representative indices selected from the PCA components retain non-zero regression coefficients after accounting for the remaining variables when competing climate signals are considered together.
It is important to emphasize that the LASSO analysis is used here as an exploratory variable-selection tool rather than as a predictive modelling framework. The primary objective is to identify which climate indices retain statistical importance within the analysed dataset after regularization, not to develop a model with demonstrable forecasting skill. The regularization parameter was selected using cross-validation to balance model complexity and in-sample fit, but the resulting model has not been evaluated on independent data, nor has its predictive performance been assessed through out-of-sample validation. Consequently, the non-zero coefficients reported in Table 4 should be interpreted as indicative of conditional statistical associations within the observed dataset, not as evidence that the selected variables would perform well in forecasting future burned area.
The LASSO results should therefore be interpreted in conjunction with the previous analyses rather than as an isolated variable-selection procedure. Predictors that remain non-zero in the LASSO model after regularization can be considered to have the largest relative contribution within the regularized multivariable model among the candidate variables in this particular dataset. Conversely, variables whose coefficients are shrunk to zero can be interpreted as providing limited additional statistical information once the retained predictors are accounted for. This provides an additional layer of evidence for the representative-index selection derived from PCA and partial correlation analysis, but it does not imply that the selected set is optimal for prediction or that the model would generalize to other time periods or regions.
The regularized regression coefficients reveal several clear patterns that strongly support the previous PCA and partial correlation analyses. The largest absolute coefficients are associated with the Atlantic Multidecadal Oscillation (AMO) indices, particularly AMO spring (β = 28,329.53), AMO summer (β = −26,151.47), AMO autumn (β = 22,333.66) and AMO winter (β = −13,879.60). These variables belong to the first principal component (RC1), previously identified as the principal climate variability component identified by PCA. Their consistently large coefficients indicate that multidecadal Atlantic variability represents one of the strongest statistical associations with burned area within the regularized model on burned area.
Within the winter circulation component (RC2), MOI2 winter (β = 11,080.29) exhibited a substantially larger contribution than NAOJ winter (β = −1876.63). This finding is fully consistent with the partial correlation analysis, where MOI2 winter retained its relationship with burned area after controlling for NAOJ winter, whereas the reverse relationship almost completely disappeared. Consequently, MOI2 winter appears to represent the representative winter circulation index showing a comparatively stronger association with burned area.
The results obtained for the spring circulation component (RC3) show a similar pattern. MOI2 spring (β = 13,984.16) remained one of the variables with the largest regularized coefficients in the model, whereas NAOJ spring had already been eliminated during model regularization. This agrees with the partial correlation analysis, which demonstrated that MOI2 spring retained its statistical association independently of NAOJ spring, confirming MOI2 spring as the representative variable of the spring circulation pattern.
Within the summer circulation component (RC4), both MOI summer (β = 13,381.26) and MOI2 summer (β = −16,080.13) retained relatively large coefficients. Although partial correlation analysis suggested that MOI2 summer preserved a greater proportion of independent information than MOI summer, the simultaneous estimation performed by LASSO indicates that both variables still retain non-zero coefficients in the multivariable statistical model. This suggests that, despite their shared variance, each variable captures part of the summer circulation variability that becomes relevant when all climatic predictors are considered simultaneously.
Finally, TNA indices also remained influential, particularly TNAJ (β = −15,720.29) and TNA winter (β = −6219.57), indicating that tropical Atlantic variability remains represented in the regularized model.
The final regularized regression model describing the statistical relationship between total burned area and the selected climate indices:
Y ^ = 6878.15 + i = 1 22 β i Z i ,
where
  • Z i = the standardized value of the climate index (z-score),
  • β i = the regularized LASSO coefficient.
Focusing on the climate indices with the largest absolute coefficients, emphasizing the variables with the largest absolute coefficients, the model is: β > 10,000
Y ^ 6878.15 + 28,329.53   A M O s p 26,151.47   A M O s u + 22,333.66   A M O a 16,080.13   M O I 2 s u + 13,984.16   M O I 2 s p + 13,381.26   M O I s u 15,720.29   T N A a 13,879.60   A M O w 11,936.44   M O I s p + 11,080.29   M O I 2 w +
The combined results indicate that the climate indices most strongly retained within the regularized model are not necessarily those with the strongest simple correlations with burned area. Instead, relative contribution within the statistical model depends on the extent to which an index provides information that is not already represented by other correlated climate variables. This is the central advantage of combining PCA, partial correlations, and LASSO in a single analytical framework.

3.4. Consistency Between PCA, Partial Correlations, and LASSO

The three analytical stages provide complementary information and, when interpreted together, form a coherent integrated statistical framework. PCA identifies the latent structure of the climate-index system; partial correlation analysis evaluates whether individual variables within those latent groups retain independent associations with burned area; and LASSO determines which climate indices retain non-zero coefficients when considered jointly in a multivariable model.
The strongest consistency is observed for the winter NAO–MOI group and the summer MOI group. In both cases, PCA revealed strongly clustered indices, while partial correlation analysis demonstrated substantial redundancy among individual predictors. The results therefore support the selection of a representative index rather than the simultaneous inclusion of all members of a highly correlated group. The spring RC3 group provides a complementary example, where MOI2 spring retained a stable relationship with burned area after controlling for NAOJ spring, supporting its interpretation as the representative climate index.
From a modelling perspective, this integrated approach reduces the risk that the final multivariable statistical model is dominated by multiple versions of the same underlying climate signal. It also improves interpretability because each retained predictor can be linked to a broader climate-variability component identified by PCA. The resulting framework is therefore useful not only for statistical analysis of climate–burned area relationships but also for interpreting the large-scale climate processes associated with wildfire variability.

3.5. Implications for Wildfire Research

The findings provide insights into the role of climate variability in shaping wildfire-related conditions. Wildfire activity is governed by multiple interacting processes, and large-scale climate indices may influence fire-conducive environments through different seasonal mechanisms. The results suggest that a reduced set of representative climate indices can retain much of the information provided by a larger group of variables while reducing redundancy and multicollinearity.
The PCA–partial correlation–LASSO framework presented here provides a methodological approach for identifying relevant climate variables and improving the interpretation of climate–wildfire relationships. This approach may be particularly useful when analyses involve numerous interrelated climate indices, where distinguishing the independent contributions of individual variables is challenging. Further evaluation using independent datasets, cross-validation, and sensitivity analyses across different periods is needed to assess the robustness and transferability of the identified climate–wildfire associations.

3.6. Limitations of the Study and Interpretation of Findings

While the integrated statistical framework presented in this study provides a systematic approach to identifying representative climate teleconnection indices associated with total burned area, several important limitations should be acknowledged when interpreting the results. These limitations primarily concern the temporal resolution of the data, the omission of key local-scale drivers, and the distinction between statistical association and physical causation.
First, the study relies on total annual burned area as the response variable. This aggregation over the entire calendar year inherently obscures the seasonal dynamics of wildfire activity. The main wildfire season in Serbia is concentrated in July and August, yet the annual burned area totals combine fires occurring throughout the year, including potentially smaller or less frequent events in other seasons. Consequently, the observed statistical associations between seasonal climate indices and annual burned area may not capture the specific climatic conditions that govern fire ignition, spread, and behaviour during the peak fire season. Seasonal teleconnection indices, when related to an annual aggregated variable, are likely to reflect broad-scale climatic influences on fuel moisture, fuel availability, and fire weather, but they cannot be interpreted as providing precise predictions of fire activity within a particular month or phase of the fire season.
Second, the analysis does not incorporate local meteorological variables, such as monthly or seasonal temperature, precipitation, relative humidity, or wind speed, which are known to directly influence fire weather and fuel conditions. Similarly, anthropogenic factors, including land-use change, fire suppression policies, ignition sources (e.g., agricultural burning, human negligence, or arson), and population density, are not included in the statistical model. These factors are well-documented drivers of wildfire occurrence and burned area in many Mediterranean and temperate regions, and their omission may lead to an overestimation of the variance attributed to large-scale climate indices. The climate signals identified in this study should therefore be understood as representing indirect climatic influences that operate through their association with local weather conditions and fuel states, rather than as direct determinants of fire activity.
Third, the observed relationships are based on a single national-level dataset covering the period 1970–2022. This time series is relatively short for studying decadal- to multidecadal-scale climate variability, particularly for indices such as the AMO, which exhibit variability on timescales of several decades. The stability of the identified variable selection and coefficient estimates across different subperiods or spatial scales has not been formally tested. The selected indices may be influenced by specific historical events, such as the extreme wildfire years of 2007 and 2012, or by non-stationarity in the climate–wildfire relationship over time. Cross-validation and sensitivity analyses using independent temporal or spatial datasets would be necessary to assess the generalisability and robustness of the findings.
Fourth, the methodological framework is primarily exploratory and descriptive. While PCA, partial correlation analysis, and LASSO regression are effective for reducing dimensionality and identifying representative variables, they do not establish causal pathways. The statistical associations reported in this study should be interpreted as correlative and conditional relationships within the observed dataset, rather than as evidence of direct physical control. A large absolute regression coefficient in the LASSO model does not imply that a climate index physically drives burned area, but rather that it provides a strong statistical signal that is not entirely redundant with the other climate indices included in the model. The actual physical mechanisms linking teleconnection patterns to fire activity—for example, through changes in atmospheric circulation, moisture transport, or temperature anomalies—require dedicated process-based studies that incorporate local meteorological data, land-surface conditions, and fire behaviour models.
Finally, data availability and quality impose constraints on the analysis. Official burned-area data are aggregated at the annual level and may be subject to reporting inconsistencies, particularly for smaller fire events or in regions where monitoring systems are less comprehensive. As noted earlier, the lack of detailed monthly, seasonal, or spatial data on fire occurrence, fire types, and species-specific damage prevents a more nuanced analysis of climate–fire relationships at finer scales. Moreover, the exclusion of data from the Autonomous Province of Kosovo and Metohija due to the unavailability of harmonised forestry records limits the spatial completeness of the analysis to approximately 90% of Serbia’s territory, and the representativeness of the national-level findings for the excluded region remains unknown.
In summary, the findings of this study should be interpreted as statistical associations that identify potentially informative large-scale climate signals related to total burned area variability in Serbia. The integrated framework provides a useful methodological tool for screening and selecting climate indices in wildfire-related statistical models, but the identified relationships should be considered preliminary and exploratory. Future research that incorporates higher-resolution burned-area data, local meteorological and anthropogenic predictors, and process-based modelling approaches will be essential to establish the causal pathways underlying the observed climate–fire associations and to assess their operational utility for fire risk assessment and management planning.

4. Conclusions

This study developed an integrated framework for identifying representative climate indices associated with total burned area and reducing redundancy among large sets of interrelated teleconnection variables. PCA revealed a strong latent structure within the climate-index dataset, with ten rotated components explaining 82.31% of the total variance. The component structure identified several groups of closely related seasonal climate indices, particularly among the AMO/TNA/AMM variables, winter NAO–MOI indices, spring MOI/NAO indices, and summer MOI indices.
Partial correlation analysis further indicated that several indices within these groups contain overlapping information, whereas others retain relatively independent statistical associations with total burned area. In particular, spring and summer MOI2 indices emerged as representative climate indices within their respective components, while several closely related NAO and MOI indices exhibited substantial redundancy. These findings highlight the importance of considering the underlying structure and interdependence of climate indices when examining climate–wildfire relationships.
The LASSO approach provided an additional variable-selection step to identify a subset of candidate climate indices from the reduced set of variables. The overall methodology demonstrates the value of combining latent structure analysis, conditional association assessment, and multivariable regularization for exploratory climate-index selection, rather than relying solely on individual correlations or including all available indices simultaneously.
Future research should further evaluate the robustness of the selected climate indices using independent temporal or spatial datasets and assess the stability of variable selection across different periods and regions. Integrating the identified large-scale climate indices with local meteorological and environmental variables may provide additional insights into the complex interactions influencing wildfire activity.

Author Contributions

Conceptualization, A.D. and M.M.; methodology, A.D. and M.V.P.; software, M.V.P., S.S. and U.D.; validation, A.D., M.M. and V.B.; formal analysis, M.V.P., M.M. and S.D.; investigation, M.V.P., M.M. and S.D.; resources, S.D. and S.S.; data curation, S.D. and S.S.; writing—original draft preparation, A.D., M.M. and V.B.; writing—review and editing, A.D., M.M. and V.B.; visualization, S.D. and U.D.; supervision, A.D.; project administration, S.D. and S.S.; funding acquisition, S.S. All authors have read and agreed to the published version of the manuscript.

Funding

Ministry of Science, Technological Development, and Innovation: 451-03-34/2026-03/200169, 451-03-33/2026-03/200172, and 451-03-34/2026-03/200375. This research was partly supported by the Science Fund of the Republic of Serbia, GRANT No. 7632, Project “Mathematical Methods in Image Processing under Uncertainty”—MaMIPU.

Institutional Review Board Statement

Not applicable.

Informed Consent Statement

Not applicable.

Data Availability Statement

The datasets presented in this article are not readily available because the dataset contains information that is not publicly available and cannot be shared due to confidentiality and data access restrictions. Requests to access the datasets should be directed to m.milenkovic@gi.sanu.ac.rs.

Acknowledgments

We are grateful to Boško Krstović and Velibor Lazarević from the Statistical Office of the Republic of Serbia for providing us with data and information on forest fires.

Conflicts of Interest

The authors declare no conflicts of interest.

References

  1. San-Miguel-Ayanz, J.; Durrant, T.; Boca, R.; Maianti, P.; Liberta, G.; Jacome Felix Oom, D.; Branco, A.; De Rigo, D.; Suarez-Moreno, M.; Ferrari, D.; et al. Forest Fires in Europe, Middle East and North Africa 2022; Publications Office of the European Union: Luxembourg, 2023. [Google Scholar] [CrossRef] [PubMed]
  2. Dupuy, J.-L.; Fargeon, H.; Martin-StPaul, N.; Pimont, F.; Ruffault, J.; Guijarro, M.; Hernando, C.; Madrigal, J.; Fernandes, P.M. Climate change impact on future wildfire danger and activity in southern Europe: A review. Ann. For. Sci. 2020, 77, 35. [Google Scholar] [CrossRef] [Scilit]
  3. Statistical Office of the Republic of Serbia. Available online: https://www.stat.gov.rs/sr-cyrl/oblasti/poljoprivreda-sumarstvo-i-ribarstvo/sumarstvo/ (accessed on 9 September 2024).
  4. Statistical Office of the Republic of Serbia. Forestry in the Republic of Serbia, 2022. Available online: https://publikacije.stat.gov.rs/G2023/PdfE/G20235697.pdf (accessed on 2 September 2024).
  5. Živanović, S.; Ivanović, R.; Nikolić, M.; Đokić, M.; Tošić, I. Influence of air temperature and precipitation on the risk of forest fires in Serbia. Meteorol. Atmos. Phys. 2020, 132, 869–883. [Google Scholar] [CrossRef] [Scilit]
  6. Živanović, S. Impact of drought in Serbia on fire vulnerability of forests. Int. J. Bioautom. 2017, 21, 217–226. [Google Scholar]
  7. Živanović, S. Influence of forest humidity on the distribution of forest fires in the territory of Serbia. Disaster Adv. 2021, 14, 8–14. [Google Scholar] [CrossRef] [Scilit]
  8. Živanović, S.; Gocić, M. Forest fires in Serbia—Influence of humidity conditions. J. Geogr. Inst. Jovan Cvijić SASA 2022, 72, 221–228. [Google Scholar] [CrossRef] [Scilit]
  9. Tošić, I.; Živanović, S.; Tošić, M. Influence of extreme climate conditions on the forest fire risk in the Timočka Krajina region (Northeastern Serbia). Idojaras 2020, 124, 331–347. [Google Scholar] [CrossRef] [Scilit]
  10. Earth Data. Available online: https://www.earthdata.nasa.gov/topics/climate-indicators/atmospheric-ocean-indicators/teleconnections (accessed on 5 September 2024).
  11. Beniche, M.; Vialard, J.; Lengaigne, M.; Voldoire, A.; Srinivas, G.; Hall, N.M.J. A distinct and reproducible teleconnection pattern over North America during extreme El Niño events. Sci. Rep. 2024, 14, 2457. [Google Scholar] [CrossRef] [Scilit] [PubMed]
  12. Harrison, M. Understanding and visualizing and ENSO-based fire climatology in Florida, USA: A case method using cluster analysis. Southeast. Geogr. 2013, 53, 381–402. [Google Scholar] [CrossRef] [Scilit]
  13. Cerano-Paredes, J.; Iniguez, J.M.; Villanueva-Díaz, J.; Vázquez-Selem, L.; Cervantes-Martínez, R.; Esquivel-Arriaga, G.; Franco-Ramos, O.; Rodríguez-Trejo, D.A. Effects of climate on historical fire regimes (1451–2013) in Pinus hartwegii forests of Cofre de Perote National Park, Veracruz, Mexico. Dendrochronologia 2021, 65, 125784. [Google Scholar] [CrossRef] [Scilit]
  14. Mariani, M.; Fletcher, M.-S.; Holz, A.; Nyman, P. ENSO controls interannual fire activity in southeast Australia. Geophys. Res. Lett. 2016, 43, 10891–10900. [Google Scholar] [CrossRef] [Scilit]
  15. Liu, G.; Li, J.; Ying, T. Atlantic Multidecadal Oscillation modulates the relationship between El Niño-Southern Oscillation and fire weather in Australia. Atmos. Chem. Phys. 2023, 23, 9217–9228. [Google Scholar] [CrossRef] [Scilit]
  16. Nurdiati, S.; Bukhari, F.; Julianto, M.T.; Sopaheluwakan, A.; Aprilia, M.; Fajar, I.; Septiawan, P.; Najib, M.K. The impact of El Niño southern oscillation and Indian Ocean Dipole on the burned area in Indonesia. TAO 2022, 33, 16. [Google Scholar] [CrossRef] [Scilit]
  17. Cordero, R.R.; Feron, S.; Damiani, A.; Carrasco, J.; Karas, C.; Wang, C.; Kraamwinkel, C.T.; Beaulieu, A. Extreme fire weather in Chile driven by climate change and El Niño–Southern Oscillation (ENSO). Sci. Rep. 2024, 14, 1974. [Google Scholar] [CrossRef] [Scilit] [PubMed]
  18. Keeping, T.R.; Shepherd, T.G.; Prentice, I.C.; van der Wiel, K.; Harrison, S.P. Influence of global climate modes on wildfire occurrence in the contiguous United States under recent and future climates. Clim. Dyn. 2026, 64, 15. [Google Scholar] [CrossRef] [Scilit] [PubMed]
  19. Afolayan, S.; Mekonnen, A.; Gamelin, B.; Lin, Y.-L. Multiscale Interactions between Local Short- and Long-Term Spatio-Temporal Mechanisms and Their Impact on California Wildfire Dynamics. Fire 2024, 7, 247. [Google Scholar] [CrossRef] [Scilit]
  20. Cardil, A.; Rodrigues, M.; Ramirez, J.; de-Miguel, S.; Silva, C.A.; Mariani, M.; Ascoli, D. Coupled effects of climate teleconnections on drought, Santa Ana winds and wildfires in southern California. Sci. Total Environ. 2021, 765, 142788. [Google Scholar] [CrossRef] [Scilit] [PubMed]
  21. Justino, F.; Bromwich, D.H.; Schumacher, V.; daSilva, A.; Wang, S.-H. Arctic Oscillation and Pacific-North American pattern dominated-modulation of fire danger and wildfire occurrence. npj Clim. Atmos. Sci. 2022, 5, 52. [Google Scholar] [CrossRef] [Scilit]
  22. Beverly, J.L.; Flannigan, M.D.; Stocks, B.J.; Bothwell, P. The association between Northern Hemisphere climate patterns and interannual variability in Canadian wildfire activity. Can. J. For. Res. 2011, 41, 2193–2201. [Google Scholar] [CrossRef] [Scilit]
  23. Gao, C.; Zhao, F.; Shi, C.; Liu, K.; Wu, X.; Wu, G.; Liang, Y.; Shu, L. Previous Atlantic Multidecadal Oscillation (AMO) modulates the lightning-ignited fire regime in the boreal forest of Northeast China. Environ. Res. Lett. 2021, 16, 024054. [Google Scholar] [CrossRef] [Scilit]
  24. Milenković, M.; Ducić, V.; Burić, D.; Lazić, B. The Atlantic Multidecadal Oscillation (AMO) and the forest fires in France in the period 1980–2014. J. Geogr. Inst. “Jovan Cvijić” SASA 2016, 66, 35–44. [Google Scholar] [CrossRef] [Scilit]
  25. Milenković, M.; Yamashkin, A.; Ducić, V.; Babić, V.; Govedar, Z. Forest fires in Portugal—The connection with the Atlantic Multidecadal Oscillation (AMO). J. Geogr. Inst. “Jovan Cvijić” SASA 2017, 67, 27–35. [Google Scholar] [CrossRef] [Scilit]
  26. Milenković, M.; Ducić, V.; Mihajlović, J.; Burić, D.; Babić, V. Forest fires in Finland—The influence of atmospheric oscillations. J. Geogr. Inst. “Jovan Cvijic” SASA 2019, 69, 75–82. [Google Scholar] [CrossRef] [Scilit]
  27. Milenković, M.; Ducić, V.; Babić, V. The Mediterranean Oscillation (MOI) and the Forest Fires in Romania in the Period 1986–2014. Forum Geogr. 2016, 15, 126–132. [Google Scholar] [CrossRef] [Scilit]
  28. Pavlović Berdon, N. The Impact of Arctic and North Atlantic Oscillation on Temperature and Precipitation Anomalies in Serbia. Geogr. Pannonica 2012, 16, 44–55. [Google Scholar] [CrossRef] [Scilit]
  29. Jovanovic, G.; Reljin, I.; Reljin, B. The influence of Arctic and North Atlantic Oscillation on precipitation regime in Serbia. In Proceedings of the XXIV the Conference of the Danubian Countries on the Hydrological Forecasting and Hydrological Bases of Water Management, Bled, Slovenia, 2–4 June 2008. [Google Scholar]
  30. Milenković, M.; Ducić, V.; Obradović, D.; Dedić, A.; Burić, D. Climatic and anthropogenic impacts on forest fires in conditions of extreme fire danger on sandy soils. J. Geogr. Inst. “Jovan Cvijić” SASA 2023, 73, 155–168. [Google Scholar] [CrossRef] [Scilit]
  31. Rodrigues, M.; Mariani, M.; Russo, A.; Salis, M.; Galizia, L.F.; Cardil, A. Spatio-temporal domains of wildfire-prone teleconnection patterns in the Western Mediterranean Basin. Geophys. Res. Lett. 2021, 48, e2021GL094238. [Google Scholar] [CrossRef] [Scilit]
  32. Kämäräinen, M.; Tian, Y.; Hänninen, H.; Venäläinen, A.; Aalto, J.; Jylhä, K. Statistical learning methods as a basis for skillful seasonal temperature forecasts in Europe. J. Clim. 2019, 32, 5667–5685. [Google Scholar] [CrossRef] [Scilit]
  33. Jolliffe, I.T.; Cadima, J. Principal component analysis: A review and recent developments. Philos. Trans. R. Soc. A Math. Phys. Eng. Sci. 2016, 374, 20150202. [Google Scholar] [CrossRef] [Scilit] [PubMed]
  34. Hastie, T.; Tibshirani, R.; Friedman, J. The Elements of Statistical Learning: Data Mining, Inference, and Prediction, 2nd ed.; Springer: New York, NY, USA, 2009. [Google Scholar] [CrossRef]
  35. Tibshirani, R. Regression shrinkage and selection via the lasso. J. R. Stat. Soc. Ser. B Methodol. 1996, 58, 267–288. [Google Scholar] [CrossRef] [Scilit]
  36. United Nations. United Nations Kosovo 2026. Available online: https://kosovoteam.un.org/en (accessed on 17 January 2026).
  37. Durlević, U.; Ilić, V.; Valjarević, A. Wildfire Susceptibility Mapping Using Deep Learning and Machine Learning Models Based on Multi-Sensor Satellite Data Fusion: A Case Study of Serbia. Fire 2025, 8, 407. [Google Scholar] [CrossRef] [Scilit]
  38. Durlević, U.; Ilić, V.; Aleksova, B. Wildfire Probability Mapping in Southeastern Europe Using Deep Learning and Machine Learning Models Based on Open Satellite Data. AI 2026, 7, 21. [Google Scholar] [CrossRef] [Scilit]
  39. Geosrbija. National Spatial Data Infrastructure 2026. Available online: https://a3.geosrbija.rs/ (accessed on 11 January 2026).
  40. Environmental Systems Research Institute [ESRI]. Sentinel-2 Land Cover Explorer. 2022. Available online: https://livingatlas.arcgis.com/landcoverexplorer/#mapCenter=21.076%2C42.197%2C13&mode=step&timeExtent=2017%2C2023&year=2023 (accessed on 10 January 2026).
  41. QGIS Development Team. QGIS Geographic Information System v3.40.09 with GRASS. Open Source Geospatial Foundation Project. 2025. Available online: https://www.qgis.org/download/ (accessed on 15 January 2026).
  42. National Oceanic and Atmospheric Administration, Physical Sciences Laboratory. Available online: https://psl.noaa.gov/data/correlation/nao.data (accessed on 3 September 2024).
  43. National Oceanic and Atmospheric Administration, Physical Sciences Laboratory. Available online: https://psl.noaa.gov/data/correlation/jonesnao.data (accessed on 3 September 2024).
  44. National Oceanic and Atmospheric Administration, Physical Sciences Laboratory. Available online: https://psl.noaa.gov/data/correlation/ao.data (accessed on 3 September 2024).
  45. National Oceanic and Atmospheric Administration, Physical Sciences Laboratory. Available online: https://psl.noaa.gov/data/correlation/amon.us.data (accessed on 3 September 2024).
  46. University of East Anglia. Available online: https://crudata.uea.ac.uk/cru/data/moi/moi1.output.dat (accessed on 4 September 2024).
  47. University of East Anglia. Available online: https://crudata.uea.ac.uk/cru/data/moi/moi2.output.dat (accessed on 4 September 2024).
  48. National Oceanic and Atmospheric Administration, Physical Sciences Laboratory. Available online: https://psl.noaa.gov/data/correlation/ea.data (accessed on 4 September 2024).
  49. National Oceanic and Atmospheric Administration, Physical Sciences Laboratory. Available online: https://psl.noaa.gov/data/correlation/tna.data (accessed on 4 September 2024).
  50. National Oceanic and Atmospheric Administration, Physical Sciences Laboratory. Available online: https://psl.noaa.gov/data/timeseries/monthly/AMM/ammsst.data (accessed on 4 September 2024).
  51. National Weather Service, Climate Prediction Center. Available online: https://www.cpc.ncep.noaa.gov/data/teledoc/nao.shtml (accessed on 4 September 2024).
  52. Jones, P.D.; Jonsson, T.; Wheeler, D. Extension to the North Atlantic Oscillation Using Early Instrumental Pressure Observations from Gibraltar and South-West Iceland. Int. J. Climatol. 1997, 17, 1433–1450. [Google Scholar] [CrossRef]
  53. Hurrell, J.W. Decadal trends in the North Atlantic Oscillation: Regional temperatures and precipitation. Science 1995, 269, 676–679. [Google Scholar] [CrossRef] [Scilit] [PubMed]
  54. Thompson, D.W.J.; Wallace, J.M. The Arctic Oscillation signature in the wintertime geopotential height and temperature fields. Geophys. Res. Lett. 1998, 25, 1297–1300. [Google Scholar] [CrossRef] [Scilit]
  55. Wang, C.; Lee, S.-K.; Enfield, D.B. Atlantic Warm Pool acting as a link between Atlantic Multidecadal Oscillation and Atlantic tropical cyclone activity. Geochem. Geophys. Geosyst. 2008, 9, Q05V03. [Google Scholar] [CrossRef] [Scilit]
  56. Knight, J.R.; Folland, C.K.; Scaife, A.A. Climate impacts of the Atlantic Multidecadal Oscillation. Geophys. Res. Lett. 2006, 33, L17706. [Google Scholar] [CrossRef] [Scilit]
  57. Sutton, R.T.; Hodson, D.L.R. Atlantic Ocean forcing of North American and European summer climate. Science 2005, 309, 115–118. [Google Scholar] [CrossRef] [Scilit] [PubMed]
  58. Conte, M.; Giuffrida, A.; Tedesco, S. The Mediterranean Oscillation, impact on precipitation and hydrology in Italy. In Proceedings of Conference on Climate, Water; Academy of Finland: Helsinki, Finland, 1989; pp. 121–137. [Google Scholar]
  59. Palutikof, J.P. Analysis of Mediterranean climate data: Measured and modelled. In Mediterranean Climate: Variability and Trends; Bolle, H.J., Ed.; Springer: Berlin/Heidelberg, Germany, 2003; pp. 125–132. [Google Scholar] [CrossRef] [Scilit]
  60. Barnston, A.G.; Livezey, R.E. Classification, seasonality and persistence of low-frequency atmospheric circulation patterns. Mon. Weather Rev. 1987, 115, 1083–1126. [Google Scholar] [CrossRef] [Scilit]
  61. Enfield, D.B.; Alfaro, E.J. The dependence of Caribbean rainfall on the interaction of the tropical Atlantic and Pacific Oceans. J. Clim. 1999, 12, 2093–2103. [Google Scholar] [CrossRef] [Scilit]
  62. Chiang, J.C.H.; Vimont, D.J. Analogous Pacific and Atlantic meridional modes of tropical atmosphere–ocean variability. J. Clim. 2004, 17, 4143–4158. [Google Scholar] [CrossRef] [Scilit]
Figure 1. Geographical position of Serbia and forest coverage.
Geohazards 07 00102 g001
Table 1. PCA component characteristics and variance explained.
RC1RC2RC3RC4RC5RC6RC7RC8RC9RC10Uniqueness
AMOa1.002 0.053
AMOsu0.973 0.049
AMOsp0.958 0.103
AMMa0.935 0.186
TNAa0.918 0.146
TNAsu0.880 0.057
AMOw0.857 0.114
EAWRsu−0.753 0.394
TNAsp0.729 0.120
TNAw0.673 0.132
AMMsu0.544 0.555 0.192
EAWRa−0.526 0.341
AMMw0.409 0.495 0.178
NAOJw 1.003 0.099
MOI2w 0.940 0.172
NAOw 0.927 0.126
MOIw 0.904 0.117
AOw 0.898 0.187
MOI2sp 1.094 0.217
MOIsp 0.950 0.201
NAOJsp 0.524 0.199
AO sp 0.496 0.527 0.235
MOI2 su 1.044 0.122
MOIsu 0.974 0.142
EAWRsp 0.753 0.391
NAOsp 0.635 0.284
AOsu 0.916 0.156
NAOsu 0.855 0.176
NAOJsu 0.672 0.343
MOI2a 0.915 0.100
MOIa 0.893 0.101
EAWRw 0.797 0.275
AMMsp 0.539 0.119
AOa 1.021 0.086
NAOa 0.680 0.231
NAOJa 0.9490.225
Note. Applied rotation method is promax.
Table 2. Partial Correlation Analysis.
Control VariablesTotal haAMOsuTNAsuAMMsu
-none-aTotal (ha)Correlation1.0000.011−0.058−0.058
Significance (2-tailed)0.0000.9370.6790.681
df0515151
AMOsuCorrelation0.0111.0000.9060.585
Significance (2-tailed)0.9370.0000.0000.000
df5105151
TNAsuCorrelation−0.0580.9061.0000.780
Significance (2-tailed)0.6790.0000.0000.000
df5151051
AMMsuCorrelation−0.0580.5850.7801.000
Significance (2-tailed)0.6810.0000.0000.000
df5151510
TNAsu& AMMsuCorrelation1.0000.160
Significance (2-tailed)0.0000.262
df049
AMOsuCorrelation0.1601.000
Significance (2-tailed)0.262.
df490
a. Cells contain zero-order (Pearson) correlations.
Table 3. Selection of representative climate indices.
PCA
Component
CandidatesPartial AnalysisSelected IndexReason
RC1AMO/TNA/EAWRHigh redundancyAMOaHighest loading
RC2NAOJw, MOI2wBoth contain overlapping informationMOI2w or NAOJwOne representative predictor is sufficient
RC3MOI2sp, MOIsp, NAOJspMOI2sp retains the signalMOI2spProvides the most independent information
RC4MOIsu, MOI2suMOI2su retains the signalMOI2suProvides the most independent information
RC6AOsu, NAOsu, NAOJsunot fully examinedAOsuHighest PCA loading
Table 4. Summary statistics of the LASSO regression model.
RR2Adjusted R2Standard Error of the Estimate
0.820.670.432008.30
Disclaimer/Publisher’s Note: The statements, opinions and data contained in all publications are solely those of the individual author(s) and contributor(s) and not of MDPI and/or the editor(s). MDPI and/or the editor(s) disclaim responsibility for any injury to people or property resulting from any ideas, methods, instructions or products referred to in the content.