Article

A Temporal Analysis of Wildfires in Spain Through the Use of Multi-Database Research

by
Jaime Bonachea
Department of Earth Sciences and Condensed Matter Physics, Universidad de Cantabria, Avenue/Los Castros 48, 39005 Santander, Spain
GeoHazards 2026, 7(4), 105; https://doi.org/10.3390/geohazards7040105
Submission received: 1 July 2026 / Revised: 24 August 2026 / Accepted: 27 August 2026 / Published: 1 September 2026

Abstract

In recent decades, there has been a marked increase in the frequency of natural disasters on a global scale. This increase is particularly notable in the context of climatological disasters, such as wildfires, which have become increasingly prevalent and intense in past years. It is evident that as the planet experiences the repercussions of climate change, the severity of these fires will intensify. The present study focuses on the analysis of wildfires that have occurred in Spain in recent years, both in terms of their number and the area affected, using data collected from the national and international databases. Since the beginning of this century, there has been an increasing trend in the number of large wildfires (>500 ha) in this country. In contrast, there has been a decline in the overall number of wildfires. However, when analyzing a more extended period, spanning from 1970 onward, these trends become less discernible. The study also analyzes the differences between some of these databases and notes that, despite the fact that certain databases offer exhaustive documentation of burned areas, others exhibit specific limitations due to a variety of factors. These limitations may include the nature of the recorded data, the resolution of wildfire detection or wildfire perimeter identification detection systems, or the recent initiation of data collection for such events. The development of strategies based on historical data and predictive models is necessary for anticipating future scenarios and mitigating the impacts of wildfires.

1. Introduction

Since 1989, when the United Nations General Assembly declared 13 October as the International Day for Disaster Risk Reduction [1], this day has been celebrated to raise awareness among the world’s population about the risks they face and how to reduce damage, in terms of both human lives and economic losses.
Natural disasters are classified [2,3,4] into geophysical: they originate within the Earth and include earthquakes (and tsunami) and volcanic activity; hydrological: they are associated with the movement of water on the Earth’s surface. It includes floods, landslides, coastal storms, and erosion; meteorological: this type of disaster consists of phenomena caused by atmospheric conditions. Tornadoes, cyclones, hurricanes, fog and extreme temperature variations are also included in this category of disasters; and climatological: hazards related to climate variability over a wide time interval, as droughts and wildfires [2,3,4]. With the exception of geophysical disasters, other types of disasters are more significantly and directly affected by climate change [5], human activities [6], in the subsequent manifestation of other natural hazards. For instance, in regions impacted by wildfires, if the vegetation cover does not undergo a rapid recovery process, there is an increased probability of occurrence of erosion [7] and landslides [8].
There are several organizations dedicated to collecting disaster data, operating at both the global and national levels, and covering various time periods, depending on the type of disaster and the available data. These data sets are subsequently made accessible to the public through the utilization of web-based visualizations or statistical data. Table 1 presents a selection of global databases [4,9,10,11,12,13,14,15,16,17,18], primarily kept by government agencies, which encompass a wide range of disasters, natural and technological. Some databases provide information regarding the number of individuals affected, injured, or killed, as well as the economic losses incurred due to the specified disaster [4,10,12,15,16,17,18].
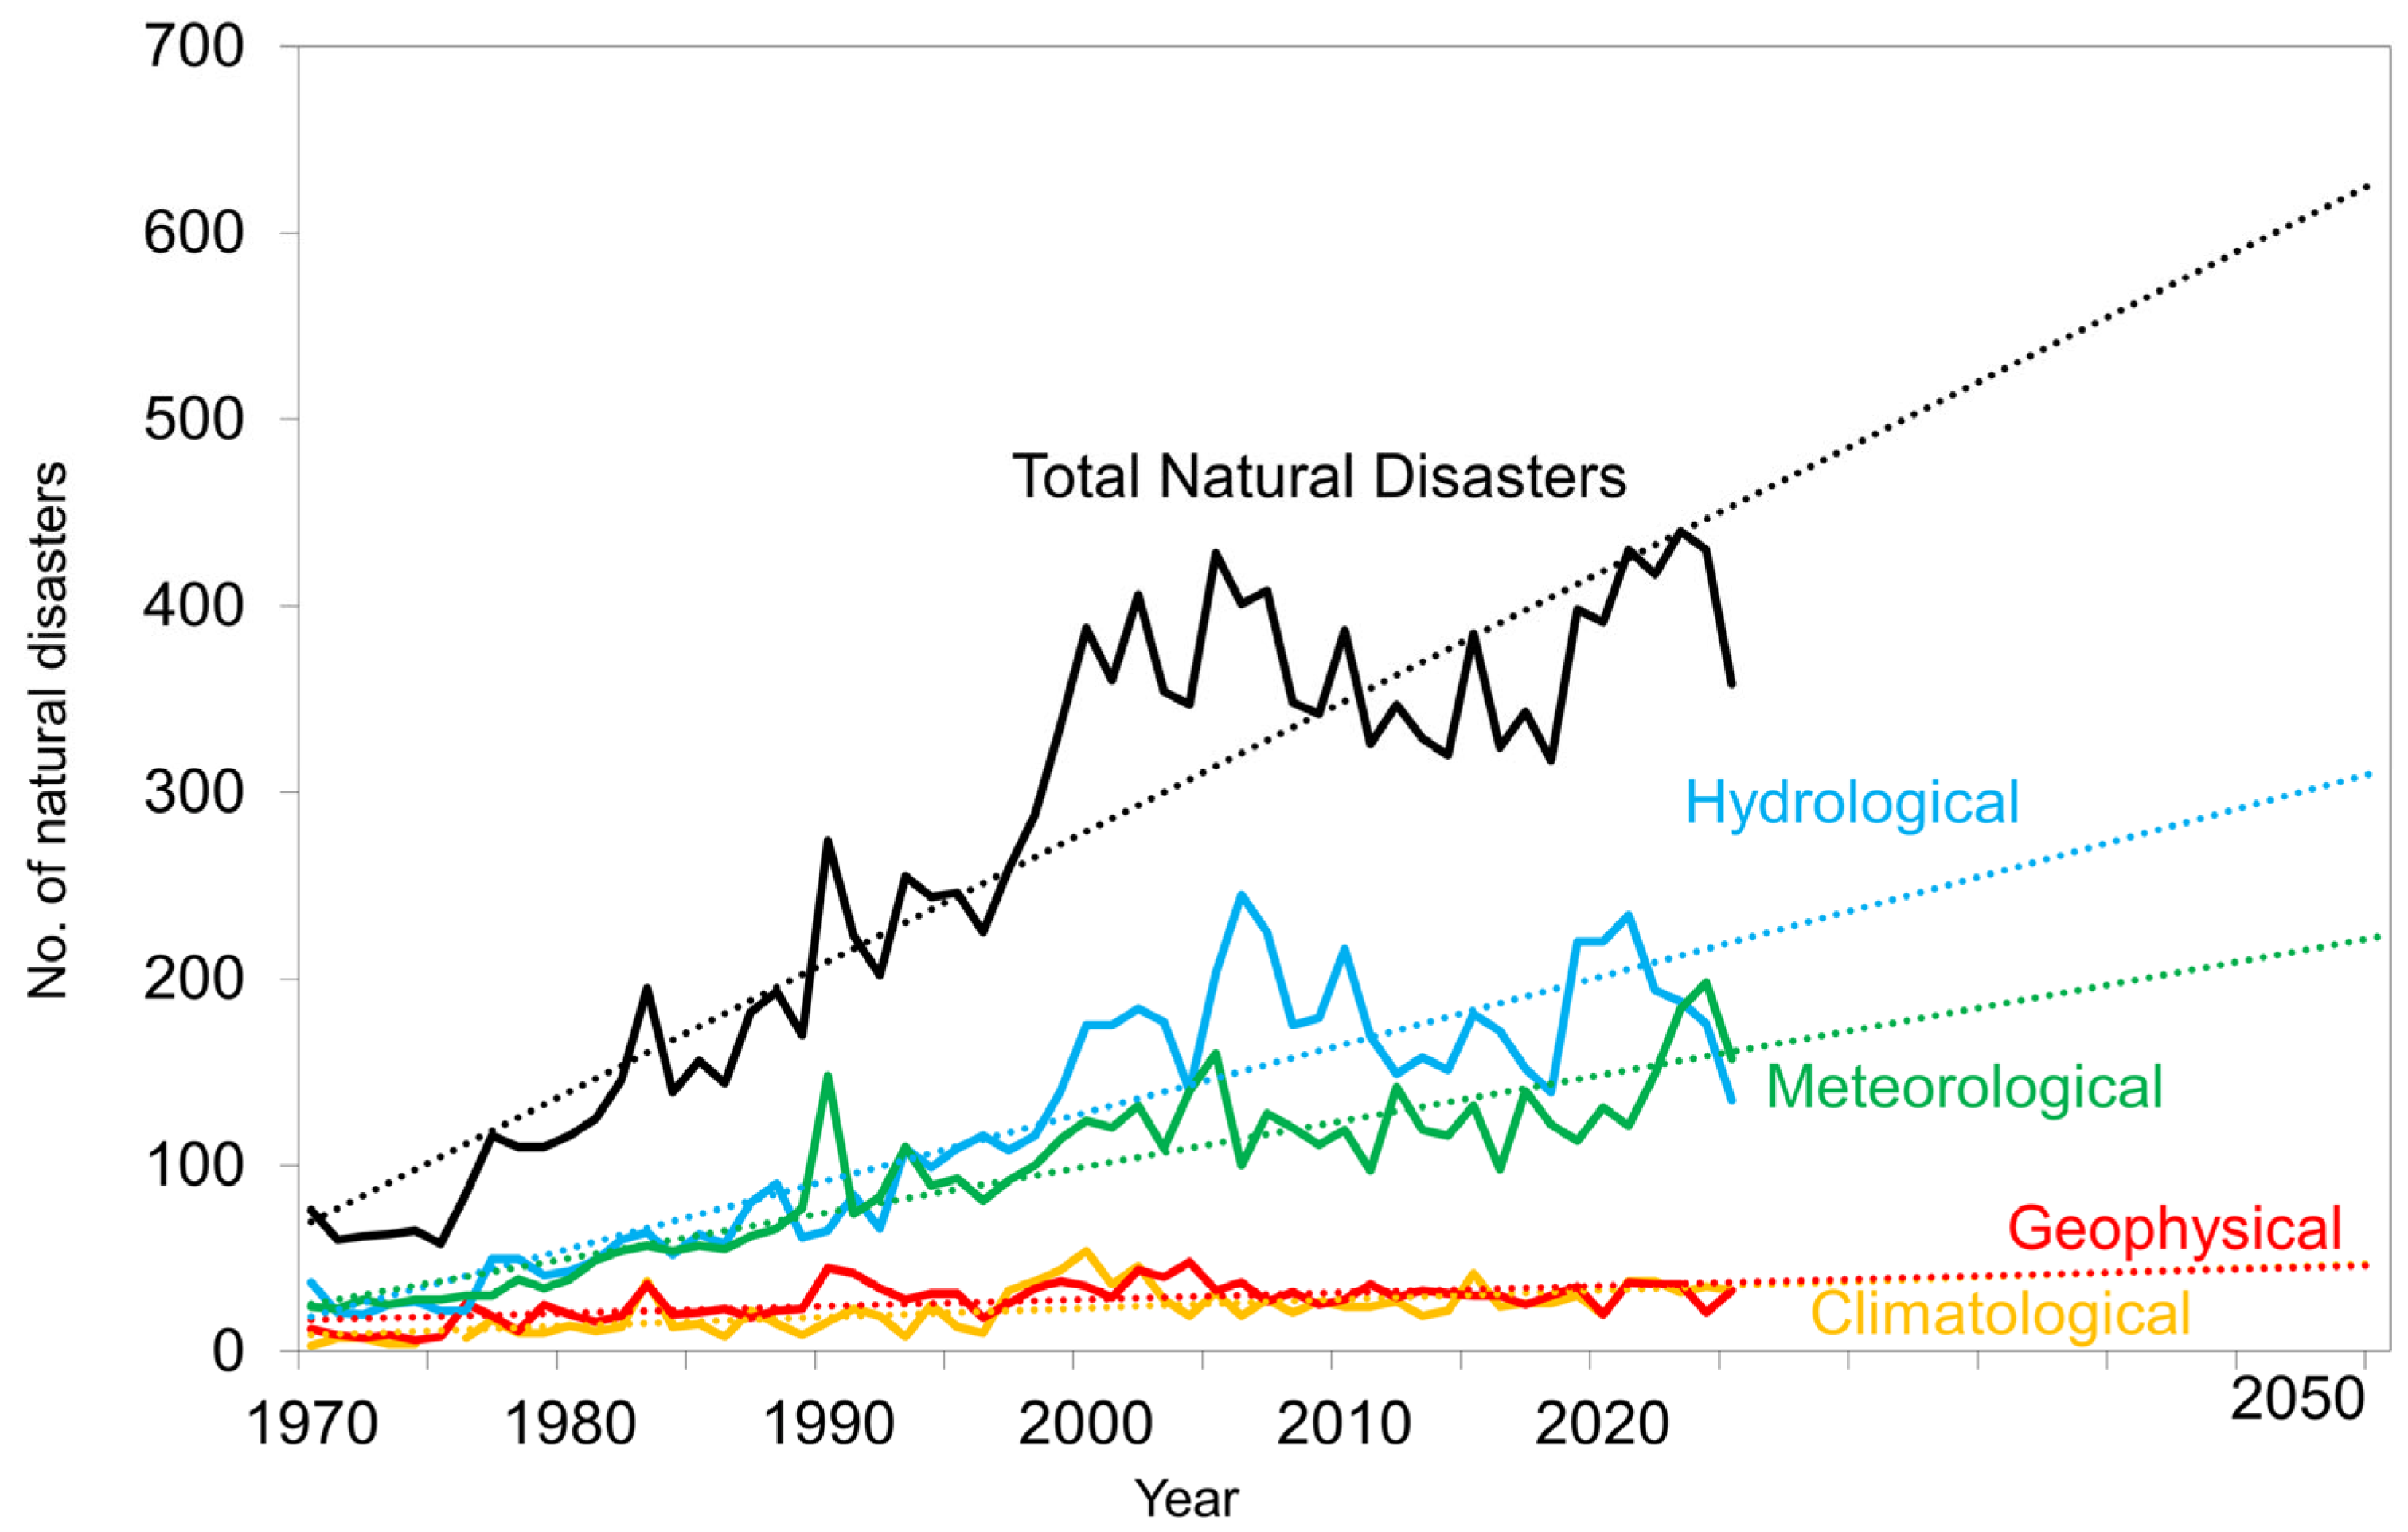
A particularly comprehensive and widely recognized reference source is the EM-DAT database [4]. The database encompasses data dating back to 1900 and even earlier. A comprehensive analysis of natural disasters from the 1970s to the present day reveals an increase in the number of catastrophes caused by natural phenomena. The total number of events per year has exceeded 50, and since then it has continued to increase to the present day, with the highest number of natural disasters occurring in 2005. Projections for 2050 indicate that, in the scenario of maintaining a linear trend adjustment based on historical occurrences without accounting for potential disaster prevention advancements by governments or other contributing factors, there will be an anticipated increase in the number of disasters over the subsequent 25 years. This projected rise would reach approximately 600 disasters, which is a significant increase from the current figure of around 400 events per year (Figure 1). Geophysical hazards and climatological hazards show analogous future trends. Despite these general global trends, there are periods when natural disasters appear to be on the decline [19].
Arcos et al. [20] performed an analysis of disasters that occurred in Spain between 1950 and 2020. The analysis was based on data from EM-DAT [4]. Their study examined the frequency, types, and long-term impact of these events. During that period, 491 disasters were identified: Of the events observed, 51.9% occurred naturally, while 48.1% could be attributed to technological processes. During that period, a significant increase in the total number of disasters was also observed, particularly those caused by climate-related factors. These disasters were the most frequent and showed an upward trend.
Between 1950 and 2025, Spain has registered 114 natural disasters, with 39.5% of these events classified as meteorological, 36% as hydrological, 21.9% as climatological, and 2.6% as geophysical [4]. The disasters that have resulted in the greatest number of fatalities are meteorological events (heat waves and cold waves) and hydrological events (floods). However, the most significant economic losses have been attributed to hydrological events, such as floods, and climatological events, including wildfires and droughts.
In 2025, 390 million hectares (Mha) of land were impacted by wildfires worldwide, an area equivalent to the entire European continent [18]. Other authors indicate that the area burned worldwide in 2025 totaled 335 Mha, the second-lowest figure since 2002 [21]. The aforementioned authors have noted that the area affected by wildfires worldwide has decreased from 2002 to the present; however, the intensity of these events appears to be increasing.
While wildfires do not generally result in significant loss of life, they do lead to substantial environmental [22,23], economic [24,25], and health losses for the affected population [26,27].
During the 2020–2024 period, there was a 6.6% increase in the average number of people exposed to very high or extreme wildfire risk compared with the average for the 2003–2012 period; this is attributed to climate change [28] and human activities [29,30].
In the context of data obtained from 188 countries worldwide, 117 (equaling 62.2%) of these nations have exhibited an increase in their exposure to wildfire risk [28]. As Teymoor et al. stated [31], there is a global trend towards an increase in the population exposed to forest fires during the period 2002–2021. Torres-Vazquez et al. [32] have demonstrated a consistent trend of increasing population exposure to wildfires in Catalonia (Spain) over the past three decades, a trend that aligns with global patterns observed worldwide. However, as reported by Peña [25], there has been an average decline of between 100 and 300 residents in Spanish municipalities during a period of 11 to 19 years following a wildfire. This phenomenon stands in contrast to trends observed at the regional or global level.
Since the beginning of the 21st century, approximately 3000 fatalities and more than 17,000 injuries have been attributed to wildfires worldwide [4]. The Civil Protection Service report, for the period 1970–2025, indicates that the number of people who have died because of wildfires in Spain has gone up to 407 (over the past 25 years, there have been 167 documented deaths) [33]. That means about seven people on average per year over the last 55 years.
For the Iberian Peninsula, Calheiros et al. [34] investigated the alterations in burned areas and meteorological wildfire risk over space and time since 1980, comparing two subperiods (1980–1997 and 1998–2015). Their study revealed a strong correlation between climate variability and wildfires patterns in Iberia, offering insights for assessing the impacts of climate change and projecting future patterns of burned areas.
The wildfires that occurred in Portugal between 2012 and 2022 were analyzed by Couto et al. [35]. The researchers concluded that climate change was one of the causes of the major wildfires that occurred during the winter months.
Boccard comprehensively analyzed the risk of wildfires in Spain from 1961 to 2021. [36]. The author demonstrated that the situation in this country was analogous to that of Mediterranean France and less severe than the circumstances in Italy and Portugal. Additionally, it was indicated that the figure rose from 1961, reached its highest point between 1980 and 1994, and then experienced a substantial decline. Despite the escalating frequency and intensity of fire-prone climate conditions, socioeconomic changes, and management policies have contributed to a reduction in risk, reaching a minimum in 2018 [35].
From 2008 to 2021, the occurrence of wildfires in Spain was reviewed by Hammed et al. [37]. The study noted that the spring season recorded the highest number of wildfires, while the summer months were associated with the most extensive area burned. Furthermore, the majority of wildfires and burned areas were concentrated in scrubland and forest areas.
Subsequently, Bugallo et al. [38] examined the methods of predicting very large wildfires in the context of increasing extreme forest fires due to climate change, rural depopulation, and a growing urban-forest interface. A correlation was identified between low precipitation and humidity, high temperatures, high solar radiation, and wind, and the subsequent development of larger burned areas, for data on wildfires that occurred in Spain between 2002 and 2015. Through this correlation, they develop risk maps that are useful for prioritizing prevention and resource deployment. The maps indicate a high risk in Galicia, Extremadura, and the provinces of Castile and León, particularly in July. Conversely, the coastal regions along the Mediterranean and the Andalusian region exhibit a comparatively lower risk.
Chas-Amil et al. [39] studied the area of forested land in Galicia that was destroyed by wildfires in 2017, which also primarily affected a significant number of people and buildings located within the fire perimeter. As indicated in the study of Marey et al. [40] on wildfires in Galicia, the area affected by the fire constitutes 1.4% of the total land area. This study employs a comprehensive set of forest fire records obtained from various online services and maintained by public agencies in Spain, Europe, and worldwide. With more than 350,000 hectares having burned between January and August 2025 was considered one of the years with the most extensive wildfires in Spain since 2002 [21,41].
The aims of this study are to analyze the records found in several databases about wildfires in Spain; to compare the data registered across the aforementioned databases; and, to identify future trends in fires.
A thorough examination of historical occurrences can serve as a foundation for the development of future wildfire management strategies, particularly in light of the projected escalation in the frequency of such events due to climate change. This highlights the importance of implementing prevention policies, developing effective land-use planning, and striking a balance between human activities and the environment.

2. Materials and Methods

An analysis of data on wildfires, including both statistical data (Excel files) and graphical data (shapefiles), registered by various organizations has been carried out. Access to this data is free of charge and can be obtained upon request by visiting the relevant websites. The following section outlines the main characteristics, the information contained in the databases and the time period analyzed in this work.
-
The EM-DAT database [4] has been recognized as the most exhaustive of its category on a global scale. It has documented over 27,000 disasters since the year 1900 until 2025, with 16,000 events classified as natural disasters. These events align with the categories listed above. EM-DAT systematically documents the human and economic losses resulting from natural (and technological) disasters that match at least one of the following criteria: ten people died, one hundred people were affected, a state of emergency was declared, or a request for international aid was made [42]. Given that data collection has been more reliable since the 1950s and that some of the databases analyzed contain data dating back to the 1970s, this study analyzes the data recorded in EM-DAT from 1970 through December 2025, the last year for which complete data is available. Therefore, the relevant data concerning the interval 1970–2025, the “climatological” disaster category, and its subcategories (i.e., land fires, forest fires, and wildfires) have been extracted from the database.
-
The Ministry for Ecological Transition and Demographic Challenge (Ministerio para la Transición Ecológica y el Reto Demográfico, MITECO) [43] is responsible for the execution of outreach, awareness-raising, and prevention activities. Additionally, the MITECO is tasked with the compilation of statistics on wildfires that have occurred in Spain, with regional governments responsible for the initial recording of these events. Since 1968, this administration has been producing a report on wildfires documented between 1 January and 31 December of each year. Moreover, since the 1990s, a comprehensive report has been meticulously compiled, providing a decade-by-decade analysis of trends in wildfires and the factors that influence them. Furthermore, MITECO disseminates data (in Excel and shapefile formats), showcasing the number of fires and the area burned in hectares in each affected municipality for the periods 1996–2005 and 2006–2015. In this study, the available data from 1970 to 2025 are analyzed: total number of fires, number of fires with a burned land exceeding 1 ha, number of fires with a burned land smaller than 1 ha, number of fires affecting more than 500 ha (known as Big Forest Fires), and total area burned. Linley et al. [44] defined megafire as fires > 10,000 ha. This is twenty times larger than the 500 ha threshold typically employed in Spain for the classification of big wildfires.
-
The European Forest Fire Information System (EFFIS) [45] it is part of the European Earth observation program, called Copernicus. It provides daily wildfire maps, national and regional statistics, and risk and forecast indicators. The boundaries of burned areas are displayed by EFFIS, derived from MODIS and Sentinel-2 satellite images, with a detection resolution of 250 m (MODIS) and 10–20 m (Sentinel-2). The downloaded database indicates that from 2008 to 2018, the data correspond to MODIS images; in 2019, both MODIS and Sentinel-2 images are used; and starting in 2020, only Sentinel-2 images are used. It is important to note that this resolution typically results in the capture of fires that extend beyond 30 ha. For these reasons, it is important to note that this system records approximately 80% of fires in the European Union. However, according to Sedano et al. [46], the EFFIS records 95% of all fires that occur in the European territory. The total number of records for Spain is approximately 8500 polygons, including information on: burnt land, the affected regional and municipal territories, and the area of each type of vegetation cover affected by the fire.
-
The Global Wildfire Information System (GWIS) [41,47] is a web-based product that is sponsored by both European Union and American institutions. It provides real-time information on fires on a global scale, as well as a fairly comprehensive data archive covering recent years, with statistics on the extension of land burned, type and extension of land cover affected, the number of fires, and parameters such as the duration, speed and primary direction of the wildfire. The GWIS program encompasses several key elements, including the size of each fire, the propagation rate, the evolution and merging of fire hotspots into a single event, and the number of fire events within a specific area [48]. The information displayed for Spain, for the period 2002–2023, incorporates a total of 6500 points (records), which are derived from the vectorization of 500 × 500 m pixels.
-
Fire Information for Resource Management System (FIRMS) [14]: this service provides real-time global fire data, attempting to detect fires as they occur. Since November 2000, various satellites have been collecting information on burned areas around the world, with a resolution of 500 m. For specific locations, it can collect information from various satellites and sensors, with spatial resolutions ranging from 30 m to 2 km [49,50]. For Spain, the database contains over 114,000 points in shapefile format for the period 2000–2025. Initially, only points corresponding to “presumed vegetation fire” were selected, excluding those that might have arisen from other causes, such as volcanic activity. Accordingly, the search has been restricted to the most confidence points (each of which has a confidence value ranging from 0 to 100%), that is, those with 100% confidence. After this selection, the number of points to be utilized has been approximately reduced to 16,500. This extraction process has been shown to improve efficiency by reducing the time spent on data processing, increasing software processing capacity, and ensuring the use of only valid data points.
A thorough evaluation of the data set was conducted, leading to the establishment of regression lines that show the temporal evolution of the phenomenon (developed using Excel software and illustrated as dashed lines). This approach facilitates the visualization of the general evolution of the analyzed variables and provides a reference regarding the direction of the observed trends. It is important to note that these tendencies are descriptive and should not be interpreted as deterministic predictions of future behavior. EM-DAT dashed lines are illustrated using a linear fit, which is the optimal fit for each time series. For the remaining databases, the most appropriate model is a second-degree polynomial equation.
A comparative analysis was subsequently conducted among the various databases, employing a common time period for which all of them possess data. This time period corresponds to the 21st century. Due to the limited number of records for Spain in the EM-DAT database, this database was not included in the comparative analysis.

3. Results

3.1. EM-DAT Database

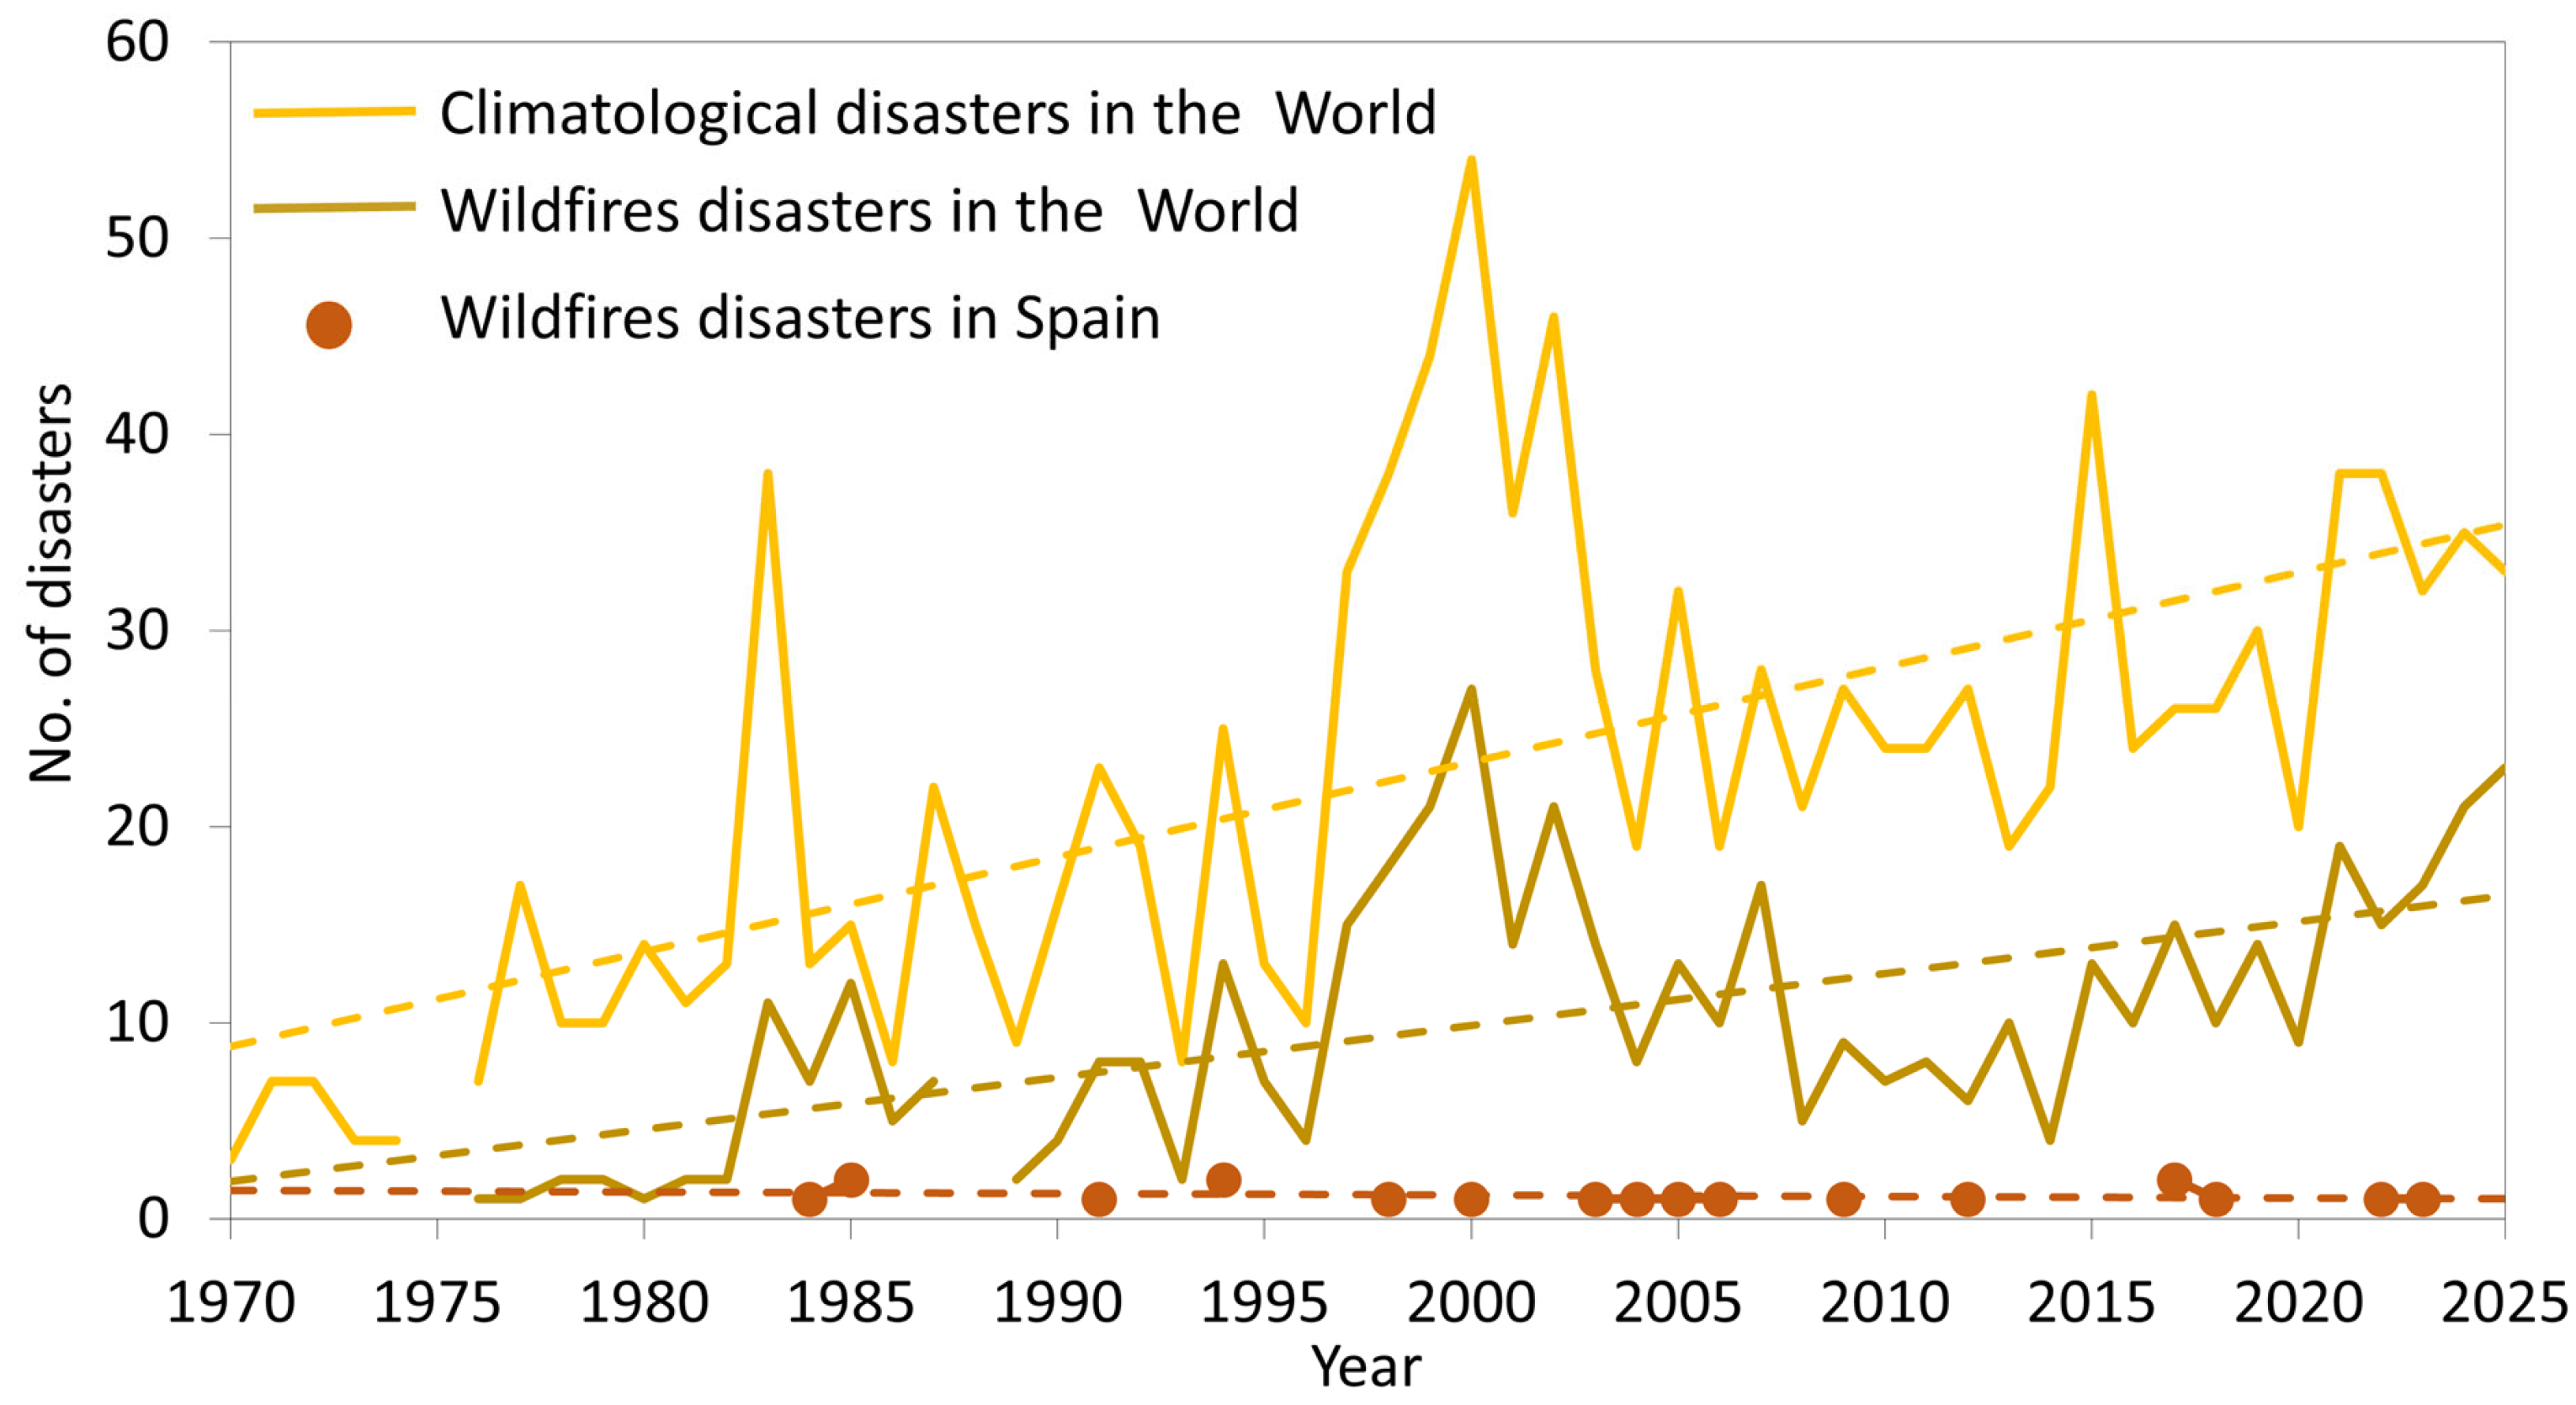
Records from around the world show 14,647 natural disasters. Of these, 6679 are classified as having a hydrological cause (45.6%), 5225 as meteorological (35.7%), 1517 as geophysical (10.3%), and 1226 as climatological (8.4%) (Figure 1). Among the various climate-related disasters, 497 have been linked to some type of fire. Figure 2 suggests a global upward trend in both climate-related disasters and wildfires.
Of the total 110 natural disasters recorded in Spain, 41% are due to meteorological factors; 34.5% are classified as hydrological origin; 22.7% are related to climatological, and 1.9% to geophysical causes. The limited number of records for the Spanish territory (19 wildfire events registered between 1984 and 2023; Figure 2), is insufficient to draw clear conclusions.

3.2. MITECO Data

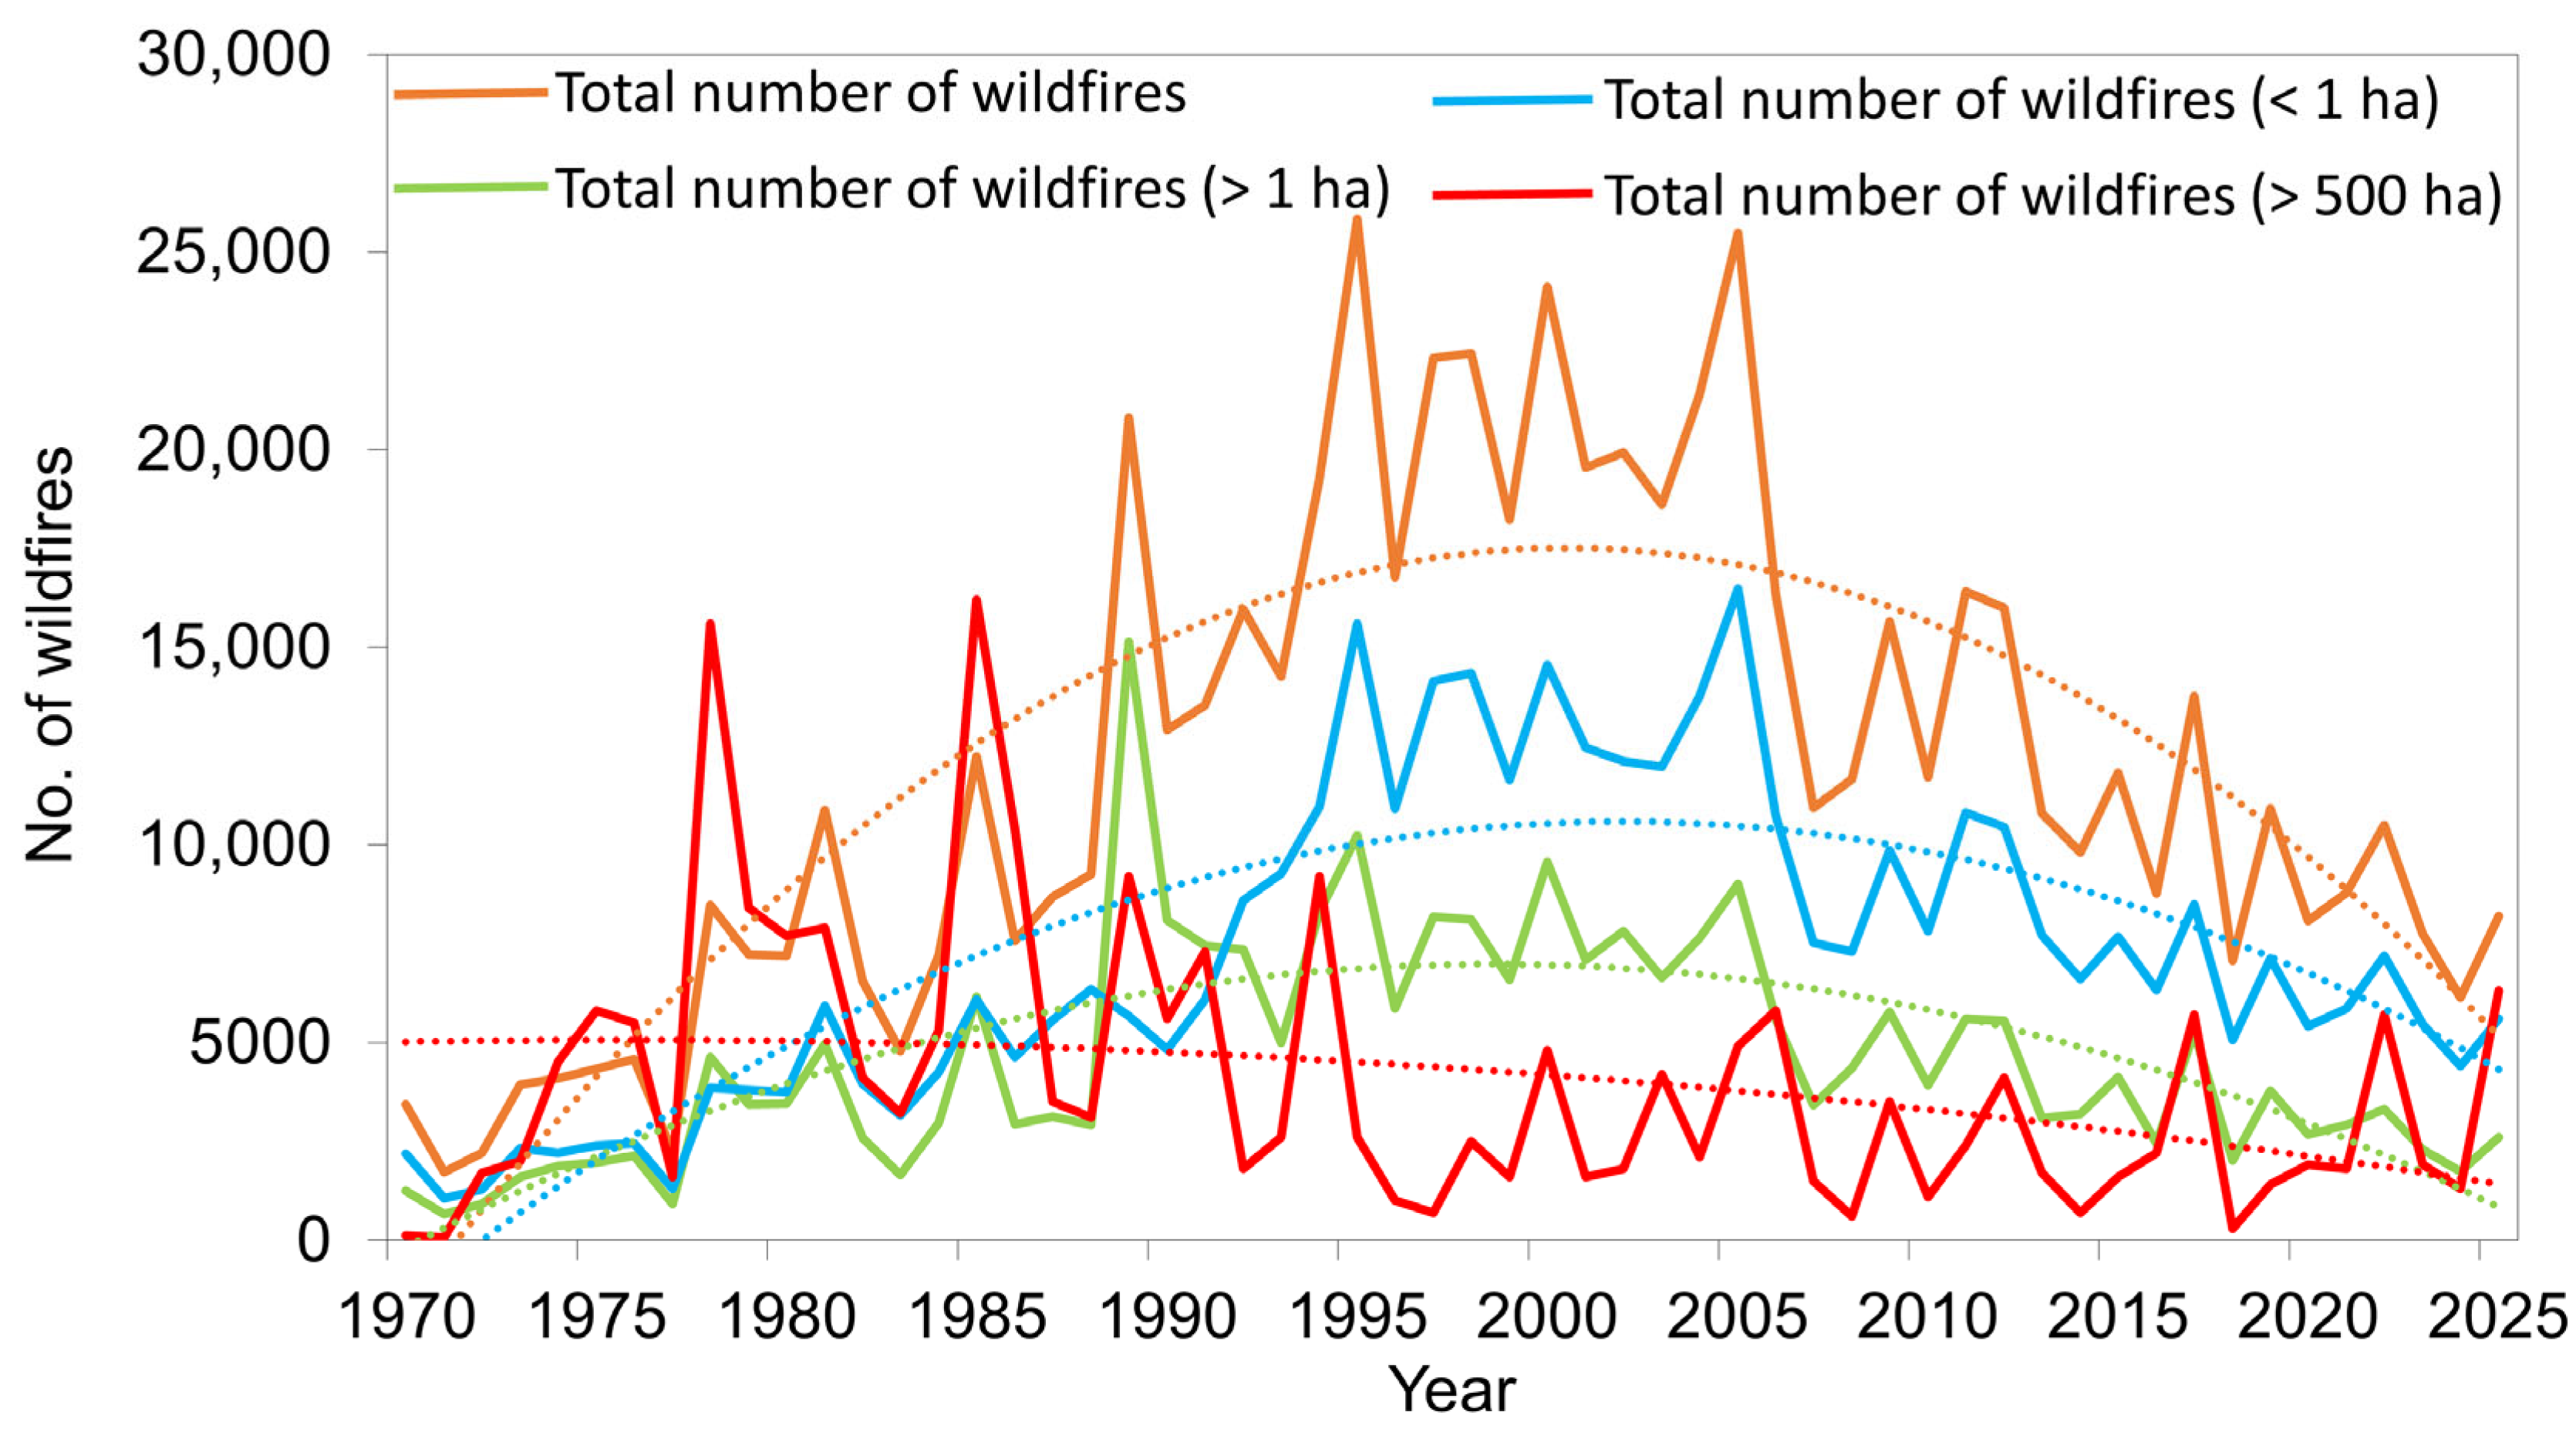
Figure 3 presents a time series illustrating the total number of fires documented from 1970 to 2025, which amounted to 669,000. This corresponds to an average of 12,000 fires per year over the past 55 years. This period culminated in a peak surpassed 25,000 wildfires in 1995 and 2005. A discernible downward trend emerged in the mid-2000s, accompanied by significant year-to-year fluctuations.
Furthermore, these particular years have been documented as those with the highest number of fires resulting in areas less than 1 ha in size. These data exhibit a trend analogous to that of the total, with a pronounced increase from the late 1990s to the early 2000s, reaching over 16,000 events. Subsequently, a gradual decline is observed.
The average number of wildfires with a burned area greater than 1 ha during the 1970–2025 period was 4675 per year. The years 1989 and 1995 have been identified as those with the highest number of fires that exceeded 1 ha of burned land. The years with the lowest incidence of these wildfires were 1971 and 1972.
During the period analyzed, Spain experienced over 2250 large wildfires (those with a burned area exceeding 500 ha), with an average of approximately 40 huge wildfires by year. The years 1985 and 1978 exhibited the highest incidence of fires exceeding 500 ha, with 162 and 156 fires, respectively. The overall trend indicates a slight downward trend over time, marked by 2018 and 2008 years, with minimum fires of 500 ha.
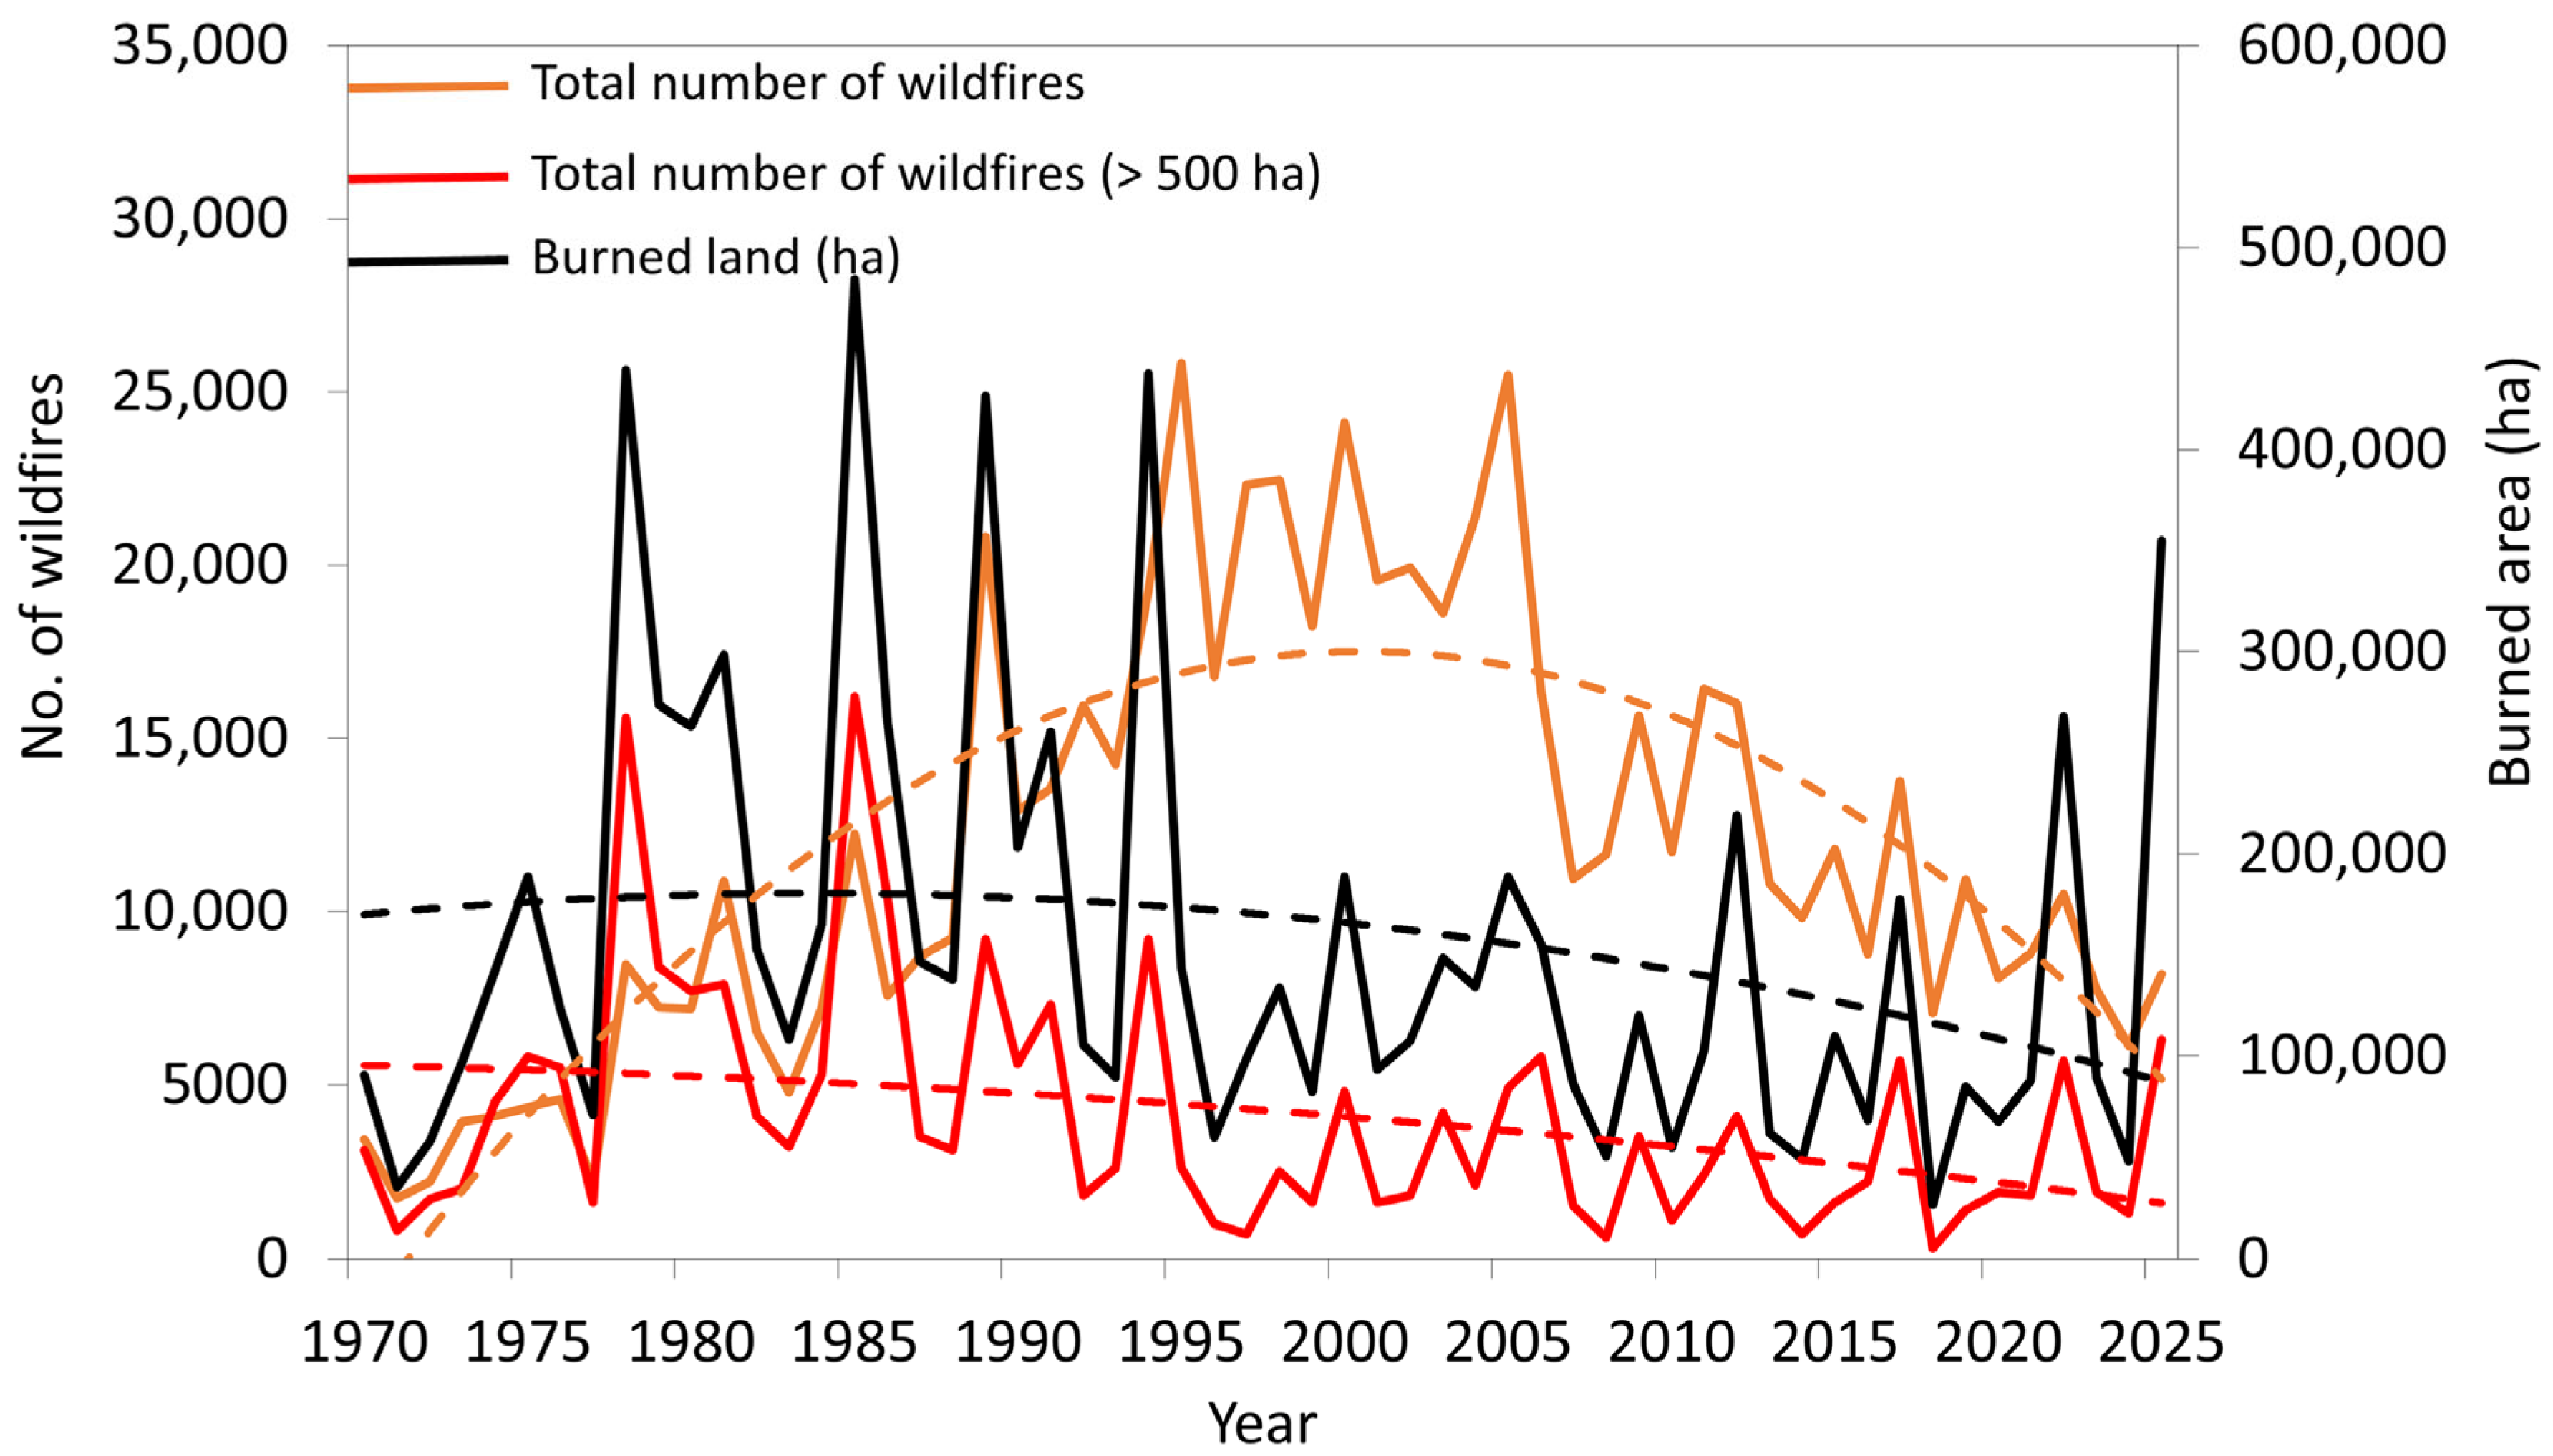
A comparison of the total number of fires, the number of large fires, and the total area burned (in ha), between 1970 and 2025, reveals the following observations (Figure 4):
-
The total area affected by fires in Spain was 8,719,600 ha (87,196 km2). This is comparable to the total area of Azerbaijan or Serbia, and slightly smaller than Portugal.
-
The years with the largest burned areas on record were 1985 and 1978, with nearly 485,000 and 440,000 ha (4850 and 4400 km2), respectively. These years also marked the period with the highest number of large wildfires.
-
The annual average area affected by wildfires over the past 55 years under consideration in this study is approximately 156,000 ha (1560 km2). This area is equivalent to the annual combustion of the entire island of Gran Canaria (Spain).
-
Preliminary findings suggest that the extent of the burned area is more closely associated with the occurrence of large fires than with the total number of fires.
With respect to the causal factors of these wildfires, it has been documented that during the period of 2006 to 2015, the underlying causes of these fires were categorized as follows: 52.7% were identified as arson, 28.1% as negligence and accidents, 12.1% as unknown causes, 4.9% as caused by lightning, and 2.2% as caused by fire rekindling [43].

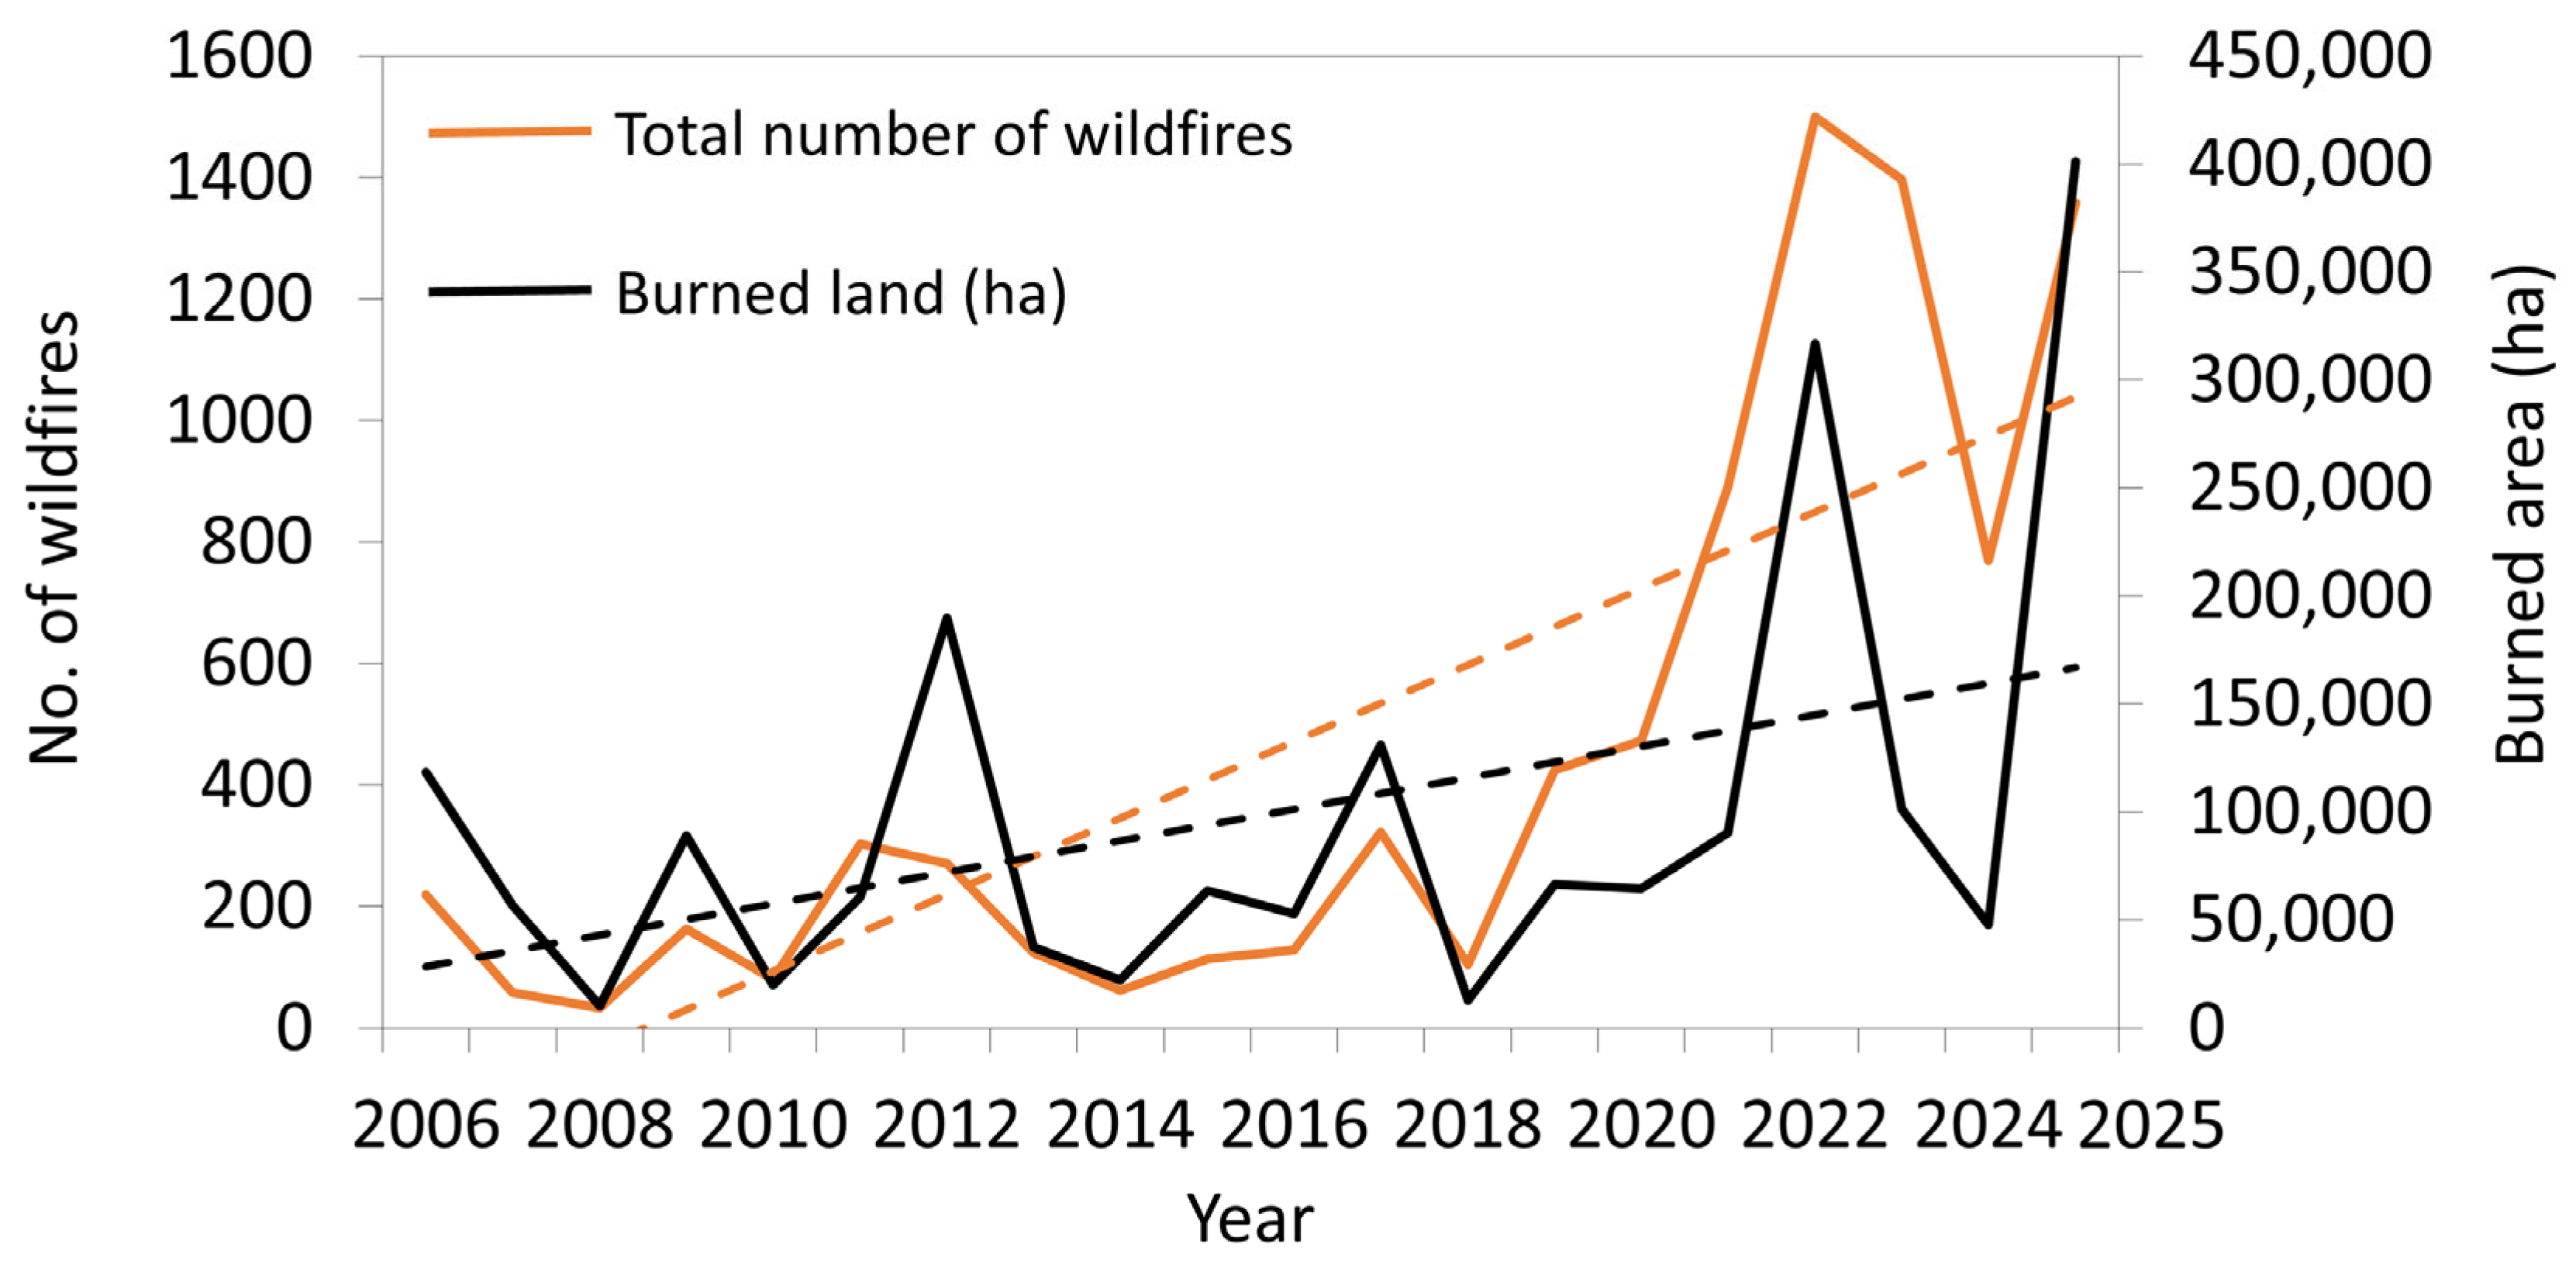
3.3. EFFIS Data

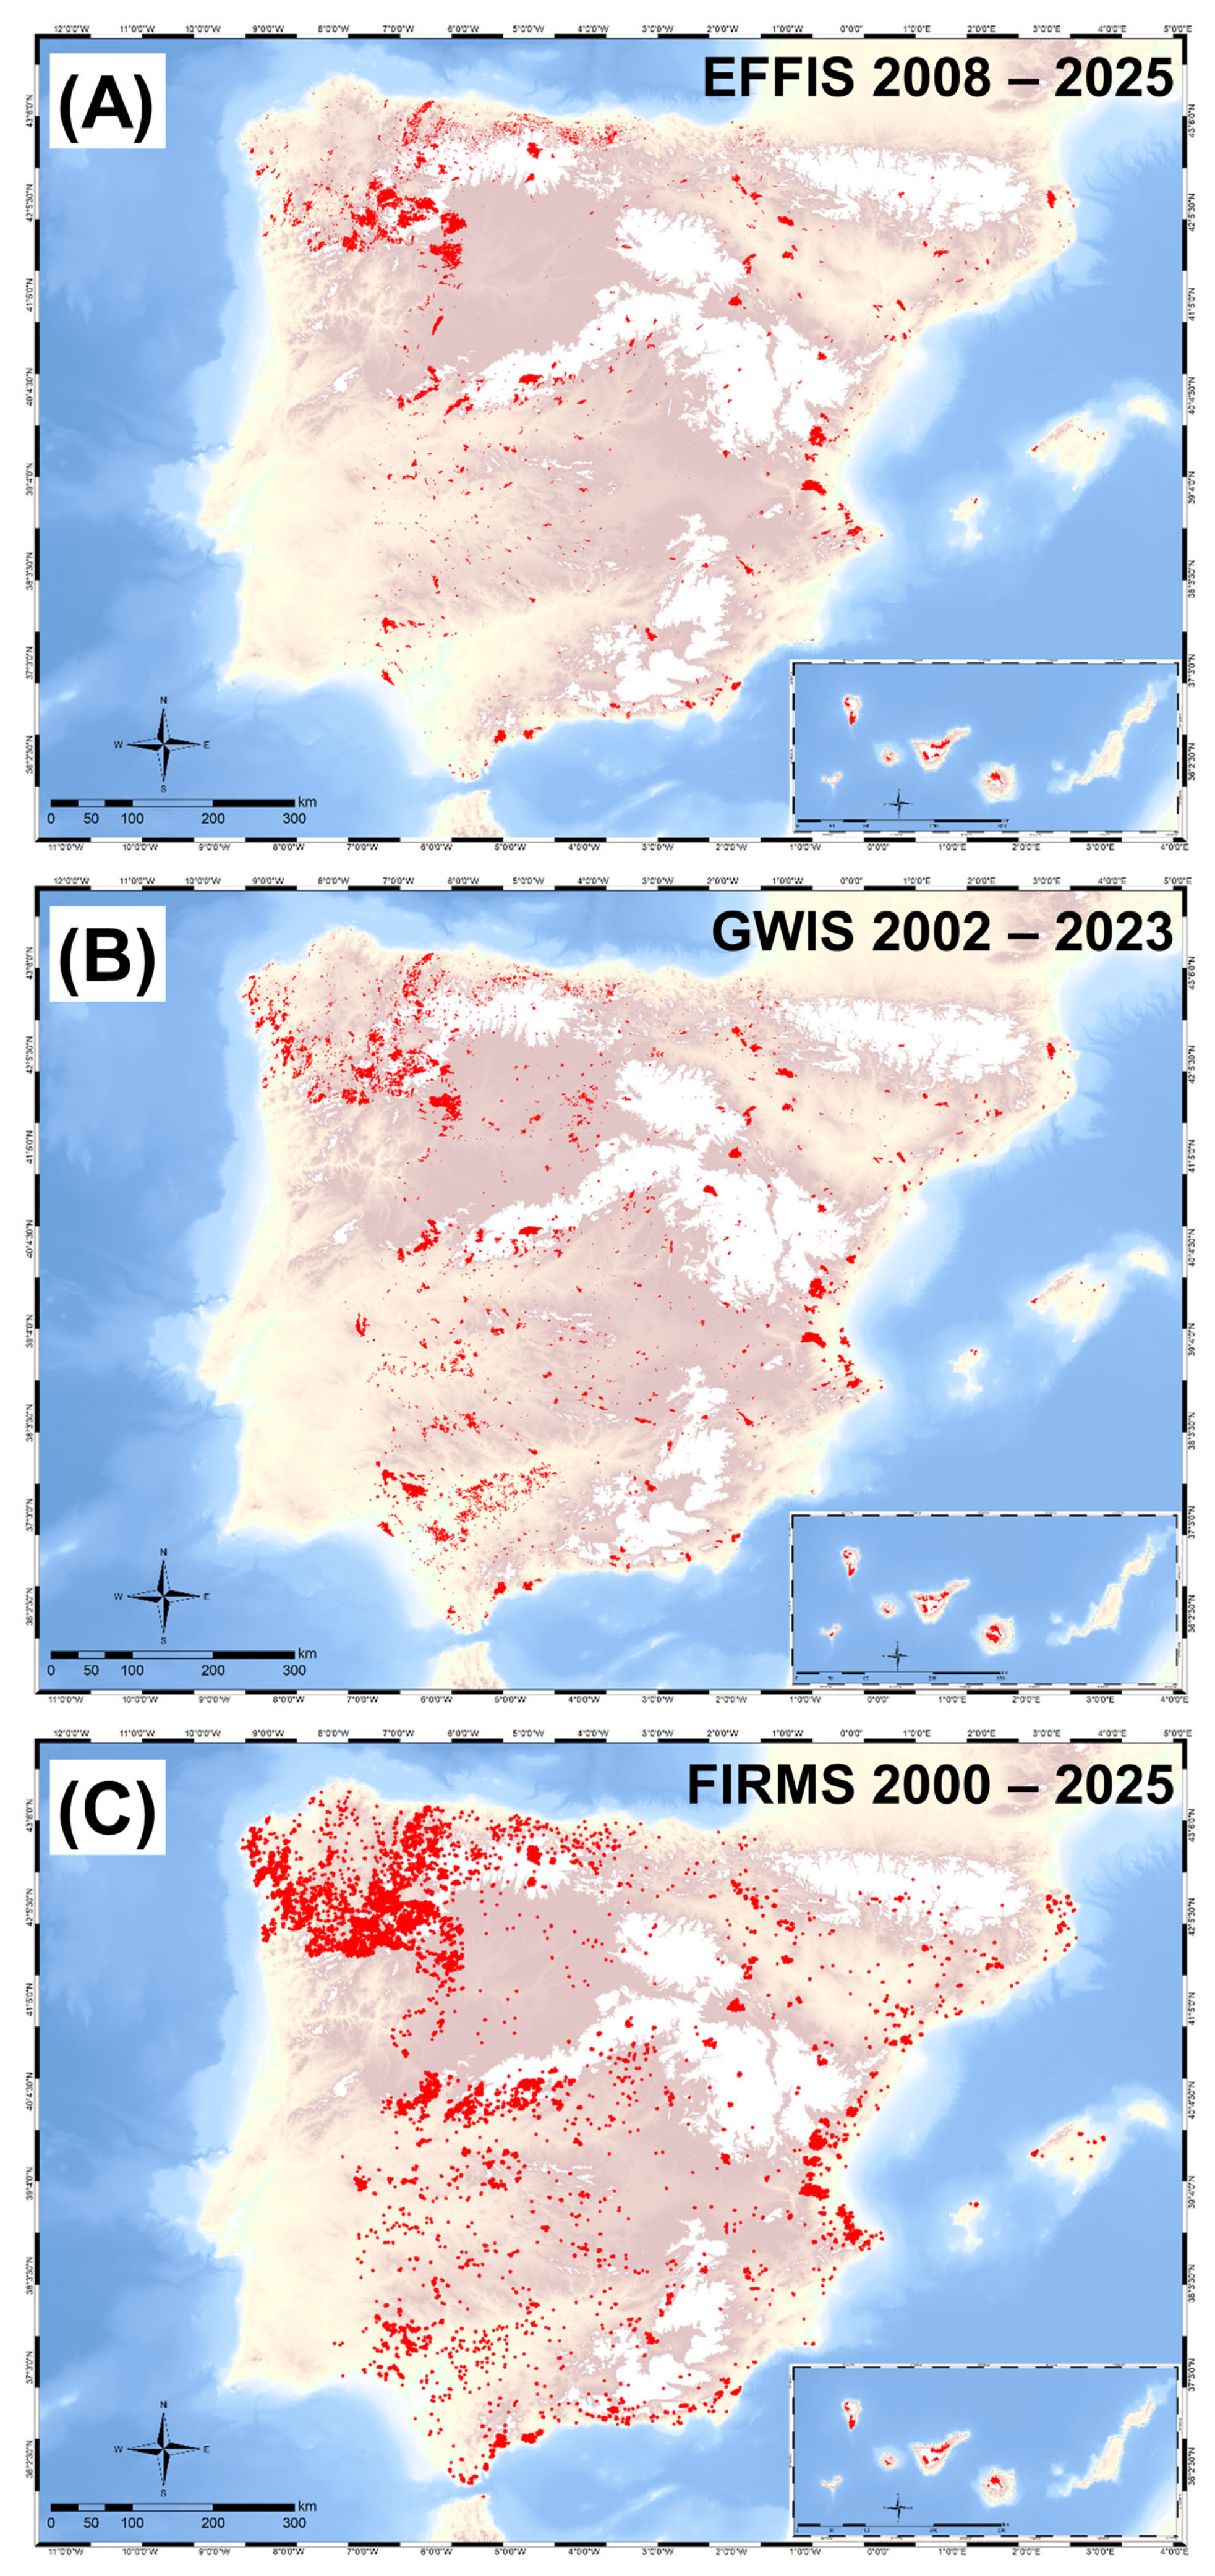
A review of data collected from the EFFIS, reveals that during the period spanning from 2006 to 2025, a total of 8789 wildfires have been documented in Spain, resulting in a total burned area that encompasses nearly 1.8 Mha (Figure 5 and Figure 6A; Table 2), which accounts for approximately 3.5% of the country’s total extension. In absolute terms, the regions most affected in terms of the area burned have been Castile and León, Galicia, and Andalusia. The regions that have experienced the least impact from wildfires have been the Basque Country, Murcia, and La Rioja. In relative terms, the regions most affected by burned area, relative to their respective sizes, have been Cantabria (14%), Galicia (12.8%), and Asturias (12.5%), while the regions least affected by wildfires have been the Basque Country, Murcia, and La Rioja.
The annual average number of wildfires over the past two decades has been approximately 440, with an average area burned of nearly 100,000 ha/year [45]. The regions that have experienced the highest number of fires are Andalusia, Galicia, and Castile and León.
Spain’s land cover encompasses a variety of ecosystems, including scrubland and grasslands (35.8%), savannas (28.4%), croplands (27.5%), forested areas (8%), and other regions (0.4%).
Figure 5 indicates that there is considerable year-to-year variability in both series, particularly in the burned area, which exhibits pronounced peaks. The number of fires has exhibited a slight, gradual, and progressive upward trend over an extended period. The absence of a discernible relationship between the two variables seems evident. This is evidenced by the observation that years with few fires may exhibit substantial burned areas, and conversely, years with high fire activity may demonstrate smaller burned areas. This suggests that the impact of these processes may be more significant in terms of extreme events than in terms of the total number of fires.

3.4. GWIS Data

As indicated by the provided data, the total area affected by wildfires during the period 2002–2023 is estimated to be approximately 2.5 Mha (Figure 6B). The most affected land cover types are grasslands, woody savannas, and croplands (Table 3).
A series of estimates have been formulated based on graphical data (shapefiles) to determine which regions or autonomous communities were most affected during the period in question. About the area that was burned during that period—which exceeded 400,000 ha—the autonomous communities of Castile and León, Andalusia, and Galicia were the most affected. However, when the percentage of area burned is considered relative to the region’s total area, Galicia, Asturias, and the Canary Islands are noteworthy, with 10–15% of their territory experiencing burn-through.

3.5. FIRMS Data

Given the numerous existing uncertainties, if calculations are based on points that are 100% confirmed to be wildfires, and if each point is equivalent to an area of at least 25 ha (500 × 500 m) (Figure 6C), during the period 2000–2025, the minimum burned area would be 413,200 ha. This is considerably smaller (one-fifth) than the reported values for other services [14].
For each region, the fires (points) recorded within its territory can be extracted. Preliminary analysis indicates that the highest concentrations of points are situated in Galicia, Castile and León, the Canary Islands, and Andalusia. The land cover that burned is not registered in the given information.

4. Discussion

Assuming that the planet’s total land area is approximately 14,000 Mha (excluding Antarctica), and based on the data presented by Jones et al. [21], 2.4% of the planet’s land area burned in 2025. Given the anticipated climate change in the coming years, it is probable that this figure will increase. Despite the absence of a consensus among researchers regarding the aspects of climate change that influence the occurrence, role, and impacts of wildfires, there has been a recent proliferation of scientific articles analyzing this natural hazard and its impacts.
In Canada, during 2023, 15 million hectares (Mha) of land were affected by wildfires, which is more than double the previous record of 6.7 Mha set in 1989 [52]. The human impact on the climate resulted in the area burned being at least twice the expected area, leading to an increase in CO2 emissions, which were eight times the average recorded between 1985 and 2022. These authors suggest that the challenges posed by wildfires under climate change require specific responses that integrate scientists, technical experts, and policymakers.
The study by Law et al. [53] quantified, for the period 2006–2020, the extent to which anthropogenic climate change had increased exposure to fine particulate matter (PM2.5) from wildfires and its subsequent impact on human health and the economy in the United States. To this end, they isolated the direct effect of climate change on the burned area and the resulting smoke pollution, distinguishing it from natural climate variability. The following key findings emerged from the researchers’ study: In comparison with a scenario that would have occurred in the absence of climate change, the observed increase in the burned area was 39.0% in forests and 13.3% in non-forested areas. The phenomenon of climate change has been determined to have contributed to approximately 15,000 deaths from PM2.5 pollution caused by wildfires, thereby indicating that nearly 10% of the total mortality can be attributed to wildfires. The aggregate economic burden resulting from these fatalities, ascribed to climate change, amounted to $160 billion. The article’s conclusion is that if trends in climate change, land use, and population remain unchanged, the indirect impacts of climate change on human health through wildfire smoke will continue to rise at an alarming rate. Conversely, if global greenhouse gas emissions were reduced and climate change were mitigated, mortality from wildfire smoke could be significantly reduced.
A recent review carried out by Curt and Curt [54] conducted a systematic review of the scientific literature on wildfires and related policies from the perspective of climate change. The study covered the period from 1997 to 2023. A significant surge in publications was evident starting in 2021, with a greater than 50% of the publications occurring from 2020 onward. Notably, the year 2022 alone accounted for more than 17% of the total compiled. Furthermore, a significant proportion of the articles, specifically 48%, concentrated on the Americas.
Duane et al. [55] evidenced that 35% of Europe’s regions have experienced at least one large-scale wildfire (considering that large-scale fires are those burning between 25 and 59,156 ha) during the period from 2000 to 2022. According to these authors, the number of this type of wildfires per year across Europe is increasing significantly at a rate of 3% annually.
In August 2025, Spain was struck by a series of extreme wildfires, particularly affecting the northwest of the country. In 2025, Spain experienced nearly 8200 wildfires, resulting in approximately 355,000 hectares (ha) of burned area [43], which constitutes 0.1% of the total area burned worldwide. During that year, Spain experienced 63 large wildfires, which is 1.5 times the average for the 1970–2025 period. Over the 55-year period under consideration, 23 years exceeded the average number of major wildfires, including the year 2025, which ranks tenth on that list. Consequently, 2025 was not among the most hazardous years in terms of the quantity of fires; however, it can be categorized among the years with the highest number of significant wildfires [43].
While EM-DAT [4] is recognized for its extensive documentation on natural disasters, its coverage of wildfires appears to be deficient in terms of completeness. It is important to note that the majority of wildfires are not incorporated into the database. This discrepancy can be attributed to the criteria employed in the inclusion of disasters within the scope of this database. Fortunately, the number of people affected, or the economic losses caused by wildfires, are not usually very significant compared to other natural hazards. Nonetheless, environmental losses are considerable, despite their infrequent quantification.
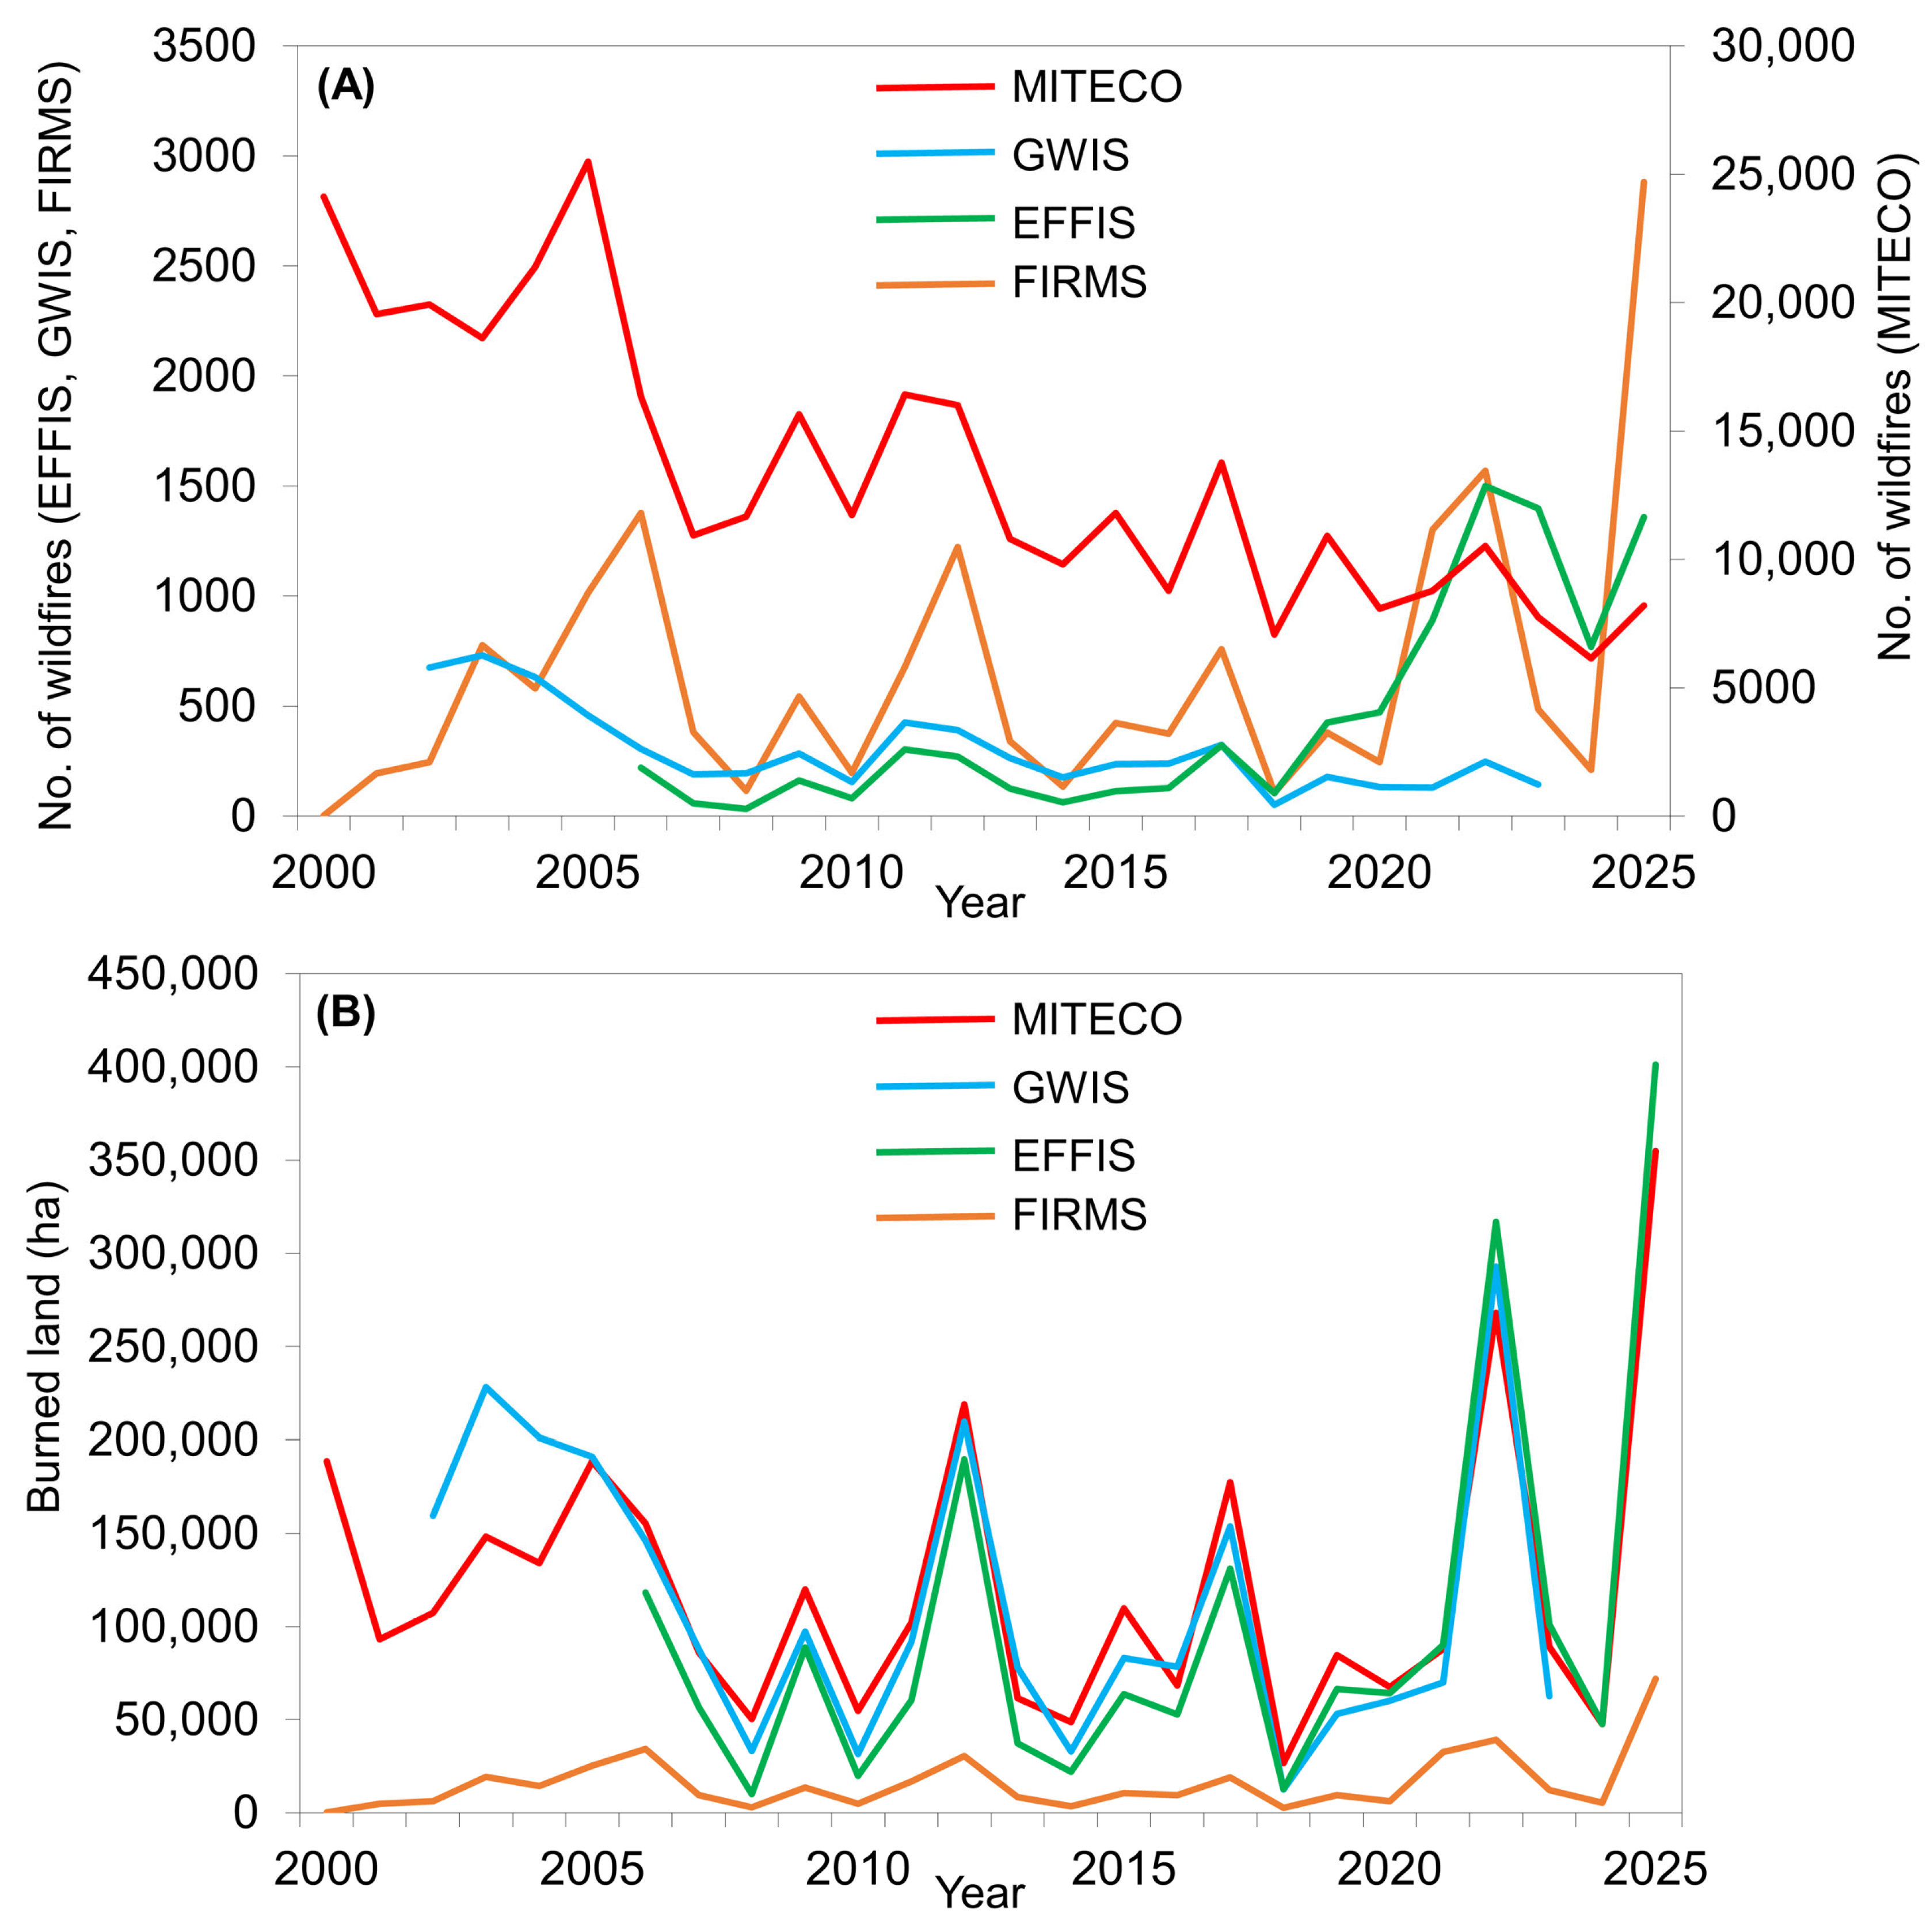
A comparative analysis of the number of fires documented in each database or online service, for the period during which records are available in each, specifically between 2008 and 2023, reveals that the most complete data set is provided by MITECO [43] (Figure 7A). This phenomenon is likely attributable to the more meticulous data collection efforts undertaken by the various regional governments, which are in closer proximity to the local level. Since the beginning of the 21st century, there have been consistent downward trends in the incidence of recorded wildfires [43].
A general observation reveals that the service that records the highest number of fires is the one provided by FIRMS [14]. This is true even though only those points with the highest confidence level were analyzed. It appears that EFFIS [45] has collected more detailed information in recent years, while the data provided by GWIS [41,47] seem to be underestimated, which can be attributed to vectorization of 500 × 500 m pixels into polygons, compared to those from other systems, likely due to the resolution of the data.
The analysis of the burned area in each of the consulted databases (Figure 7B) reveals a similarity in the number of hectares burned annually when comparing MITECO, EFFIS, and GWIS. FIRMS exhibits a tendency to underestimate the number of hectares; nevertheless, it is possible to argue that there is a parallel trend with the data recorded by the other services. This lower count of hectares burned is most likely due to the fact that FIRMS considers only 500 × 500 m grid cells and excludes from the analysis those points that were not 100% certain.
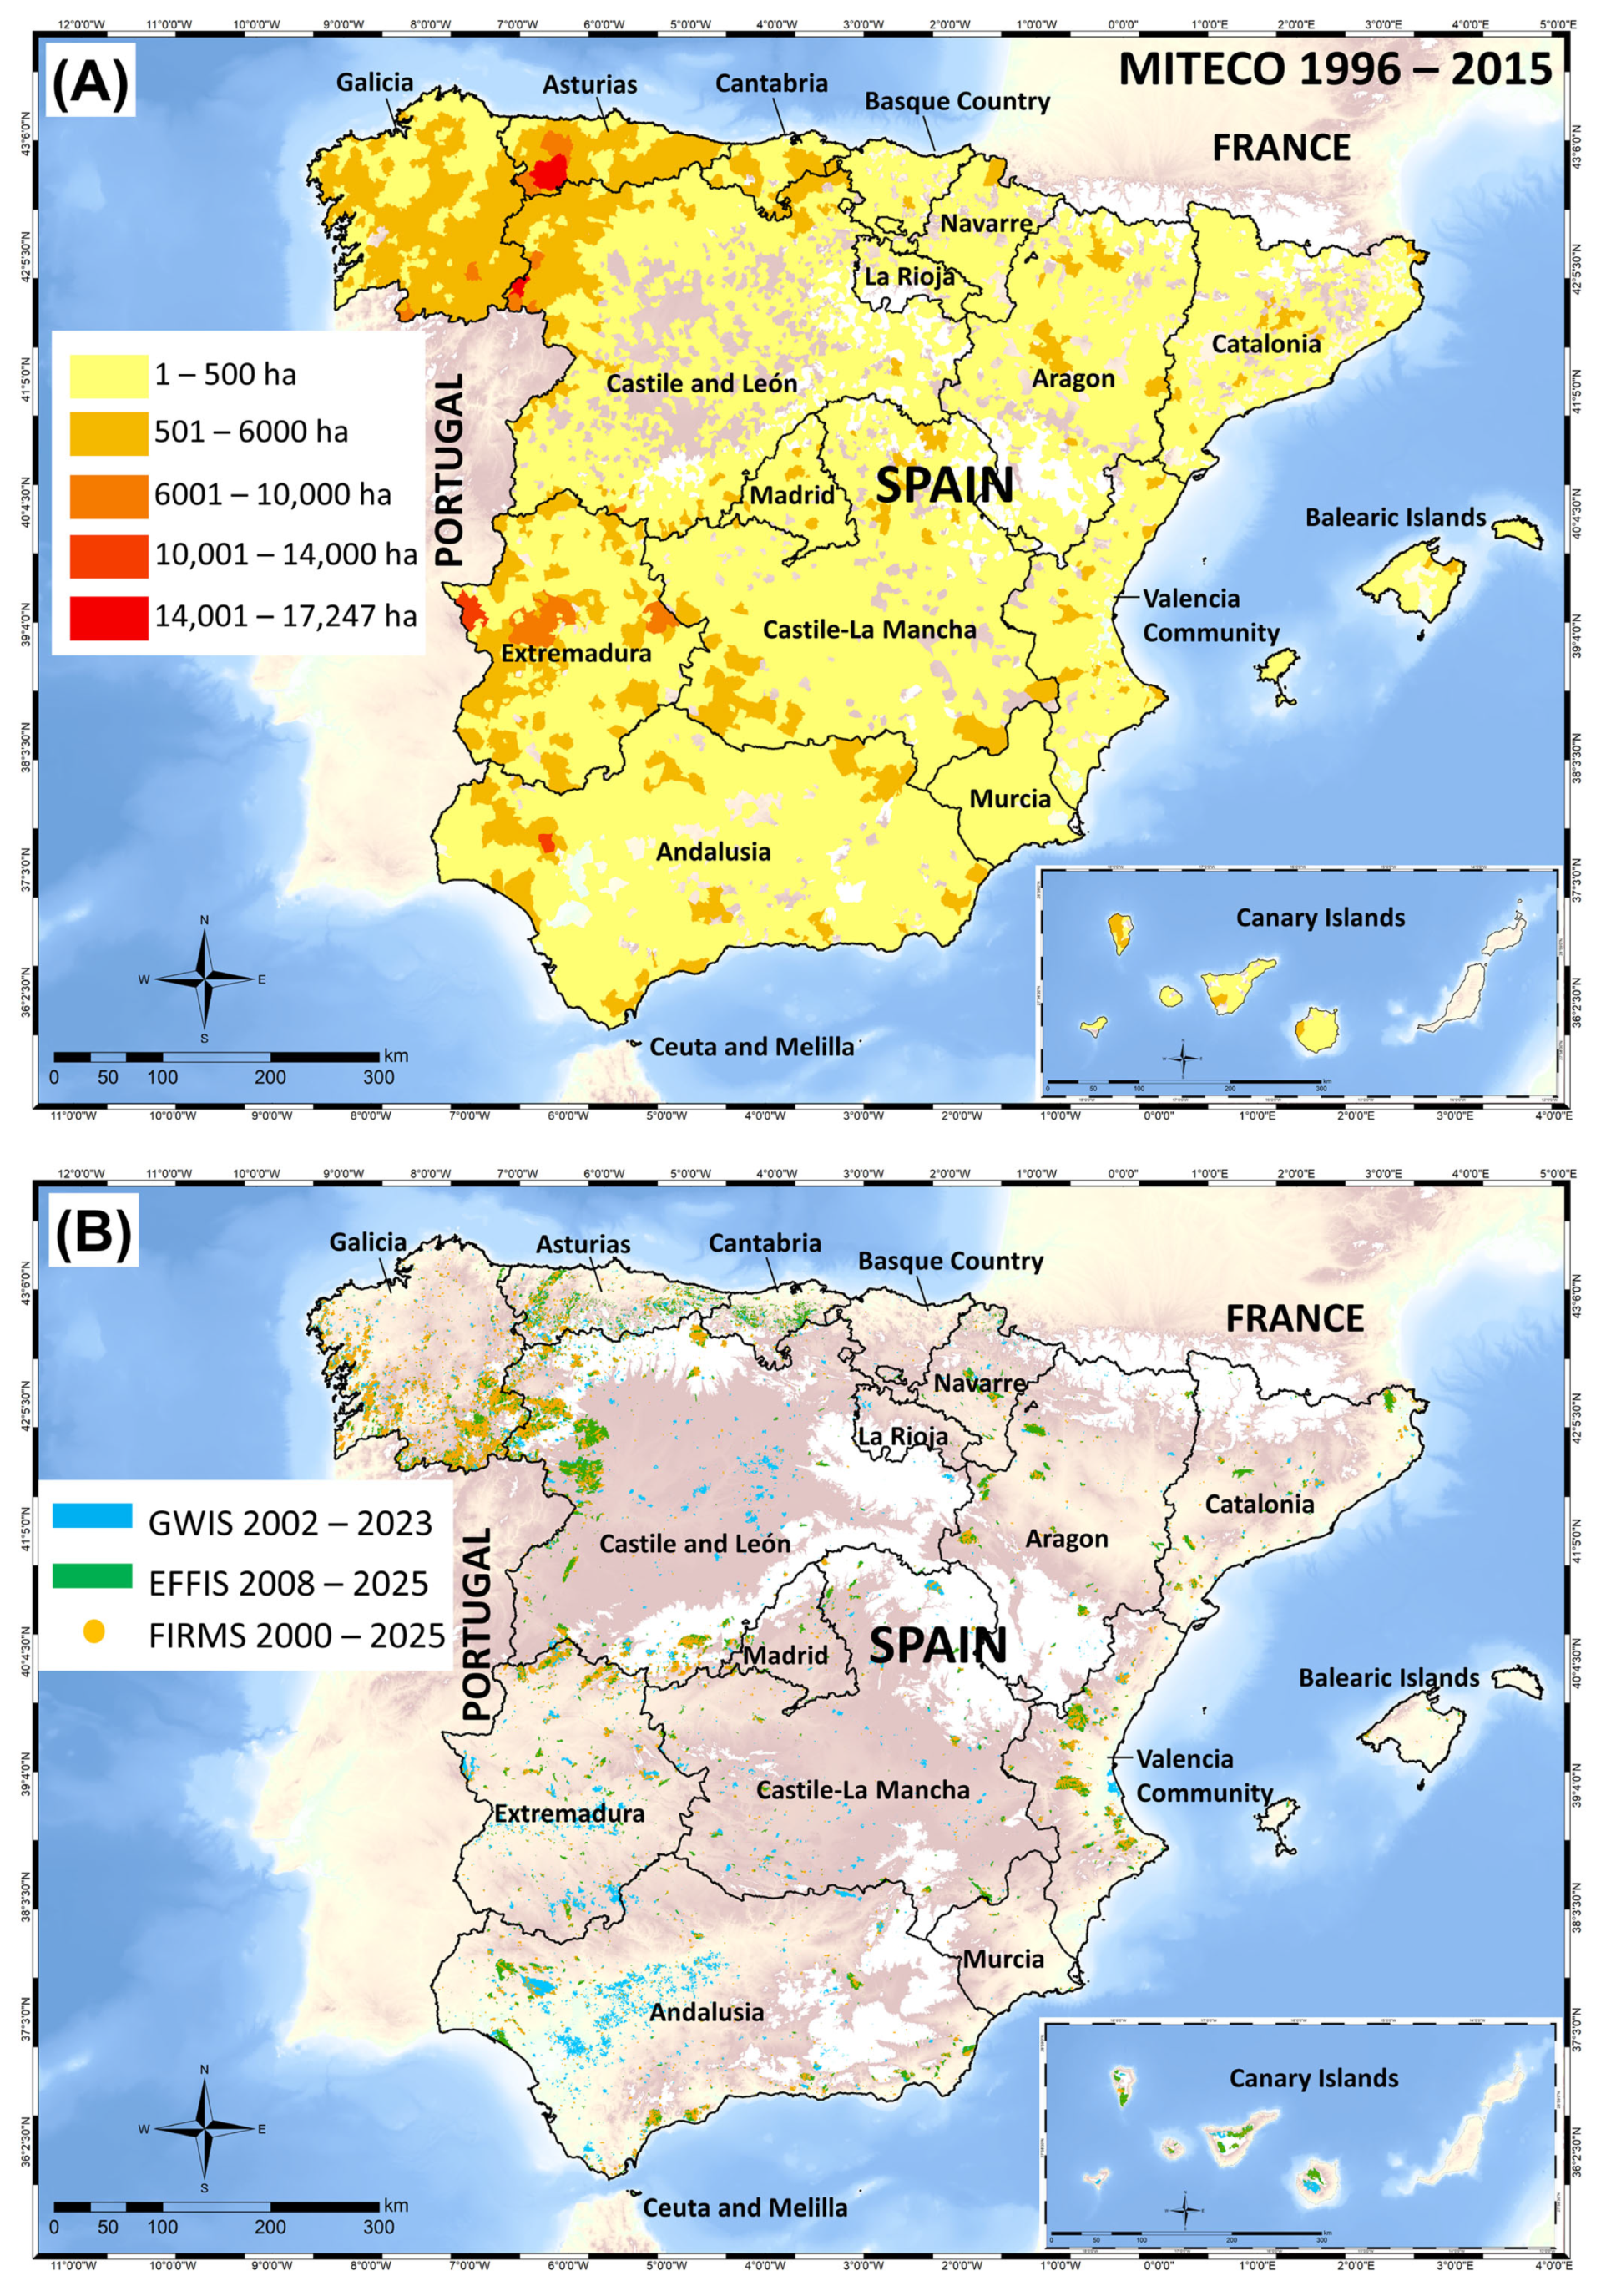
Figure 8 provides a graphical representation of the areas affected by wildfires at different periods, as recorded by the fire monitoring and forecasting databases. A visual comparison of the two maps, despite the absence of congruence in the depicted information, facilitates the identification of areas of predominant wildfire activity. The N, NNW, and W regions appear to be the areas most impacted by wildfires, with the greatest number of hectares affected.
A comprehensive analysis of the geographical distribution of recent wildfires occurrences, along with an assessment of the affected regions and vegetation types, could assist various government agencies in more effectively managing wildfire risk by allocating their resources to areas that are predisposed to such natural hazards, even though, in the majority of cases, wildfires are initiated by human activity.

5. Conclusions

On a global scale, there is an observed trend of an increase in the number of natural disasters, particularly those climate-related, including wildfires. A growing body of research has indicated that the actual impact of wildfires is more closely associated with extreme weather conditions, including droughts and heat waves. It is anticipated that wildfires will become more severe in the future due to the effects of climate change, vegetation serving as fire fuel, and human activity.
Given that in 2025, 2.4% of the Earth’s land area was affected by wildfires [18,21], and that in Spain approximately 400,000 ha (4000 km2) were burned [43]—representing 0.003% of that global total that same year—it is likely that this area will increase in the future. Therefore, it is necessary to identify where wildfires occur most frequently (in certain regions such as Andalusia, Asturias, Cantabria, Castile and Leon, Galicia) and to estimate the total area that may be affected.
In Spain, there has been a recent downward trend in the number of fires, which is likely attributable to the implementation of prevention and land-management policies. However, there has been a notable increase in the frequency of large fires, which are characterized by their intensity and destructive capacity. The preponderance of large fires can be attributable to the confluence of increasingly extreme weather conditions and anthropogenic activities.
The observed discrepancies among the databases examined, as evidenced by variations in the number of wildfires and the areas affected, emphasize the necessity for enhanced standardization and integration of information. In order to enhance the quality of fire-related data submitted by autonomous communities to the Spanish government, it is recommended that a uniform coordinate reference system be employed. Moreover, the validation of this data across various countries should be conducted within a designated timeframe, at least on a European Union-wide basis. Nevertheless, European and international databases have been demonstrated to be a valuable tool for the real-time detection and early response to large fires.
A coordinated approach involving forest management policies, land use practices, and public awareness initiatives has been identified as a fundamental strategy for mitigating the risk of wildfires. The development of strategies founded upon historical data and predictive models is critical for the anticipation of future scenarios and the mitigation of their impacts.

Funding

This research was funded by “Caracterización de materiales, formas y procesos recientes para mejorar la gestión de los recursos y riesgos geológicos” (29.P209.64004, Universidad de Cantabria) [“Characterization of Materials, Methods, and Recent Processes to Improve the Management of Geological Resources and Associated Risks” (29.P209.64004, University of Cantabria, Spain)].

Data Availability Statement

The original contributions presented in this study are included in the article. Further inquiries can be directed to the corresponding author.

Conflicts of Interest

The author declares no conflicts of interest.

References

  1. UNDRR (UN Office for Disaster Risk Reduction). Available online: https://www.undrr.org/ (accessed on 4 May 2026).
  2. Below, R.; Wirtz, A.; Guha-Sapir, D. Disaster Category Classification and Peril Terminology for Operational Purposes; Université Catholique de Louvain, Centre for Research on the Epidemiology of Disasters: Brussels, Belgium, 2009; p. 20. [Google Scholar]
  3. Chaudhary, M.T.; Piracha, A. Natural Disasters—Origins, Impacts, Management. Encyclopedia 2021, 1, 1101–1131. [Google Scholar] [CrossRef] [Scilit]
  4. CRED (Centre for Research on the Epidemiology of Disasters). UCLouvain EM-DAT. Available online: https://www.emdat.be (accessed on 4 May 2026).
  5. Bolan, S.; Padhye, L.P.; Jasemizad, T.; Govarthanan, M.; Karmegam, N.; Wijesekara, H.; Amarasiri, D.; Hou, D.; Zhou, P.; Biswal, B.K.; et al. Impacts of Climate Change on the Fate of Contaminants through Extreme Weather Events. Sci. Total Environ. 2024, 909, 168388. [Google Scholar] [CrossRef] [Scilit]
  6. Van Wyk De Vries, M. All Hazards Are Multihazards, Few of Them Are Natural. npj Nat. Hazards 2025, 2, 18. [Google Scholar] [CrossRef] [Scilit]
  7. Vieira, D.C.S.; Borrelli, P.; Scarpa, S.; Liakos, L.; Ballabio, C.; Panagos, P. Global Estimation of Post-Fire Soil Erosion. Nat. Geosci. 2026, 19, 59–67. [Google Scholar] [CrossRef] [Scilit]
  8. Akosah, S.; Gratchev, I. Systematic Review of Post-Wildfire Landslides. GeoHazards 2025, 6, 12. [Google Scholar] [CrossRef] [Scilit]
  9. EarthScope Consortium. Interactive Earthquake Browser. Available online: https://www.earthscope.org/app/ieb/ (accessed on 4 May 2026).
  10. National Geophysical Data Center. Global Historical Tsunami Database. Available online: https://data.noaa.gov/metaview/page?xml=NOAA/NESDIS/NGDC/MGG/Hazards/iso/xml/G02151.xml&view=getDataView (accessed on 4 May 2026).
  11. World Organization of Volcano Observatories (WOVO). Wovodat. Available online: https://wovodat.org/gvmid/index.php?type=world (accessed on 4 May 2026).
  12. DFO-Flood Observatory (DFO). Global Flood Records. Available online: https://floodobservatory.colorado.edu/wiki/FloodRecords (accessed on 4 May 2026).
  13. University of Sheffield. Global Fatal Landslide Database (GFLD). Available online: https://shefuni.maps.arcgis.com/apps/webappviewer/index.html?id=98462998953c4f1fbd7caaa166373f63 (accessed on 4 May 2026).
  14. NASA. Fire Information for Resource Management System (FIRMS). Available online: https://firms.modaps.eosdis.nasa.gov/map/ (accessed on 19 June 2026).
  15. Asian Disaster Reduction Centre (ADRC): Welcome to the GLIDEnumber Initiative. Available online: https://www.glidenumber.net/ (accessed on 4 May 2026).
  16. UNDRR. DesConsultar On-Line Main Menu. Available online: https://www.desinventar.net/DesInventar/ (accessed on 4 May 2026).
  17. Global Infrastructure Risk Metrics Map Viewer–GIRI. Available online: https://giri.unepgrid.ch/map?list=explore (accessed on 4 May 2026).
  18. Munich Re. NatCatSERVICE. Available online: https://www.munichre.com/en/solutions/for-industry-clients/natcatservice.html (accessed on 4 May 2026).
  19. International Science Council Research on Disaster Risk (IRDR). 2024 Global Natural Disaster Assessment Report; Integrated Research on Disaster Risk (IRDR): Beijing, China, 2025; p. 51. [Google Scholar]
  20. Arcos, P.; Suárez, N.; Castro, R.; Cernuda, J.A. Disasters in Spain from 1950–2020: Impact on Public Health. Prehosp. Disaster Med. 2023, 38, 264–269. [Google Scholar] [CrossRef] [Scilit]
  21. Jones, M.W.; Abatzoglou, J.T.; Burton, C.; Fernandes, P.M.; Jain, P.; Keeping, T.; Tanpipat, V.; Kolden, C.A. Wildfires in 2025. Nat. Rev. Earth Environ. 2026, 7, 334–336. [Google Scholar] [CrossRef] [Scilit]
  22. Rabin, S.S.; Gérard, F.N.; Arneth, A. The Influence of Thinning and Prescribed Burning on Future Forest Fires in Fire-Prone Regions of Europe. Environ. Res. Lett. 2022, 17, 055010. [Google Scholar] [CrossRef] [Scilit]
  23. Bento, V.A.; Lima, D.C.A.; Santos, L.C.; Lima, M.M.; Russo, A.; Nunes, S.A.; DaCamara, C.C.; Trigo, R.M.; Soares, P.M.M. The Future of Extreme Meteorological Fire Danger under Climate Change Scenarios for Iberia. Weather Clim. Extrem. 2023, 42, 100623. [Google Scholar] [CrossRef] [Scilit]
  24. Meier, S.; Elliott, R.J.R.; Strobl, E. The Regional Economic Impact of Wildfires: Evidence from Southern Europe. J. Environ. Econ. Manag. 2023, 118, 102787. [Google Scholar] [CrossRef] [Scilit]
  25. Peña, G. Wildfire Impacts on Spanish Municipal Population. J. Environ. Manag. 2025, 377, 124504. [Google Scholar] [CrossRef] [Scilit]
  26. Quishpe-Vásquez, C.; Oliva, P.; López-Barrera, E.A.; Casallas, A. Wildfires Impact on PM2.5 Concentration in Galicia Spain. J. Environ. Manag. 2024, 367, 122093. [Google Scholar] [CrossRef] [Scilit]
  27. Ye, X.; Ye, Y.; Huang, X.; Onega, T. Wildfires and Public Health: A Comprehensive Review of Human-Centric Studies. GeoHealth 2026, 10, e2025GH001534. [Google Scholar] [CrossRef] [Scilit]
  28. Romanello, M.; Walawender, M.; Hsu, S.C.; Moskeland, A.; Palmeiro-Silva, Y.; Scamman, D.; Smallcombe, J.W.; Abdullah, S.; Ades, M.; Al-Maruf, A.; et al. The 2025 Report of the Lancet Countdown on Health and Climate Change: Climate Change Action Offers a Lifeline. Lancet 2025, 406, 2804–2857. [Google Scholar] [CrossRef] [Scilit]
  29. Jones, M.W.; Kelley, D.I.; Burton, C.A.; Di Giuseppe, F.; Barbosa, M.L.F.; Brambleby, E.; Hartley, A.J.; Lombardi, A.; Mataveli, G.; McNorton, J.R.; et al. State of Wildfires 2023–2024. Earth Syst. Sci. Data 2024, 16, 3601–3685. [Google Scholar] [CrossRef] [Scilit]
  30. Ejaz, N.; Choudhury, S. A Comprehensive Survey of the Machine Learning Pipeline for Wildfire Risk Prediction and Assessment. Ecol. Inform. 2025, 90, 103325. [Google Scholar] [CrossRef] [Scilit]
  31. Teymoor, S.; Abatzoglou, J.T.; Jones, M.W.; Kolden, C.A.; Filippelli, G.; Hurteau, M.D.; AghaKouchak, A.; Luce, C.H.; Miao, C.; Sadegh, M. Increasing Global Human Exposure to Wildland Fires despite Declining Burned Area. Science 2025, 389, 826–829. [Google Scholar] [CrossRef] [Scilit]
  32. Torres-Vázquez, M.Á.; Vaglie, M.D.; Kettridge, N.; Martellozzo, F.; Miguez-Macho, G.; Provenzale, A.; Royé, D.; Randelli, F.; Turco, M. Assessing Decadal Changes in Human Exposure near Wildfires in a Mediterranean Region. Sci. Rep. 2026, 16, 5827. [Google Scholar] [CrossRef] [Scilit]
  33. Ministerio de Interior-Gobierno de España Secretaría General de Protección Civil y Emergencias. Available online: https://www.proteccioncivil.es/documentacion/informes (accessed on 10 June 2026).
  34. Calheiros, T.; Nunes, J.P.; Pereira, M.G. Recent Evolution of Spatial and Temporal Patterns of Burnt Areas and Fire Weather Risk in the Iberian Peninsula. Agric. For. Meteorol. 2020, 287, 107923. [Google Scholar] [CrossRef] [Scilit]
  35. Couto, F.T.; Santos, F.L.M.; Campos, C.; Andrade, N.; Purificação, C.; Salgado, R. Is Portugal Starting to Burn All Year Long? The Transboundary Fire in January 2022. Atmosphere 2022, 13, 1677. [Google Scholar] [CrossRef] [Scilit]
  36. Boccard, N. On the Prevalence of Forest Fires in Spain. Nat. Hazards 2022, 114, 1043–1057. [Google Scholar] [CrossRef] [Scilit]
  37. Hammed, R.A.; Alawode, G.L.; Montoya, L.E.; Krasovskiy, A.; Kraxner, F. Exploring Drivers of Wildfires in Spain. Land 2024, 13, 762. [Google Scholar] [CrossRef] [Scilit]
  38. Bugallo, M.; Esteban, M.D.; Marey-Pérez, M.F.; Morales, D. Pattern Recognition and Modelling of Virulent Wildfires in Spain. Int. J. Wildland Fire 2025, 34, WF23162. [Google Scholar] [CrossRef] [Scilit]
  39. Chas-Amil, M.-L.; García-Martínez, E.; Touza, J. Iberian Peninsula October 2017 Wildfires: Burned Area and Population Exposure in Galicia (NW of Spain). Int. J. Disaster Risk Reduct. 2020, 48, 101623. [Google Scholar] [CrossRef] [Scilit]
  40. Marey, M.; Loureiro, X.; Corbelle, E.J.; Fernández-Filgueira, C. Different Strategies for Resilience to Wildfires: The Experience of Collective Land Ownership in Galicia (Northwest Spain). Sustainability 2021, 13, 4761. [Google Scholar] [CrossRef] [Scilit]
  41. Global Wildfire Information System Annual Area Burnt by Wildfires–GWIS (MODIS & VIIRS). Available online: https://www.earthdata.nasa.gov/data/catalog/lpcloud-mcd64a1-061 (accessed on 18 March 2026).
  42. Delforge, D.; Wathelet, V.; Below, R.; Sofia, C.L.; Tonnelier, M.; Van Loenhout, J.A.F.; Speybroeck, N. EM-DAT: The Emergency Events Database. Int. J. Disaster Risk Reduct. 2025, 124, 105509. [Google Scholar] [CrossRef] [Scilit]
  43. MITECO-Gobierno de España. Estadísticas de Incendios Forestales; Technical Report; Ministerio para la Transición Ecológica y el Reto Demográfico: Madrid, Spain, 2025. Available online: https://www.miteco.gob.es/es/biodiversidad/temas/incendios-forestales/estadisticas-avances.html (accessed on 10 June 2026).
  44. Linley, G.D.; Jolly, C.J.; Doherty, T.S.; Geary, W.L.; Armenteras, D.; Belcher, C.M.; Bliege, R.; Duane, A.; Fletcher, M.; Giorgis, M.A.; et al. What Do You Mean, ‘Megafire’? Glob. Ecol. Biogeogr. 2022, 31, 1906–1922. [Google Scholar] [CrossRef] [Scilit]
  45. European Union. European Forest Fire Information System. Available online: https://forest-fire.emergency.copernicus.eu/ (accessed on 4 June 2026).
  46. Sedano, F.; Maianti, P.; Boca, R.; Suarez-Moreno, M.; Broglia, M.; de Rigo, D.; Roglia, E.; Branco, A.; San-Miguel-Ayanz, J.; Durrant, T.; et al. Advance Report on Forest Fires in Europe, Middle East and North Africa 2025; Publications Office of the European Union: Luxembourg, 2026. [Google Scholar]
  47. European Union. Global Wildfire Information System. Available online: https://gwis.jrc.ec.europa.eu/ (accessed on 9 June 2026).
  48. Artés, T.; Oom, D.; De Rigo, D.; Durrant, T.H.; Maianti, P.; Libertà, G.; San-Miguel-Ayanz, J.A. Global Wildfire Dataset for the Analysis of Fire Regimes and Fire Behaviour. Sci. Data 2019, 6, 296. [Google Scholar] [CrossRef] [Scilit]
  49. Giglio, L.; Descloitres, J.; Justice, C.O.; Kaufman, Y.J. An Enhanced Contextual Fire Detection Algorithm for MODIS. Remote Sens. Environ. 2003, 87, 273–282. [Google Scholar] [CrossRef] [Scilit]
  50. Schroeder, W.; Oliva, P.; Giglio, L.; Csiszar, I.A. The New VIIRS 375 m Active Fire Detection Data Product: Algorithm Description and Initial Assessment. Remote Sens. Environ. 2014, 143, 85–96. [Google Scholar] [CrossRef] [Scilit]
  51. EMODnet Map Viewer. Available online: https://emodnet.ec.europa.eu/geoviewer/ (accessed on 6 May 2026).
  52. Kirchmeier-Young, M.C.; Malinina, E.; Barber, Q.E.; Garcia Perdomo, K.; Curasi, S.R.; Liang, Y.; Jain, P.; Gillett, N.P.; Parisien, M.-A.; Cannon, A.J.; et al. Human Driven Climate Change Increased the Likelihood of the 2023 Record Area Burned in Canada. npj Clim. Atmos. Sci. 2024, 7, 316. [Google Scholar] [CrossRef] [Scilit]
  53. Law, B.E.; Abatzoglou, J.T.; Schwalm, C.R.; Byrne, D.; Fann, N.; Nassikas, N.J. Anthropogenic Climate Change Contributes to Wildfire Particulate Matter and Related Mortality in the United States. Commun. Earth Environ. 2025, 6, 336. [Google Scholar] [CrossRef] [Scilit]
  54. Curt, C.; Curt, T. A Review of the Literature on Wildfires in the Context of Climate Change. Fire 2026, 9, 52. [Google Scholar] [CrossRef] [Scilit]
  55. Duane, A.; Moghli, A.; Coll, L.; Vega, C. On the Evidence of Contextually Large Fires in Europe Based on Return Period Functions. Appl. Geogr. 2025, 176, 103539. [Google Scholar] [CrossRef] [Scilit]
Figure 1. Classification of natural disasters available in the EM-DAT database [4]. Dotted trend lines, fitted to a linear equation, are exhibited for each of the series presented, with projections extending to the year 2050.
Geohazards 07 00105 g001
Figure 2. Number of climatological-related disasters that have been recorded in EM-DAT worldwide from 1970 to 2025. It also includes wildfires disasters at the global and Spanish levels. The trends exhibited by the respective variables, when fitted to a linear equation, are represented by dashed lines. The purpose of this representation is to facilitate the comprehension of the reader regarding the potential future trends.
Geohazards 07 00105 g002
Figure 3. Number of fires that occurred in Spain during a 55-year period [43], spanning from 1970 to 2025. For a better visualization, wildfires > 500 ha have been multiplied by 100. 2nd order polynomial trend lines are plotted for each of the series shown.
Geohazards 07 00105 g003
Figure 4. Total number of wildfires, wildfires exceeding 500 ha and burned land (ha) in Spain for the 1970–2025 period [43]. The trends exhibited by the respective variables, when fitted to a 2nd order polynomial, are plotted by dashed lines. The purpose of this representation is to facilitate the comprehension of the reader regarding the potential future trends. Note: to facilitate the visualization of wildfires larger than 500 ha (red color), the figures have been multiplied by 100.
Geohazards 07 00105 g004
Figure 5. Total number of wildfires and burned land (ha) in Spain from 2006 to 2025 [45]. The trends exhibited by the respective variables, when fitted to a linear equation, are represented by dashed lines. The purpose of this representation is to facilitate the comprehension of the reader regarding the potential future trends.
Geohazards 07 00105 g005
Figure 6. Graphical representation, during the specified period, of the areas affected by wildfires (delineated in red to facilitate comparisons) in Spain, based on data from: (A) EFFIS (polygons) [45]; (B) GWIS (polygons) [41,47]; and (C) FIRMS (points) [14]. Base map obtained from [51].
Geohazards 07 00105 g006
Figure 7. Representation of the (A) number of fires and (B) burned land (ha), as documented in various databases [14,41,43,45,47], for the 21st century.
Geohazards 07 00105 g007
Figure 8. (A) Number of hectares that have been burned, by municipality, in Spain, based on MITECO data [43] from 1996–2015. (B) Graphical representation of the total hectares that have been burned in Spain, based on EFFIS data [45] (2008–2025 period), GWIS data [41,47] (2002–2023 period), and FIRMS data [14] (2000–2025 period) systems. It should be noted that the areas affected by fires recorded by EFFIS and GWIS may overlap. To enhance clarity, the names of the regions listed in Table 2 are also included here. Base map obtained from [51].
Geohazards 07 00105 g008
Table 1. Different databases that compile information on natural disasters worldwide.
NameWeb PageHazardOrganization
IEB—Interactive Earthquake Browser[9]EarthquakeEarthScope Consortium
Global Historical Tsunami Database[10]TsunamiNational Oceanic and Atmospheric Administration (NOAA)
Global Volcano Monitoring Infrastructure Database (GVMID)[11]VolcanoThe World Organization of Volcano Observatories
DFO Flood Observatory[12]FloodUniversity of Colorado
Global Fatal Landslide Database (GFLD)[13]LandslideUniversity of Sheffield
Fire Information for Resource Management System (FIRMS)[14]WildfireNASA
Centre for Research on the Epidemiology of Disasters (CRED)[4]DisastersUCLouvain EM-DAT
GLobal IDEntifier Number (GLIDE)[15]DisastersAsian Disaster Reduction Center (ADRC)
Disaster Inventory System, DesInventar[16]DisastersUnited Nations International Strategy for Disaster Reduction
Global Infrastructure Risk Metrics[17]DisastersCoalition for Disaster Resilient Infrastructure (CDRI)
Natural Catastrophe Tool (NatCatSERVICE)[18]DisastersMunich Reinsurance Company
Table 2. Data on burned land and extension of the region (ha) and percentage normalized by extension, by each Spanish region, from 2008 to 2025.
Spanish RegionsBurned Land (ha)Region Area (ha)% Burned Land/Region Area
Andalusia155,5518,759,9001.78
Aragon82,5764,772,0001.73
Asturias132,6731,060,40012.51
Balearic Islands5476499,2001.10
Basque Country3978723,4000.55
Canary Islands57,906744,7007.78
Cantabria74,865532,10014.07
Castile and León414,9729,422,4004.40
Castile-La Mancha79,1397,946,1001.00
Catalonia60,0283,211,3001.87
Ceuta and Melilla24832007.75
Extremadura138,5674,163,4003.33
Galicia379,6532,957,50012.84
La Rioja775504,5000.15
Madrid12,608802,8001.57
Murcia29901,131,4000.26
Navarre36,8501,039,1003.55
Valencia Community137,4962,325,5005.91
Total1,776,35150,598,9003.51
Table 3. Land cover units and extension area (ha) obtained from 2002 to 2023 from [41,47].
Land CoverLand Cover Area (ha)
Closed shrublands2913
Croplands564,943
Deciduous Broadleaf forest6165
Evergreen Broadleaf forest32,874
Evergreen Needleleaf forest71,639
Grasslands901,493
Mixed forest10,131
Open shrublands31,290
Savannas195,510
Unclassified404
Urban and built-up878
Water769
Woody savannas623,347
Disclaimer/Publisher’s Note: The statements, opinions and data contained in all publications are solely those of the individual author(s) and contributor(s) and not of MDPI and/or the editor(s). MDPI and/or the editor(s) disclaim responsibility for any injury to people or property resulting from any ideas, methods, instructions or products referred to in the content.