Article

Nanosecond-Laser-Induced Breakdown of Aqueous Colloidal Solutions of Dysprosium Nanoparticles: The Influence of Nanoparticle Concentration on the Breakdown Plasma and the Intensity of Physical and Chemical Processes

by
Ilya V. Baimler
,
Alexey S. Baryshev
,
Anastasiya O. Dikovskaya
,
Viktor K. Chevokin
,
Oleg V. Uvarov
,
Maxim E. Astashev
,
Sergey V. Gudkov
* and
Aleksander V. Simakin
Prokhorov General Physics Institute of the Russian Academy of Sciences, 38 Vavilova Street, 119991 Moscow, Russia
*
Author to whom correspondence should be addressed.
Physics 2024, 6(2), 529-543; https://doi.org/10.3390/physics6020035
Submission received: 26 December 2023 / Revised: 2 February 2024 / Accepted: 5 February 2024 / Published: 9 April 2024
(This article belongs to the Section Applied Physics)

Abstract

:
This paper studies the dynamics of the development of laser breakdown plasma in aqueous colloids of dysprosium nanoparticles by analyzing the time patterns of plasma images obtained using a high-speed streak camera. In addition, the distribution of plasma flashes in space and their luminosity were studied, and the amplitude of acoustic signals and the rate of generation of new chemical products were studied depending on the concentration of dysprosium nanoparticles in the colloid. Laser breakdown was initiated by pulsed radiation from a nanosecond Nd:YAG laser. It is shown that the size of the plasma flash, the speed of motion of the plasma–liquid interface, and the lifetime of the plasma flash decrease with an increasing concentration of nanoparticles in the colloid. In this case, the time delay between the beginning of the laser pulse and the moment the plasma flash reaches its maximum intensity increases with increasing concentrations of nanoparticles. Varying the laser fluence in the range from 67 J/cm2 to 134 J/cm2 does not lead to noticeable changes in these parameters, due to the transition of the breakdown plasma to the critical regime. For dysprosium nanoparticles during laser breakdown of colloids, a decrease in the yield of hydrogen peroxide and an increase in the rate of formation of hydroxyl radicals per water molecule, characteristic of nanoparticles of rare earth metals, are observed, which may be due to the participation of nanoparticles and hydrogen peroxide in reactions similar to the Fenton and Haber–Weiss reactions.

1. Introduction

Laser-induced breakdown of colloidal solutions of nanoparticles underlies the currently widespread methods of the synthesis and modification of nanoparticles using laser radiation, namely, methods of laser ablation and laser fragmentation in liquids [1,2,3,4,5]. These techniques are based on the physical and chemical processes observed during the optical breakdown of aqueous media, mainly the processes of the formation of plasma in a liquid [6,7] and its interaction with the liquid [8,9]. The propagation of shock waves in the solution [10,11] and the formation of cavitation bubbles [12,13,14] are also noted. Chemical processes include the dissociation of liquid molecules and the formation of new chemical products in a solution [15,16]. All of these processes, one way or another, can influence the final result of the application of laser ablation techniques and the laser fragmentation of colloidal solutions of nanoparticles, changing the parameters of nanoparticles in the colloid due to laser-induced breakdown.
To date, the influence of various physical factors has been well studied both on the processes characterizing the laser breakdown of solutions itself, and on the final characteristics of nanoparticles formed, for example, when using the laser ablation technique in a liquid [17,18]. The main parameters usually include the parameters of laser radiation (fluence, pulse duration, repetition rate, radiation wavelength [19]) and the type of solvent in the colloid [20].
Relatively recently, it was shown that the concentration of nanoparticles in solutions also has a significant effect on the physical and chemical processes during optical breakdown of nanoparticle colloids during the repeated interaction of laser radiation with a nanoparticle colloid [21]. However, it is worth noting that the processes of plasma formation in pure solutions not containing nanoparticles within a few tens of nanoseconds for an individual breakdown have been well studied, for example, using shadow photography techniques [22]. At the same time, the influence of the concentration of nanoparticles in the irradiated solution on the properties of a single breakdown and on the dynamics of plasma formation remains not fully understood.
Thus, the purpose of this investigation is to study the high-speed processes of breakdown plasma formation during the irradiation of colloids of dysprosium nanoparticles and to study the influence of the concentration of nanoparticles and the energy density of laser radiation (fluence) on these processes.
The choice of rare earth dysprosium nanoparticles is due to the feature that the irradiation and breakdown of colloids of rare earth metal nanoparticles demonstrate the highest rates of generation of chemical products [23], which indicates that, in general, the physical and chemical processes observed during optical breakdown occur with greater intensity [24]. This may be due to specific physical parameters characterizing dysprosium, such as the ionization potential, which for dysprosium is approximately 5.8 eV [25] (for comparison, the ionization potential of gold is approximately 9 eV [26]).

2. Setup, Data and Methods

2.1. Synthesis of Dysprosium Nanoparticles

Dysprosium (Dy) nanoparticles were obtained through laser ablation in a liquid. A polished solid target (Dy 99.99%) was placed at the bottom of a glass cell under a thin layer of working liquid 2–3 mm thick and irradiated with laser radiation (140 J/cm2 at a wavelength of 1.064 μm, pulse duration of 100 ns, frequency of 10 kHz, focusing area diameter of 30 µm) for 15 min. Deionized water with a resistivity of 10 MΩ/cm was used as the working fluid.
The morphology of the resulting particles was studied using a Libra 200 field emission high resolution transmission electron microscope (Carl Zeiss, Jena, Germany). Nanoparticle size was determined using a DC24000 analytical disc centrifuge (CPS Instruments, Prairieville, LA, USA) and a Zetasizer Ultra Red Label portable particle analyzer (Malvern, Worcestershire, UK).
A glass cuvette was filled with a colloidal solution of dysprosium nanoparticles in an amount of 10 mL in a previously known concentration, measured using a disc centrifuge. The concentration of dysprosium nanoparticles in the cuvette changed when different volumes of a colloidal solution of nanoparticles obtained during laser ablation were added to a known volume of water. The concentration of particles in the initial colloid was determined as follows: Since the distribution of Dy nanoparticles in the colloid is unimodal, it can be argued that most particles have a certain size, and the total number of particles in the colloid is determined quite accurately using a disk centrifuge. Therefore, with a known volume of liquid, the concentration of nanoparticles will be equal to the ratio of the number of particles to the volume of liquid used.

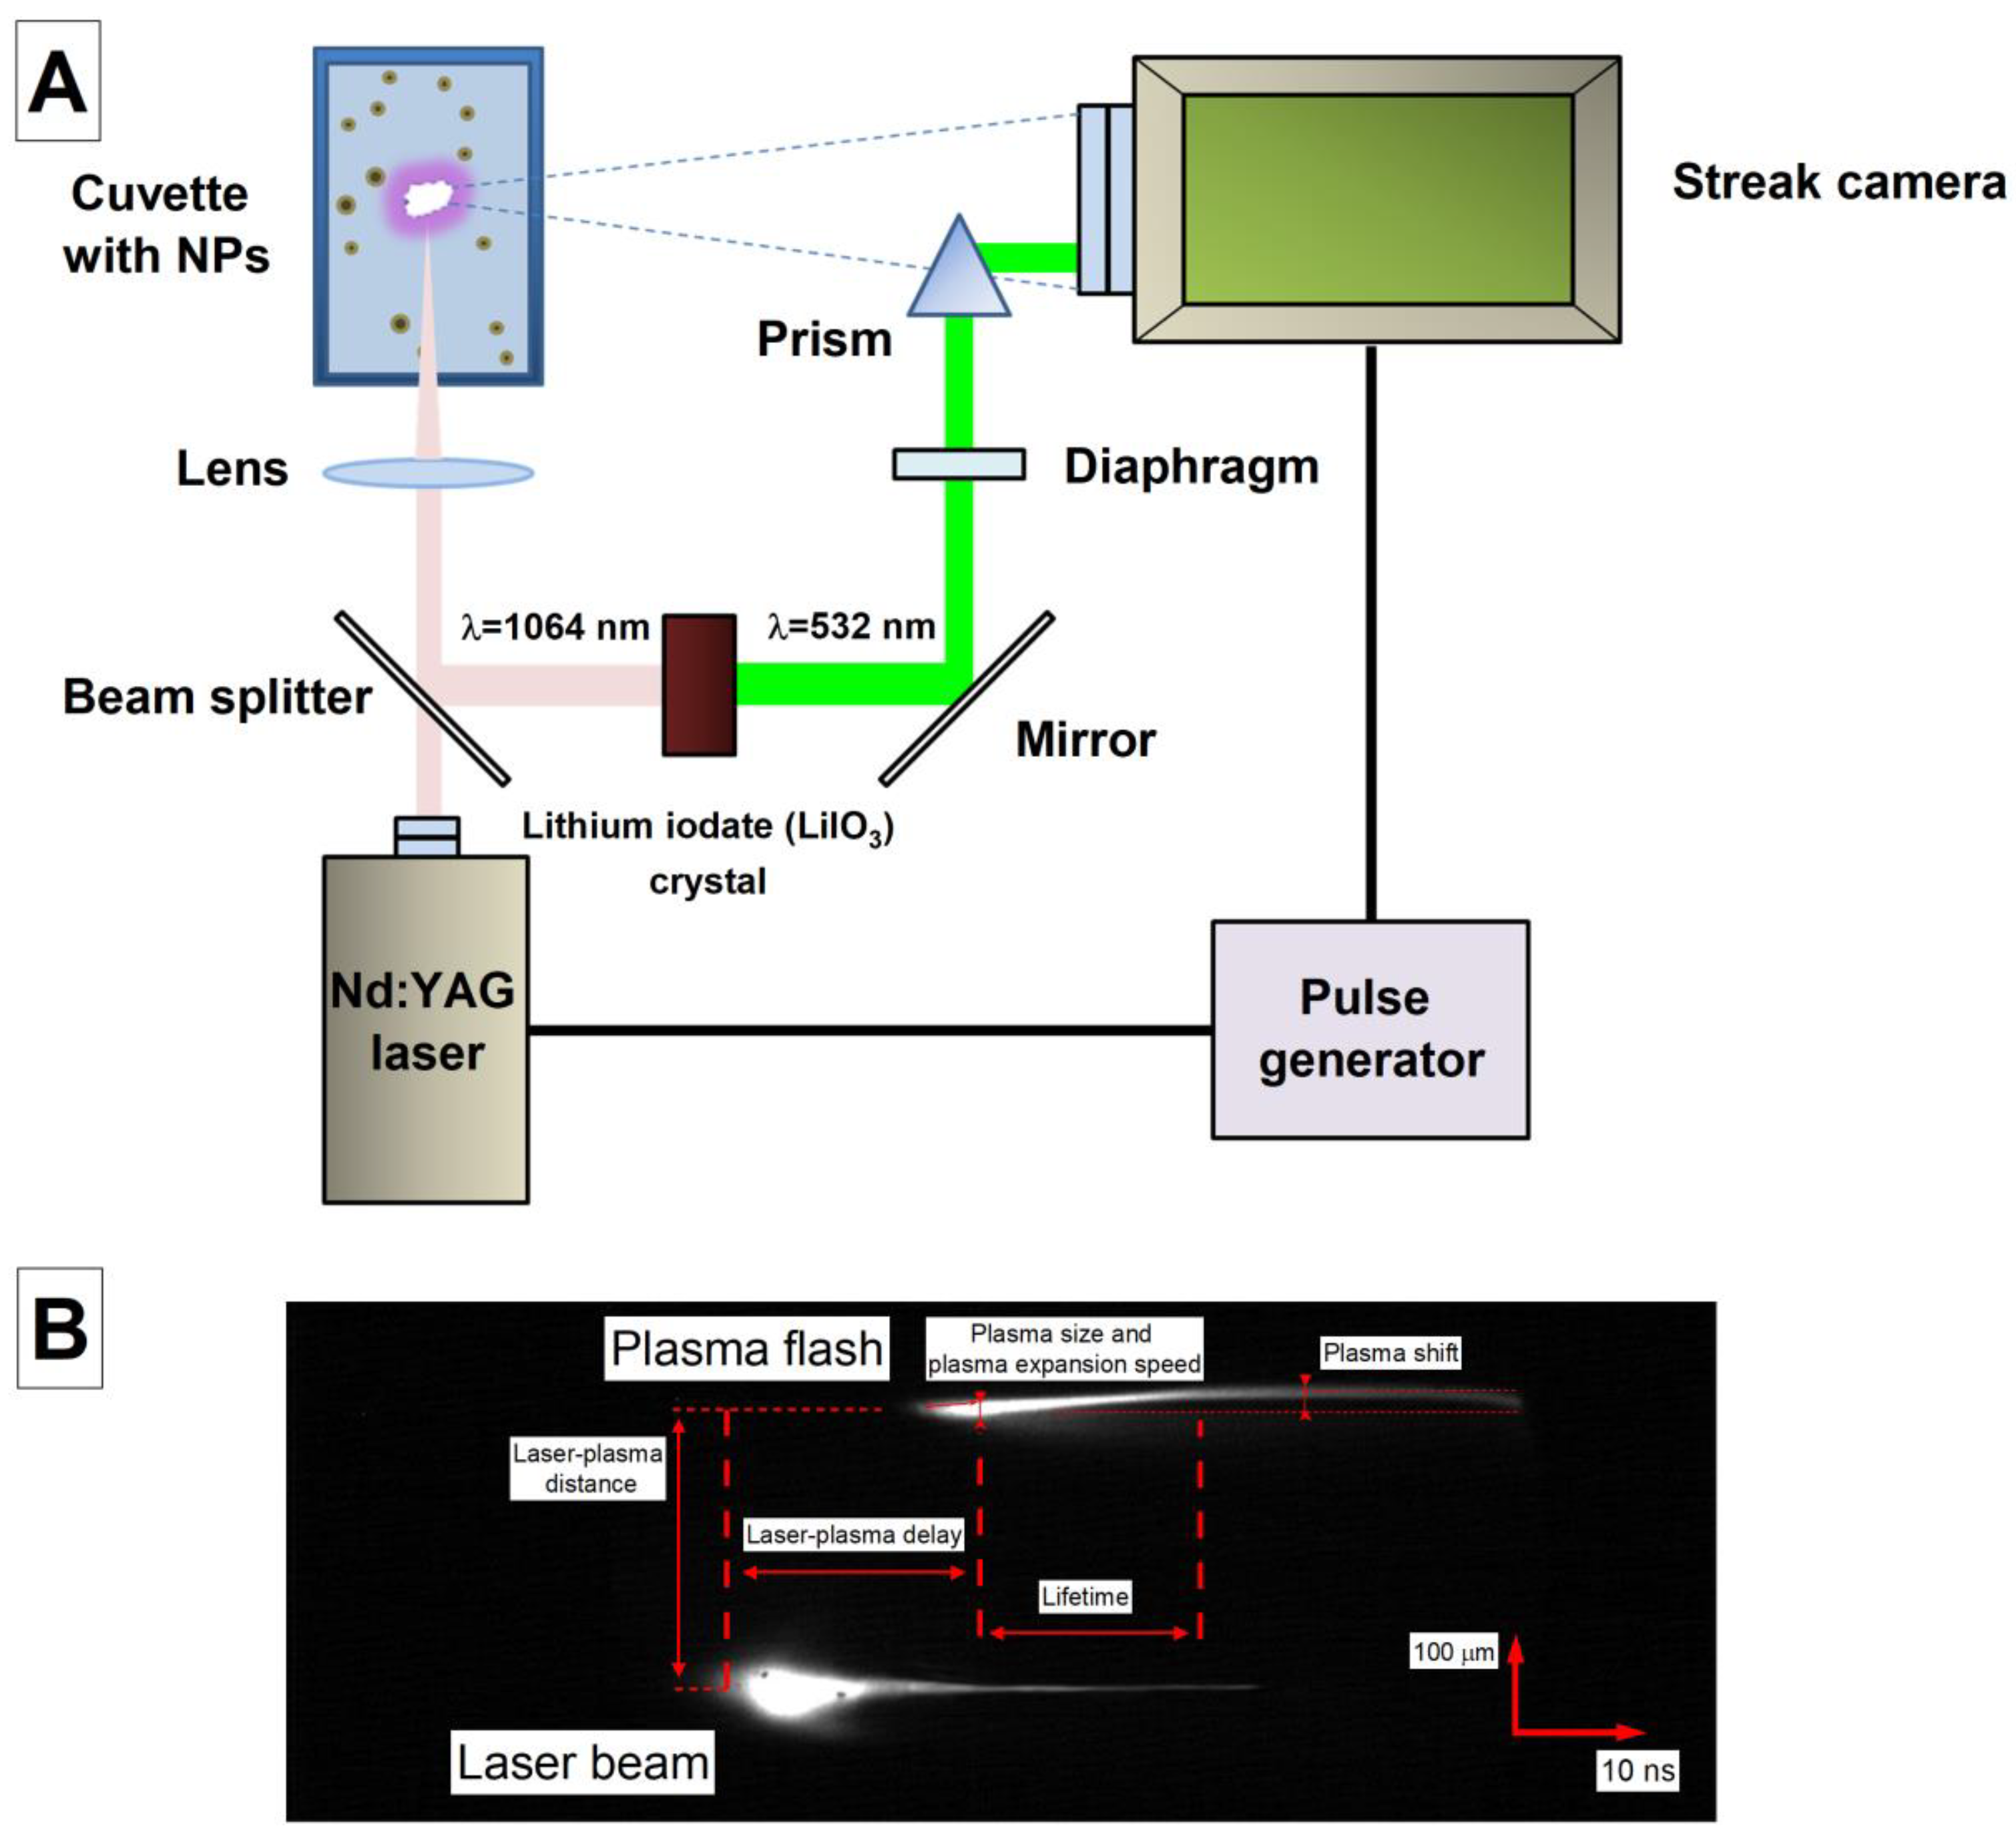
2.2. Obtaining Time-Resolved Images of the Breakdown Plasma

A schematic representation of the experimental setup used is shown in Figure 1A. Time-resolved images of optical breakdown plasma images during the irradiation of colloidal solutions of nanoparticles were obtained using a VICA-75F (GPI RAS, Moscow, Russia) high-speed streak camera (Moscow, Russia). Optical breakdown was initiated through laser radiation from a Nd:YAG laser (wavelength λ = 1064 nm, pulse duration τ = 10 ns, frequency ν = 10 Hz, pulse energy ε = 650 mJ, focusing area diameter of 500 μm). The laser and streak camera were launched using a pulse generator.
Both the plasma flashes and the laser pulse were recorded in time-based images. To carry out this, part of the radiation, using a divider, hit a nonlinear crystal (LiIO3), which was used to generate the second harmonic. Then, the radiation hit the diaphragm, which was used to regulate the intensity. Next, the radiation was directed into the streak camera lens using an optical prism. Using a lens, laser radiation was focused in the center of a cuvette filled with a colloidal solution of dysprosium nanoparticles in an amount of 20 mL, and then plasma flashes were recorded for several minutes during irradiation. In the resulting series of images, there were a total of about 100 images of time sweeps of the breakdown plasma. The resulting images were then analyzed using the ImageJ program [21]. The resolution calibration of time-scan plasma images was performed using a light source and an adjustable optical slit.
Figure 1B shows a characteristic image of the time sweep of the breakdown plasma, together with the laser pulse. The figure shows the parameters measured during the image analysis. When analyzing time sweeps, the time between the beginning of the laser pulse and the moment the plasma flash reached its maximum size was studied, which was designated as the delay time. We studied the time between the moment the plasma reached 50% of the maximum intensity and the next moment after reaching the maximum intensity, the moment it reached 70% of the intensity, which was designated as the plasma lifetime. The maximum size of the plasma was measured, the rate of expansion of the plasma–liquid interface was studied, the distance between the pulse and the plasma was measured in photographs, and the maximum displacement of the plasma flash in space relative to its initial position was recorded.

2.3. Measuring the Intensity of Chemical Processes

Molecular hydrogen and molecular oxygen formed during laser-induced breakdown were registered using portable hydrogen and oxygen analyzers AVP-02 and AKPM-1-02 (Alfa Bassens, Moscow, Russia) [27]. Concentrations of hydroxyl radicals were measured via fluorescence of 7-hydroxycoumarin-3-carboxylic acid (7-OH-CCA) [28]. Hydrogen peroxide measurements were carried out using a Biotox-7 chemiluminometer. The method for measuring hydrogen peroxide is described in detail in Ref. [29].

3. Results

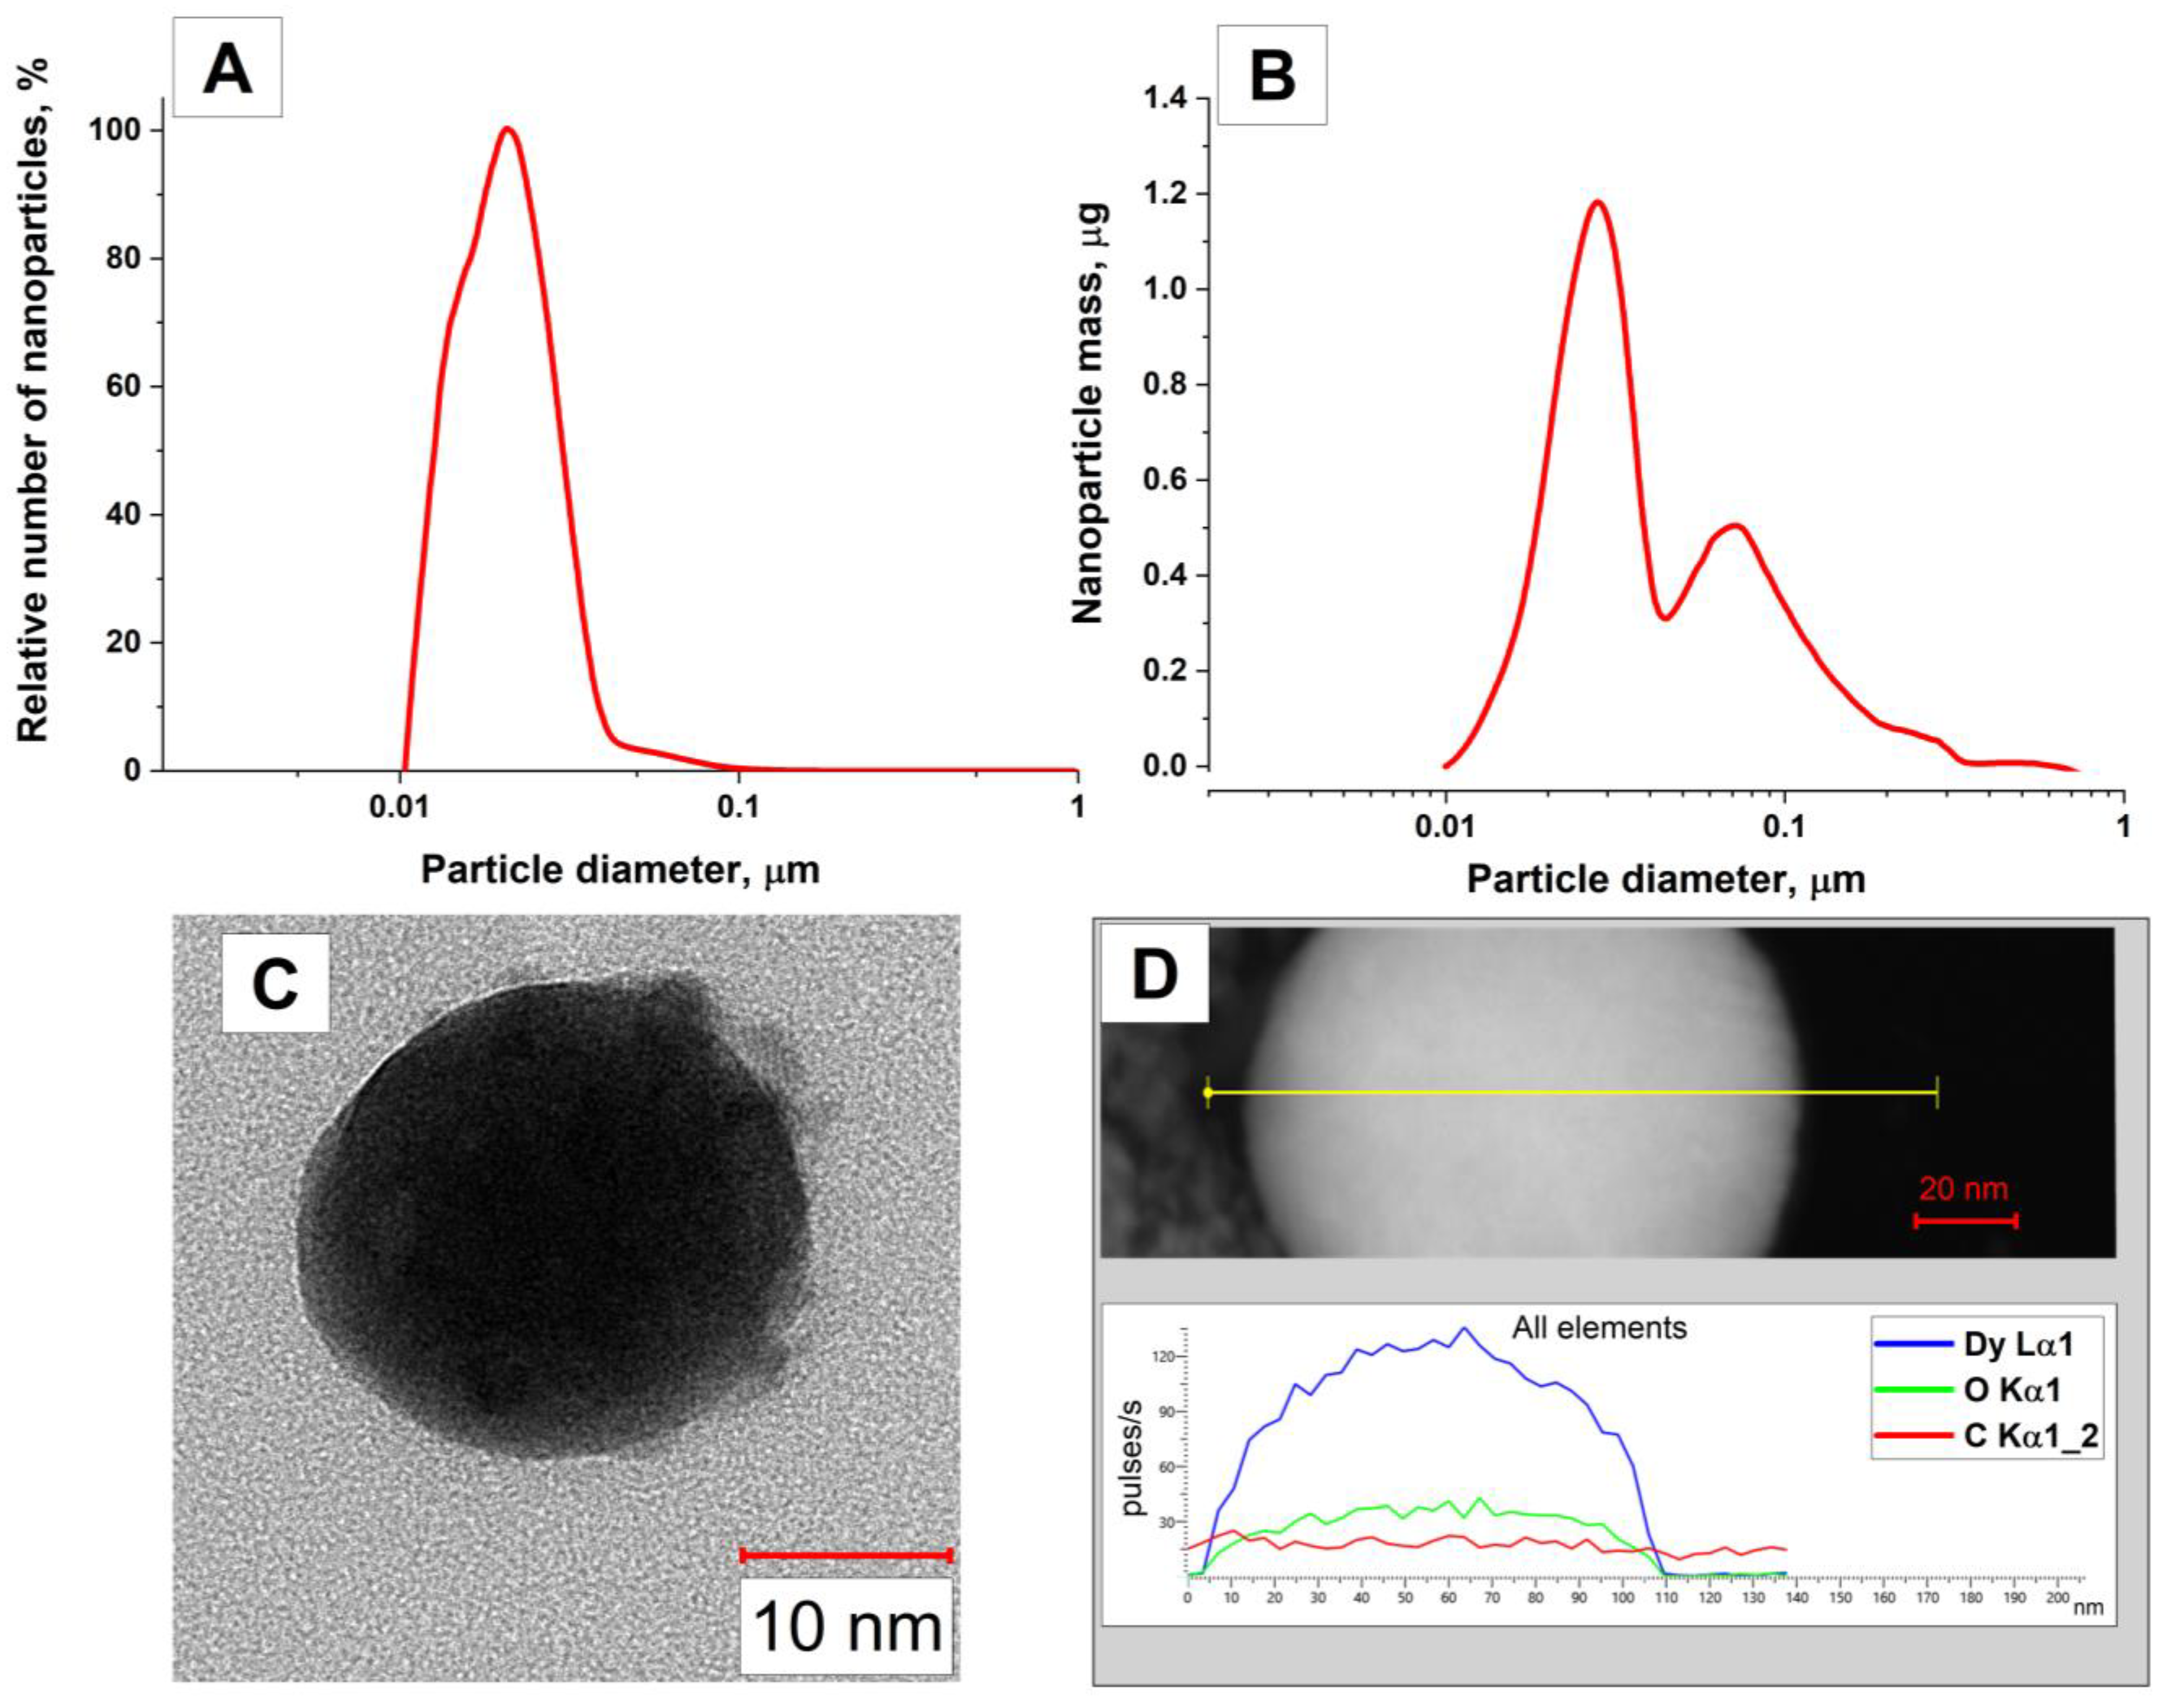
3.1. Morphology of Dysprosium Nanoparticles

Figure 2 shows the size and mass distributions of Dy nanoparticles, as well as a transmission electron microscopy (TEM) image of an individual dysprosium nanoparticle and the results of energy-dispersive X-ray spectroscopy (EDX) of nanoparticles. The distribution of the number of nanoparticles depending on the size obtained using a disk centrifuge is unimodal, and the maximum of the particle size distribution in the colloid is approximately 20–23 nm (Figure 2A). The half-width of the distribution peak falls on sizes from 12 to 30 nm. When studying the distribution of Dy nanoparticles by weight, the presence of particles with sizes greater than 30 nm in the colloid was shown (Figure 2B). It is established that the particle size distribution has a bimodal form. The distribution peaks occur at nanoparticle sizes of 28 nm and 70 nm for the first and second peaks, respectively. However, the number of particles with sizes of about a hundred nanometers is less than 1% of the total number of particles, as follows from the distribution of the number of particles by size.
Figure 2C,D show TEM images of the studied particles. As can be seen from the figures, the synthesized dysprosium nanoparticles have a spherical shape (Figure 2C). The results of the EDX analysis of dysprosium nanoparticles indicate the presence of oxygen in the particle composition in addition to dysprosium. This finding can be explained by the presence of an oxide layer around the particles, which is typical for metal particles obtained by applying the laser ablation technique in water.
Figure 3 shows the transmission spectrum of the obtained colloids of dysprosium nanoparticles with various nanoparticle concentrations of 108 NPs/mL and 1010 NPs/mL in the near-IR region. It can be seen from the figure that an increase in the concentration of dysprosium nanoparticles in the colloid from 108 Np/mL to 1010 Np/mL leads to a decrease in transmission at the wavelength of laser radiation (1064 nm) by approximately 10% due to the growing role of scattering processes and absorption of radiation by nanoparticles.

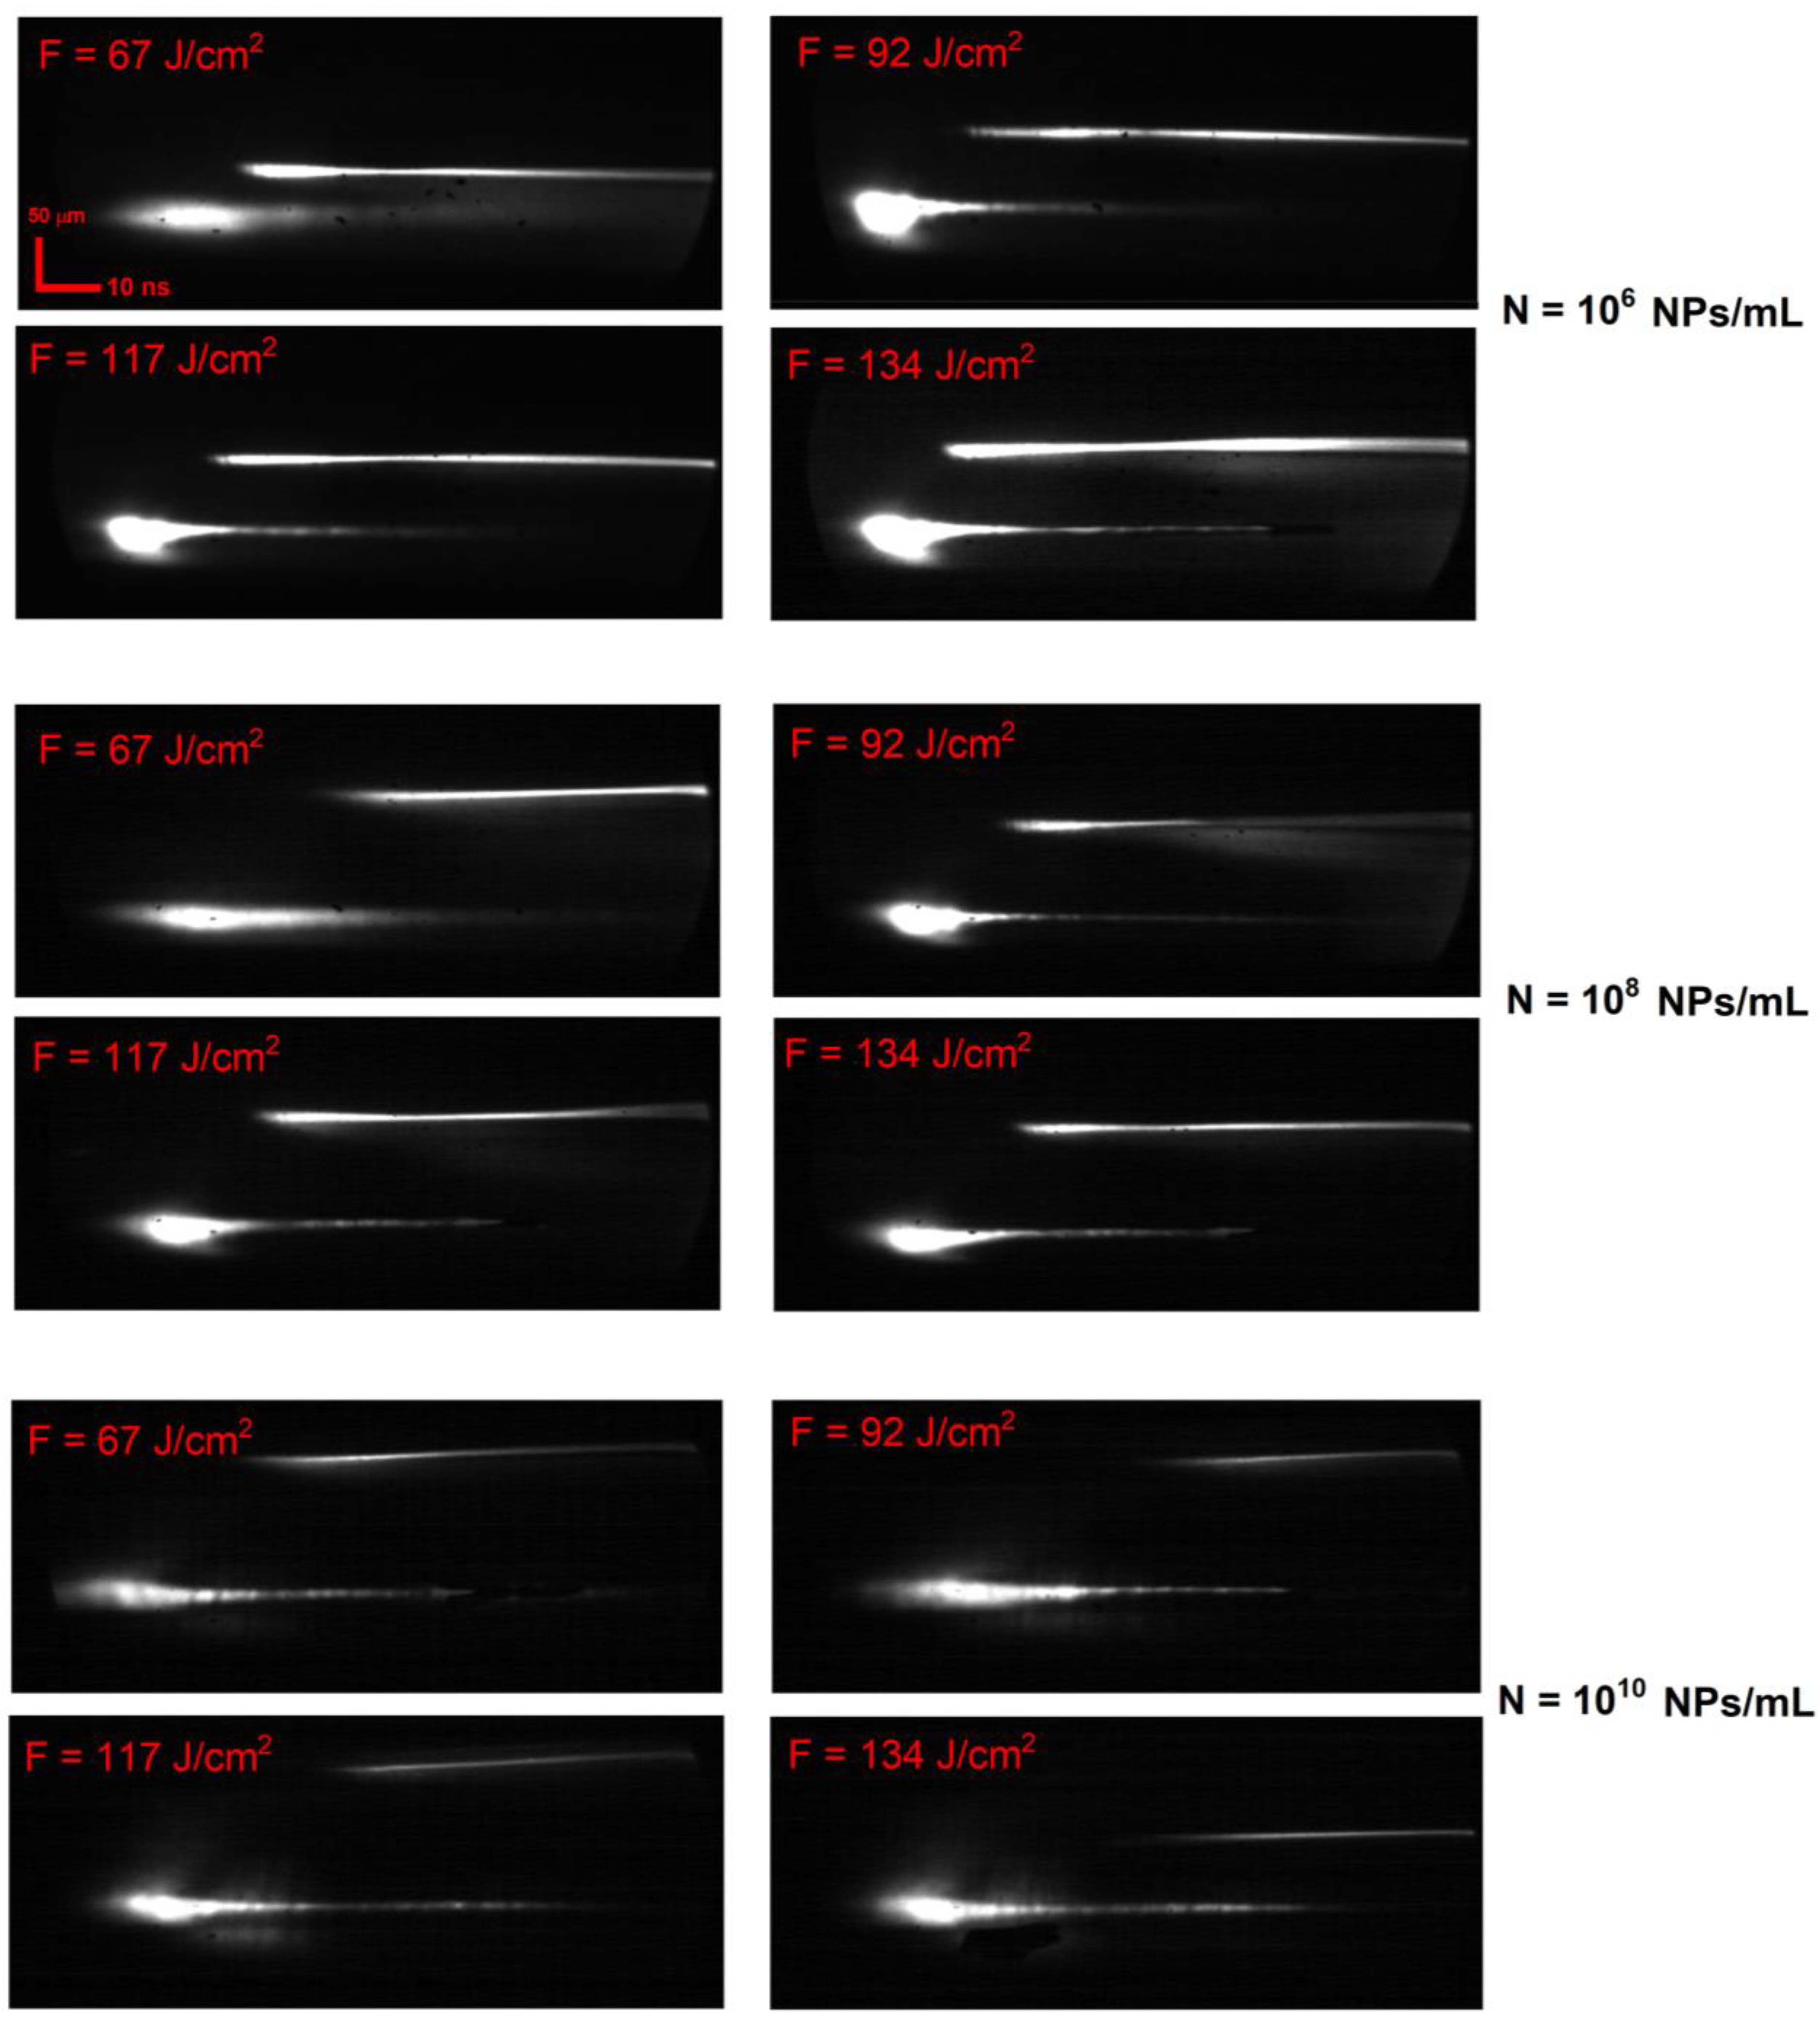
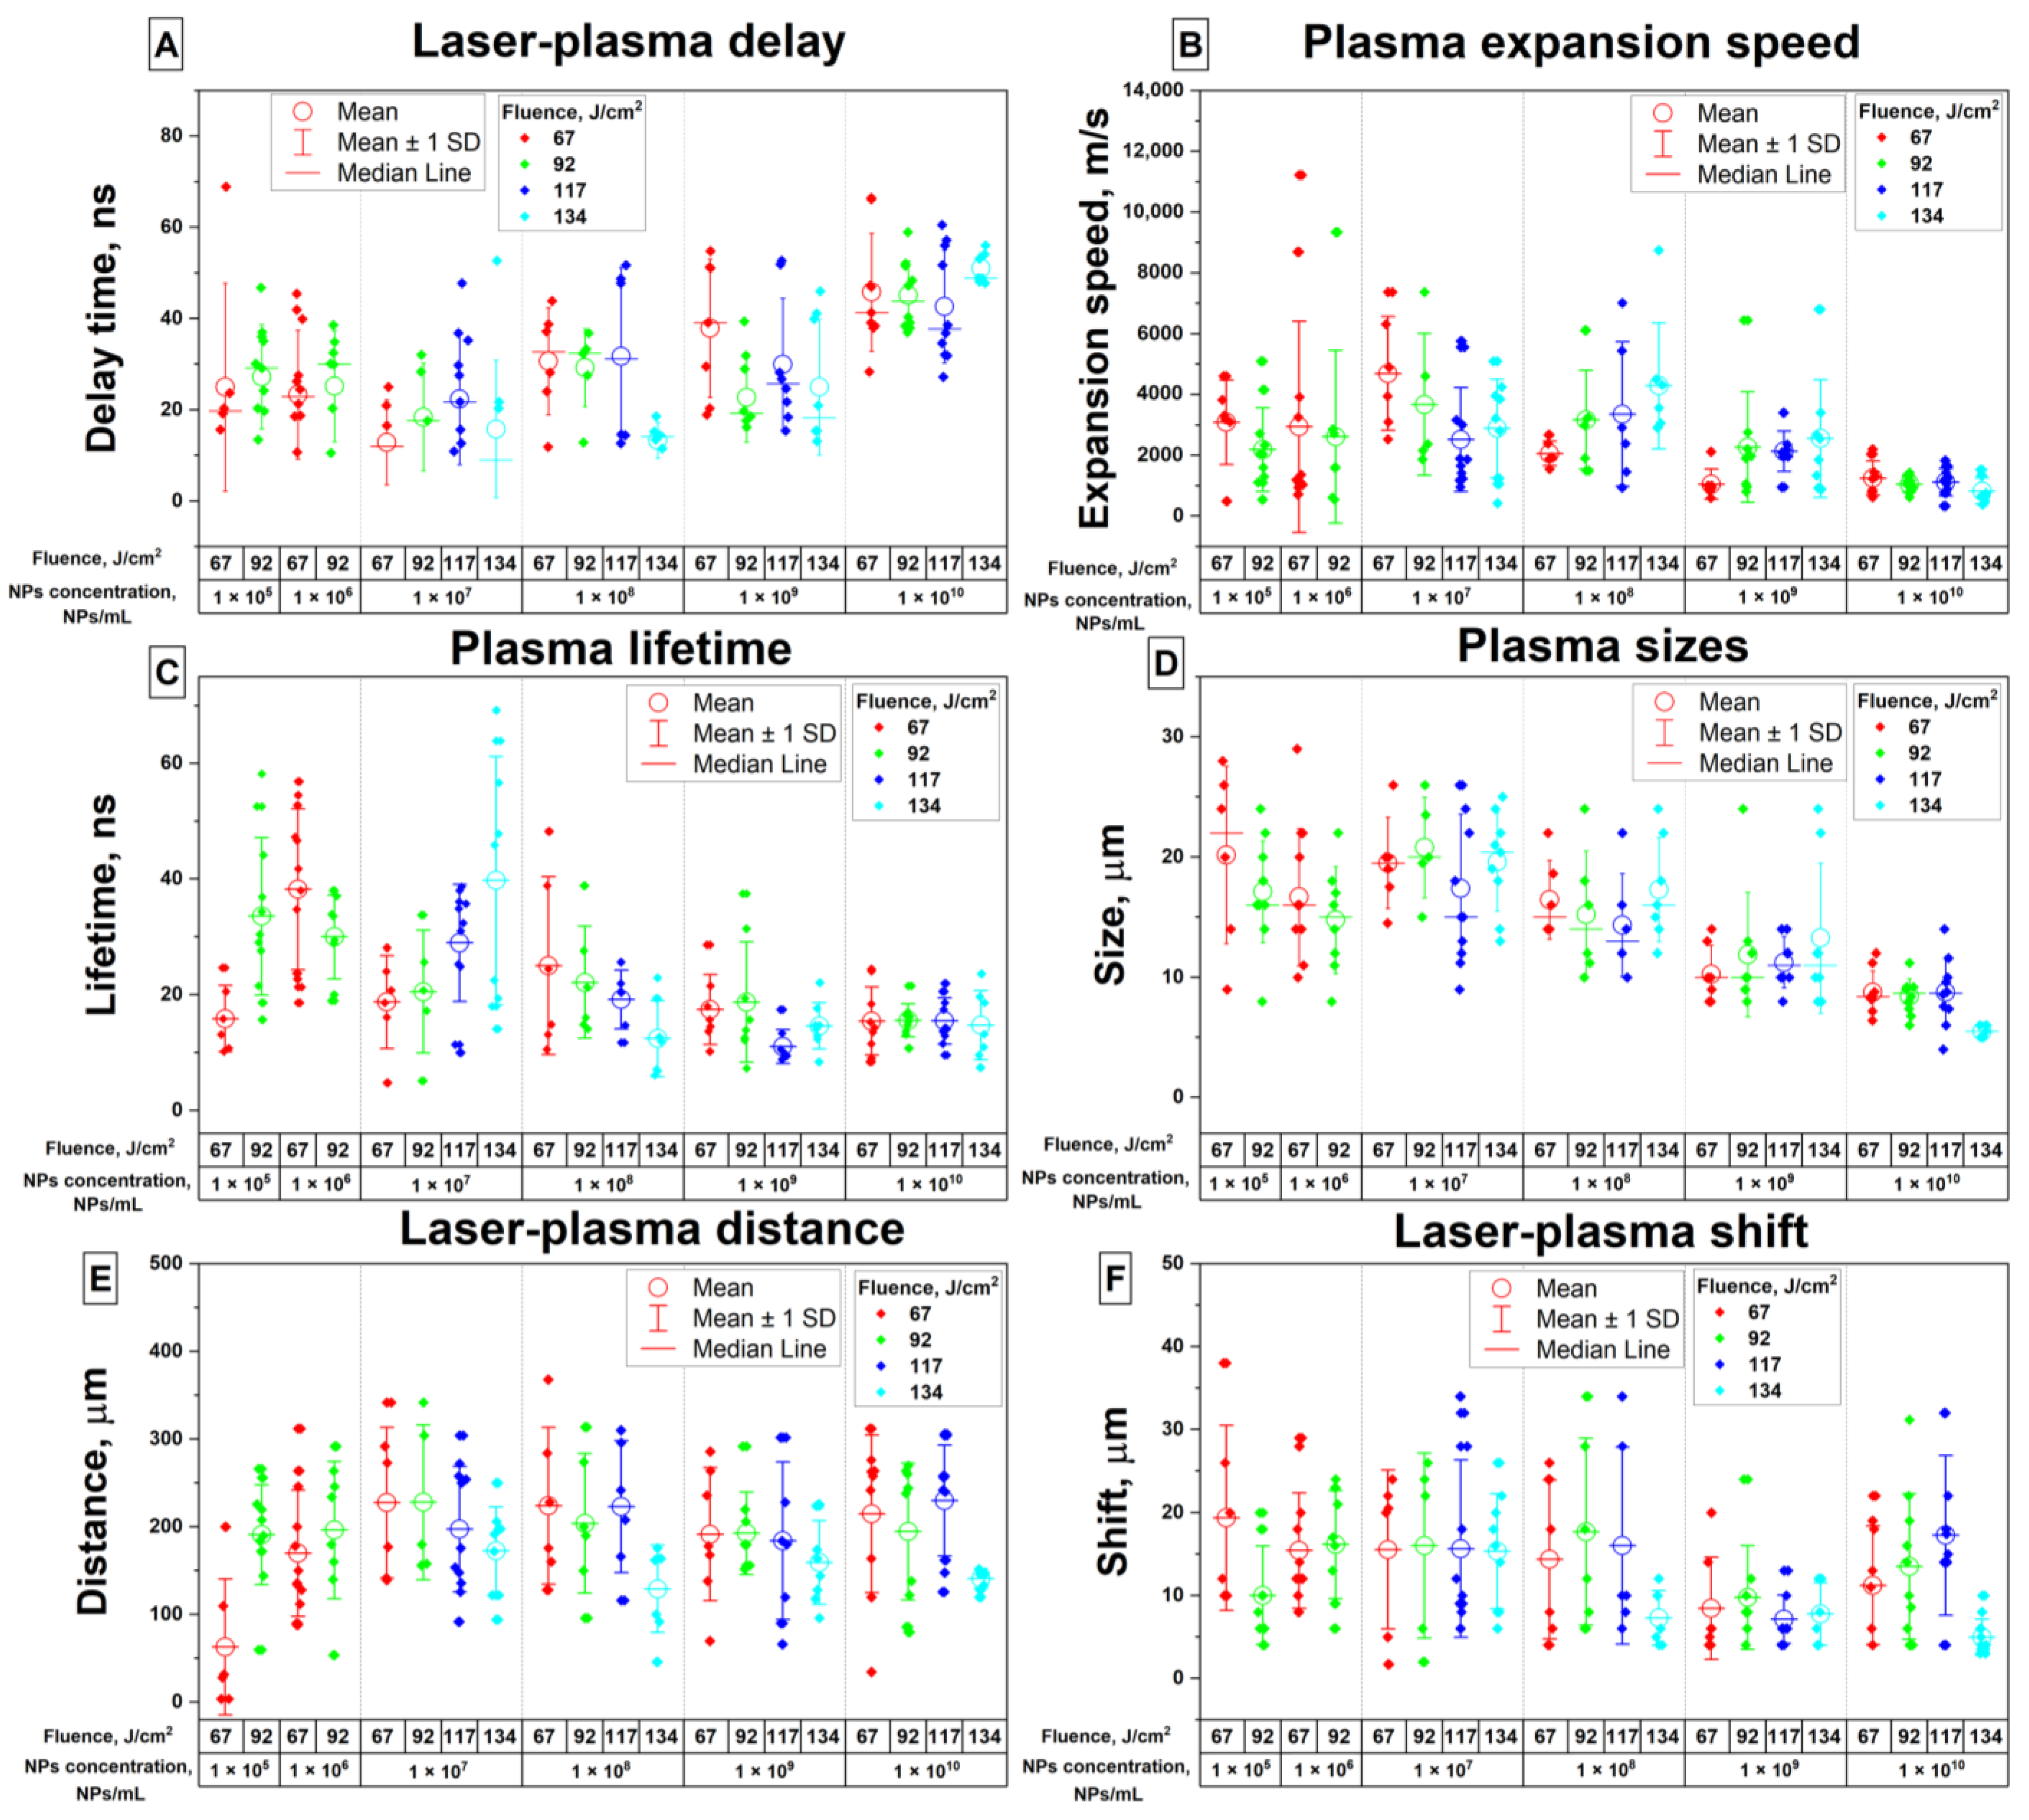
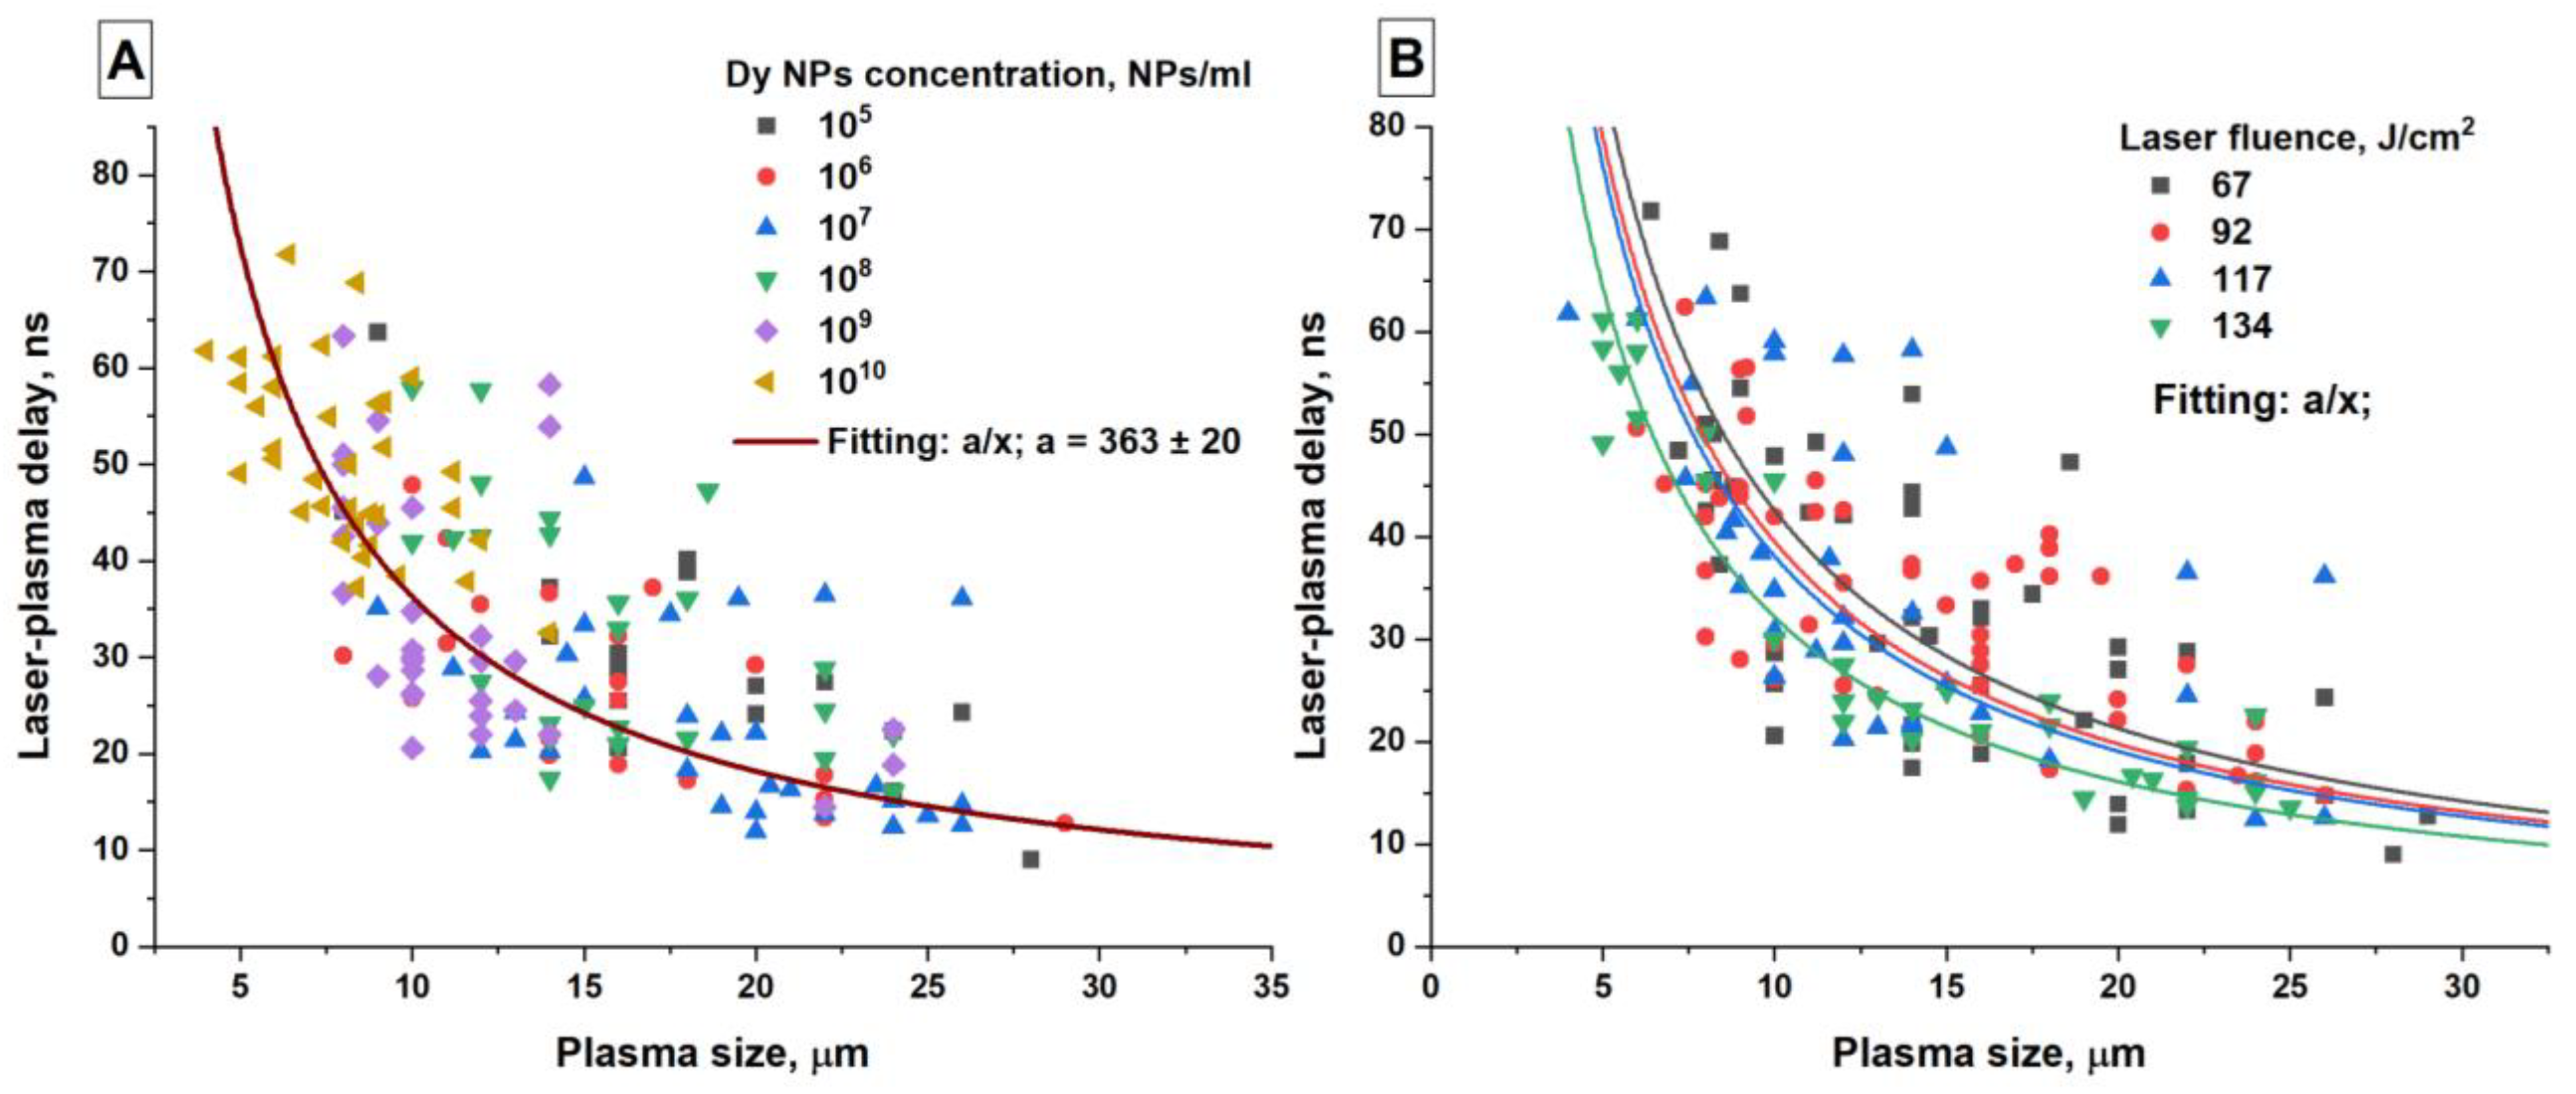
3.2. Analysis of the Time-Resolved Images of Breakdown Plasma

Figure 4 shows characteristic time-resolved images of laser breakdown plasma flashes and laser pulses upon the irradiation of colloids of dysprosium nanoparticles for different concentrations of nanoparticles and laser radiation energy densities. It is shown that with an increase in the concentration of nanoparticles, changes are observed in plasma time-resolved images, namely, the intensity of flashes of the breakdown plasma in the images decreases. At the same time, a displacement of the flashes relative to the laser pulse along the time axis is observed. The size of the flashes also decreases. Varying the energy density of laser radiation, as follows from the images shown, does not significantly change the overall dynamics of plasma development during breakdown.
Figure 5 shows the results of the analysis of plasma images obtained using a streak camera. When analyzing the flashes, as previously shown in Figure 1B, the following parameters were taken into account: The delay time between the start of the laser pulse and the time the plasma flash reached maximum intensity was measured (Figure 5A). It is established that an increase in the concentration of dysprosium nanoparticles in the colloid leads to an increase in the delay time between the laser pulse and the plasma. The average delay time for nanoparticle concentrations in the range from 105 NPs/mL to 107 NPs/mL is about 40 ns, and for nanoparticle concentrations 1010 NPs/mL, the average delay time is already about 50 ns.
It is shown that a change in the concentration of nanoparticles in the irradiated colloidal solution leads to a change in the speed of movement of the plasma–liquid interface (Figure 5B). For the concentration range from 105 to 108 NPs/mL, the characteristic plasma expansion velocity falls in the range from approximately 2000 m/s to 4000 m/s and decreases with increasing nanoparticle concentration. At a nanoparticle concentration of 1010 NPs/mL, the speed of the boundary movement is on average about 1000 m/s.
It is shown that with an increase in the concentration of nanoparticles in the irradiated colloid, a decrease in the lifetime of the plasma flash is observed (Figure 5C). At various laser radiation energy densities, the lifetime of the plasma flash is approximately 25–30 ns at concentrations of dysprosium nanoparticles from 105 to 106 NPs/mL. With a further increase in the concentration of nanoparticles in the solution, the plasma lifetime decreases and reaches about 15 ns at a nanoparticle concentration of 1010 NPs/mL.
The size of the plasma flash at the moment of reaching maximum intensity was analyzed depending on the concentration and fluence (Figure 5D). It is shown that with an increase in the concentration of nanoparticles in the colloid, a decrease in the size of the flash occurs. Thus, at concentrations from 105 to 107 NPs/mL, the flash sizes are in the range from 15 to 20 μm at maximum plasma intensity. Then, with an increase in the concentration of nanoparticles to 1010 NPs/mL, the flash sizes decrease to values of the order of 8 μm.
When measuring the dependence of the distance between the plasma flash and the laser pulse on time-based images, it was found that varying the concentration of nanoparticles does not have a significant effect on this parameter (Figure 5E); the average distance between the plasma flash and the laser pulse is approximately 200 ± 100 μm.
The maximum displacement of plasma flashes relative to the laser pulse during breakdown was studied (Figure 5F). It is shown that, at nanoparticle concentrations in the range from 105 to 108 NPs/mL, the average displacement of plasma flashes in space is about 15 μm. With a further increase in the concentration of nanoparticles to 109 NPs/mL, the displacement of the flashes reaches a minimum and is about 7 μm. With a further increase in the concentration of nanoparticles to 1010 NPs/mL, the shift of plasma flashes in space is about 13 μm.

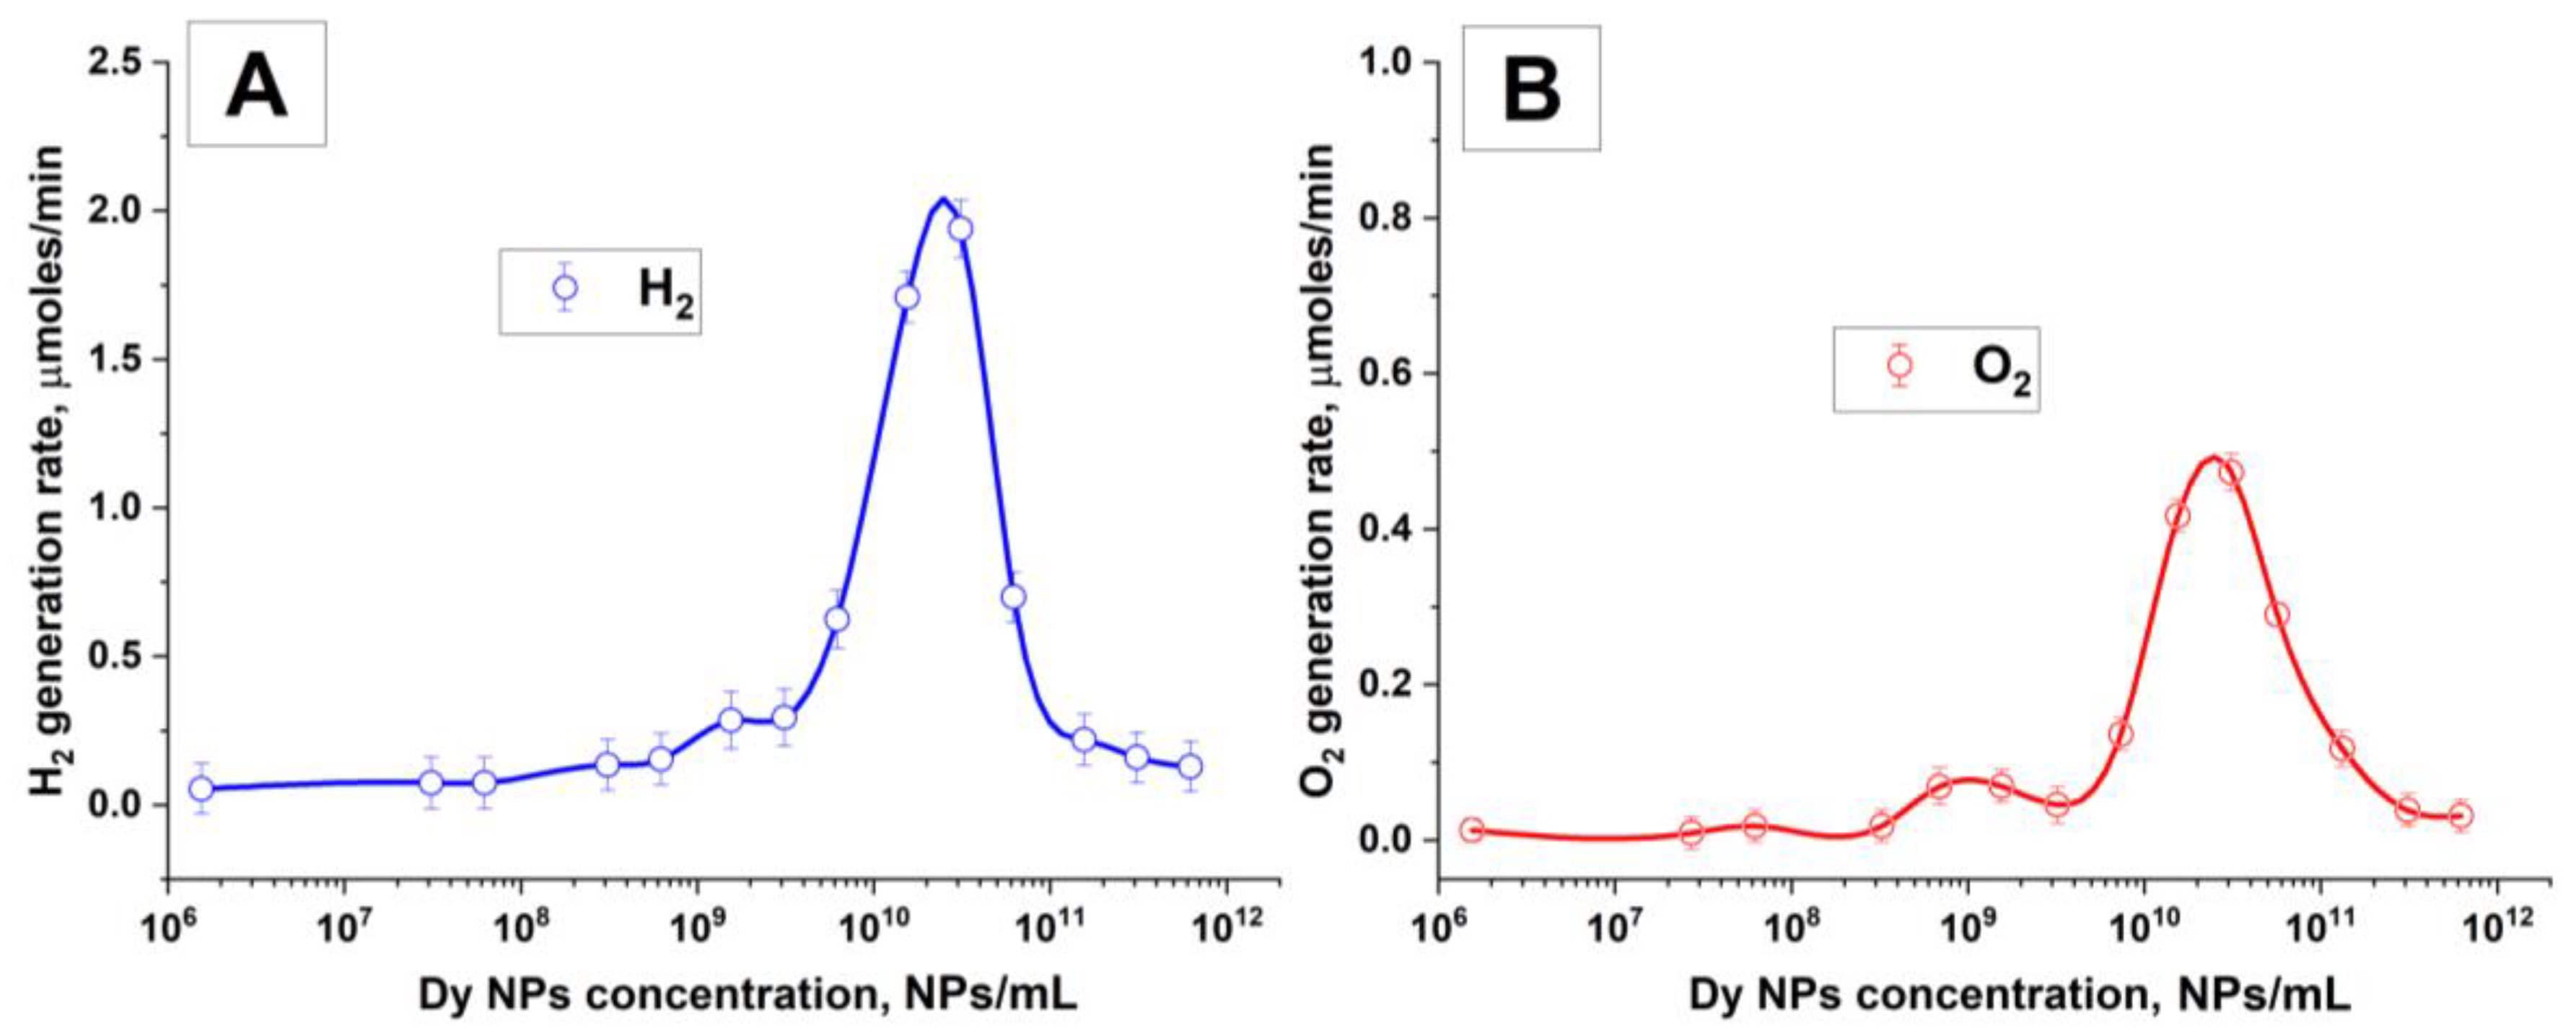
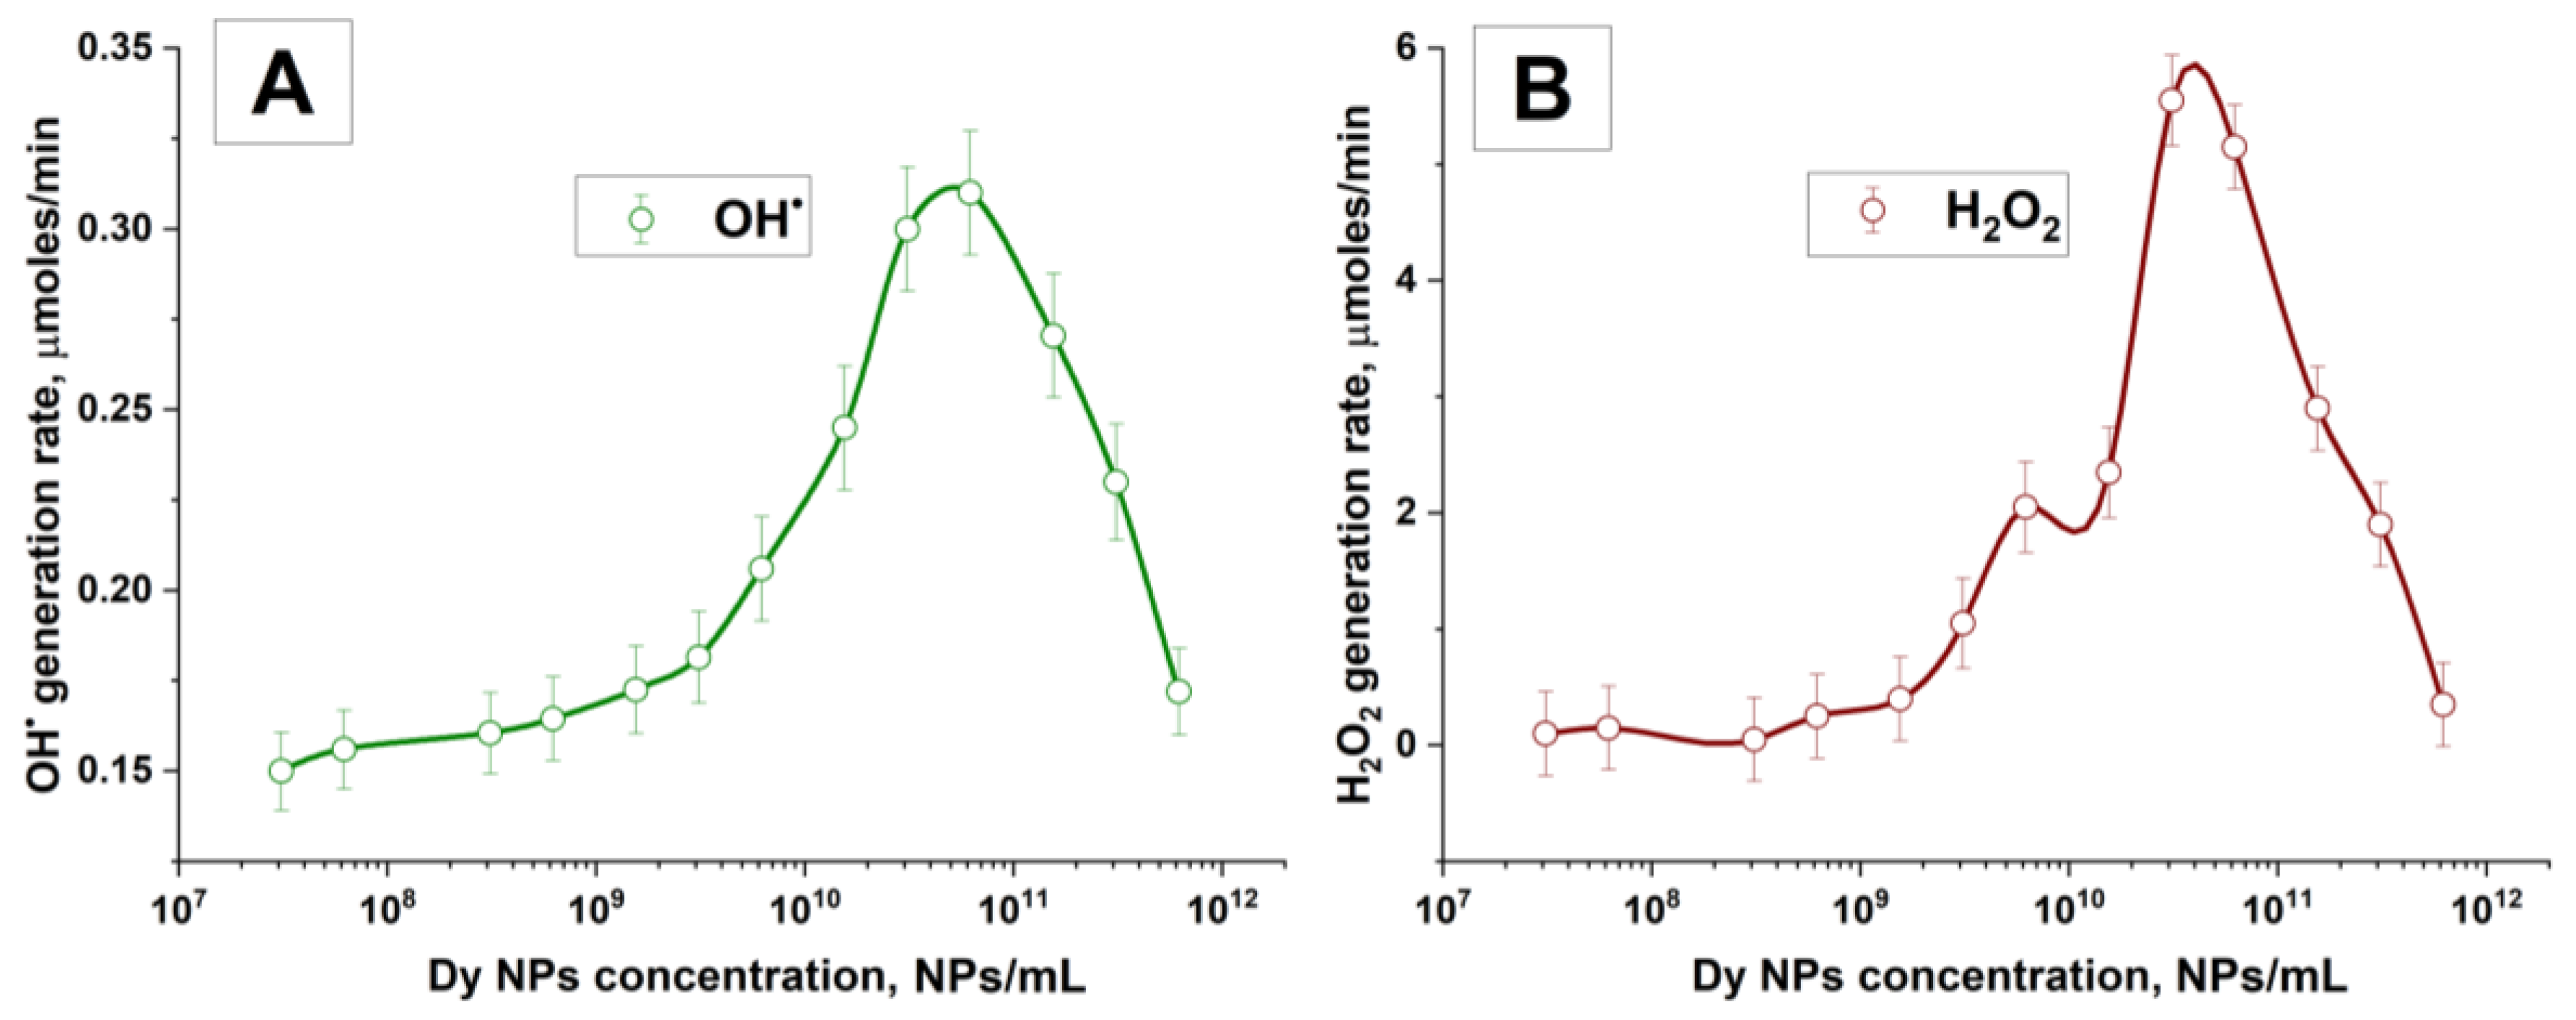
3.3. Chemical Processes during Optical Breakdown of Colloids of Dy Nanoparticles

The dynamics of the formation of molecular hydrogen and oxygen under the influence of optical breakdown induced through laser radiation depending on the concentration of dysprosium nanoparticles are shown in Figure 6. It is shown that the maximum rate of formation of hydrogen and oxygen is observed at nanoparticle concentrations approximately equal to 2 × 10¹⁰ NPs/mL (Figure 6A,B).
The effect of the concentration of dysprosium nanoparticles on the rate of formation of hydroxyl radicals and hydrogen peroxide and hydroxyl radicals is demonstrated in Figure 7A,B.
It has been shown here that the maximum rate of formation of hydrogen peroxide and hydroxyl radicals is observed at a concentration of 3–5 × 10¹⁰ NPs/mL. The maximum rate of formation of hydroxyl radicals is observed at concentrations of 5 × 10¹⁰ NPs/mL and is 0.32 μmol/min. The highest generation rate for hydrogen peroxide is observed at a concentration of 3 × 10¹⁰ NPs/mL and is 5.6 μmol/min. A further increase in concentration leads to a rapid decrease in the generation rate regarding both the rate of generation of hydrogen peroxide and the rate of generation of hydroxyl radicals. Significant differences in the production rates of hydroxyl radicals and hydrogen peroxide are most likely associated with the measurement technique. The probe molecules used to detect radicals can also decompose under the action of the breakdown plasma and the process of capturing radical products occurs in a localized space around the breakdown for a short period of time, and due to these factors, the measured rate of formation of hydroxyl radicals decreases.
The maximum rates of formation of chemical products for dysprosium nanoparticles per laser pulse are 11.7 nmol/pulse for H2, 2.82 nmol/pulse for O2, and 1.8 nmol/pulse and 3.3 nmol/pulse for OH and H2O2, respectively.

4. Discussion

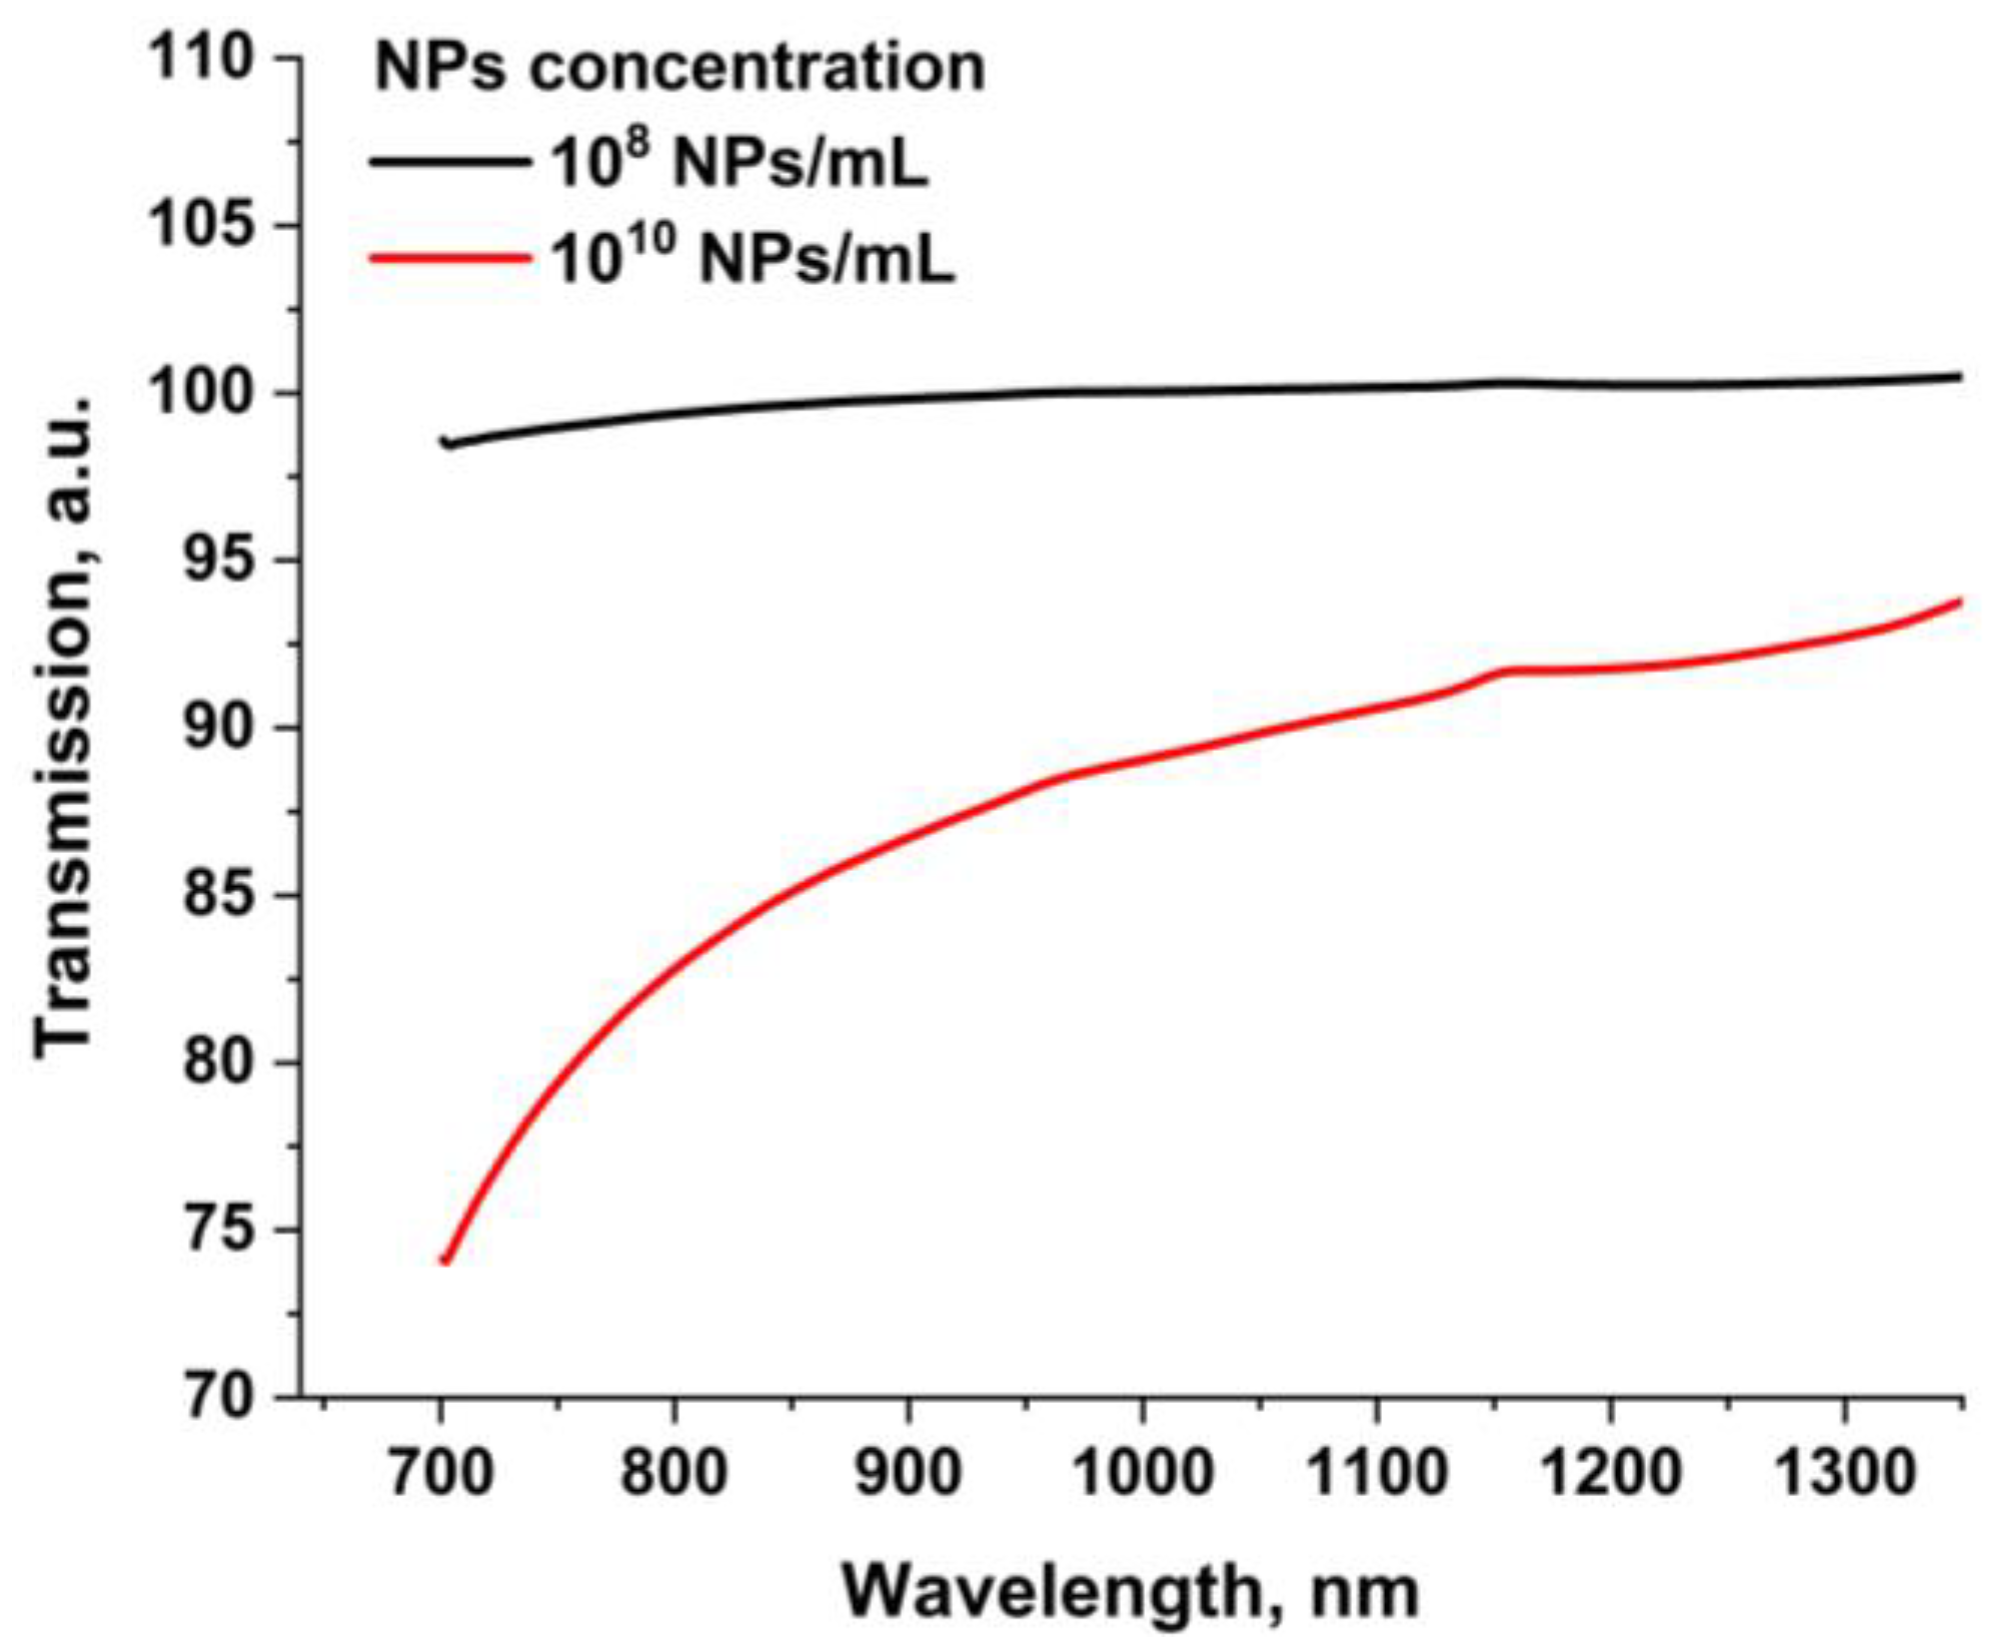
4.1. Effect of Dysprosium Nanoparticle Concentrations

Different concentrations of nanoparticles in an irradiated colloid, as previously shown, can significantly influence both the physical and chemical processes occurring during breakdown. Moreover, all these processes, one way or another, are caused by the formation of plasma and the interaction of plasma with the medium. The influence of nanoparticle concentrations was traced for the most part on processes secondary to optical breakdown (formation and propagation of shock waves, life dynamics of cavitation bubbles) or processes observed during the repeated irradiation of the medium (processes of generation of chemical products). The study of the effect of nanoparticle concentration on the breakdown plasma itself was limited to a general analysis of plasma flashes containing several breakdowns. The results of this study show that the concentration of nanoparticles in the colloid also affects the parameters characterizing an individual sample.
First of all, it is interesting to note the influence of the concentration of nanoparticles on the time interval between the beginning of the laser pulse and the moment the plasma reaches its maximum size and intensity. As was shown in Figure 5A, with an increase in the concentration of dysprosium nanoparticles, a gradual shift in the time the plasma takes to reach a maximum size and intensity along the time axis is observed. As the concentration of nanoparticles increases, both the threshold radiation intensity required to initiate breakdown decreases and scattering processes occur, which lead to a significant decrease in the effective fluence [30,31]. These processes lead to breakdown occurring on nanoparticles at low laser radiation energy densities; however, a further absorption of laser radiation by the plasma does not occur quickly enough, i.e., the plasma does not reach a critical concentration and radiation screening does not occur. It is also worth considering the possible difference in the shape of the laser pulse from the Gaussian one, which may be due to the lack of selection of longitudinal modes, due to which the temporal structure of the pulse may change and lead to stretching of the laser pulse in time, as described, for example, in Ref. [32], and is also confirmed in the obtained time-resolved photographs (Figure 4). Taking into account the above, it can be assumed that energy absorption occurs over a longer period of time than the pulse duration. The combination of the described factors can lead to the formation of insufficiently bright breakdowns at the initial moments, which do not differ in the spatio-temporal scans of the streak camera. In such cases, the plasma continues to absorb radiation energy for a long time, and the maximum intensity will be shifted relative to the beginning of the laser pulse.
This assumption is indirectly confirmed by the feature that experiments also record a decrease in the maximum plasma size with increasing concentration. This parameter characterizes the amount of laser radiation energy absorbed by the plasma. Figure 8 shows the dependence of the time delay between the beginning of the laser pulse and the time to reach the maximum plasma intensity on the size of the plasma flash.
It is shown that the time delay is inversely related to the plasma size. In this case, the largest flashes are observed with a minimum delay between laser radiation and plasma, and vice versa, the smallest flashes are recorded at large time intervals. It is worth paying attention to how the presented data are arranged depending on the particle concentration (Figure 8A). At concentrations up to 108 NPs/mL, the range of flash sizes is from 10 µm to 28 µm. However, already at nanoparticle concentrations of 109 and 1010 NPs/mL, the flash sizes are predominantly concentrated in the range of 5–12 μm. The general form of the dependence can be characterized by an equation of the form y = a/x, where a = const, as shown in Figure 8A.
On the other hand, by grouping points depending on the fluence, one can trace the influence of the laser radiation energy density on the dependence of the time delay on the plasma size (Figure 8B). It can be seen that as the laser fluence increases, the range in which the points are located decreases in proportion to the increase in the laser radiation energy density.
The dependence of other measured parameters, such as the plasma lifetime and the velocity of the plasma–liquid boundary, on concentration can be similarly explained by considering their relationship with the size of the flash, which, as shown above, is related to the amount of laser radiation energy absorbed by the plasma.
The size of the plasma can be related to the size of the nanoparticles in the irradiated colloid. It should be noted that in previous the earlier studies [33], plasma flashes with sizes ranging from 27 μm to 45 μm were recorded with a distribution maximum at 32 μm, at concentrations of 109 NPs/mL, which is approximately two times larger than the sizes of plasma flashes observed in this study. This discrepancy can be explained by the feature that the nanoparticles used in the investigations on which the breakdown occurred differed from each other in size; for dysprosium nanoparticles, the average size in the distribution is 20 nm, while in Ref. [33], iron nanoparticles with sizes of about 36 nm are used. It is known that when colloids of nanoparticles with smaller sizes are irradiated, the threshold energy required for optical breakdown will be greater in comparison with colloids of nanoparticles of larger sizes [34]. It follows that the initial conditions for the development of breakdown plasma when irradiating colloids of nanoparticles of different sizes will differ; in particular, the laser radiation energy stored in the plasma will differ depending on the size of the nanoparticles in the irradiated colloid. Indeed, if we assume that the amount of laser radiation energy absorbed by a particle is proportional to the particle absorption cross-section, i.e., Ed2, where d is the particle size, then, since E∝(λD)2, where λD is the Debye radius, then dλD, i.e., the size of the plasma flash will be directly proportional to the size of the nanoparticles in the colloidal solution.
Similarly, other studies report a correlation between particle sizes and linear dimensions of optical images of laser-induced plasma during the breakdown of aqueous colloids, for example, in Refs. [35,36]. It is noted that the accuracy of determining particle sizes will be determined by how close the laser radiation energy is to the threshold energy values required to initiate optical breakdown.

4.2. Effect of Laser Fluence

In Refs. [21,37], the influence of laser radiation energy density on the plasma flash, the magnitude of acoustic signals, and the rate of generation of chemical dissociation products were studied when using laser radiation with similar parameters, with the exception of frequency and energy per pulse. It was shown that the general form of the dependence of most processes (probability of breakdown, intensity of luminescence, total number of breakdowns in one flash, rate of generation of chemical products) on the energy density of laser radiation is sigmoidal in nature, i.e., f(x)~1/(1 + exp(−αx)), where the parameter α is proportional to the particle concentration.
It is worth noting that the glow intensity of individual breakdowns in one flash either did not change with increasing laser radiation energy density or decreased slightly with increasing laser fluence. It follows from this that the energy transferred through laser radiation to the plasma is consumed mainly in the initial stages of breakdown and, in general, affects the probability and number of breakdowns in the waist. In subsequent moments, the number of plasma breakdowns apparently reaches a critical concentration and begins to screen the radiation. Based on these findings, it is possible to estimate the electron concentration in the breakdown plasma. Taking into account that at a critical concentration, radiation at a wavelength of 1064 nm is completely screened by the plasma, and, using the known expression for the plasma frequency, we obtain that the electron concentration in the plasma is Ne ≈ 1021 cm−3. The obtained value is consistent with estimates of plasma electron concentrations obtained in other studies [38,39].

4.3. Effect of Rare Earth Metal Nanoparticles

In our earlier studies, we studied the effect of rare earth nanoparticles of gadolinium oxide and terbium nanoparticle oxides on the properties of physical processes and the generation rates of chemical products of the process of dissociation of water molecules during laser breakdown of aqueous colloids of nanoparticles [23,37]. It was found that the use of terbium and gadolinium oxide nanoparticles as seeds on which optical breakdown develops leads to better performance in the rate of generation of chemical products in comparison with other nanoparticles; the highest performance was observed for Gd2O3 nanoparticles. The maximum rates of formation of chemical products for dysprosium nanoparticles per laser pulse are 11.7 nmol/pulse for H2, 2.82 nmol/pulse for O2, and 1.8 nmol/pulse and 3.3 nmol/pulse for OH and H2O2, respectively.
It is worth noting that for most particle materials in a wide range of concentrations, the generation rate of molecular hydrogen is several times greater than the generation rate of molecular oxygen, namely, the generation rate ratio is approximately 4.4, which indicates that the decomposition of water molecules occurs according to the following scenario [21]:
6 H 2 O 4 H 2 + 2 H 2 O 2 + O 2 .
A comparison of the rates of generation of chemical products during irradiation and optical breakdown of rare earth metal nanoparticle colloids shows that the use of dysprosium nanoparticles in an irradiated colloid in optimal concentrations (1010 NPs/mL) per laser pulse leads to a twofold decrease in the production of hydrogen peroxide and molecular oxygen compared to nanoparticles of gadolinium oxide. At the same time, the production of hydroxyl radicals and molecular hydrogen remains comparable to the same indicators for Gd2O3 nanoparticles. Thus, stoichiometric Equation (1), which describes the production of chemical products given above, for dysprosium nanoparticles can be represented as follows:
18 H 2 O 14 H 2 + 4 H 2 O 2 + 5 O 2 .
Comparing the above equation with (1), one can notice a decrease in the rate of peroxide formation and an increase in the rate of molecular oxygen formation. Moreover, it is worth noting that there is a significant (4–5 times) increase in the rate of formation of hydroxyl radicals in the colloid of rare earth metals. The observed effect can be explained by the occurrence of reactions in the colloid of nanoparticles similar to the Fenton reaction [40], during which the formation of radical products occurs. These reactions apparently occur with hydrogen peroxide molecules formed during the recombination of radical reactions on the oxidized surface of nanoparticles, which are rare earth metal oxides: Dy2O3 or Gd2O3. The ability of rare earth metals to participate in such reactions has been reported in other studies [41,42,43]. Using an analogy with reactions involving Fe, it can be assumed that the interaction of dysprosium with hydrogen peroxide occurs as follows:
D y 3 + + H 2 O 2 D y 4 + + H O + O H .
Further, the reaction of Dy4+ with a superoxide anion radical is possible according to the Haber–Weiss reaction [44] with the formation of molecular oxygen:
D y 4 + +   O 2 D y 3 + + O 2 .
From Equations (3) and (4), it follows that the interaction of hydrogen peroxide with dysprosium nanoparticles leads to an additional formation of radical products and molecular oxygen in the colloid, which explains the experimentally observed effect of reducing the formation of hydrogen peroxide and increasing the formation of hydroxyl radicals.

5. Conclusions

The results of this paper show that fast (several tens of nanoseconds) processes of formation of laser breakdown plasma are influenced by the concentration of nanoparticles. It has been shown that an increase in the concentration of nanoparticles in the colloid leads to a decrease in the size of the plasma flash. At the same time, the speed of motion of the plasma–liquid interface and the total lifetime of the plasma flash decrease with an increasing concentration of nanoparticles. It was also found that the time delay between the beginning of the laser pulse and the moment the plasma flash reaches its highest luminescence intensity increases with increasing concentration. The observed effect is explained by the processes of scattering laser radiation in the colloid, which increases with an increasing concentration of nanoparticles, and the resulting decrease in the effective radiation energy. A change in the laser fluence in the range from 67 to 134 J/cm2 does not lead to noticeable changes in the indicated parameters of the plasma flash, which is explained by the plasma reaching a critical state and the screening of laser radiation by plasma electrons. It has been shown that the use of nanoparticles of rare earth metals during laser breakdown leads to an increase in the rate of generation of hydroxyl radicals and a decrease in the rate of generation of hydrogen peroxide per water molecule, which can be explained by the interaction of nanoparticles and hydrogen peroxide in reactions similar to the Fenton and Haber–Weiss reactions.

Author Contributions

Conceptualization, S.V.G. and A.V.S.; supervision, S.V.G.; methodology, A.V.S.; visualization, I.V.B.; investigation, S.V.G., A.V.S., I.V.B., A.S.B., A.O.D., V.K.C., O.V.U. and M.E.A.; writing—original draft, I.V.B.; writing—review and editing, S.V.G., A.V.S., I.V.B., A.S.B., A.O.D., V.K.C., O.V.U. and M.E.A.; funding acquisition, A.V.S. and S.V.G. All authors have read and agreed to the published version of the manuscript.

Funding

This work was supported by a grant № 22-22-00602 from the Russian Science Foundation.

Institutional Review Board Statement

This study did not require ethical approval.

Informed Consent Statement

Not applicable.

Data Availability Statement

The data presented in this study are available on request from the corresponding author.

Conflicts of Interest

The authors declare no conflicts of interest.

References

  1. Křenek, T.; Vála, L.; Kovářík, T.; Medlín, R.; Fajgar, R.; Pola, J.; Jandová, V.; Vavruňková, V.; Pola, M.; Koštejn, M. Novel Perspectives of Laser Ablation in Liquids: The Formation of a High-Pressure Orthorhombic FeS Phase and Absorption of FeS-Derived Colloids on a Porous Surface for Solar-Light Photocatalytic Wastewater Cleaning. Dalt. Trans. 2020, 49, 13262–13275. [Google Scholar] [CrossRef] [PubMed]
  2. Aiyyzhy, K.O.; Barmina, E.V.; Voronov, V.V.; Shafeev, G.A.; Novikov, G.G.; Uvarov, O.V. Laser Ablation and Fragmentation of Boron in Liquids. Opt. Laser Technol. 2022, 155, 108393. [Google Scholar] [CrossRef]
  3. Frias Batista, L.M.; Nag, A.; Meader, V.K.; Tibbetts, K.M. Generation of Nanomaterials by Reactive Laser-Synthesis in Liquid. Sci. China Phys. Mech. Astron. 2022, 65, 274202. [Google Scholar] [CrossRef]
  4. Yogesh, G.K.; Shukla, S.; Sastikumar, D.; Koinkar, P. Progress in Pulsed Laser Ablation in Liquid (PLAL) Technique for the Synthesis of Carbon Nanomaterials: A Review. Appl. Phys. A 2021, 127, 810. [Google Scholar] [CrossRef]
  5. Aiyyzhy, K.O.; Barmina, E.V.; Rakov, I.I.; Voronov, V.V.; Shafeev, G.A. Laser Synthesis of Ruby and Its Nanoparticles for Photo-Conversion of Solar Spectrum. Laser Phys. Lett. 2023, 20, 46001. [Google Scholar] [CrossRef]
  6. Amoruso, S.; Bruzzese, R.; Spinelli, N.; Velotta, R. Characterization of Laser–Ablation Plasmas. J. Phys. B At. Mol. Opt. Phys. 1999, 32, R131–R172. [Google Scholar] [CrossRef]
  7. Dell’Aglio, M.; De Giacomo, A. Plasma Charging Effect on the Nanoparticles Releasing from the Cavitation Bubble to the Solution during Nanosecond Pulsed Laser Ablation in Liquid. Appl. Surf. Sci. 2020, 515, 146031. [Google Scholar] [CrossRef]
  8. Vanraes, P.; Bogaerts, A. The Essential Role of the Plasma Sheath in Plasma–Liquid Interaction and Its Applications—A Perspective. J. Appl. Phys. 2021, 129, 220901. [Google Scholar] [CrossRef]
  9. Anderson, C.E.; Cha, N.R.; Lindsay, A.D.; Clark, D.S.; Graves, D.B. The Role of Interfacial Reactions in Determining Plasma–Liquid Chemistry. Plasma Chem. Plasma Process. 2016, 36, 1393–1415. [Google Scholar] [CrossRef]
  10. Chemin, A.; Fawaz, M.W.; Amans, D. Investigation of the Blast Pressure Following Laser Ablation at a Solid–Fluid Interface Using Shock Waves Dynamics in Air and in Water. Appl. Surf. Sci. 2022, 574, 151592. [Google Scholar] [CrossRef]
  11. Spellauge, M.; Tack, M.; Streubel, R.; Miertz, M.; Exner, K.S.; Reichenberger, S.; Barcikowski, S.; Huber, H.P.; Ziefuss, A.R. Photomechanical Laser Fragmentation of IrO2 Microparticles for the Synthesis of Active and Redox-Sensitive Colloidal Nanoclusters. Small 2023, 19, 2206485. [Google Scholar] [CrossRef] [PubMed]
  12. Dell’Aglio, M.; Gaudiuso, R.; De Pascale, O.; De Giacomo, A. Mechanisms and Processes of Pulsed Laser Ablation in Liquids during Nanoparticle Production. Appl. Surf. Sci. 2015, 348, 4–9. [Google Scholar] [CrossRef]
  13. Kudryashov, S.I.; Samokhvalov, A.A.; Nastulyavichus, A.A.; Saraeva, I.N.; Mikhailovskii, V.Y.; Ionin, A.A.; Veiko, V.P. Nanosecond-Laser Generation of Nanoparticles in Liquids: From Ablation through Bubble Dynamics to Nanoparticle Yield. Materials 2019, 12, 562. [Google Scholar] [CrossRef] [PubMed]
  14. Jelenčič, M.; Orthaber, U.; Mur, J.; Petelin, J. Evidence of Laser-Induced Nanobubble Formation Mechanism in Water. Ultrason. Sonochem. 2023, 99, 106537. [Google Scholar] [CrossRef] [PubMed]
  15. Barmina, E.V.; Simakin, A.V.; Shafeev, G.A. Hydrogen Emission under Laser Exposure of Colloidal Solutions of Nanoparticles. Chem. Phys. Lett. 2016, 655, 35–38. [Google Scholar] [CrossRef]
  16. Batista, L.M.F.; Moody, M.; Weththasingha, C.; Kaplan, E.; Faruque, I.; El-Shall, M.S.; Tibbetts, K.M. Understanding Photochemical Pathways of Laser-Induced Metal Ion Reduction through Byproduct Analysis. Phys. Chem. Chem. Phys. 2023, 25, 18844–18853. [Google Scholar] [CrossRef] [PubMed]
  17. Itina, T.E. On Nanoparticle Formation by Laser Ablation in Liquids. J. Phys. Chem. C 2011, 115, 5044–5048. [Google Scholar] [CrossRef]
  18. Subhan, A.; Mourad, A.-H.I.; Al-Douri, Y. Influence of Laser Process Parameters, Liquid Medium, and External Field on the Synthesis of Colloidal Metal Nanoparticles Using Pulsed Laser Ablation in Liquid: A Review. Nanomaterials 2022, 12, 2144. [Google Scholar] [CrossRef]
  19. Zhang, K.; Ivanov, D.S.; Ganeev, R.A.; Boltaev, G.S.; Krishnendu, P.S.; Singh, S.C.; Garcia, M.E.; Zavestovskaya, I.N.; Guo, C. Pulse Duration and Wavelength Effects of Laser Ablation on the Oxidation, Hydrolysis, and Aging of Aluminum Nanoparticles in Water. Nanomaterials 2019, 9, 767. [Google Scholar] [CrossRef]
  20. Kanitz, A.; Hoppius, J.S.; Gurevich, E.L.; Ostendorf, A. Influence of the Liquid on Femtosecond Laser Ablation of Iron. Phys. Procedia 2016, 83, 114–122. [Google Scholar] [CrossRef]
  21. Simakin, A.V.; Astashev, M.E.; Baimler, I.V.; Uvarov, O.V.; Voronov, V.V.; Vedunova, M.V.; Sevost’yanov, M.A.; Belosludtsev, K.N.; Gudkov, S.V.; Sevost’Yanov, M.A.; et al. The Effect of Gold Nanoparticle Concentration and Laser Fluence on the Laser-Induced Water Decomposition. J. Phys. Chem. B 2019, 123, 1869–1880. [Google Scholar] [CrossRef] [PubMed]
  22. Russo, R.E.; Mao, X.L.; Liu, H.C.; Yoo, J.H.; Mao, S.S. Time-Resolved Plasma Diagnostics and Mass Removal during Single-Pulse Laser Ablation. Appl. Phys. A 1999, 69, S887–S894. [Google Scholar] [CrossRef]
  23. Simakin, A.V.; Baimler, I.V.; Baryshev, A.S.; Dikovskaya, A.O.; Gudkov, S.V. The Influence of Gadolinium Oxide Nanoparticles Concentration on the Chemical and Physical Processes Intensity during Laser-Induced Breakdown of Aqueous Solutions. Photonics 2023, 10, 784. [Google Scholar] [CrossRef]
  24. Baimler, I.V.; Simakin, A.V.; Gudkov, S.V. Investigation of the Laser-Induced Breakdown Plasma, Acoustic Vibrations and Dissociation Processes of Water Molecules Caused by Laser Breakdown of Colloidal Solutions Containing Ni Nanoparticles. Plasma Sources Sci. Technol. 2021, 30, 125015. [Google Scholar] [CrossRef]
  25. Hertel, G.R. Surface Ionization. III. The First Ionization Potentials of the Lanthanides. J. Chem. Phys. 1968, 48, 2053–2058. [Google Scholar] [CrossRef]
  26. Loock, H.P.; Beaty, L.M.; Simard, B. Reassessment of the First Ionization Potentials of Copper, Silver, and Gold. Phys. Rev. A 1999, 59, 873–875. [Google Scholar] [CrossRef]
  27. Baimler, I.V.; Lisitsyn, A.B.; Gudkov, S.V. Influence of Gases Dissolved in Water on the Process of Optical Breakdown of Aqueous Solutions of Cu Nanoparticles. Front. Phys. 2020, 8, 6222775. [Google Scholar] [CrossRef]
  28. Chernikov, A.V.; Bruskov, V.I.; Gudkov, S.V. Heat-Induced Formation of Nitrogen Oxides in Water. J. Biol. Phys. 2013, 39, 687–699. [Google Scholar] [CrossRef] [PubMed]
  29. Sevostyanov, M.A.; Kolmakov, A.G.; Sergiyenko, K.V.; Kaplan, M.A.; Baikin, A.S.; Gudkov, S.V. Mechanical, Physical–Chemical and Biological Properties of the New Ti–30Nb–13Ta–5Zr Alloy. J. Mater. Sci. 2020, 55, 14516–14529. [Google Scholar] [CrossRef]
  30. Dittrich, S.; Barcikowski, S.; Gökce, B. Plasma and Nanoparticle Shielding during Pulsed Laser Ablation in Liquids Cause Ablation Efficiency Decrease. Opto-Electron. Adv. 2021, 4, 200072. [Google Scholar] [CrossRef]
  31. Dittrich, S.; Spellauge, M.; Barcikowski, S.; Huber, H.P.; Gökce, B. Time Resolved Studies Reveal the Origin of the Unparalleled High Efficiency of One Nanosecond Laser Ablation in Liquids. Opto-Electron. Adv. 2022, 5, 210051–210053. [Google Scholar] [CrossRef]
  32. Malyutin, A.A.; Podvyaznikov, V.A.; Chevokin, V.K. Density Jumps in the Plasma of a Nanosecond Laser-Induced Spark and Their Dynamics. Quantum Electron. 2011, 41, 38–42. [Google Scholar] [CrossRef]
  33. Baimler, I.V.; Chevokin, V.K.; Podvyaznikov, V.A.; Gudkov, S.V. Case Report: Investigation of the Time Evolution of Optical Breakdown Plasma During Irradiation of Aqueous Solutions of Fe Nanoparticles. Front. Phys. 2021, 9, 641899. [Google Scholar] [CrossRef]
  34. Bundschuh, T.; Hauser, W.; Kim, J.I.; Knopp, R.; Scherbaum, F.J. Determination of Colloid Size by 2-D Optical Detection of Laser Induced Plasma. Coll. Surf. A Physicochem. Eng. Asp. 2001, 180, 285–293. [Google Scholar] [CrossRef]
  35. Kim, J.W.; Son, J.A.; Yun, J.I.; Jung, E.C.; Park, S.H.; Choi, J.G. Analysis of Laser-Induced Breakdown Images Measuring the Sizes of Mixed Aquatic Nanoparticles. Chem. Phys. Lett. 2008, 462, 75–77. [Google Scholar] [CrossRef]
  36. Jung, E.C.; Yun, J.I.; Kim, J.I.; Bouby, M.; Geckeis, H.; Park, Y.J.; Park, K.K.; Fanghänel, T.; Kim, W.H. Measurement of Bimodal Size Distribution of Nanoparticles by Using the Spatial Distribution of Laser-Induced Plasma. Appl. Phys. B Lasers Opt. 2007, 87, 497–502. [Google Scholar] [CrossRef]
  37. Gudkov, S.V.; Astashev, M.E.; Baimler, I.V.; Uvarov, O.V.; Voronov, V.V.; Simakin, A.V. Laser-Induced Optical Breakdown of an Aqueous Colloidal Solution Containing Terbium Nanoparticles: The Effect of Oxidation of Nanoparticles. J. Phys. Chem. B 2022, 126, 5678–5688. [Google Scholar] [CrossRef] [PubMed]
  38. Kudryashov, S.I.; Zvorykin, V.D. Microscale Nanosecond Laser-Induced Optical Breakdown in Water. Phys. Rev. E 2008, 78, 036404. [Google Scholar] [CrossRef]
  39. Noack, J.; Vogel, A. Laser-Induced Plasma Formation in Water at Nanosecond to Femtosecond Time Scales: Calculation of Thresholds, Absorption Coefficients, and Energy Density. IEEE J. Quantum Electron. 1999, 35, 1156–1167. [Google Scholar] [CrossRef]
  40. Koppenol, W.H. The Centennial of the Fenton Reaction. Free Radic. Biol. Med. 1993, 15, 645–651. [Google Scholar] [CrossRef]
  41. Martin, J.; Mladěnka, P.; Saso, L.; Kostova, I. Lanthanide (III) Complexes Are More Active Inhibitors of the Fenton Reaction than Pure Ligands. Redox Rep. 2016, 21, 84–89. [Google Scholar] [CrossRef] [PubMed]
  42. Heckert, E.G.; Seal, S.; Self, W.T. Fenton-like Reaction Catalyzed by the Rare Earth Inner Transition Metal Cerium. Environ. Sci. Technol. 2008, 42, 5014–5019. [Google Scholar] [CrossRef] [PubMed]
  43. Hussain, S.; Aneggi, E.; Goi, D. Catalytic Activity of Metals in Heterogeneous Fenton-like Oxidation of Wastewater Contaminants: A Review. Environ. Chem. Lett. 2021, 19, 2405–2424. [Google Scholar] [CrossRef]
  44. Haber, F.; Weiss, J. Über die Katalyse des Hydroperoxydes. Naturwissensch./Sci. Nat. 1932, 20, 948–950. [Google Scholar] [CrossRef]
Figure 1. (A) Schematic representation of the experimental setup for recording time-resolved images of the breakdown plasma. (B) A typical image of the time base of a plasma flash and parameters measured in experiments; the time scale mark (horizontal) is 10 ns and the spacial scale mark (vertical) is 100 µm.
Physics 06 00035 g001
Figure 2. Characteristics of the obtained dysprosium nanoparticles. (A) Distribution of Dy nanoparticles as a function of size. (B) Mass distribution of Dy nanoparticles as a function of size. (C) TEM image of an individual dysprosium particle, scale bar size being 10 nm. (D) TEM image of a dysprosium particle (upper), and the distribution of elements along the line obtained using EDX spectroscopy (lower). See text for details.
Physics 06 00035 g002
Figure 3. Transmission spectra in near-IR region for Dy NP colloids. The transmission spectrum of pure deionized water not containing NPs was used as a reference spectrum.
Physics 06 00035 g003
Figure 4. Typical images of time-resolved images of plasma optical breakdown of a colloid of dysprosium nanoparticles for different energy densities of laser radiation and concentrations of nanoparticles; the time scale mark (horizontal) is 10 ns and the spacial scale mark (vertical) is 100 µm (top right). F denotes the fluence of laser radiation.
Physics 06 00035 g004
Figure 5. Results of the analysis of optical breakdown plasma time-resolved images: (A) dependence of the delay time between the time of reaching the maximum plasma intensity and the beginning of the laser pulse on the fluence and concentration of nanoparticles; (B) dependence of the plasma expansion speed (movement speed of the plasma–liquid boundary) on the fluence and concentration of nanoparticles; (C) dependence of the plasma lifetime (time interval between reaching 20% of maximum intensity and 75% of maximum intensity during decay) on fluence and nanoparticle concentration; (D) dependence of plasma flash sizes on fluence and nanoparticle concentration; (E) dependence of the distance between the laser pulse and the plasma flash on the fluence and concentration of nanoparticles; (F) dependence of the displacement of the plasma flash relative to the laser pulse on the fluence and concentration of nanoparticles.
Physics 06 00035 g005
Figure 6. Formation of molecular hydrogen and molecular oxygen during laser breakdown of aqueous solutions of Dy nanoparticles; (A) rate of molecular hydrogen formation as a function of Dy particle concentration; (B) rate of molecular oxygen formation as a function of Dy particle concentration. A spline was used to connect the data points. The values of the measured parameters are averaged over five measurements, and the errors correspond to the standard error to the mean.
Physics 06 00035 g006
Figure 7. Formation of hydrogen peroxide and hydroxyl radicals during laser breakdown of aqueous solutions of Dy nanoparticles. (A) The rate of formation of hydroxyl radicals depending on the concentration of Dy particles in the irradiated solution. (B) The rate of formation of hydrogen peroxide depending on the concentration of Dy particles. A spline was used to connect the data points. The values of the measured parameters are averaged over five measurements, and the errors correspond to the standard error to the mean.
Physics 06 00035 g007
Figure 8. Time delay between the beginning of the laser pulse and the maximum plasma intensity depending on the size of the plasma flash. The data are grouped according to concentration (A) and according to laser fluence (B). The fitting curves in (A) for each concentration coincide with the curve presented.
Physics 06 00035 g008
Disclaimer/Publisher’s Note: The statements, opinions and data contained in all publications are solely those of the individual author(s) and contributor(s) and not of MDPI and/or the editor(s). MDPI and/or the editor(s) disclaim responsibility for any injury to people or property resulting from any ideas, methods, instructions or products referred to in the content.

