Article

Environmental and Economic Benefits of a Battery Electric Vehicle Powertrain with a Zinc–Air Range Extender in the Transition to Electric Vehicles

1
Department of Chemical Engineering, University of Waterloo, Waterloo, ON N2L 3G1, Canada
2
Department of Mechanical and Mechatronics Engineering, University of Waterloo, Waterloo, ON N2L 3G1, Canada
3
Department of Economics, University of Waterloo, Waterloo, ON N2L 3G1, Canada
*
Author to whom correspondence should be addressed.
Vehicles 2020, 2(3), 398-412; https://doi.org/10.3390/vehicles2030021
Submission received: 1 June 2020 / Revised: 18 June 2020 / Accepted: 26 June 2020 / Published: 27 June 2020
(This article belongs to the Special Issue Future Powertrain Technologies)

Abstract

:
Emissions and pollution from the transportation sector due to the consumption of fossil fuels by conventional vehicles have been negatively affecting the global climate and public health. Electric vehicles (EVs) are a cleaner solution to reduce the emission and pollution caused by transportation. Lithium-ion (Li-ion) batteries are the main type of energy storage system used in EVs. The Li-ion battery pack must be considerably large to satisfy the requirement for the vehicle’s range, which also increases the cost of the vehicle. However, considering that most people use their vehicles for short-distance travel during daily commutes, the large pack is expensive, inefficient and unnecessary. In a previous paper, we proposed a novel EV powertrain design that incorporated the use of a zinc–air (Zn–air) battery pack as a range-extender, so that a smaller Li-ion pack could be used to save costs. The design and performance aspects of the powertrain were analyzed. In this study, the environmental and economic benefits of the proposed dual-battery powertrain are investigated. The results from the new powertrain were compared with values from a standard EV powertrain with one large Li-ion pack and a conventional internal combustion engine vehicle (ICEV) powertrain. In addition, an air pollution model is developed to determine the total amount of pollution released by the transportation sector on Highway 401 in Ontario, Canada. The model was then used to determine the effects of mass passenger EV rollout on pollution reduction.

Graphical Abstract

1. Introduction

A recent report by the international panel on climate change (IPCC) highlighted anthropogenic climate change as a major threat to humanity and life on earth [1]. The IPCC determined that climate change, if not addressed, would cause an increase in mean temperature in many regions. Some regions would also see an increase in the frequency and intensity of droughts, while some would be affected by a rise in sea levels. The main cause of anthropogenic climate change is the ever-increasing amount of greenhouse gas (GHG) emissions. Therefore, GHG emissions must be drastically reduced in order to prevent the negative consequences of climate change [2]. Currently, the transportation sector accounts for a large portion of GHG (mainly CO2) emissions. In Canada, Clean Energy Canada found that the transportation sector was responsible for 23% of Canada’s GHG emissions as of 2016 [3]. The Canadian transportation sector is dominated by internal combustion engine vehicles (ICEVs). Aside from CO2, ICEVs also emit other hazardous gases including carbon monoxide (CO), sulfur dioxide (SO2), nitrous oxides (NOx) and volatile organic compounds (VOCs). These air pollutants were found to increase one’s risk of dementia, diabetes, asthma and premature death.
A viable alternative to ICEVs is electric vehicles (EVs). EVs use a motor, often powered by a lithium-ion (Li-ion) battery pack, to propel the vehicle [4]. EVs have lower environmental and health impacts compared to ICEVs because they do not emit exhaust, thus, they do not directly release any emissions or pollutants [5]. EVs can help prevent climate change, thus protecting the environment and public health [6]. Although electricity production is usually much cleaner than oil and gas consumption, the degree of which depends on the method that the electricity was produced. Hence, EVs are more favorable in regions that use nuclear and renewable sources to generate electricity [7]. For example, a study done in Texas showed that EVs powered by coal increased air pollution by 350%, while EVs powered by renewable energy or natural gas decreased air pollution by 50% and 70%, respectively [8]. In Ontario, Canada, there is a surplus of electricity produced from different energy sources, and therefore, the market penetration of EVs would be beneficial [9].
However, there are several issues that prevent the widespread adoption of EVs, including the high cost of the vehicles, the lack of charging infrastructure, and the limited range associated with EVs [10,11]. A solution to the limited range and high cost of EVs is to utilize a range extender, which is an auxiliary energy storage system (ESS) that provides the vehicle with additional energy to complement the primary battery in propelling the vehicle [12]. There are several different types of range extenders, including ICE, fuel cell, free-piston linear generator (FPLG) and micro gas turbine (MGT) [13]. An ICE range extender converts gasoline into electricity using a fuel converter. The ICE unit is comprised of an electronically controlled combustion engine connected to a generator, which supplies the required electricity to the motor [14]. A fuel cell extended-range EV has a tank of hydrogen fuel, which gets converted into usable electricity by the fuel cell to support the battery in powering the vehicle [15]. The fuel cell range extender can increase the range and performance of the vehicle while still drastically reducing emissions. An FPLG range extender uses a combustion and linear generator to convert chemical energy into electrical energy [16]. An MGT range extender draws in clean air, compresses it, and passes it through a turbine at extremely high revolutions to generate energy [17]. Despite their advantages, all of the aforementioned range-extending solutions have some drawbacks. ICE is not environmentally friendly, fuel cell and FPLG are not cost-effective, and MGT is not efficient. In recent years, the concept of using a zinc–air (Zn–air) battery pack as a range extender for EVs has been investigated [18].
Metal–air batteries have gained some attention for their potential use in EVs because of their high energy density and low cost [19]. The feasible cell chemistries include lithium–air (Li–air), aluminum–air (Al–air) and Zn–air. Li–air batteries have the highest energy density, but there are many potential deficiencies and safety concerns hindering their commercialization [20]. Al–air batteries have an aqueous electrolyte, making them safer than Li–air batteries. The drawback of Al–air batteries is that they are not easily recharged and need to be replaced once they are drained [19]. Zn–air batteries have a lower energy density than Li–air and Al–air batteries. However, Zn–air batteries have attracted significant commercial and research interest for several reasons. The raw materials required to manufacture Zn–air batteries are abundant, which lowers the cost of the pack significantly [21]. Zn–air batteries also have a greater energy density and specific energy than Li-ion batteries. They have good resistance to aging degradation but are susceptible to cycling degradation [19]. This means that they can last a long time if left unused but cannot be cycled as many times as Li-ion batteries.
Recent breakthroughs in Li-ion battery research have allowed for increased range of EVs. However, the current solution to the range problem involves a larger Li-ion battery pack, which is expensive and redundant for daily use of EVs, as most people only use their vehicles to commute short distances between work and home. In our previous work, we proposed a novel powertrain design, incorporating a Li-ion battery pack as the primary ESS and a Zn–air battery pack as the range extender, with the necessary electronic controls to facilitate their coordination and optimization [18]. The Li-ion battery pack would be used for daily commutes while the Zn–air battery pack would serve as a range extender for longer trips. By utilizing these two ESS units in one powertrain, a smaller Li-ion pack can be used, which would lower the cost of the vehicle. In addition, the Zn–air pack is only used on longer trips, which reduces the cycling of the pack and eliminates its exposure to cycling degradation. Therefore, this design allows each battery to contribute its strengths while minimizing its weaknesses.
In this study, the environmental and economic implications of the proposed novel dual-battery-pack powertrain are examined, since only the design and performance aspects of the powertrain were investigated in our previous study. The analysis should provide a more complete picture of the feasibility and benefits of the proposed powertrain design. The results from the dual-pack powertrain are compared with values from a standard single-pack Li-ion battery EV and a conventional ICEV. In addition, an air pollution model is used to determine the amount of certain pollutants released annually by the transportation sector on Highway 401 in Ontario, Canada. The benefits of the pollution reduction from mass EV rollout are then analyzed for this case study. The rest of this study is organized as follows. Section 2 provides the analysis of the environmental and economic benefits of the proposed powertrain design, while Section 3 presents the benefit analysis of pollution reduction from the potential market penetration of EVs. Finally, Section 4 outlines some concluding remarks.

2. Environmental and Economic Benefits of the Novel Powertrain Design

2.1. Background of the Dual-Battery Powertrain Design

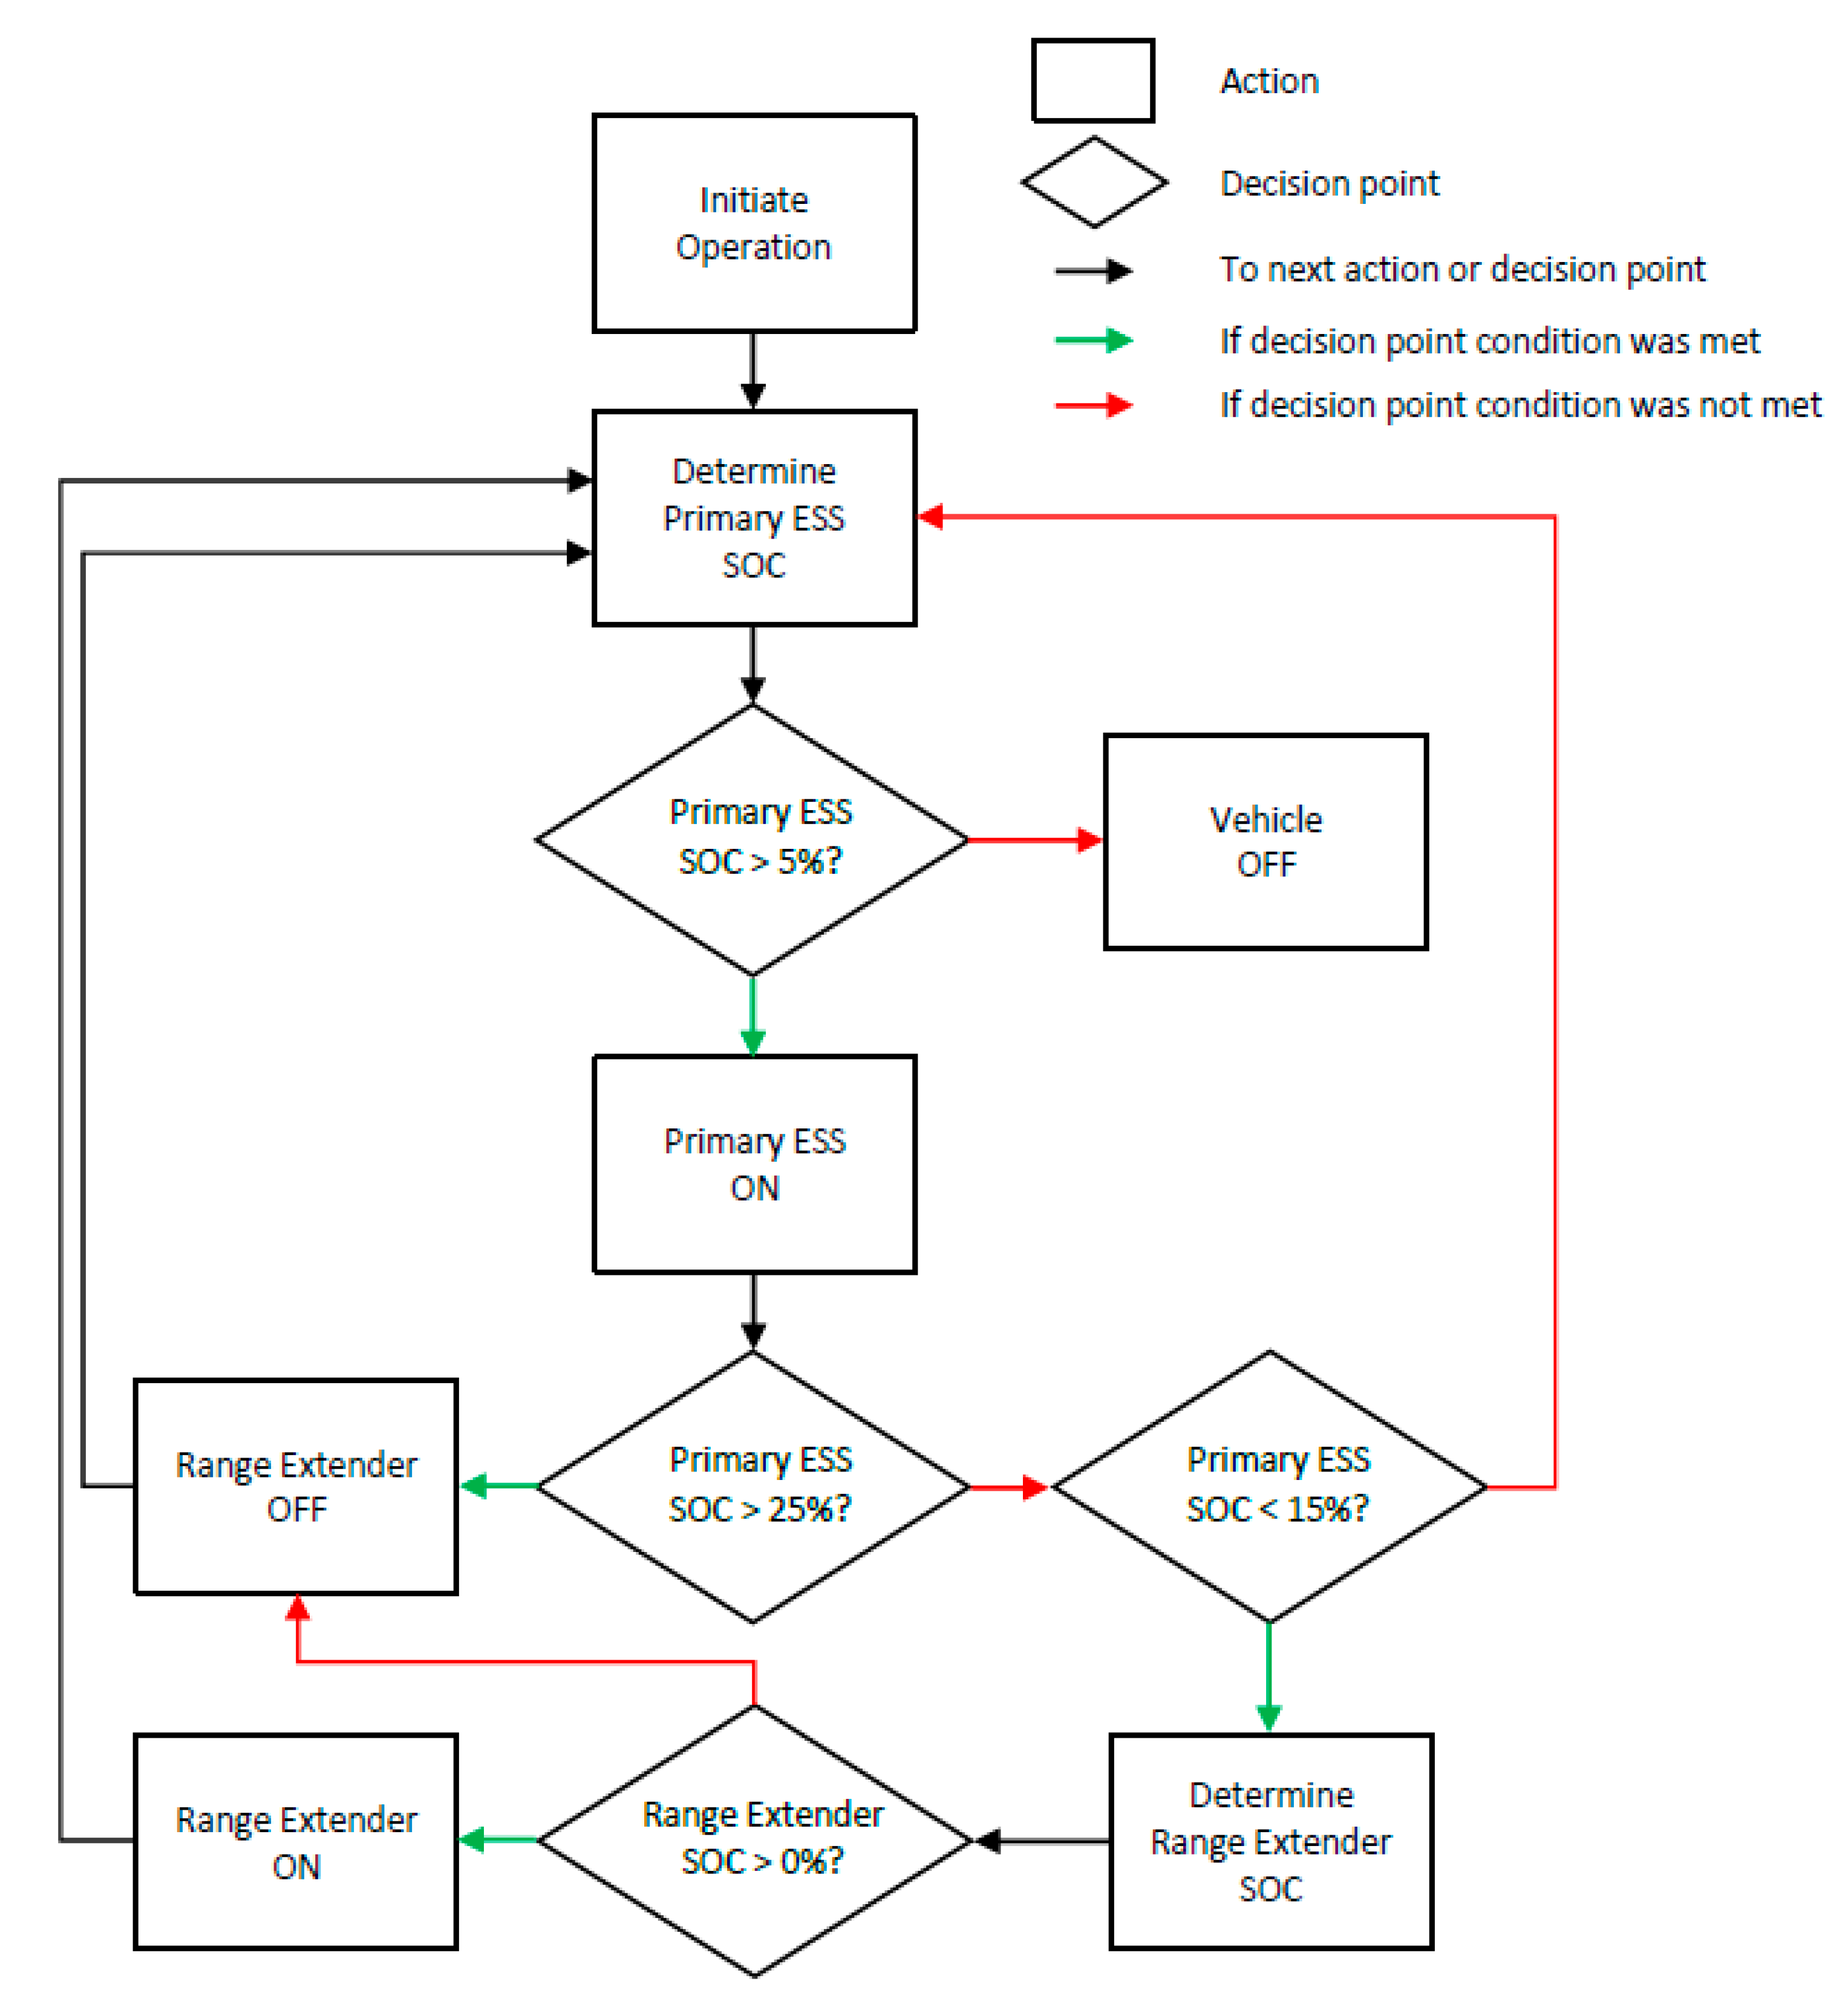
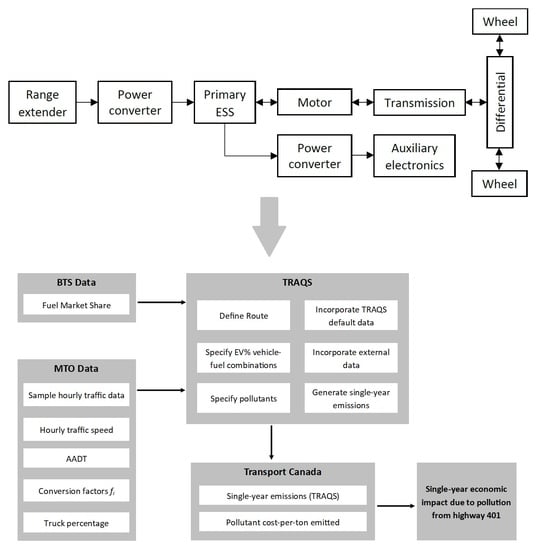
This section outlines the summary of the specifications of the novel dual-battery powertrain design, which was configured to optimize its range, cost and longevity in our previous study [18]. The powertrain design is shown in Figure 1, where the range extender is the Zn–air battery pack and the primary ESS is the Li-ion battery pack. The two ESS were connected in series instead of in parallel since the Zn–air pack may not have the required power density to satisfy the motor power demand during acceleration. Therefore, it can only directly provide electricity to the Li-ion pack which then effectively powers the motor. Figure 2 shows the energy management strategy of the powertrain. The strategy is implemented to ensure the range extender is only used when necessary since the Zn–air battery pack has poor cycling life and should not be used often.
Several designs of the Zn–air and Li-ion battery packs in the proposed powertrain (2BEV) were examined and the optimal designs are shown in Table 1. A similar EV with one large Li-ion battery pack (1BEV) was also modeled and compared with the proposed design. The modeling and simulation of the powertrain were performed in MATLAB/Simulink (MathWorks, Natick, MA, USA). The software models the performance of individual vehicle components in response to the demands placed on the vehicle by the driver. Because Zn–air batteries are not yet commercially available, the modeling was created based on previously published research with some adjustments to allow for achievable improvements. The Li-ion packs and other vehicle components were modeled based on data from commercial components. The specifications of the Li-ion cells were taken from commercial A123 pouch cells while the Zn–air cells were button cells. The total cell weights in Table 1 were multiplied by a packaging factor, which accounted for the weight of pack packaging components, to determine the pack weight.
Table 2 shows the results of the MATLAB/Simulink simulation runs for the proposed powertrain and the traditional EV powertrain. In the simulation, the 2BEV performance compared favorably to the 1BEV. The traveling distances under various driving conditions were similar, but the cost of the dual packs was 30% lower than that of the large Li-ion pack. The fuel economy of the 1BEV was found to be slightly better, but the overall vehicle performance was not significantly compromised as seen by the similar acceleration time in both powertrains. In addition, the simulation also demonstrated that the Zn–air pack can last up to 13 years if used optimally.

2.2. Environmental and Economic Comparison of Different Powertrain Designs

We performed further analyses regarding the environmental and economic benefits of the novel powertrain design to complement the findings in our previous study shown in the preceding section. In this section, a commercial ICEV, the 2019 Honda Civic, was used to compare the economic and environmental impact of the 2BEV and the 1BEV in Ontario, Canada. The ICEV data were taken from its real-world cost and performance. The EVs data were estimated based on some assumptions as well as some real-life data. The comparison results between the powertrains are shown in Table 3.
The manufacturer’s suggested retail price (MSRP) of the EVs was determined by removing the cost of certain conventional powertrain components and adding the cost of the corresponding EV powertrain components [22]. The Civic maintenance cost was based on a Canadian Automobile Association (CAA) estimate [23]. The EVs maintenance costs were assumed to be 19% lower [24]. Fuel cost was calculated from a price of $1.20/L for gasoline and $0.10 kW/h for electricity in Ontario. The combined cost for each vehicle was calculated using Equation (1). The combined cost is the total amount the vehicle would cost over a ten-year lifespan with an interest rate of 7.25% when converting the maintenance and fuel costs to the 2019-equivalent dollar amount [23]. The electricity generated in Ontario has an emission intensity of 0.0296 kg CO2/kWh [25]. This value was used to determine the total annual CO2 emissions from the EVs.
C C = M S R P + H S T + ( F C + M C ) n = 1 10 1.0725 n
where CC is the combined cost, MSRP is the manufacturer’s suggested retail price, HST is the harmonized sales tax (13%), FC is the fuel cost and MC is the maintenance cost.
There are several noteworthy findings from this analysis. The higher fuel cost and higher emissions of the 2BEV compared to the 1BEV can be linked to the fact that Zn–air batteries have lower efficiency than Li-ion batteries. However, despite the higher fuel cost, the combined cost of the 2BEV is lower than the 1BEV, which can be attributed to the low capital cost of the Zn–air battery pack. Overall, the 2BEV is observed to be the most cost-effective option of the three. In addition, even though the CO2 emissions value from the 2BEV is slightly larger than the 1BEV, both emissions values of the EVs are significantly smaller than the ICEV. This is because Ontario only has a small amount of its electricity generated from natural gas while the majority is produced through cleaner renewable energy sources or nuclear power. Overall, the proposed 2BEV design realizes significant environmental and economic benefits, as it outperforms the ICEV in terms of emissions and outperforms the 1BEV in terms of costs. It should be noted that the environmental impact of battery manufacturing is not discussed in this study, and it is possible that the impacts of producing batteries may outweigh the benefits of using EVs.

3. The Benefits of Pollution Reduction from EV Rollout in Canada

In the previous section, the environmental and economic benefits of the 2BEV were discussed in comparison to the 1BEV and ICEV. It was observed that the design of the proposed powertrain can be comparable to other commercial designs. In order to further understand the feasibility and benefits of this technology, the reduction of air pollution from EV market penetration should also be investigated. Emissions of certain pollutants can be reduced by adopting EVs [26]. This section studies the economic benefits of pollution reduction from EV rollout in the case of Toronto, Ontario, Canada—specifically on Highway 401, one of the major highways in the province.

3.1. Air Pollution in Canada

The reduction of air pollution is a major incentive for the rollout of EVs. Anthropogenic pollution in Canada is responsible for approximately 144,000 deaths per year as stated by Health Canada in 2017 [27]. Fine particulate matter (PM2.5), nitrogen dioxide (NO2) and ozone (O3) are some of the main chemicals that contribute to air pollution. The economic cost of PM2.5 and O3 is 42 billion dollars annually, with incidents caused by these air pollutants accounting for $39 billion. Health care and missed work also cost $2 billion and $861 million, respectively [28]. Through a study that investigated the impact of transportation specifically, it was found that PM2.5, sulfur dioxide (SO2), nitrous oxides (NOx) and volatile organic compounds (VOCs) emissions cost about $7.9 billion [29]. Pollution from light passenger vehicles excluding road dust cost $2 billion, with 52% of the emissions being attributed to NOx. Another study found that in Toronto, 1300 premature deaths and 3550 hospitalizations annually were caused by acute exposure and chronic exposure to air pollution, costing the city $878 million [30]. Of these, air pollution produced from traffic accounted for 280 deaths and 1090 hospitalizations. Toronto traffic was also stated to be the cause of a significant number of acute respiratory disease cases.
Major air pollutants from ICEVs include NOx, SOx, VOCs, carbon monoxide (CO) and particulate matter (PM2.5 and PM10). NOx and VOCs react in still air and sunlight to form the pollutant O3 [31]. In traffic, EVs do not emit any pollutants except for the inevitable road dust (particulate matter) from braking, as do all on-road vehicles. Therefore, in locations where traffic is a significant contributor to air pollution, EV adoption would play an important role in improving the air quality within the region.

3.2. Air Pollution Modeling

A simple method to quantitatively determine the benefits EVs have on reducing air pollution is to estimate the amount of pollution being emitted per passenger vehicle. The associated costs per ton of pollutants are then calculated and multiplied by the number of passenger vehicles in the specified region. However, this simple approach does not account for population characteristics, traffic patterns or pollutant distribution. A more intensive method would be to model an entire traffic network. This method would create a more accurate economic assessment based on traffic patterns, airflow patterns and population characteristics. Despite its accuracy, this model would be arduous and require an unfeasibly large amount of data. Therefore, we developed a model with moderate complexity that contains traffic data, but not population nor weather patterns. The model only considers Highway 401 in Ontario and does not incorporate any other Toronto traffic. The model has a reasonable scope, utilizes readily available data, and can deliver a good estimation of the amount of certain air pollutants.

3.2.1. Modeling Software and Model Overview

The model was created through the modeling software transportation air quality system (TRAQS). TRAQS combines motor emissions vehicle simulator (MOVES) and American Meteorological Society/Environment Protection Agency Regulatory Model (AERMOD) into one user-friendly software that simplifies large simulations covering varying conditions over long periods of time. MOVES determines the emission rate based on its modeled traffic patterns, while AERMOD processes the emission rate through air dispersion modeling to determine the pollutant distribution. The schematic of the structure and functions of TRAQS can be seen in Figure 3.
The TRAQS model represents the pollution source, Highway 401, as a sequence of connecting segments in between major on- and off-ramps. This representation is valid because traffic flow along these segments is mostly constant as vehicles are unable to enter or exit the highway. In each segment, the average speed and traffic volume were recorded on a seasonal basis and over four intervals during the day. The day was divided into morning peak (6 A.M. to 9 A.M.), midday (9 A.M. to 4 P.M.), afternoon peak (4 P.M. to 7 P.M.) and overnight (7 P.M. to 6 A.M.). Figure 4 shows the defined route in our TRAQS model. The green line represents the Highway 401 from Renforth Drive (West) to Kingston Road (East). The non-shaded areas in figure represent the 500-m distance from the highway to its sides. The average pollution released was calculated for this specific area near the highway.
Once the area and traffic flow patterns were defined in the model, the next set of parameters was established. These parameters included the vehicle–fuel combinations (e.g., diesel-powered truck, gasoline-powered passenger car, etc.) and pollutants to model. Several additional traffic characteristics were also specified for each season and portion of the day. These additional characteristics include the fraction of vehicles coinciding with each vehicle–fuel combination (e.g., 8% diesel-powered trucks, 59% gasoline-powered passenger cars, etc.), fuel formulation and supply, vehicle age distribution and climatic conditions. It should be noted that the climatic conditions were assumed to be the average temperature and humidity by the time of day and year. Once all the components in the model were specified, the model generated an emissions report containing an estimate of emissions in tons per year.

3.2.2. Data Overview

TRAQS provides some default data of vehicle age distribution, fuel supply and formulation and climatic conditions, which were determined by the United States Environmental Protection Agency (EPA). The traffic patterns and distribution were collected from the Ontario Ministry of Transportation (MTO). MTO publishes the annual average daily traffic (AADT) volumes for all of Ontario’s major highways, including Highway 401 [32]. These data are categorized by highway segment, but not by season or hour. Equation (2) provided by the MTO must be used to determine the seasonal average traffic volumes.
AADT = fi·ADTi
The average daily traffic for a specified period i of the year (ADTi) is derived from the AADT and a conversion factor, fi, provided by the MTO. The conversion factor corresponds to a certain period in the year and a given section on Highway 401. An hourly traffic distribution was created based on sample hourly data from the MTO for the first week of March in 2016. The generated distribution had slight variations over some sections (standard deviation < 6%), but this was considered negligible. Thus, the same hourly distribution was used for all sections of the highway. From the seasonal ADT and the hourly distribution, the hourly traffic volumes were estimated for morning peak, midday, afternoon peak and overnight and for all seasons and sections of the highway. In addition to the hourly traffic volumes, the hourly average speed data for the highway segments was also provided by the MTO.
Data from the MTO and the Bureau of Transportation Services (BTS) was also used to estimate the number of each type of vehicle–fuel combination. According to the BTS, 56% of the vehicle fleet are gasoline-powered cars and 39% are light diesel trucks [33]. The remaining 5% of the fleet consist of medium and heavy diesel trucks (3%) and diesel cars and gasoline trucks (2%). For this work, diesel cars and gasoline trucks are considered negligible. The MTO provided approximations for the percentage of trucks on Highway 401, which was split evenly between short-haul and long-haul single-unit diesel trucks. The remaining percentage was divided into gasoline-powered cars and light diesel trucks corresponding to the ratio specified by the BTS.

3.3. Methodology of Economic Benefits Estimation

The first step to estimate the economic costs due to air pollution surrounding Highway 401 was to generate a concentration profile of the highway using the air dispersion model and the emissions output from TRAQS. This concentration profile and the population characteristics within its horizon were then used as the basis for determining the economic costs to Canadians due to pollution. Using this method, Transport Canada estimated the economic and social costs of air pollution per unit of pollutant considering three major aspects, including impacts on human health, impacts on agriculture crops and visibility impacts [34]. Since the report referenced data and prices from the year 2000, an inflation rate was calculated to convert the costs to 2019-dollar values, as shown in Equation (3). The Canadian consumer price index (CPI) according to Statistics Canada was used, with CPI 2000 being 94.5 and CPI 2019 being 136.0 [35]. The resulting inflation rate of 43.92% was then applied to the 2000-dollar values to give their corresponding values in terms of a 2019 dollar.
Inflaction   Rate = C P I 2019 C P I 2000 C P I 2000   ×   100
The overall cost from pollution on Highway 401 was estimated using the annual emissions calculated using TRAQS and the cost per unit pollutant shown in Table 4. It should be noted that the values from Transport Canada are estimations for the entire province of Ontario. Therefore, the cost calculated using this method would be a large underestimate compared to the true cost, since Highway 401 is near regions with high population density, which increases the economic and health impacts of air pollution in these communities.
By modeling the traffic and pollution on Highway 401 in TRAQS, the potential air pollution reduction and benefits to Canada’s economy of EVs could be determined. The annual emissions of the pollutants were obtained using TRAQS. The economic costs of pollution were estimated using reported data from Transport Canada. The benefits of EV adoption were then calculated for different levels of market penetration. The schematic of the overall methodology is shown in Figure 5.

3.4. Results of Economic Benefits Estimation

TRAQS was used to model air pollution on Highway 401 using average traffic flow and speed data from the MTO, as well as vehicle distribution information from the BTS and the MTO. The annual emissions of relevant pollutants from the highway and their social and economic costs are shown in Table 5.
The TRAQS model was then adjusted for different percentages of the passenger gasoline vehicles being replaced with EVs (20%, 40%, 60%, 80% and 100%). The procedure to obtain emissions and costs for the different EV market penetration scenarios was the same as for the baseline (0%) scenario and is described in Section 3.2 and Section 3.3. Figure 6 and Figure 7 present the annual emissions and economic costs at different levels of EV market penetration. The cost values used in these figures are shown in Appendix A.
At 100% EV penetration for passenger vehicles, the total cost of emissions decreases by 44.8%, which indicates that trucks account for a significant portion of the costs. In terms of cost and volume, NOx is the largest contributor, which agrees with the findings from a study done by Sawyer et al. [29]. On the other hand, SO2 emissions have minimal impact on the total cost, which was also shown by Li et al. [36]. VOCs are significant by mass but have a low overall economic cost. PM2.5 emissions have the second-largest cost, but the cost only decreases slightly with increasing EV adoption levels. For every additional 20% EV penetration, PM2.5 emissions decrease by only 5%, whereas NOx emissions decrease by 10%, and SO2 and VOC emissions decrease by 16%. According to the MTO, trucks account for only 8–10% of traffic volume on Highway 401, but our results show that they contribute a significant amount to air pollution. Therefore, despite the 100% EV market penetration of passenger vehicles, the total economic cost from pollution on Highway 401 was only reduced by 44.8%, while the remaining cost was due to air pollution caused by trucks. Batteries are generally not a feasible option for electric trucks; hence, research works on fuel cells and hydrogen economy have gained attention recently. The combination of battery electric passenger vehicles and fuel cell electric trucks would substantially reduce the economic and social costs of air pollution caused by the transportation sector in Canada.

4. Conclusions

In this study, the environmental and economic benefits of a novel powertrain design for EVs were investigated. The powertrain uses a Li-ion battery pack as its primary ESS and a Zn–air battery pack as a range extender, with an optimal energy management strategy. The novel EV powertrain was compared with a standard EV powertrain with one large Li-ion pack and a conventional ICEV powertrain, in terms of costs and emissions. An air pollution model was also developed to study the benefits of EV adoption in Ontario, Canada. The model used traffic and vehicle fleet data on Highway 401 in Toronto to estimate the total amount of pollution caused by the transportation sector and its corresponding economic and social costs. It was then adjusted to quantitatively determine the effects of varying levels of EV share in the passenger vehicles fleet.
Some of the key discoveries from this work are:
  • The total cost of the 1BEV—including the MSRP, maintenance and fuel costs—was 15% higher than the ICEV, while the total cost of the 2BEV was comparable to the ICEV. In addition, both the 1BEV and 2BEV showed significant greenhouse gas emissions reduction compared to the ICEV, as electricity is generated cleanly in Ontario.
  • It was found that 29.8 million CAD per year in economic and social costs are attributed to the air pollution associated with the traffic on Highway 401. Increasing the number of EVs in the fleet showed promising results to lower this cost. With potentially 100% of the passenger vehicles being EVs, the costs associated with air pollution decreased by 44.8%—or down to 16.5 million CAD per year.
  • NOx is the pollutant with the highest associated cost, accounting for 20.2 million CAD per year. However, it was shown that this cost could be drastically reduced when the EV market share increases, down to 10 million CAD per year at 100% EV market penetration. At 8.3 million CAD per year, PM2.5 is the second most costly pollutant. Unlike NOx, the cost of PM2.5 was not reduced significantly by increasing the number of EVs in the fleet, only down to 6.2 million CAD per year at 100% EV market penetration.

Author Contributions

Conceptualization, S.S. and M.F.; methodology, S.S., M.-K.T., E.S. and M.L.; formal analysis, S.S. and M.-K.T.; writing—original draft preparation, S.S. and M.-K.T.; writing—review and editing, R.V., D.W. and M.L.; visualization, R.V., D.W. and M.L.; supervision, M.F. All authors have read and agreed to the published version of the manuscript.

Funding

Canada Research Chair Tier I - Zero Emission Vehicles and Hydrogen Energy Systems Grant number: 950-232215; and The Natural Sciences and Engineering Research Council of Canada (NSERC), Discovery Grants Program, RGPIN-2020-04149.

Acknowledgments

This work was supported by equipment and manpower from the Department of Chemical Engineering at the University of Waterloo. Special thanks to Danielle Skeba for the contribution in editing the paper.

Conflicts of Interest

The authors declare no conflict of interest.

Abbreviations

1BEVpowertrain with 1 battery pack
2BEVpowertrain with 2 battery packs
AADTannual average daily traffic
AERMODAMS/EPA regulatory model
BTSBureau of Transportation Services
CAACanadian Automobile Association
CPIconsumer price index
EPAEnvironmental Protection Agency
ESSenergy storage system
EVelectric vehicle
FPLGfree-piston linear generator
GHGgreenhouse gas
ICEinternal combustion engine
ICEVinternal combustion engine vehicle
IPCCinternational panel on climate change
Li-ionlithium-ion
MGTmicro gas turbine
MOVESmotor emissions vehicle simulator
MSRPmanufacturer’s suggested retail price
MTOOntario Ministry of Transportation
PMparticulate matter
TRAQStransportation air quality system
VOCvolatile organic compound
Zn–airzinc–air

Appendix A

Table A1. Data for Figure 6 (tons/year).
EV%NOxPM2.5SO2VOCs
0%23661989959
20%21291888800
40%18911786641
60%16521685482
80%14141583323
100%11751482165
Table A2. Data for Figure 7 (CAD/year).
EV%NOxPM2.5SO2VOCsTotal
0%$20,224,568$8,292,042$84,447$1,210,258$29,811,315
20%$18,198,692$7,873,252$75,064$1,009,600$27,156,608
40%$16,164,268$7,454,462$56,298$808,942$24,483,970
60%$14,121,296$7,035,672$46,915$608,284$21,812,167
80%$12,086,872$6,616,882$28,149$407,626$19,139,529
100%$10,043,900$6,198,092$18,766$208,230$16,468,988

References

  1. IPCC. Global Warming of 1.5 °C. 2018. Available online: https://www.ipcc.ch/sr15/ (accessed on 25 July 2019).
  2. IPCC. Climate Change 2014: Synthesis Report. 2014. Available online: https://www.ipcc.ch/site/assets/uploads/2018/05/SYR_AR5_FINAL_full_wcover.pdf (accessed on 25 July 2019).
  3. Clean Energy Canada, David Suzuki Foundation, Environmental Defence, Équiterre and the Pembina Institute. Reducing GHG Emissions in Canada’s Transportation Sector. 2016. Available online: https://www.equiterre.org/sites/fichiers/fmm_transportation_recs.pdf (accessed on 30 July 2019).
  4. Tran, M.-K.; Fowler, M. Sensor Fault Detection and Isolation for Degrading Lithium-Ion Batteries in Electric Vehicles Using Parameter Estimation with Recursive Least Squares. Batteries 2020, 6, 1. [Google Scholar] [CrossRef] [Green Version]
  5. Tran, M.-K.; Fowler, M. A Review of Lithium-Ion Battery Fault Diagnostic Algorithms: Current Progress and Future Challenges. Algorithms 2020, 13, 62. [Google Scholar] [CrossRef] [Green Version]
  6. Buekers, J.; Van Holderbeke, M.; Bierkens, J.; Panis, L.I. Health and environmental benefits related to electric vehicle introduction in EU countries. Transp. Res. Part D Transp. Environ. 2014, 33, 26–38. [Google Scholar] [CrossRef]
  7. Nealer, R.; Reichmuth, D.; Anair, D. Cleaner Cars from Cradle to Grave: How Electric Cars Beat Gasoline Cars on Lifetime Global Warming Emissions. 2015. Available online: https://www.ucsusa.org/sites/default/files/attach/2015/11/Cleaner-Cars-from-Cradleto-Grave-full-report.pdf (accessed on 26 July 2019).
  8. Tessum, C.W.; Hill, J.D.; Marshall, J.D. Life cycle air quality impacts of conventional and alternative light-duty transportation in the United States. Proc. Natl. Acad. Sci. USA 2014, 111, 18490–18495. [Google Scholar] [CrossRef] [PubMed] [Green Version]
  9. Hajebrahimi, A.; Kamwa, I.; Huneault, M. A novel approach for plug-in electric vehicle planning and electricity load management in presence of a clean disruptive technology. Energy 2018, 158, 975–985. [Google Scholar] [CrossRef]
  10. Haustein, S.; Jensen, A.F. Factors of electric vehicle adoption: A comparison of conventional and electric car users based on an extended theory of planned behavior. Int. J. Sustain. Transp. 2018, 12, 484–496. [Google Scholar] [CrossRef] [Green Version]
  11. Berkeley, N.; Jarvis, D.; Jones, A. Analysing the take up of battery electric vehicles: An investigation of barriers amongst drivers in the UK. Transp. Res. Part D Transp. Environ. 2018, 63, 466–481. [Google Scholar] [CrossRef]
  12. Husain, I. Electric and Hybrid Vehicles Design Fundamentals, 2nd ed.; CRC Press Taylor & Francis Group: Boca Raton, FL, USA, 2011. [Google Scholar]
  13. Bassett, M.D.; Hall, J.; Cains, T.; Taylor, G.; Warth, M.; Vogler, C. The development of a range extended electric vehicle demonstrator. SAE Technical Paper 2013. [Google Scholar] [CrossRef]
  14. Martin, N. Application of the internal combustion engine as a range-extender for electric vehicles. Combust. Engines 2013, 154, 781–786. [Google Scholar]
  15. Jensen, H.C.; Schaltz, E.; Koustrup, P.; Andrasen, S.; Kær, S. Evaluation of Fuel-Cell Range Extender Impact on Hybrid Electrical Vehicle Performance. IEEE Trans. Veh. Technol. 2013, 62, 50–60. [Google Scholar] [CrossRef]
  16. Virsik, R.; Heron, A. Free piston linear generator in comparison to other range-extender technologies. World Electr. Veh. J. 2013, 6, 426–432. [Google Scholar] [CrossRef] [Green Version]
  17. Shah, R.M.B.R.A.; McGordon, A.; Amor-Segan, M. Micro Gas Turbine range extender—Validation techniques for automotive applications. In Proceedings of the IET Hybrid and Electric Vehicles Conference 2013, London, UK; 6–7 November 2013. [Google Scholar]
  18. Sherman, S.B.; Cano, Z.P.; Fowler, M.; Chen, Z. Range-extending Zinc-air battery for electric vehicle. AIMS Energy 2018, 6, 121–145. [Google Scholar] [CrossRef]
  19. Fu, J.; Cano, Z.P.; Park, M.G.; Yu, A.; Fowler, M.; Chen, Z. Electrically Rechargeable Zinc-Air Batteries: Progress, Challenges, and Perspectives. Adv. Mater. 2017, 29, 1604685. [Google Scholar] [CrossRef] [PubMed]
  20. Wang, C.; Xie, Z.; Zhou, Z. Lithium-air batteries: Challenges coexist with opportunities. APL Mater. 2019, 7, 40701. [Google Scholar] [CrossRef]
  21. Mainar, A.R.; Iruin, E.; Colmenares, L.C.; Kvasha, A.; de Meatza, I.; Bengoechea, M.; Leanet, O.; Boyano, I.; Zhang, Z.; Blazquez, J.A. An overview of progress in electrolytes for secondary zinc-air batteries and other storage based on zinc. J. Energy Storage 2018, 15, 304–308. [Google Scholar] [CrossRef]
  22. An Overview of Costs for Vehicle Components, Fuels, Greenhouse Gas Emissions and Total Cost of Ownership Update 2017. Available online: https://www.semanticscholar.org/paper/An-Overview-of-Costs-for-Vehicle-Components-%2C-Fuels-Friesa-Kerlera/3dfd84187b7192d7ab6a1e71afd6dd5cc3621345 (accessed on 26 June 2020).
  23. CAA. Driving Costs. 2013. Available online: https://www.caa.ca/wp-content/uploads/2016/09/CAA_Driving_Cost_English_2013_web.pdf (accessed on 30 July 2019).
  24. Propfe, B.; Redelbach, M.; Santini, D.; Friedrich, H. Cost analysis of Plug-in Hybrid Electric Vehicles including Maintenance & Repair Costs and Resale Values. World Electr. Veh. J. 2012, 5, 886–895. [Google Scholar]
  25. National Energy Board. Provincial and Territorial Energy Profiles-Ontario. 2018. Available online: https://www.cer-rec.gc.ca/nrg/ntgrtd/mrkt/nrgsstmprfls/on-eng.html (accessed on 26 July 2019).
  26. Requia, W.J.; Mohamed, M.; Higgins, C.D.; Arain, A.; Ferguson, M. How clean are electric vehicles? Evidence-based review of the effects of electric mobility on air pollutants, greenhouse gas emissions and human health. Atmos. Environ. 2018, 185, 64–77. [Google Scholar] [CrossRef]
  27. Health Canada. Health Impacts of Air Pollution in Canada. 2017. Available online: http://publications.gc.ca/collections/collection_2018/sc-hc/H144-51-2017-eng.pdf (accessed on 30 July 2019).
  28. Smith, R.; McDougal, K. Costs of pollution in Canada. 2017. Available online: https://www.iisd.org/sites/default/files/publications/costs-of-pollution-in-canada.pdf (accessed on 26 July 2019).
  29. Sawyer, D.; Seton, S.; Welburn, C. Evaluation of Total Cost of Air Pollution Due to Transportation in Canada. 2007. Available online: http://publications.gc.ca/collections/collection_2008/tc/T22-148-2007E.pdf (accessed on 30 July 2019).
  30. Toronto Public Health. Path To Healthier Air: Toronto Air Pollution Burden of Illness Update. Toronto Public Health. 2014. Available online: https://www.toronto.ca/legdocs/mmis/2014/hl/bgrd/backgroundfile-68506.pdf (accessed on 30 July 2019).
  31. Union of Concerned Scientists. Cars, Trucks, Buses and Air Pollution. 2018. Available online: https://www.ucsusa.org/clean-vehicles/vehicles-air-pollution-and-humanhealth/cars-trucks-air-pollution (accessed on 30 July 2019).
  32. Ontario Ministry of Transportation. Provincial Highways Traffic Volumes; Ontario Ministry of Transportation Library: Ottawa, ON, Canada, 2016. [Google Scholar]
  33. Chambers, M.; Schmitt, R. Fact Sheet Diesel-powered Passenger Cars and Light Trucks. 2015. Available online: https://www.bts.gov/sites/bts.dot.gov/files/legacy/DieselFactSheet.pdf (accessed on 30 July 2019).
  34. Transport Canada. Estimates of the Full Cost of Transportation in Canada. 2008. Available online: http://publications.gc.ca/collections/collection_2009/tc/T22-165-2008E.pdf (accessed on 26 July 2019).
  35. Statistics Canada. Consumer Price INDEX, Monthly, Not Seasonally Adjusted; Government of Canada: Ottawa, ON, Canada, 2018.
  36. Li, N.; Chen, J.P.; Tsai, I.C.; He, Q.; Chi, S.Y.; Lin, Y.C.; Fu, T.M. Potential impacts of electric vehicles on air quality in Taiwan. Sci. Total Environ. 2016, 566, 919–928. [Google Scholar] [CrossRef] [PubMed]
Figure 1. Dual-battery powertrain design.
Vehicles 02 00021 g001
Figure 2. Flow chart of the powertrain energy management strategy.
Vehicles 02 00021 g002
Figure 3. Schematic of transportation air quality system (TRAQS) software structure and functions.
Vehicles 02 00021 g003
Figure 4. TRAQS study area—Highway 401 from Kingston Road to Renforth Drive.
Vehicles 02 00021 g004
Figure 5. Air pollution cost estimation methodology.
Vehicles 02 00021 g005
Figure 6. Annual emissions from Highway 401 at different EV penetration levels.
Vehicles 02 00021 g006
Figure 7. Annual cost of emissions from Highway 401 at different EV penetration levels.
Vehicles 02 00021 g007
Table 1. Summary of specifications of different battery packs in the standard one large Li-ion battery pack (1BEV) and proposed powertrain (2BEV).
ParameterUnitsLi-ion Pack (Small) in 2BEVZn–air Pack in 2BEVLi-ion Pack (Large) in 1BEV
Cells per module 15415
Modules in series 7757
Arrays in parallel 22210
Weight per cellg49655.6496
Total cell weightkg104367521
Packaging factor 1.251.251.25
Pack weightkg130459651
Nominal pack voltageV347360347
Pack capacityAh39147196
Pack energykWh13.652.967.9
Maximum SOC 111
Minimum SOC 0.0500.05
Pack costCAD *$3610$9150$18,070
* currency exchange (2019): 1 CAD = 0.7536 USD.
Table 2. Performance and cost comparison between 1BEV and 2BEV.
ParameterUnits2BEV1BEV
Vehicle weightkg20052014
City rangekm383375
Highway rangekm432437
Combined average rangekm405403
City fuel economykWh/100 km21.720.2
Highway fuel economykWh/100 km20.117.4
Combined average fuel economykWh/100 km21.418.8
Battery pack costCAD$12,760$18,070
Zn–air pack maximum lifetimeyears13.2N/A
Time from 0 to 100 km/hs15.0615.23
Table 3. Economic and environmental comparison between the 2BEV, 1BEV and internal combustion engine vehicle (ICEV).
CostUnits2BEV1BEVICEV
Estimated MSRPCAD$26,321$31,625$17,890
Harmonized sales taxCAD$3422$4111$2326
Fuel costCAD/yr$416$373$1686 *
Maintenance costCAD/yr$584$584$720
Combined costCAD$36,680$42,380$36,930
CO2 emissionskg/yr75563354
* based on 7.1 L/100 km.
Table 4. Economic cost per unit pollutant in the years 2000 and 2019.
PollutantCost (2000-dollars)Cost (2019-dollars)
UnitsCAD/tonCAD/ton
NOx$5940$8548
PM2.5$29,100$41,879
SO2$6520$9383
VOCs$877$1262
Table 5. Baseline (0% electric vehicles (EV) share) emissions and costs of pollution from Highway 401.
PollutantTons/yearCAD/tonCAD/year
NOx2366$8548$20,224,568
PM2.5198$41,879$8292,042
SO29.4$9383$84,447
VOCs959$1262$1210,258
Total $29,811,315