
Suitability Assessment of NOx Emissions Measurements with PTI Equipment


Abstract
:1. Introduction
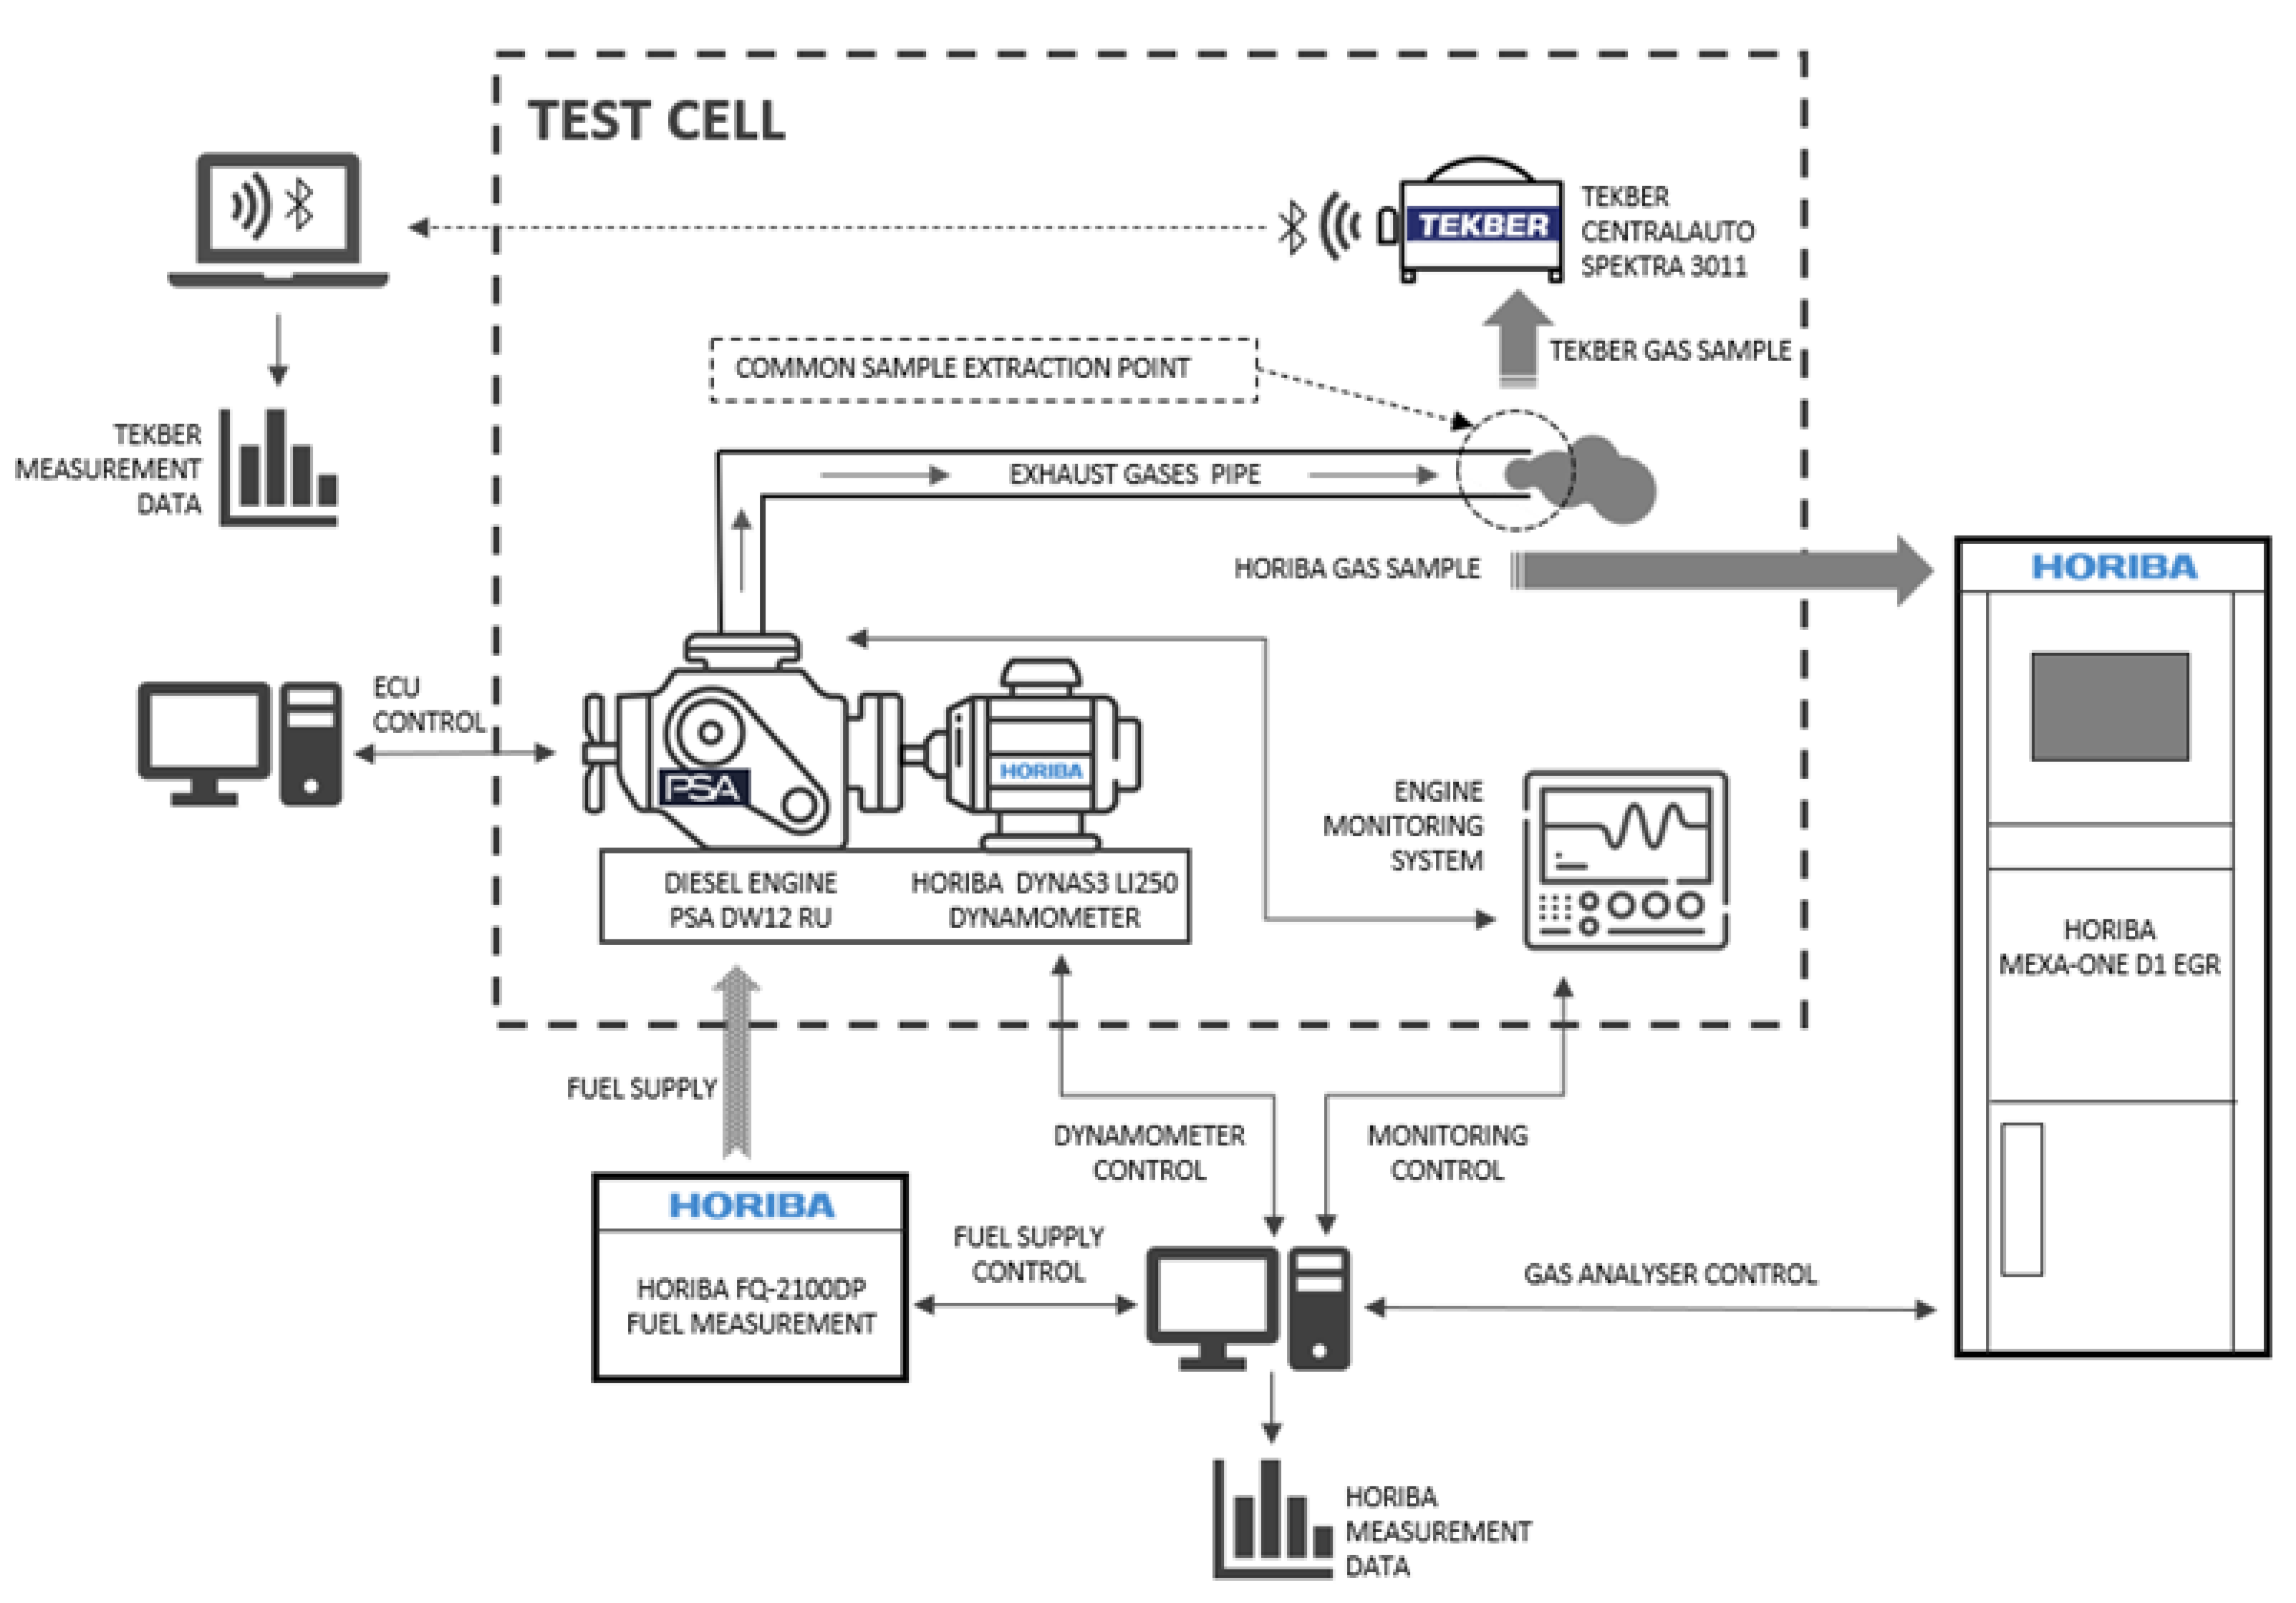
2. Materials and Methods
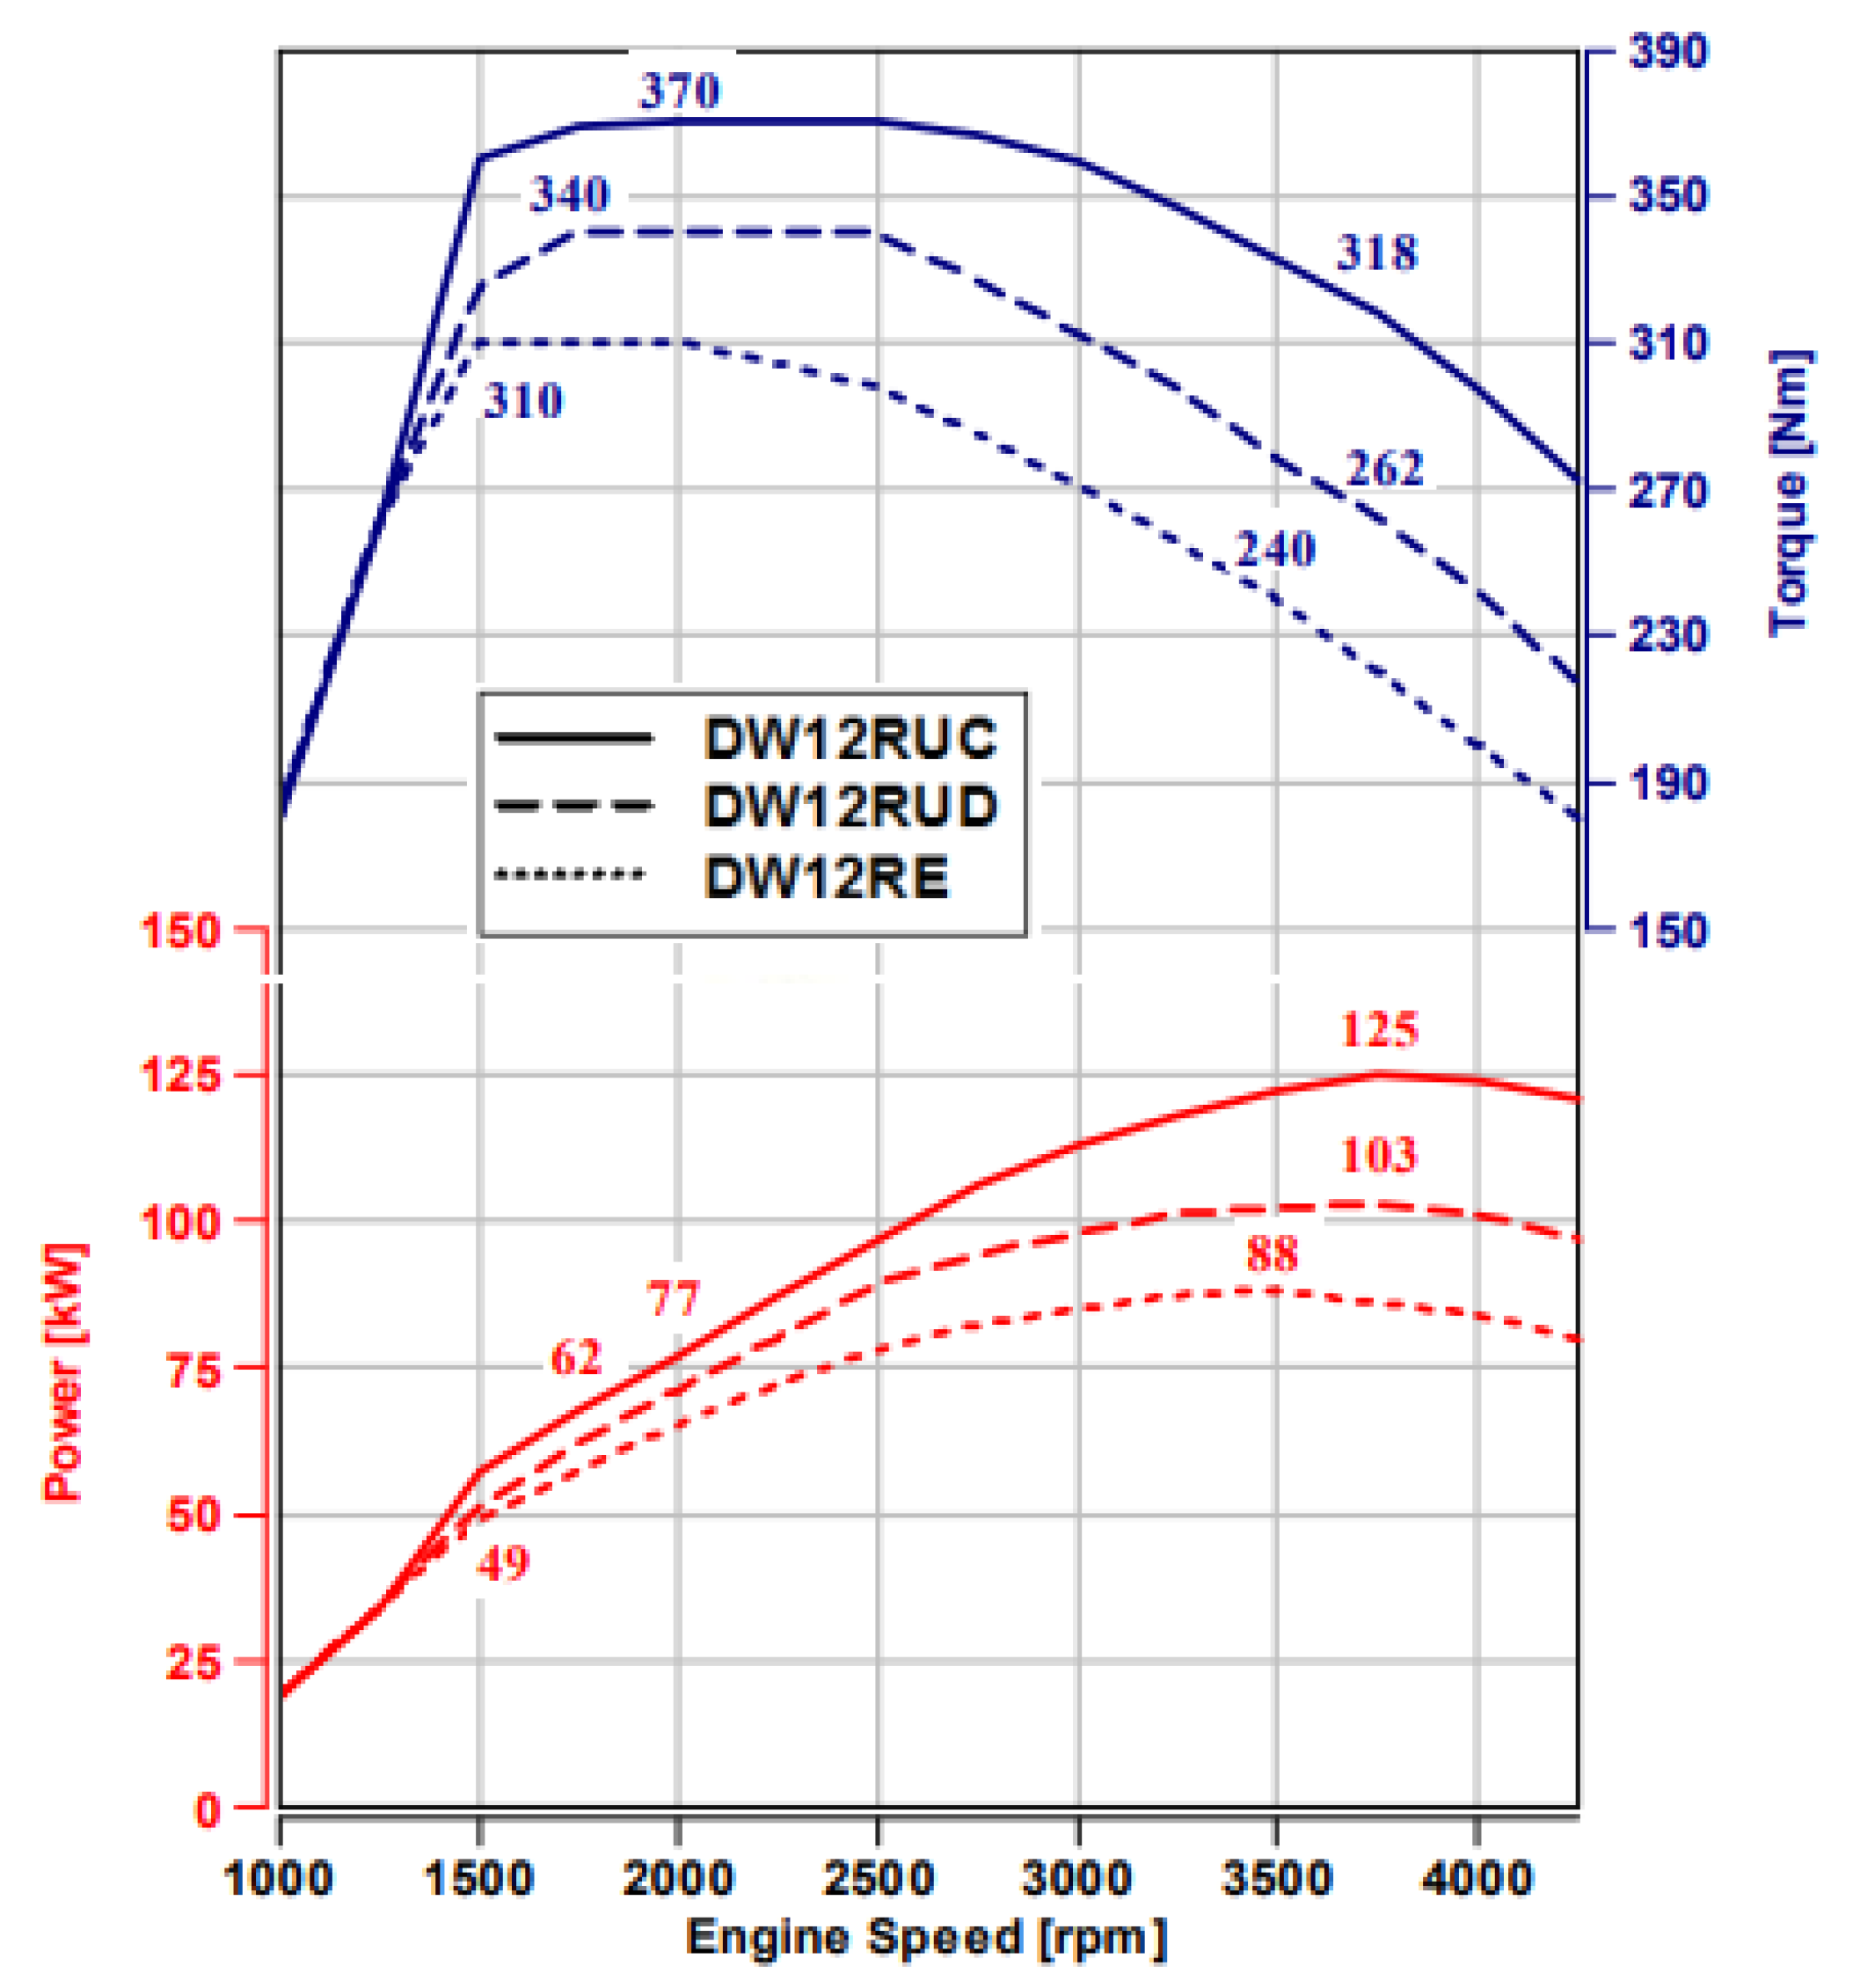
2.1. Diesel Engine
2.2. PTI Gas Analyzer
2.3. Laboratory Gas Analyzer
2.4. Tests Performed
- By modifying the load demand to which the engine is subjected, acting through the dynamometer over the engine.
- By modifying engine operating parameters such as engine speed and allowing or not allowing the EGR to be commanded by the ECU programming (by accessing directly through the ECU).
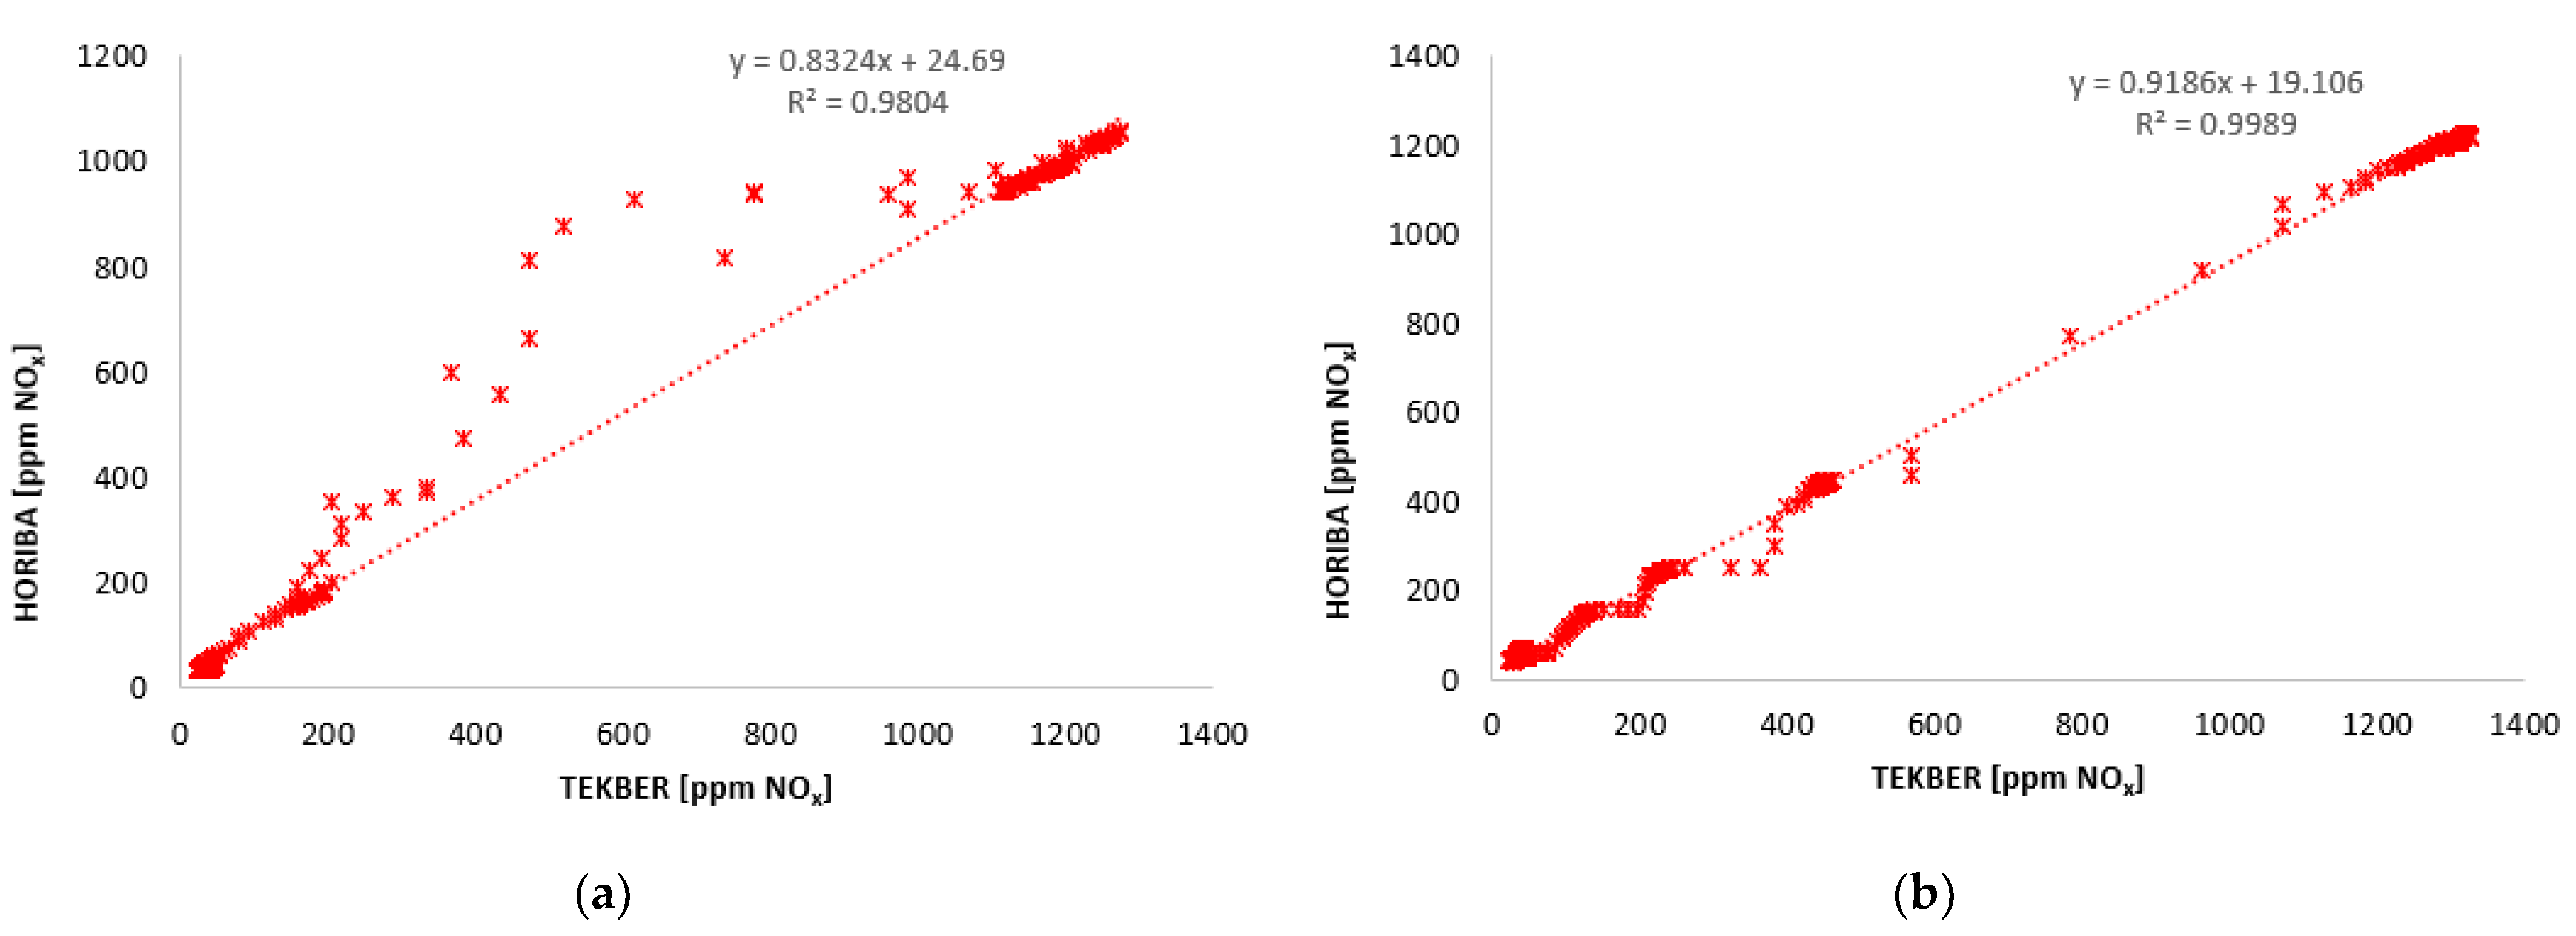
2.5. Equipment Calibration
3. Results
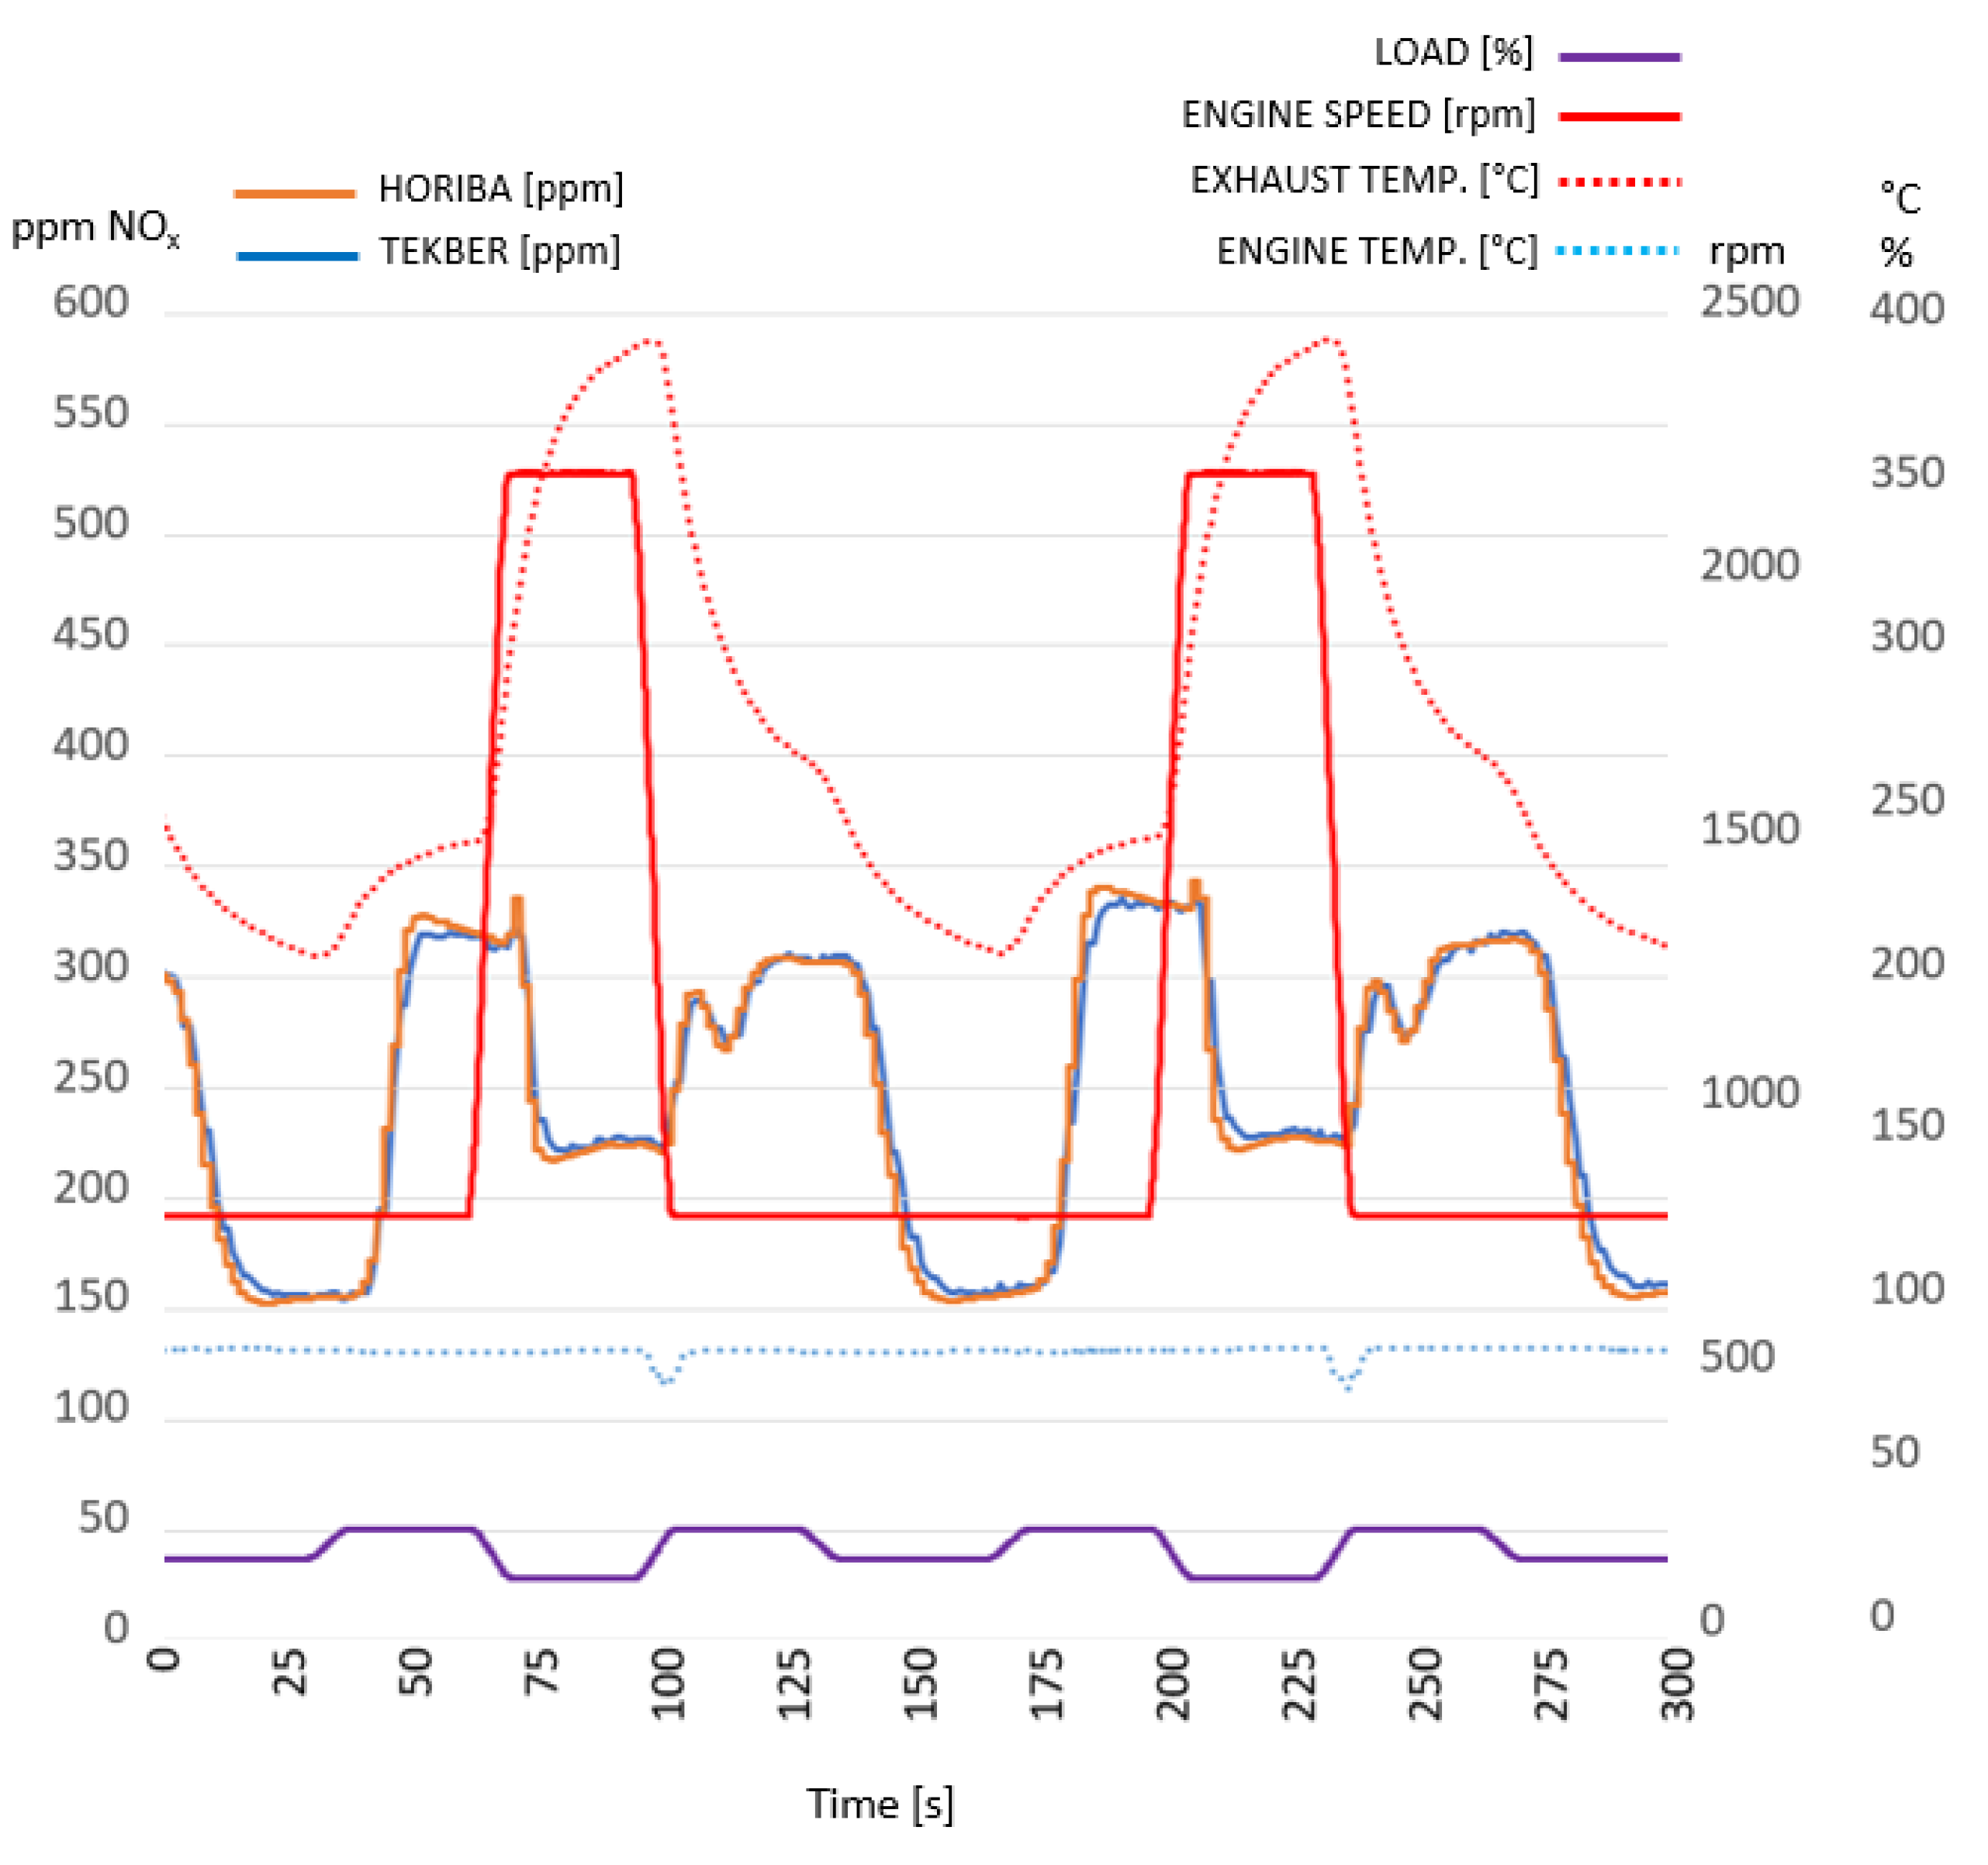
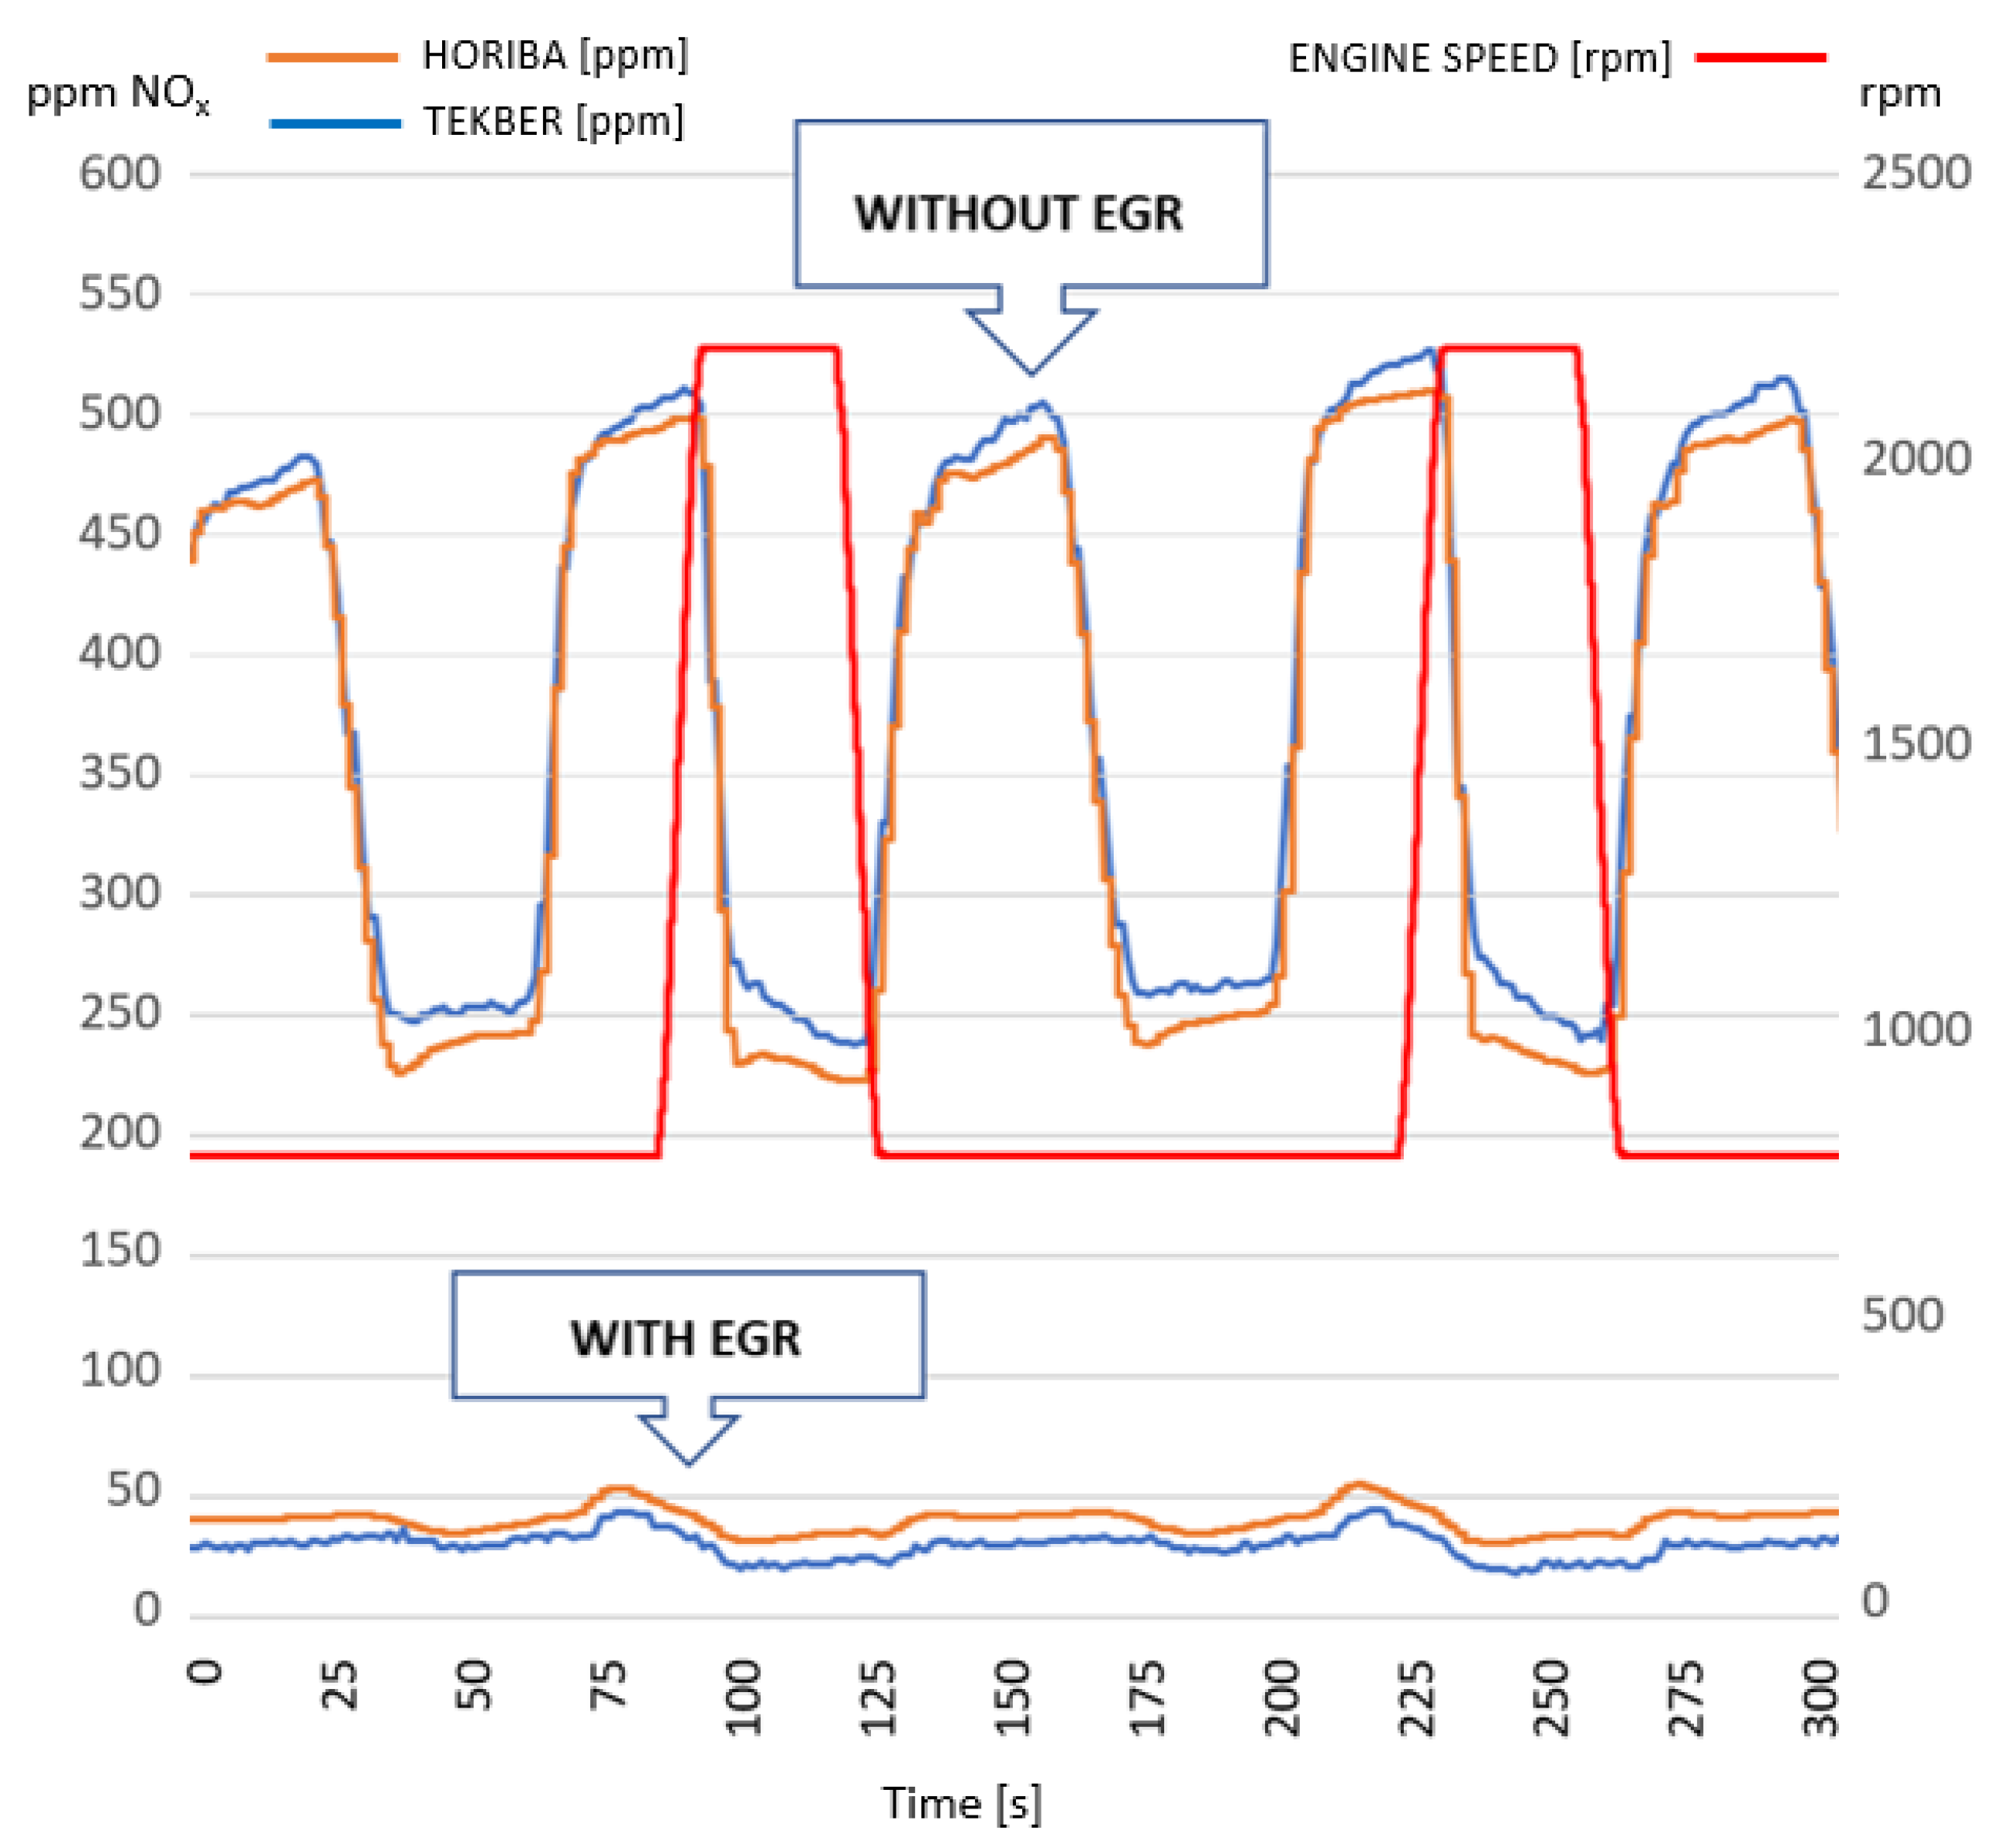
3.1. Results of Static Idling Internal Load Tests
- Static Idling Internal Load Test with EGR, low load condition;
- Static Idling Internal Load Test with EGR, high load condition;
- Static Idling Internal Load Test without EGR, low load condition;
- Static Idling Internal Load Test without EGR, high load condition.
- To check the Tekber gas analyser behaviour in two different situations;
- To check if the Tekber gas analyser can detect that the EGR is not working through the NOx concentration measurements.
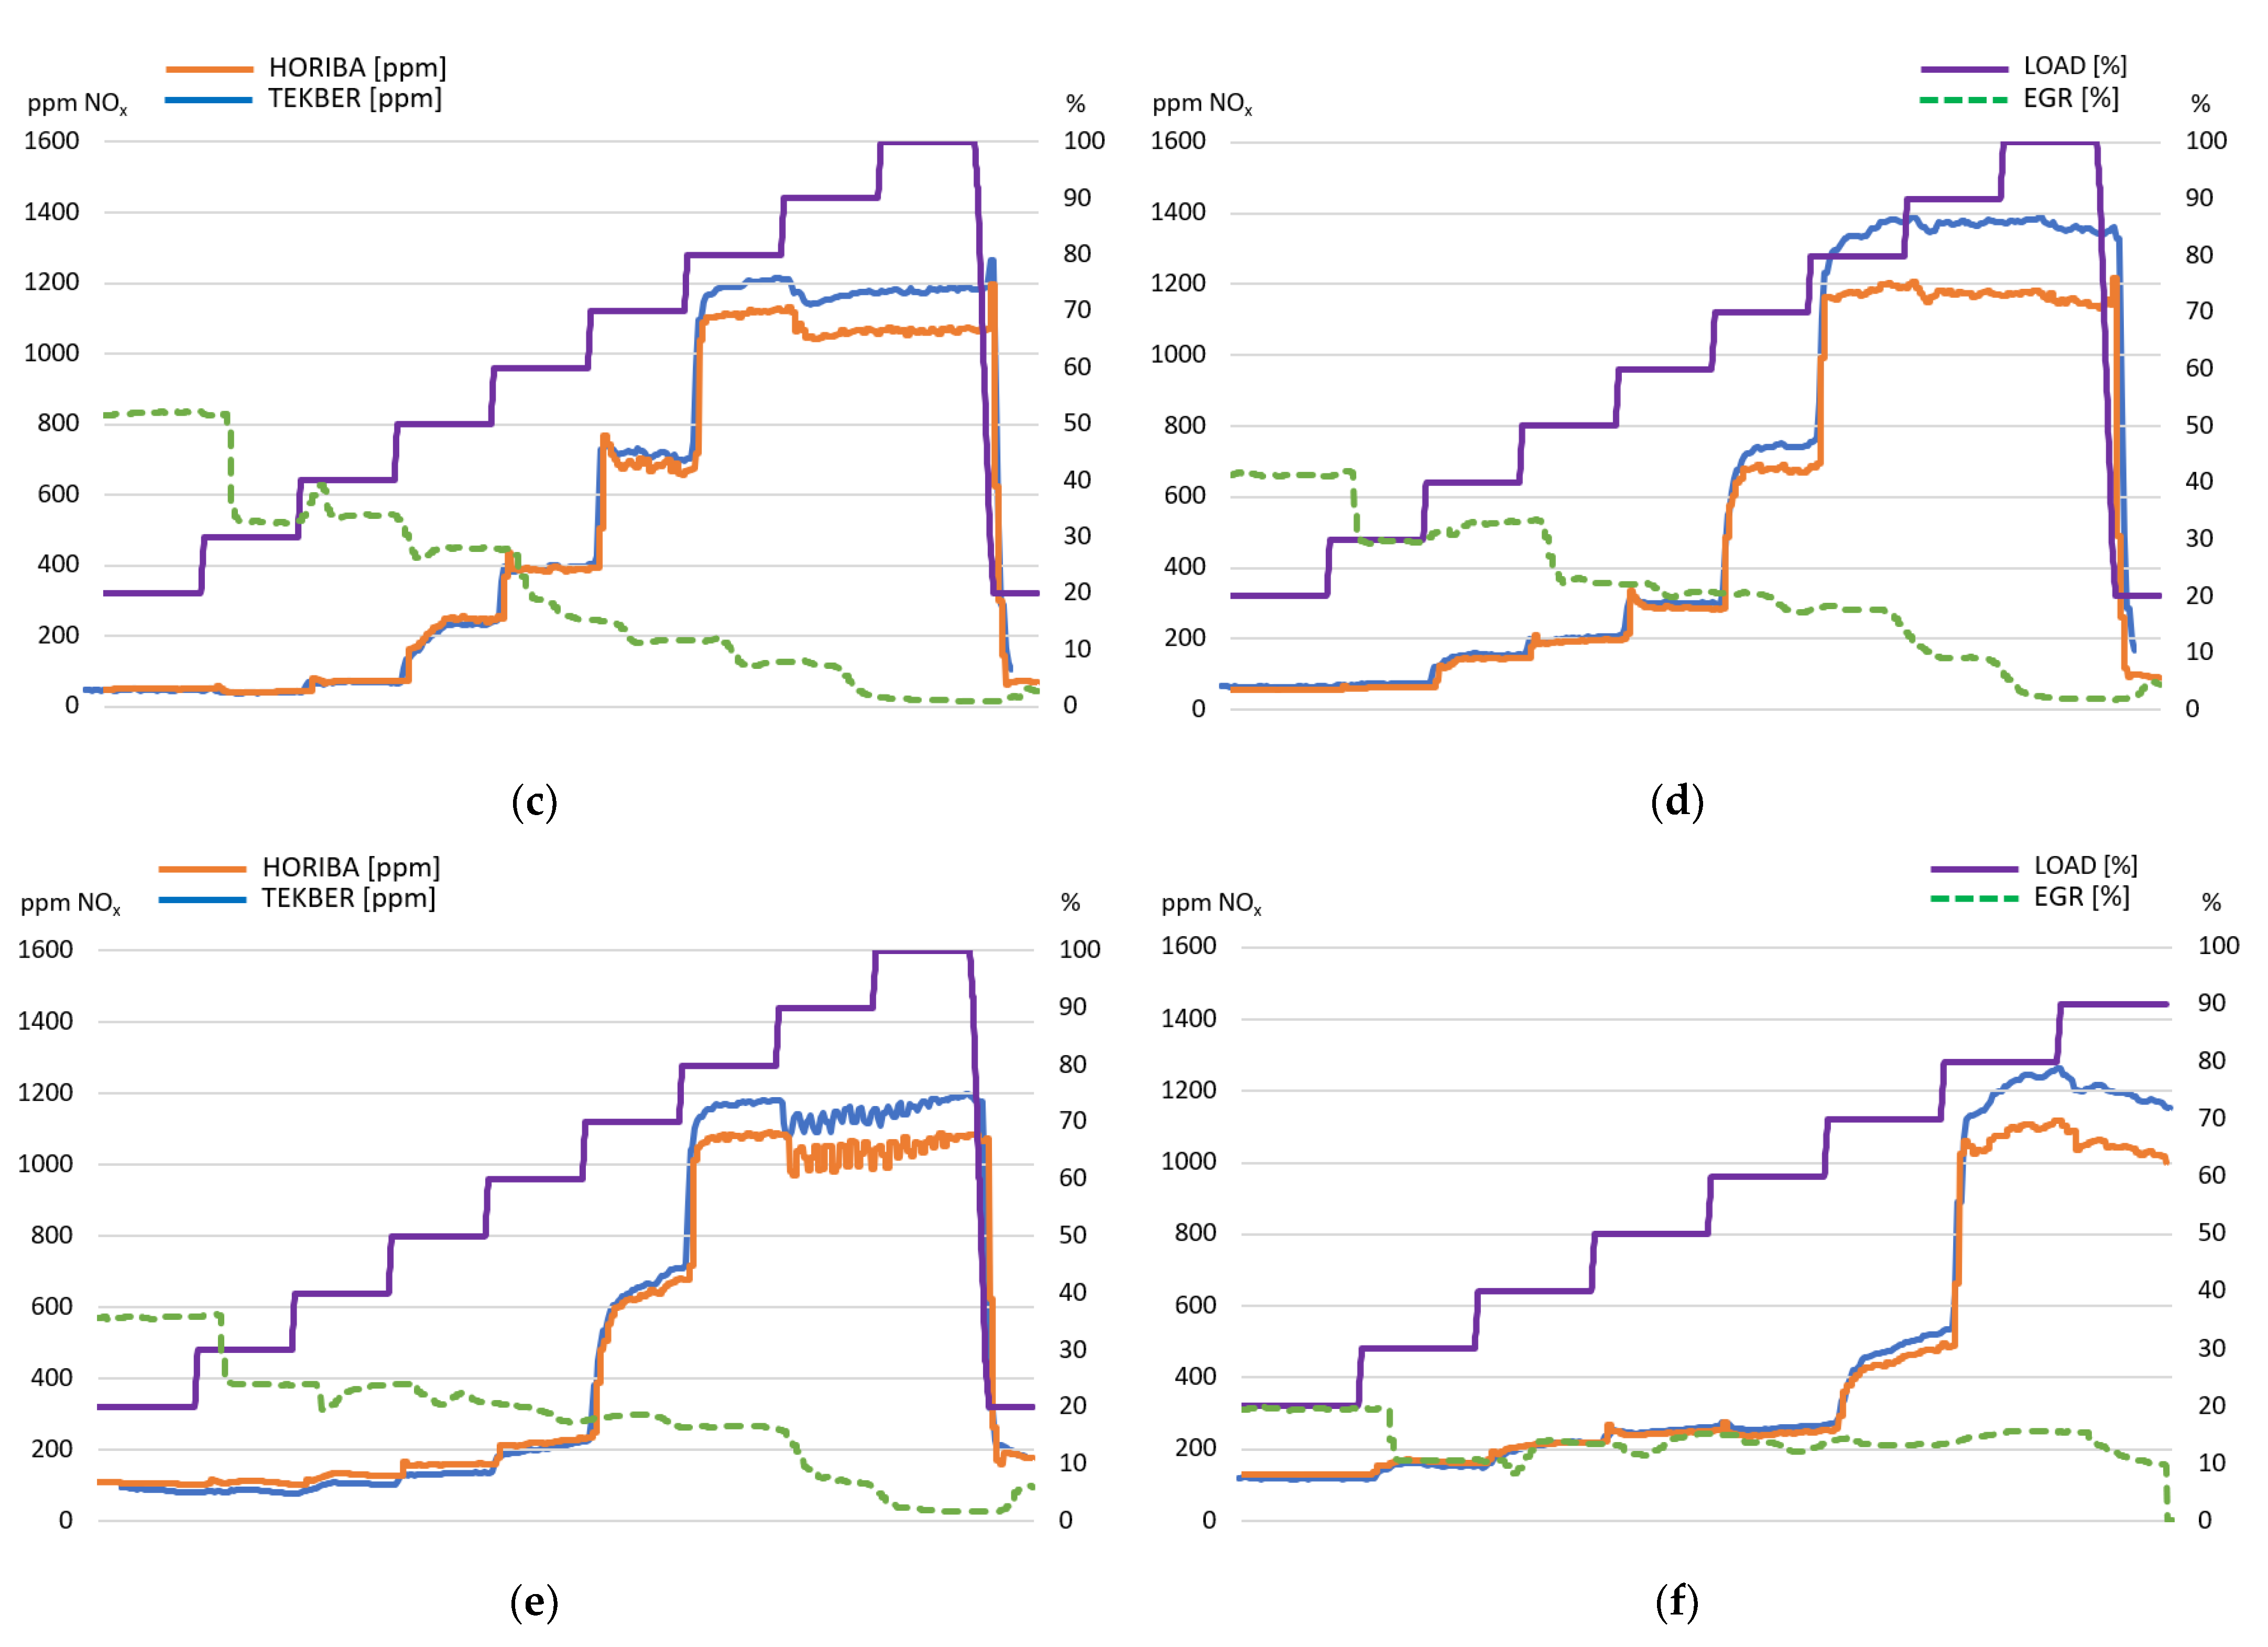
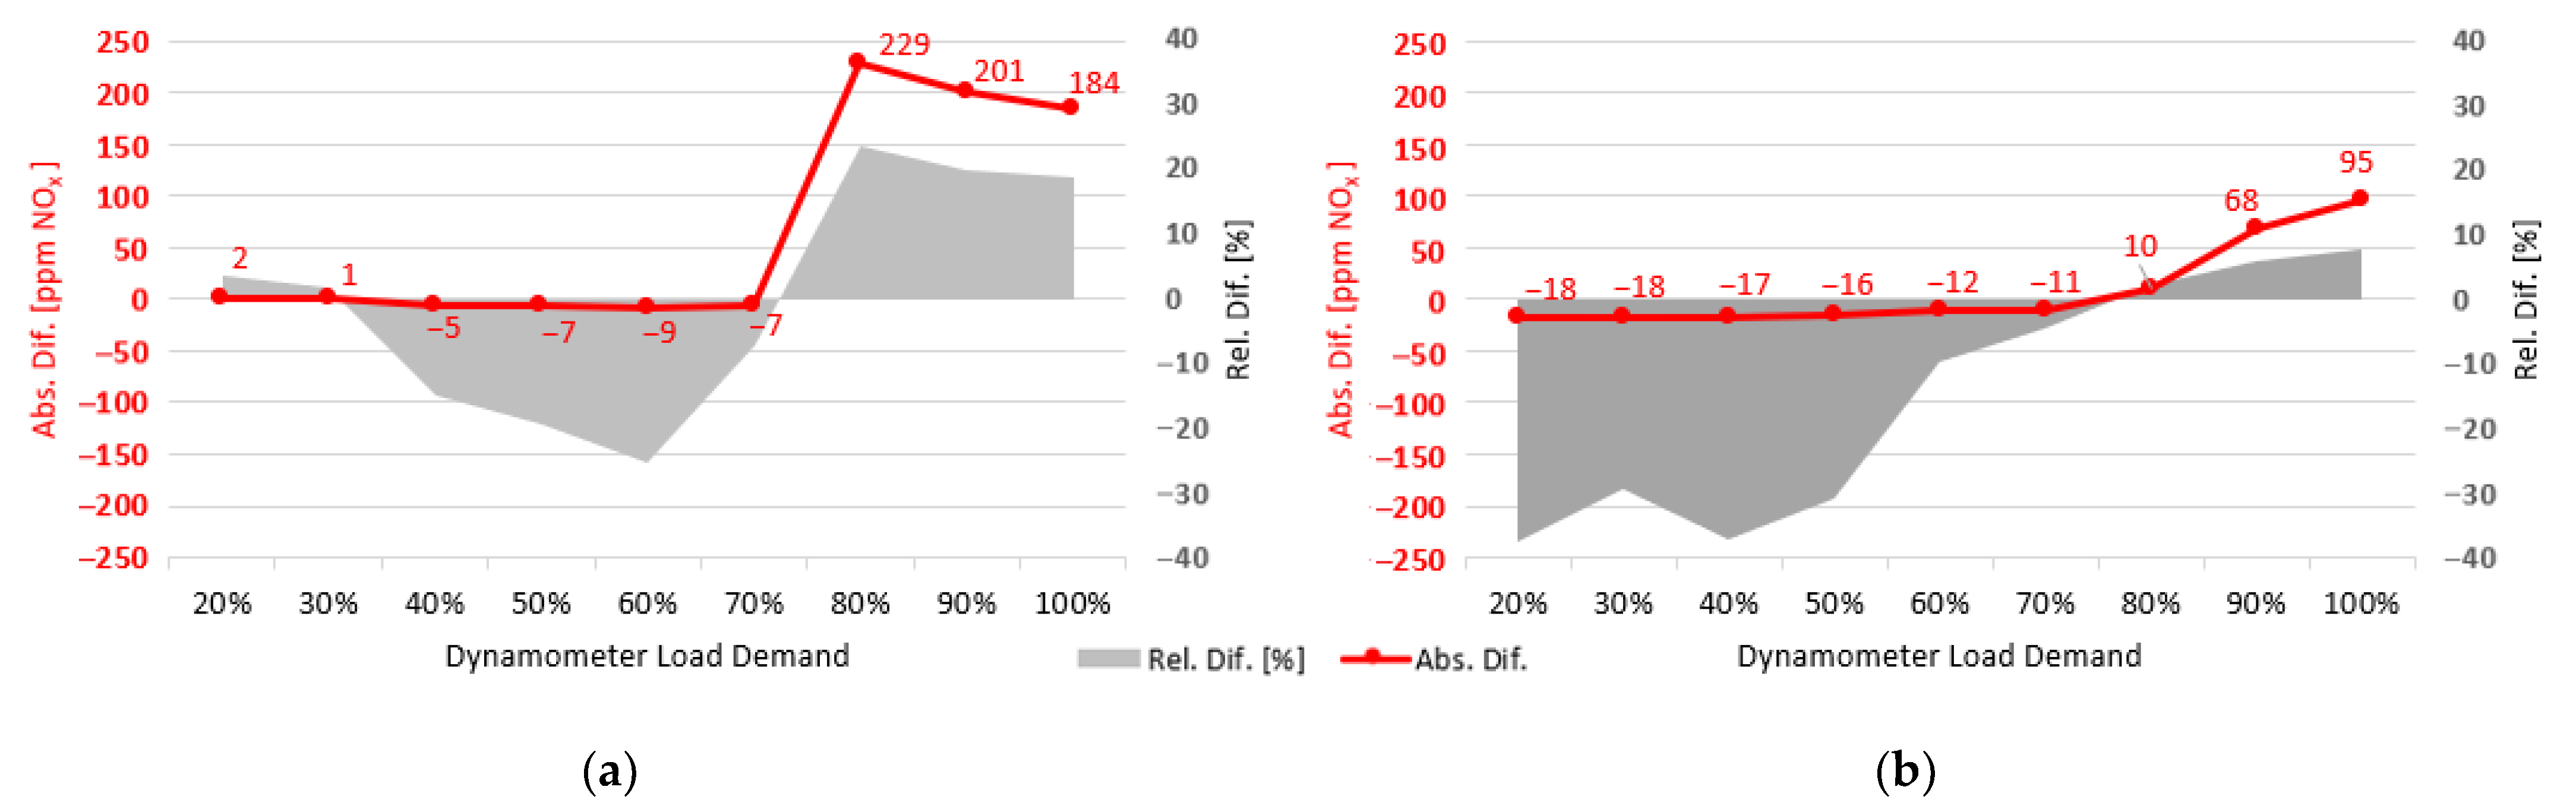
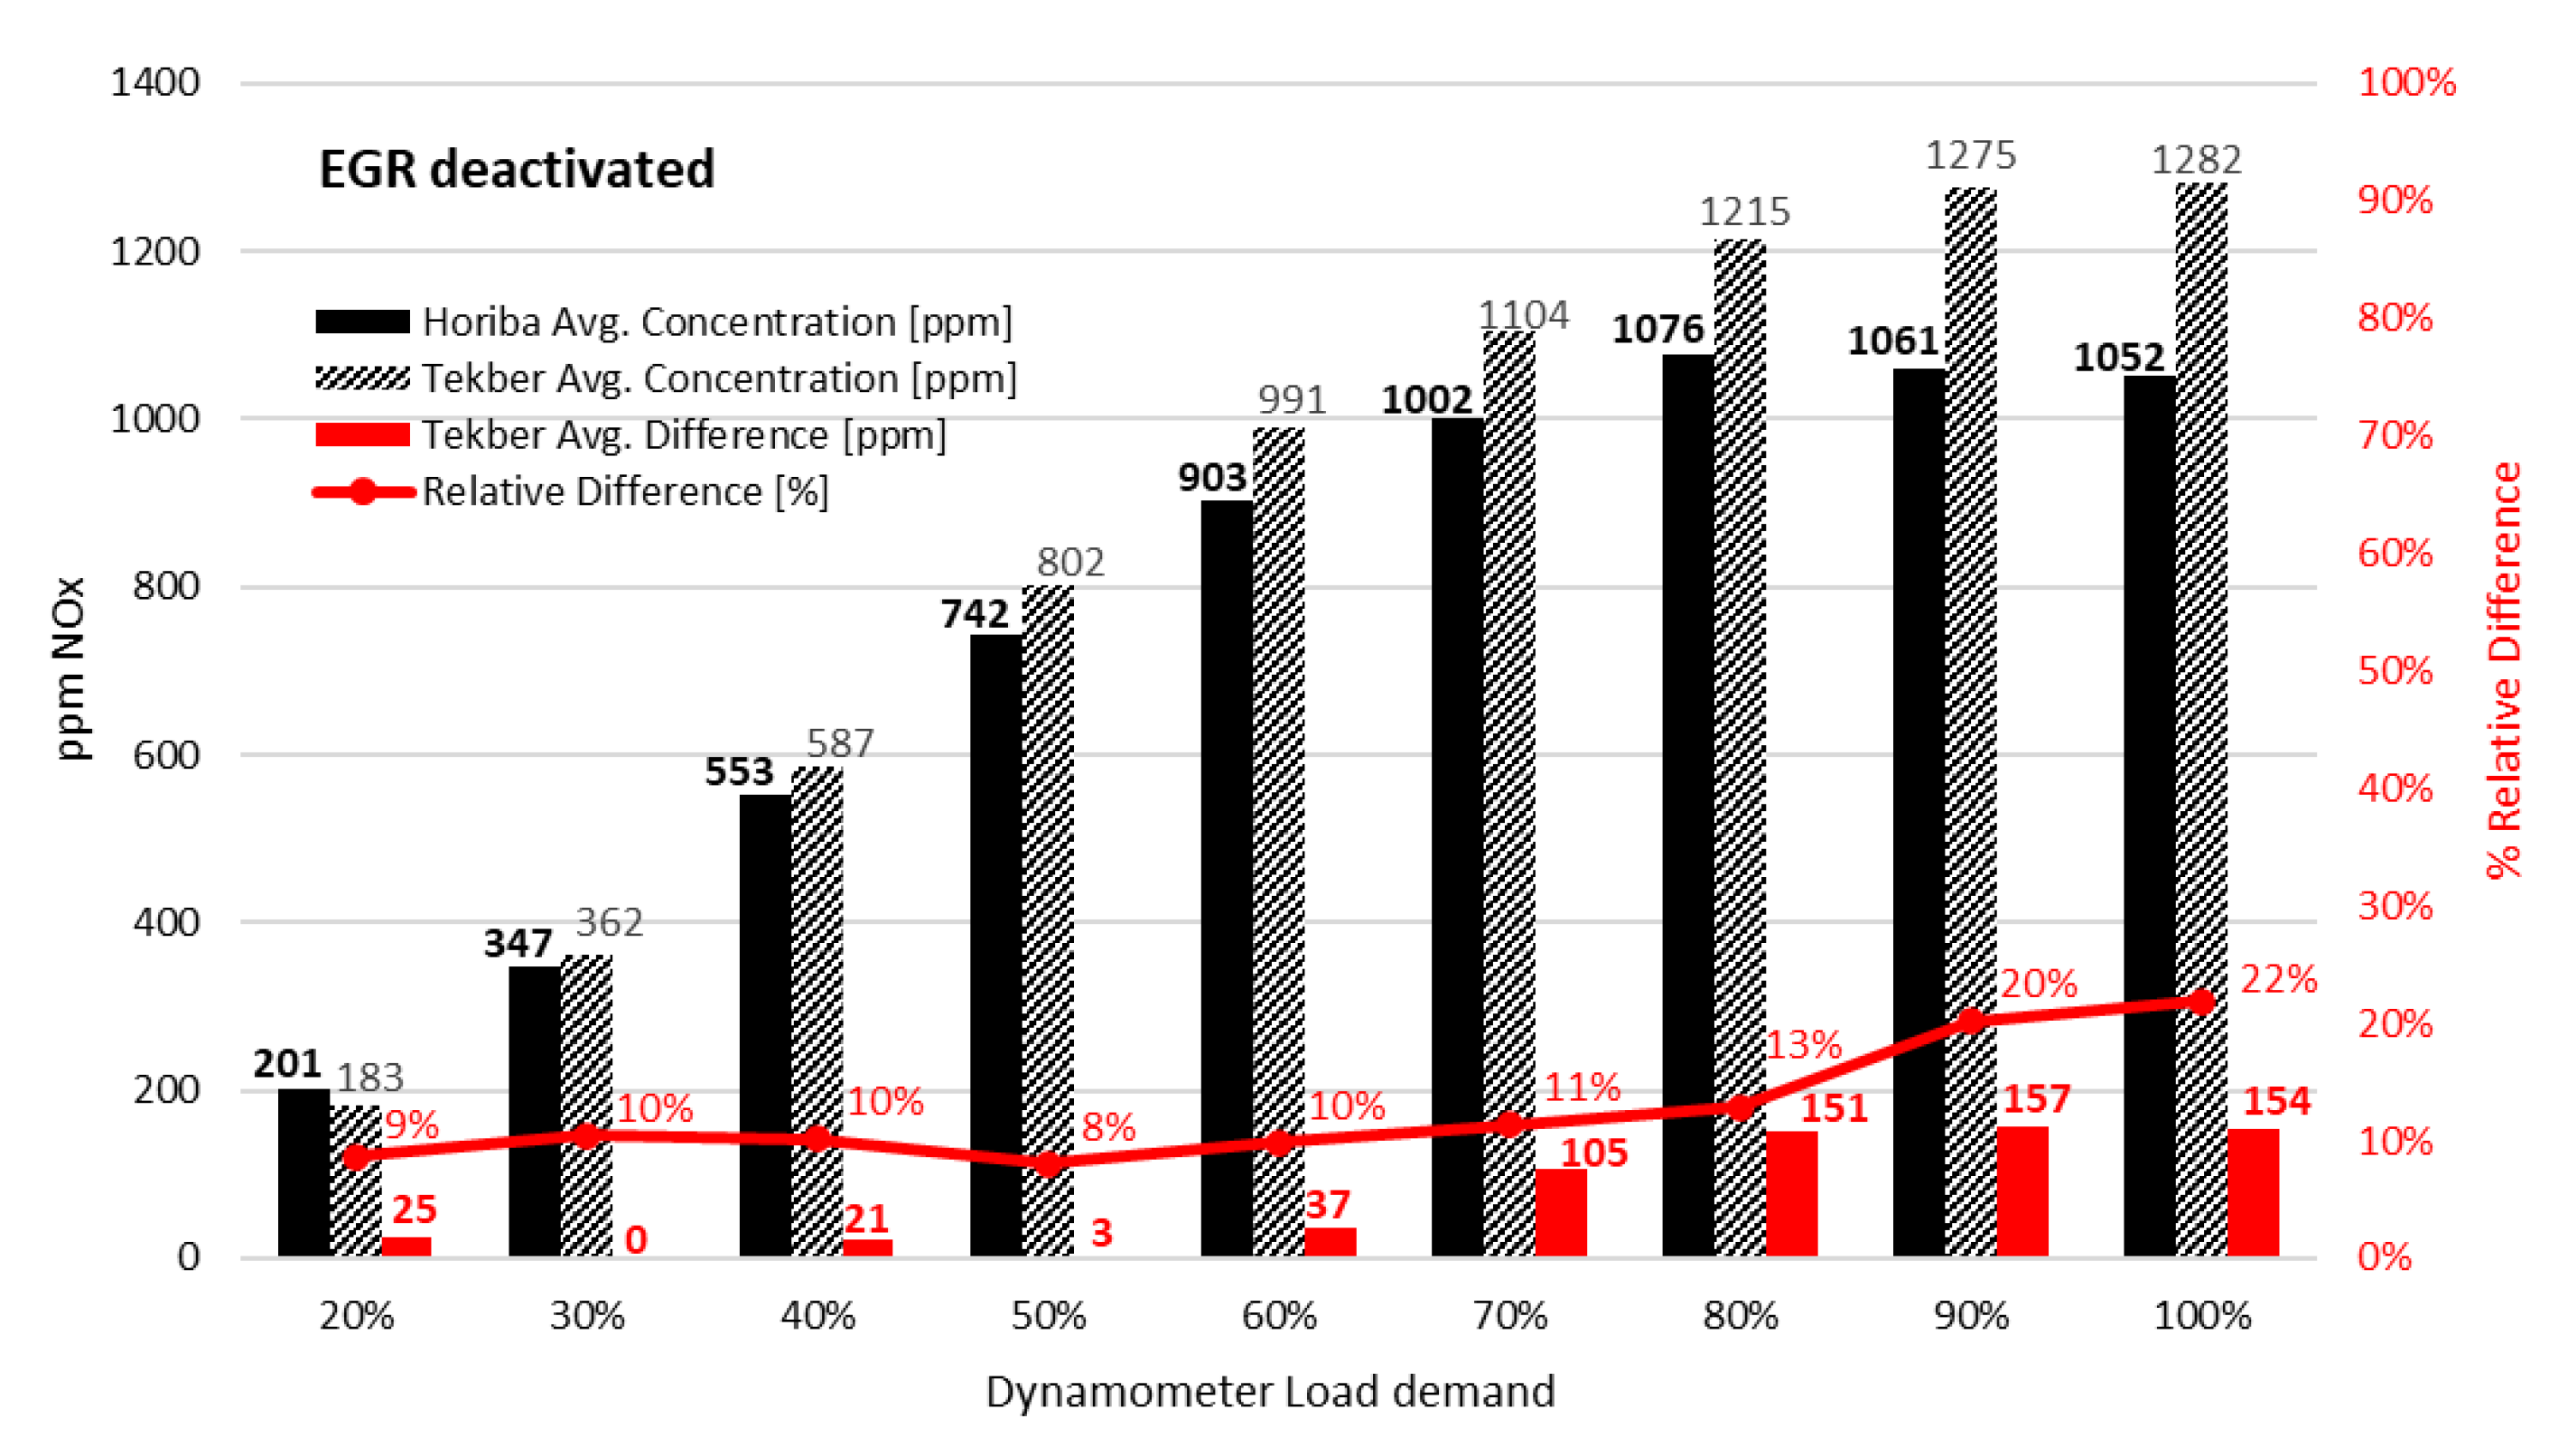
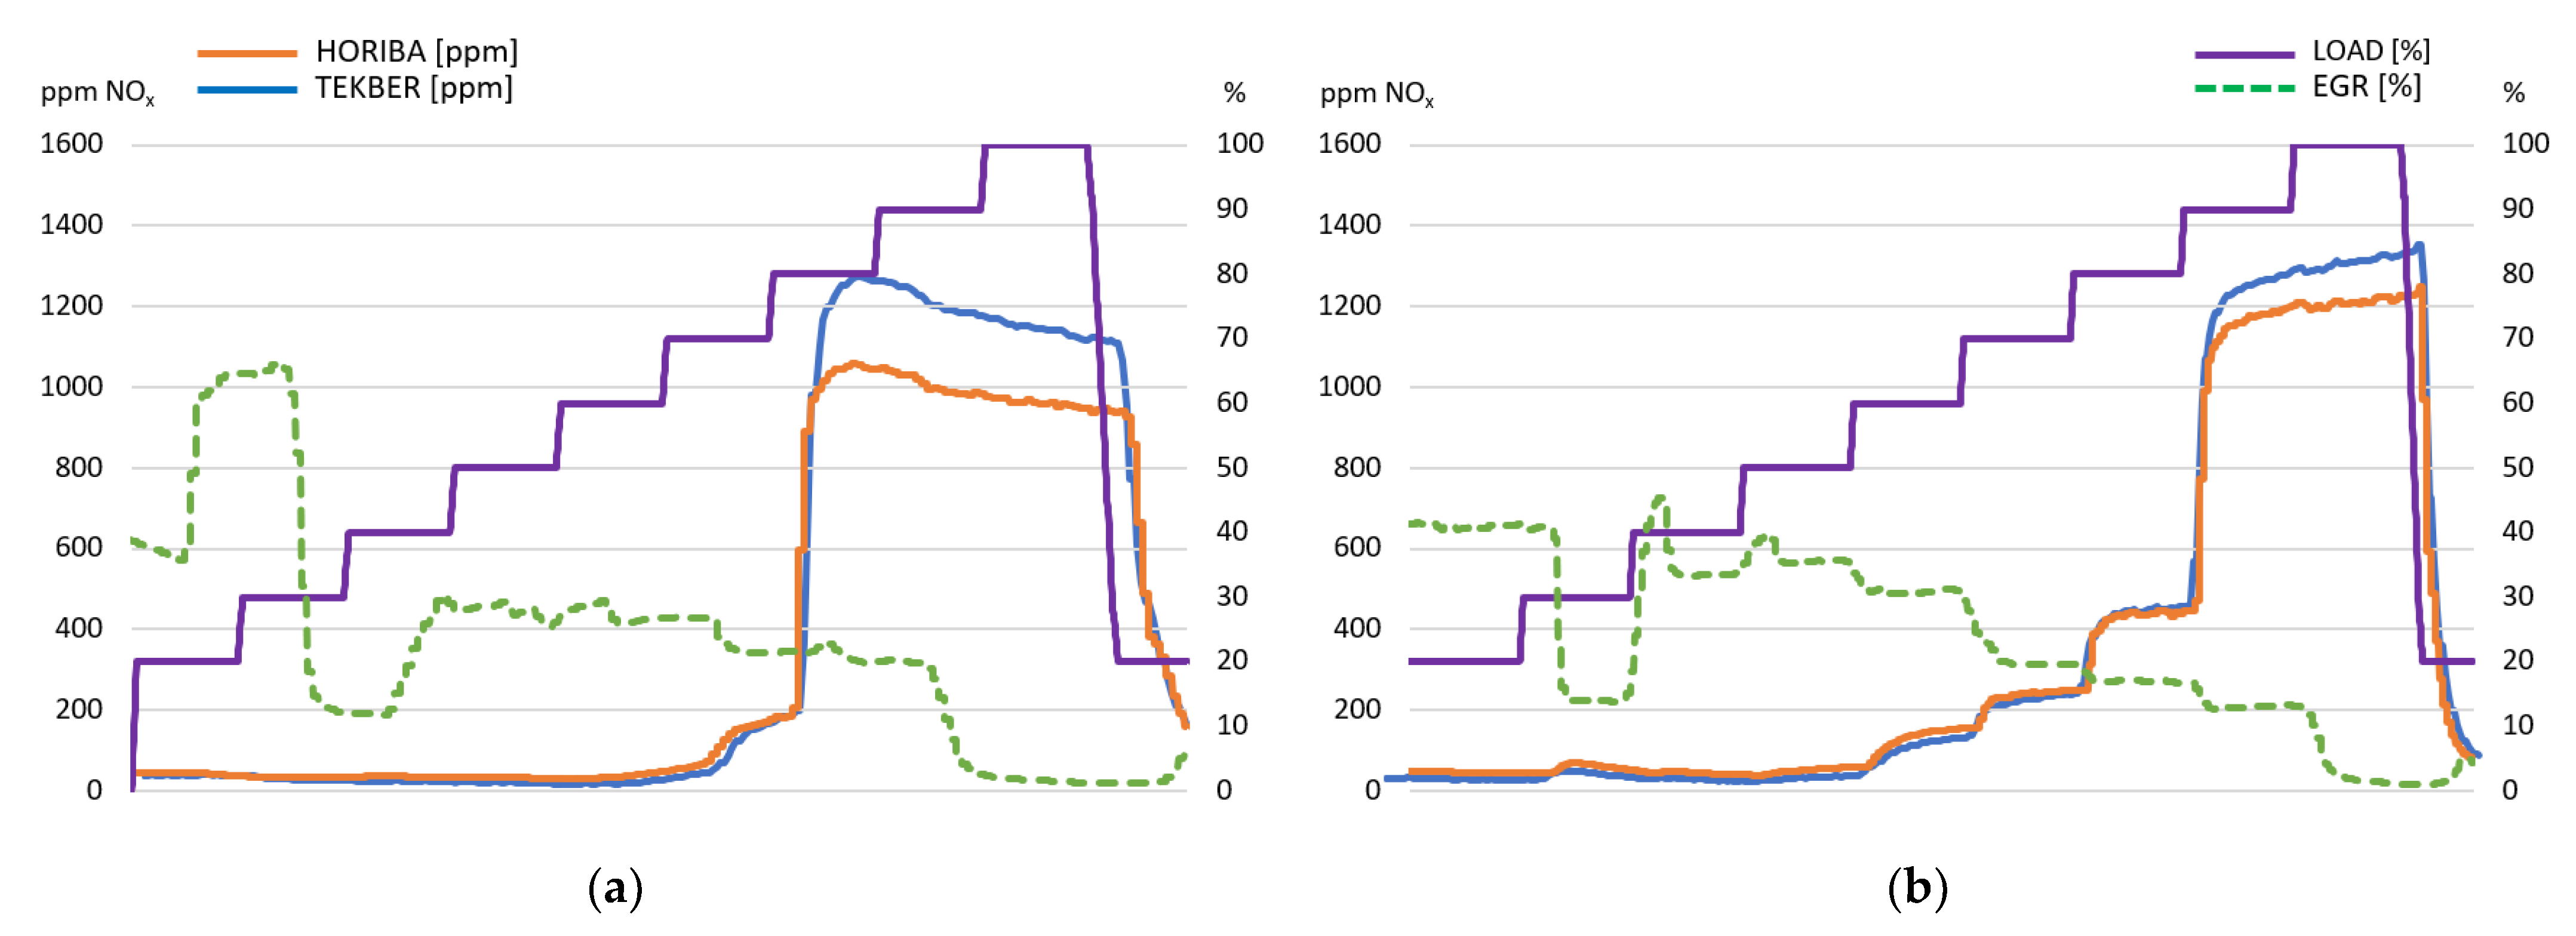
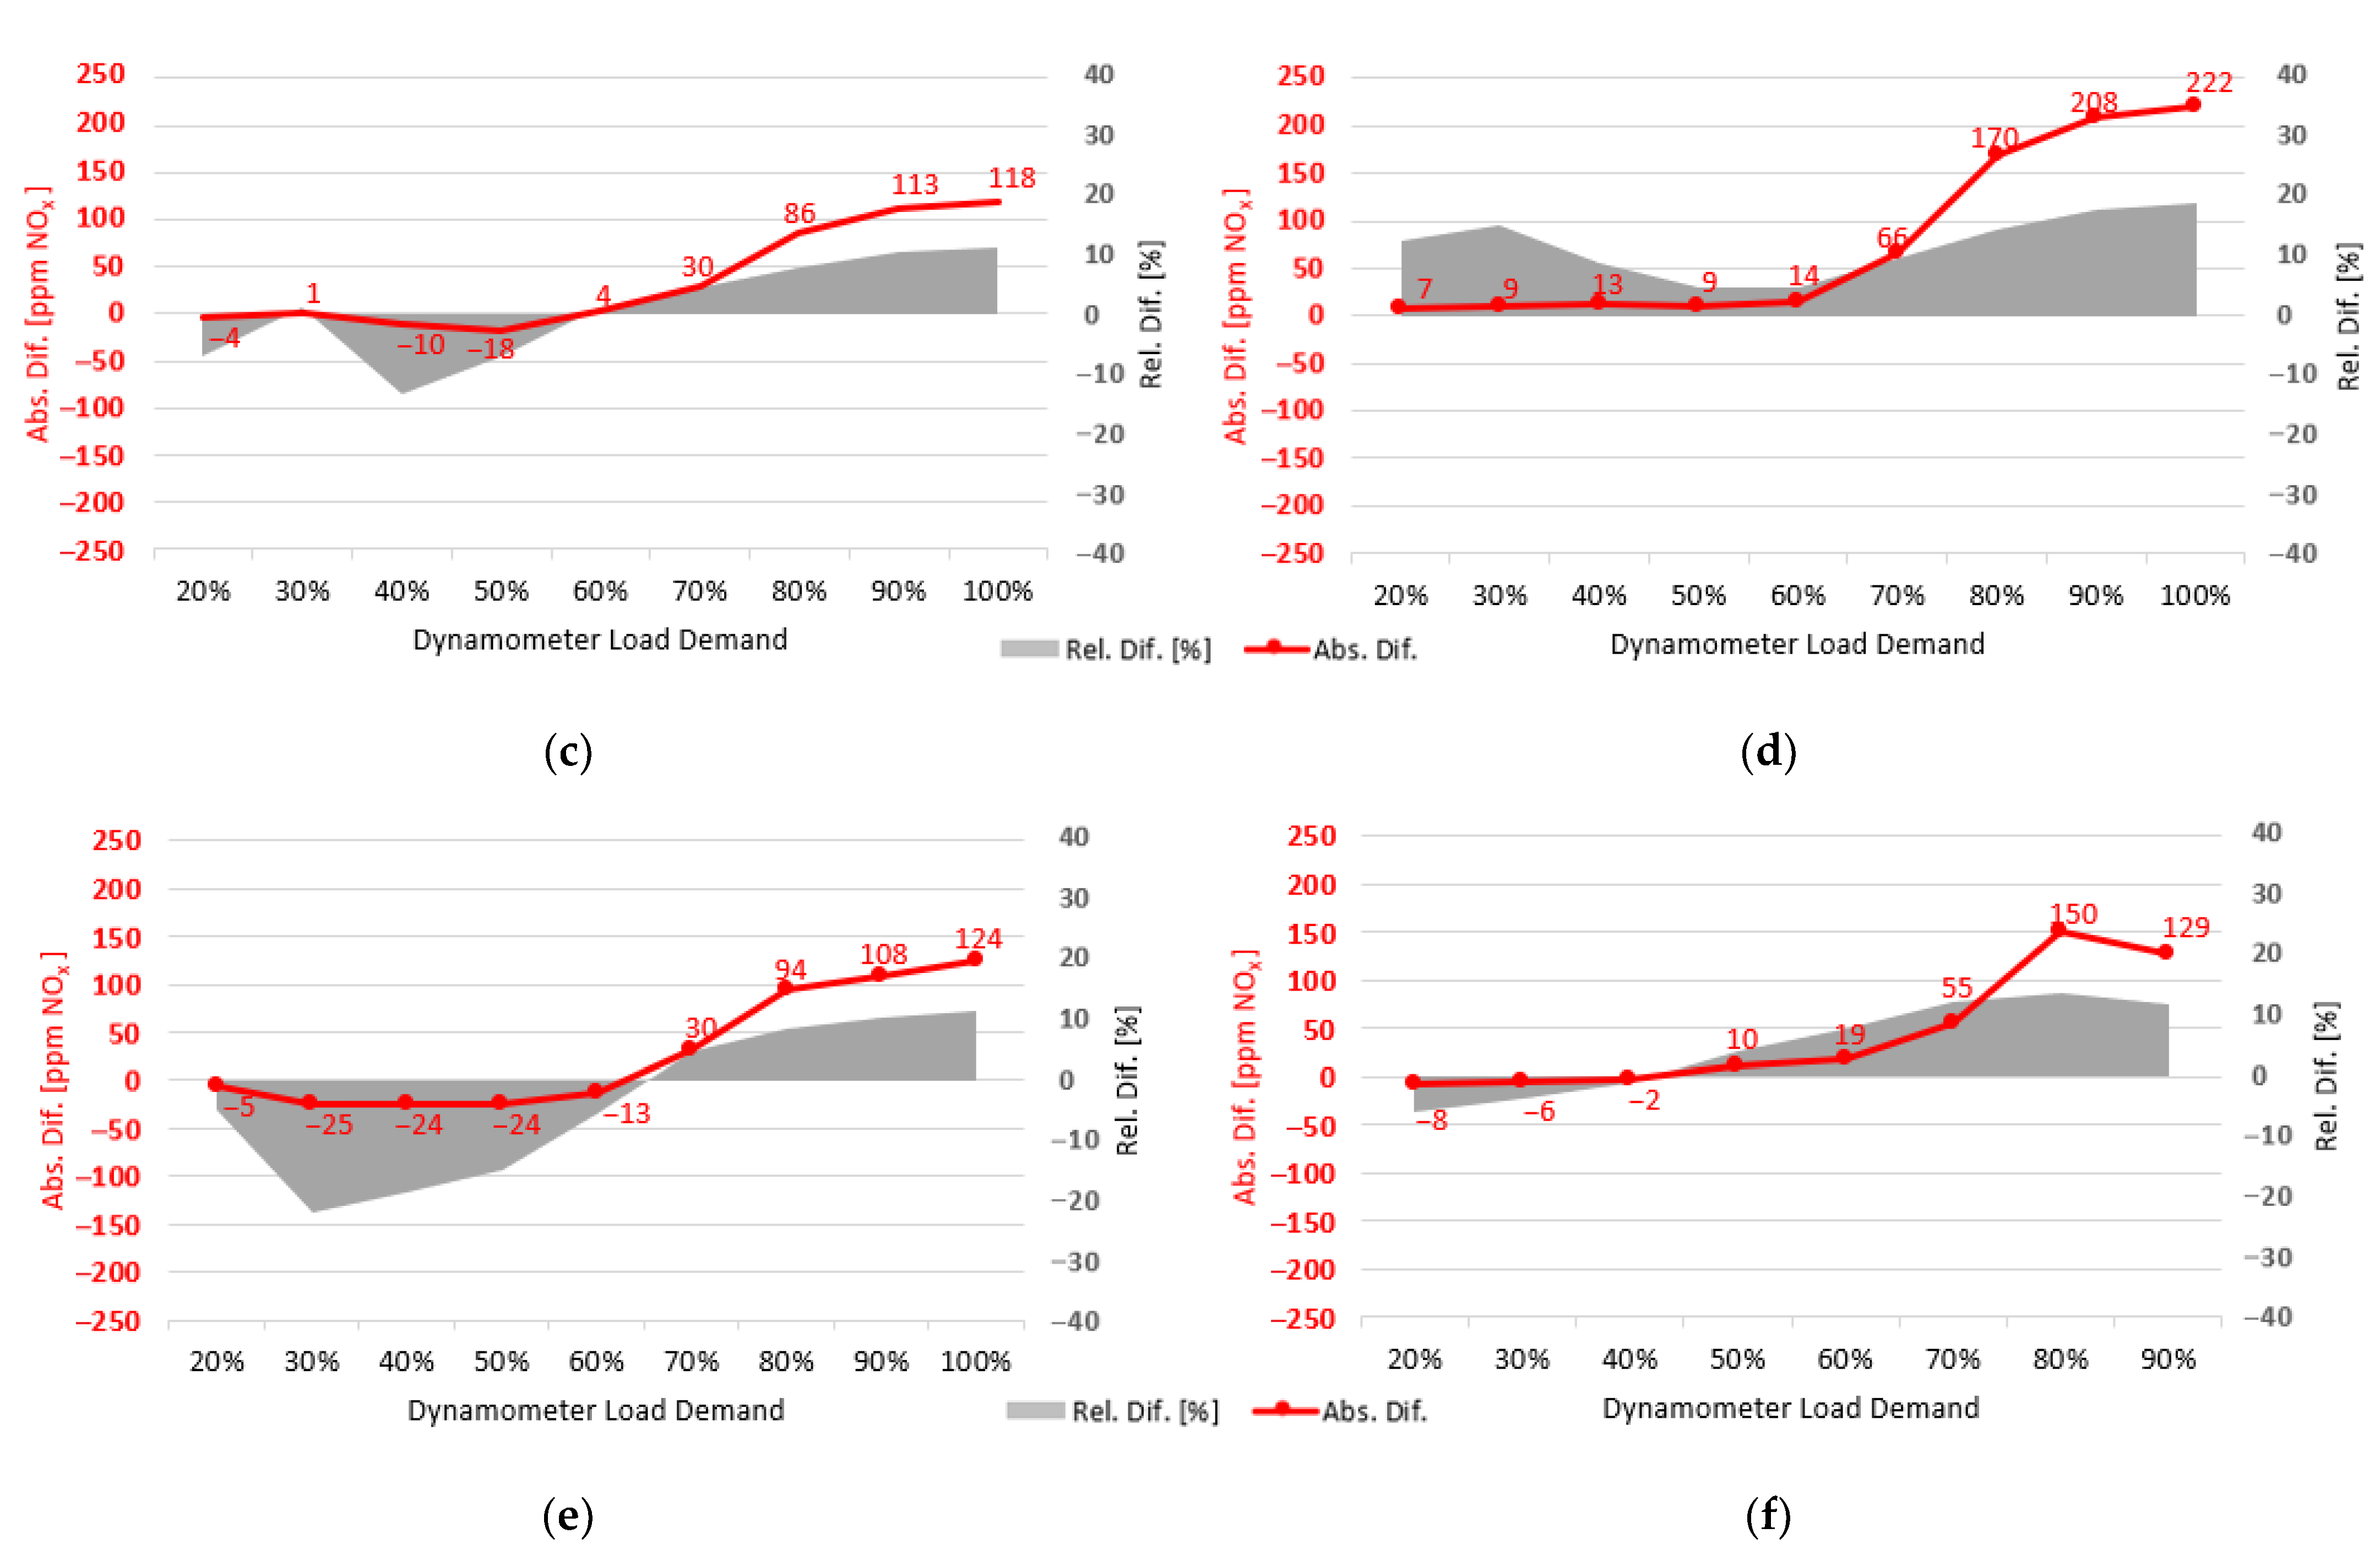
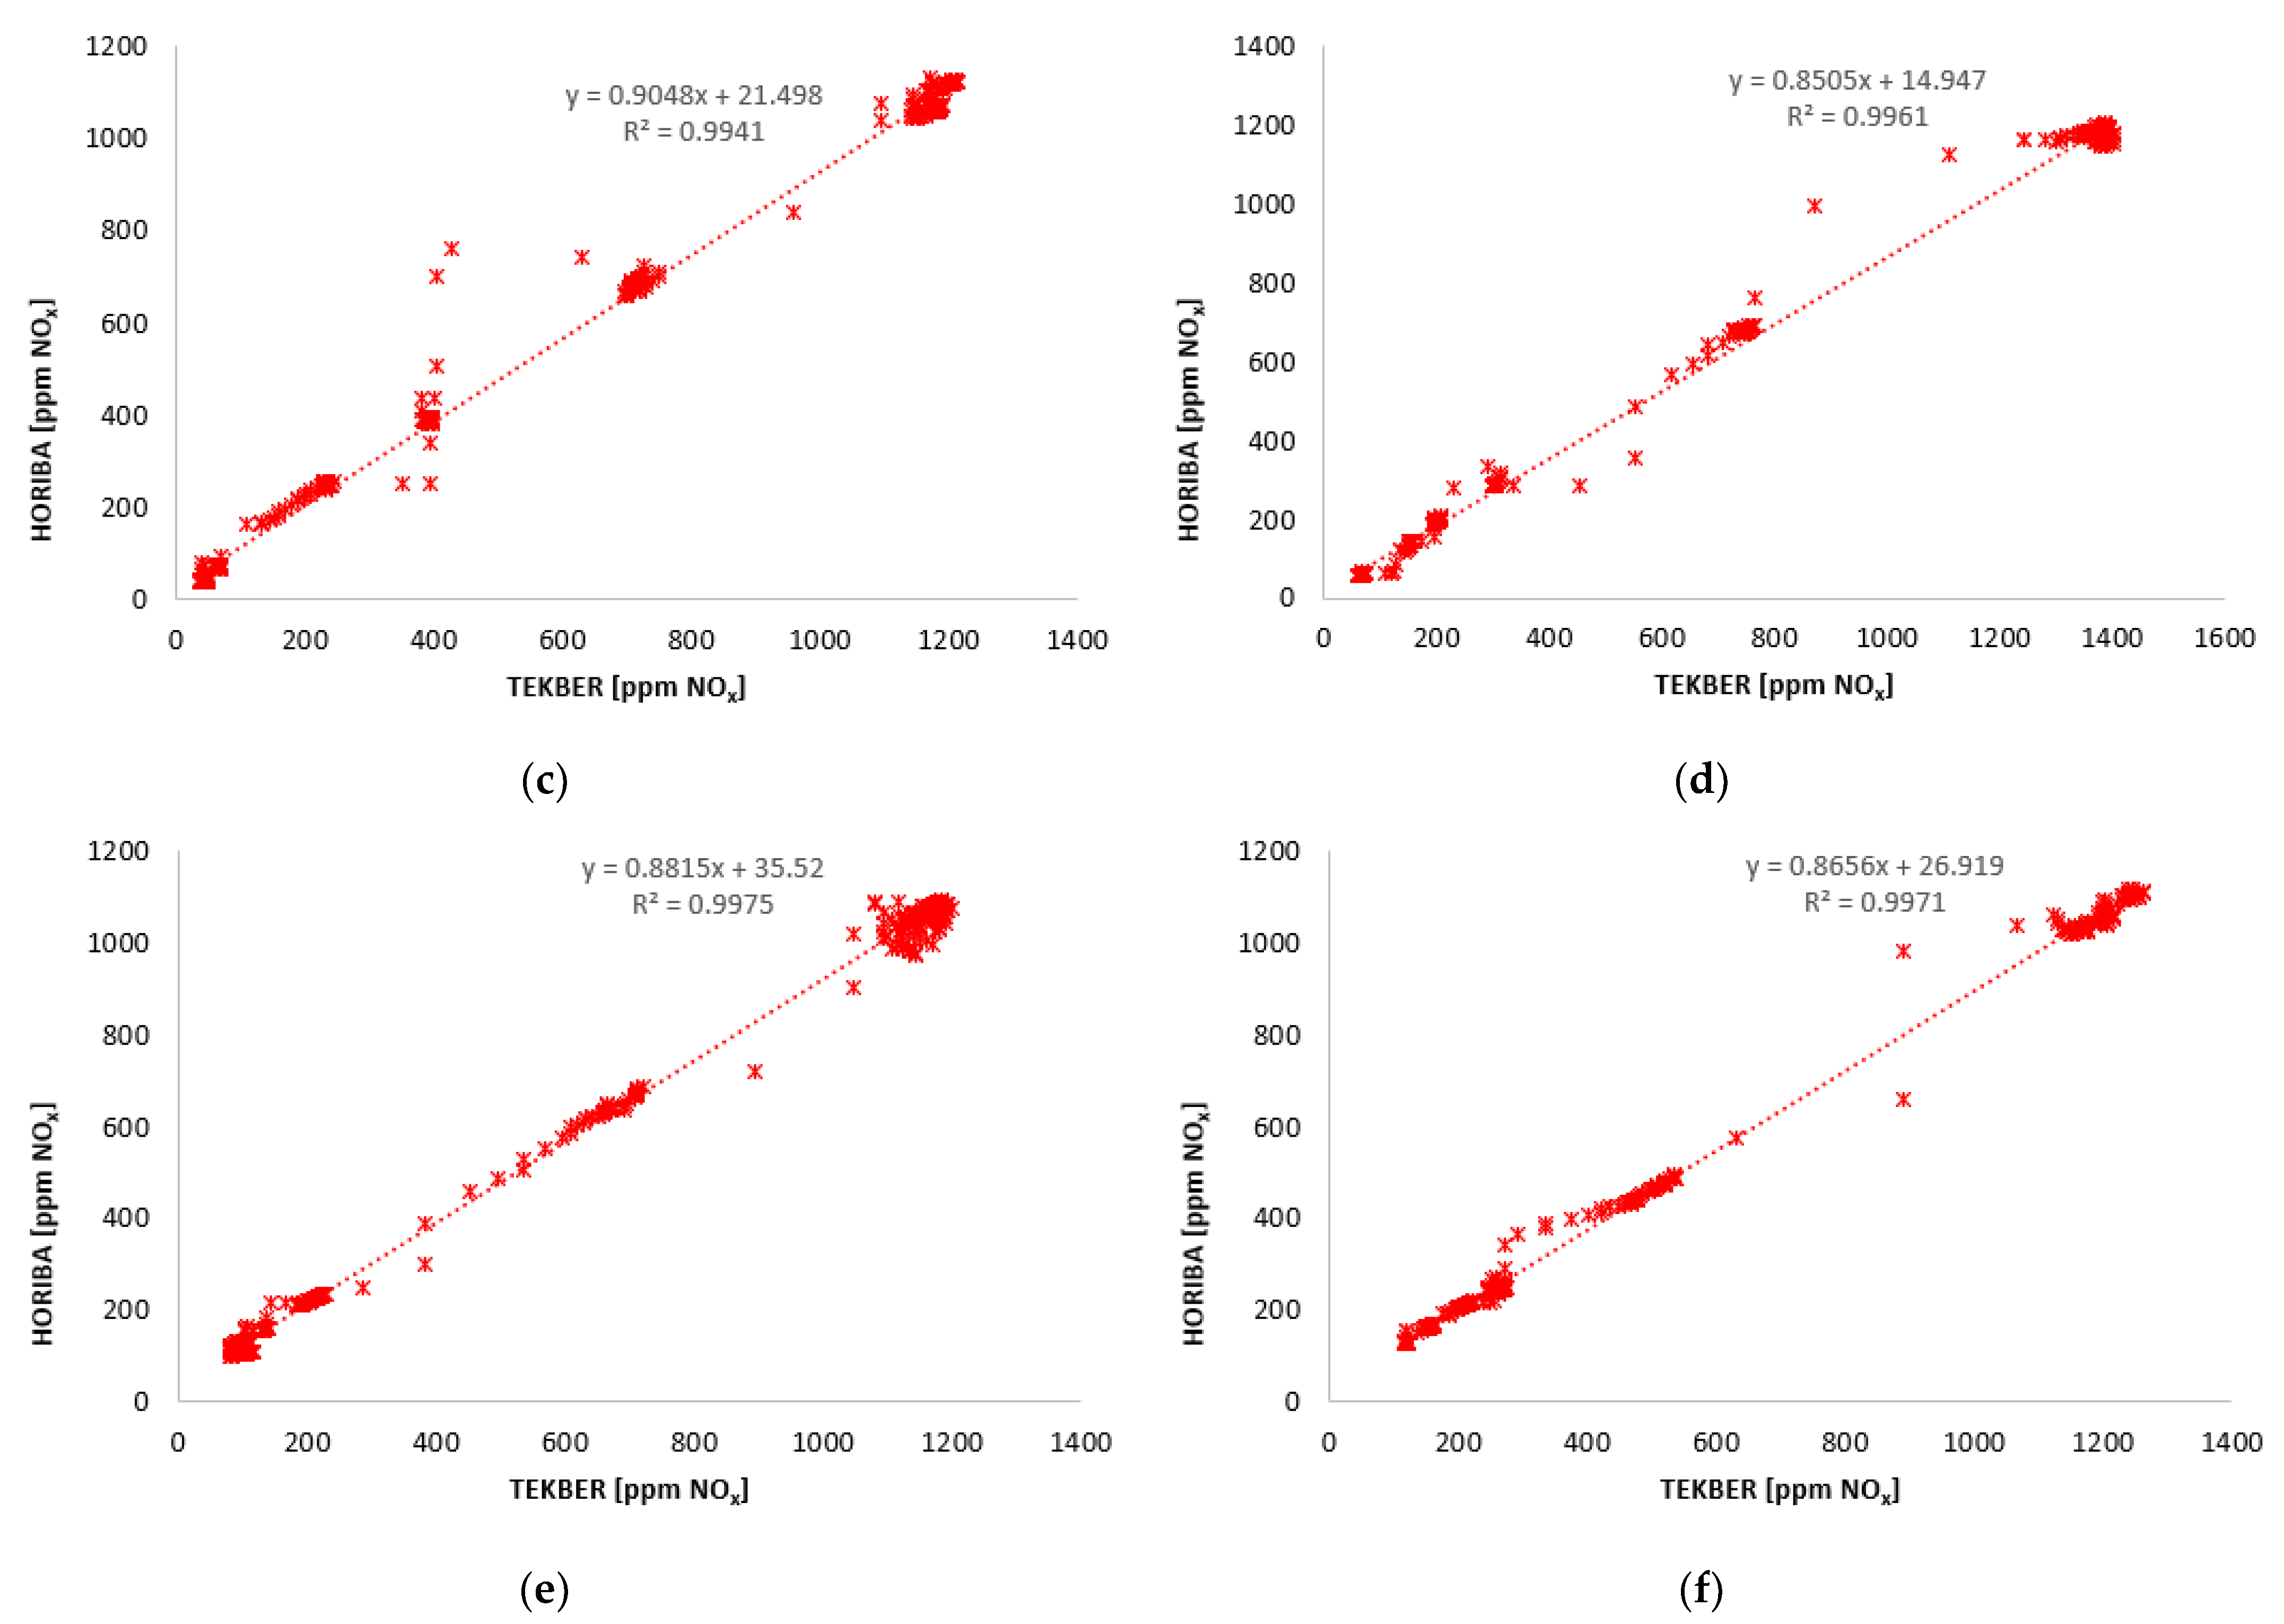
3.2. Results for Fixed Engine Speed and Increasing Load Tests
- Fixed engine speed, increasing the load demand, with EGR;
- Fixed engine speed, increasing the load demand, without EGR.
4. Conclusions
Author Contributions
Funding
Data Availability Statement
Acknowledgments
Conflicts of Interest
Abbreviations
| CITA | International Motor Vehicle Inspection Committee |
| CLD | Chemiluminescence Detector |
| DPF | Diesel Particulate Filter |
| EATS | Exhaust After-Treatment Systems |
| ECU | Electronic Control Unit |
| EGR | Exhaust Gas Recirculation |
| FID | Flame Ionization Detector |
| GC-FID | Flame Ionization Detector with Gas Chromatography |
| GDC | Gas Divider Controller |
| LEZ | Low Emissions Zone |
| MPD | Magnetopneumatic Detector |
| NDIR | Non-Dispersive Infrared Detector |
| NDUV | Non-Dispersive Ultra Violet |
| NMC-FID | Flame Ionization Detector with Non-Methane Cutter |
| NOx | Nitrogen Oxides |
| OBD | On-Board Diagnostics |
| PEMS | Portable Emissions Measurement System |
| PTI | Periodic Technical Inspection |
| RDE | Real-driving emissions |
| SCR | Selective catalytic reduction |
| WHO | World Health Organization |
Appendix A

| PSA DW12 RU General Technical Characteristics | ||
|---|---|---|
| Fuel | Diesel | |
| Bore | 85 | mm |
| Stroke | 96 | mm |
| Piston rod centreline distance | 152 | mm |
| Displacement | 2179 | cm3 |
| Engine architecture | 4 | cylinders in-line |
| Number of camshafts | 2 | |
| Number of valves | 4 | valves per cylinder |
| Compression ratio | 16:1 | |
| Base engine weight | 183 | kg |
| Maximum Power | 121 | kW @ 3775 rpm |
| Maximum Torque | 370 | N·m @ 2000 rpm |
| Injection system | Delphi | |
| High-pressure pump | Delphi DFP 6.1E | |
| Turbocharger | BWTS | |
| EGR valve | Yes | |
| EGR cooler | Yes | |
| Intercooler | Yes | |
| Catalyst | Yes | |
| DPF | Yes | |
| SCR | Yes | |
| Horiba FQ-2100DP Fuel Flow Measurement Specifications | |
|---|---|
| Measuring range | 0.2…220 L/h (300 L/h) |
| 0.15…165 kg/h (225 kg/h) | |
| Temperature control range *** | +15 *…+40 °C ** |
| with optional heating module | max. 60 °C |
| Temperature Measurement uncertainty | 0.5 °C |
| Temperature Control stability (steady-state conditions) | 0.05 °C |
| Pressure control range fuel outlet | −0.3…9 bar −0.5…9 bar |
| with option vacuum controller | |
| Fuel return pressure | −0.5…2 bar relative **** |
| Fuel circulation rate adjustable | 60 … 360 L/h |
| (optional up to 940 l/h) | |
| Fuel Supply pressure | 0.5… 1 bar |
| with option inlet pressure Regulator | max. 5 bar |
| Fuel supply temperature | 15…30 °C |
| Fuel supply feed | max. 350 L/h |
| Cooling water supply pressure | 0.2…4 bar |
| Cooling water supply/return temperature | 6…15 °C/12…21 °C |
| Cooling water supply feed | ca. 800 L/h |
| Electrical supply voltage | 230 V |
| Electrical supply frequency | 50/60 Hz |
| Electrical supply current (without heating) | 4 A |
| Overall dimensions W × H × D | 1150 × 1320 × 360 mm |
| Weight | ca. 200 kg |
| Ambient temperature | +5…+40 °C |
| Type of protection (electr. Part) | IP 44 |
| Color | RAL 7035 |
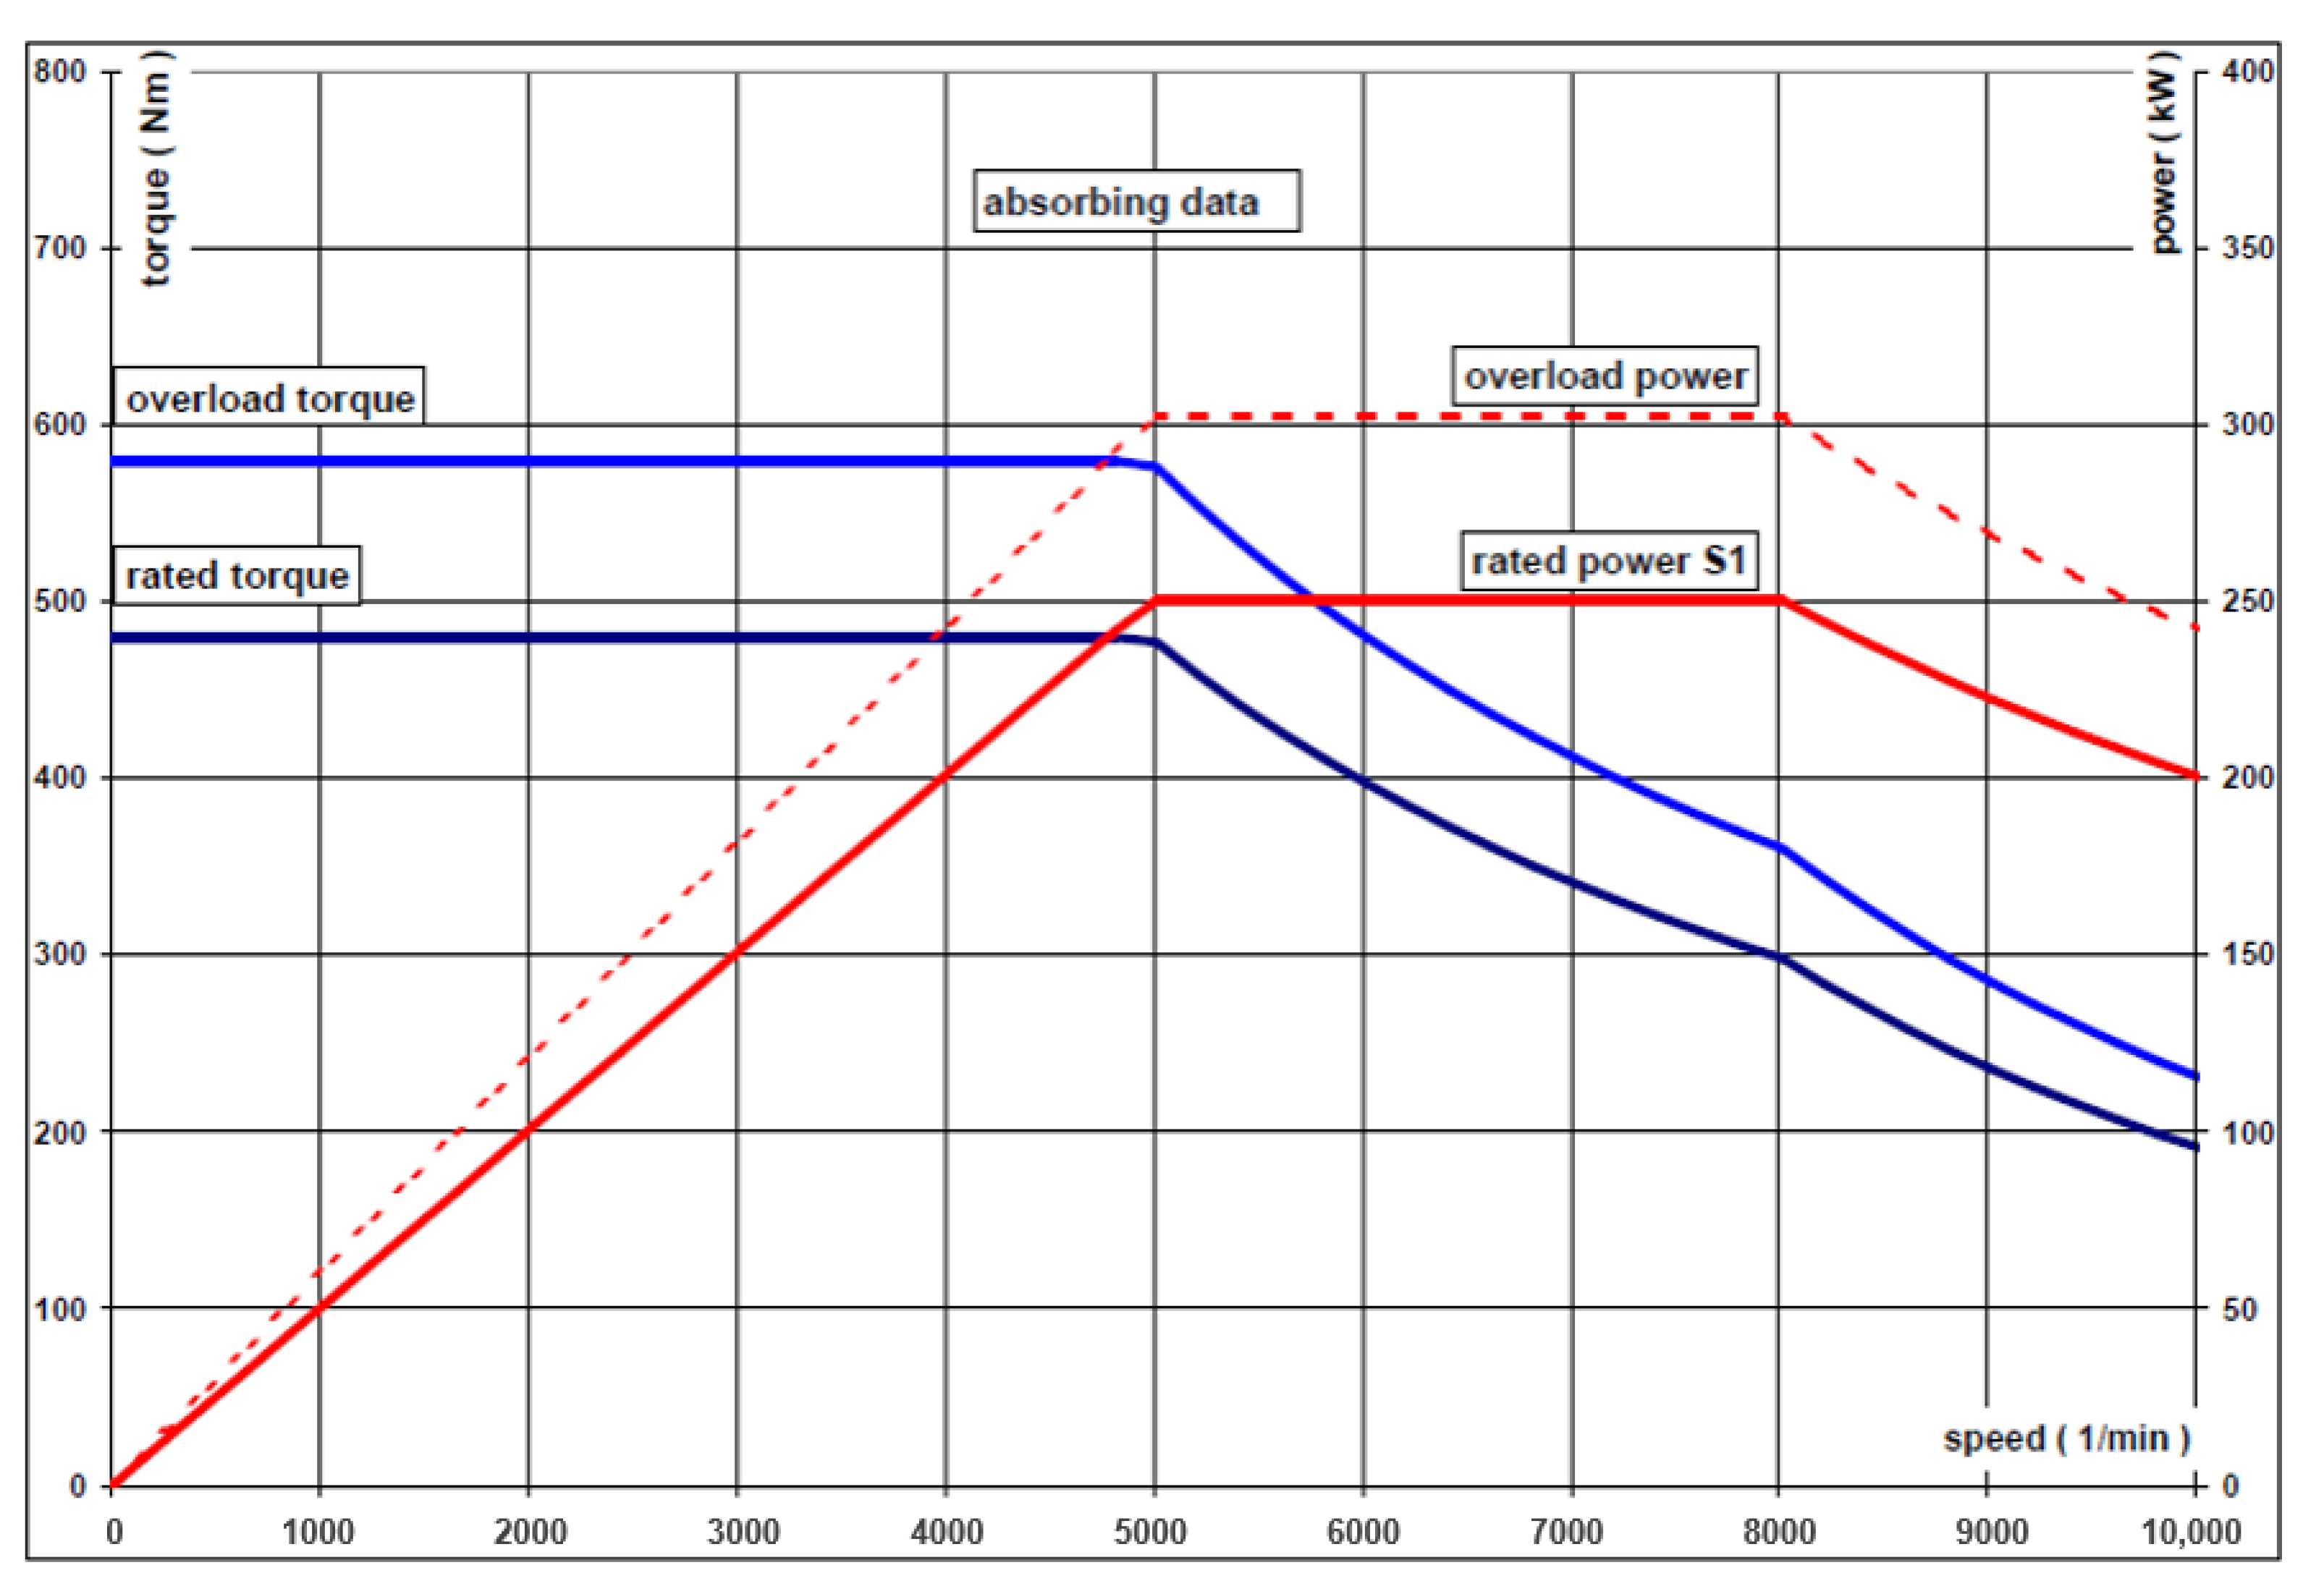
| Horiba DYNAS3 Dynamometer Specifications | ||
|---|---|---|
| Rated power (absorbing) | [kW] | 250 |
| Rated speed (absorbing) | [rpm] | 4980 |
| Rated torque (absorbing) | [Nm] | 480 |
| Rated power (driving) | [kW] | 225 |
| Rated speed (driving) | [rpm] | 4860 |
| Rated torque (driving) | [Nm] | 442 |
| Overload factor, absorbing | 1.2 | |
| Maximum speed nmax | [rpm] | 10,000 |
| Power at nmax (absorbing) | [kW] | 200 |
| Moment of inertia, machine without attachments | [kgm2] | 0.33 |
| Max. Speed gradient up to rated speed incl. Overload | [rpm/s] | 16,580 |

Appendix B
| Characteristics | |
|---|---|
| Operating Principle: | Potentiostatic-driven cell backed up by an onboard battery |
| Electrical Connector: | 4-pin Molex |
| Gas Connector: | M 16 × 1 |
| Measurement Range: | 0 to 5000 ppm |
| Output Signal: | 45 to 75 nA/ppm |
| Response Time: | <5 s |
| Drift: | <5% of signal per annum |
| Operating Temperature: | 0 to 50 °C |
| Pressure Range: | 750 to 1750 hPa |
| Linearity Error: | ±3% from 0 to 2000 ppm |
| ±5% over 2000 ppm to full scale | |
| Repeatability: | ±2% of the signal, 20 ppm absolute |
| Recommended Load: | 10 Ohm |
| Interferences: | ±20 ppm NO response to: |
| 16% CO2 balance N2 | |
| 10% CO balance N2 | |
| 100% rare gases | |
| 3000 ppm C3H2 balance N2 | |
| 75 ppm H2S balance N2 | |
| 75 ppm SO2 balance N2 | |
| 1000 ppm Benzene balance N2 | |
| All characteristics are based on conditions at 25 °C RH and 1013 hPa | |
| Component | Principle | Range |
|---|---|---|
| CO | NDIR | 0–50 to 0–5000 ppm |
| CO | NDIR | 0–0.5 to 0–12 vol% |
| CO | NDIR | 0–3 to 0–20 vol% |
| CO2 | NDIR | 0–0.1 to 0–6 vol% |
| CO2 | NDIR | 0–0.5 to 0–20 vol% |
| CO2 | NDIR | 0–3 to 0–20 vol% |
| HC | NDIR | 0–100 to 0–5000 ppm |
| HC | NDIR | 0–5000 to 0–10,000 ppm |
| N2O | NDIR | 0–100 to 0–5000 ppm |
| O2 | MPD | 0–1 to 0–25 vol% |
| THC | FID | 0–10 to 0–30,000 ppmC |
| NO/NOx | CLD | 0–10 to 0–10,000 ppm |
| NO/NOx | Heated-CLD | 0–10 to 0–10,000 ppm |
| NO, NOx, NO2 | Dual heated-CLD | NO 0–10 to 0–10,000 ppm |
| NOx 0–10 to 0–10,000 ppm | ||
| NO2 is measured by dual detector | ||
| CH4 | GC-FID | 0–10 to 0–3000 ppm |
| THC | Heated-FID | 0–10 to 0–60,000 ppmC |
| THC, CH4, NMHC | Heated-FID NMC-FID | THC 0–50 to 0–60,000 ppmC |
| CH4 0–50 to 0–25,000 ppm | ||
| NMHC is measured by dual detector |
| System Specifications | |
|---|---|
| Dimensions: | |
| Standard 19-inch Rack | 655(W) × 855(D) × 1970(H) mm |
| Oven Type Heated Analyzer | 430(W) × 550(D) × 1100(H) mm |
| Requirements: | |
| Ambient temperature | 5 °C to 40 °C |
| Ambient humidity | 80% or less as relative humidity |
| Ambient pressure | 80 kPa to 102 kPa (abs) |
| Altitude | below 2000 m above sea level |
Appendix C
| Engine Speed | Load Demand | 20% | 30% | 40% | 50% | 60% | 70% | 80% | 90% | 100% |
|---|---|---|---|---|---|---|---|---|---|---|
| 800 rpm | Avg. Horiba [ppm] | 44.0 | 34.8 | 36.1 | 34.0 | 35.6 | 102.9 | 960.4 | 1008.5 | 966.4 |
| Avg. Tekber [ppm] | 45.6 | 35.5 | 30.7 | 27.4 | 26.5 | 95.7 | 1189.6 | 1209.2 | 1150.1 | |
| Avg. dif. Abs. [ppm] | 1.6 | 0.7 | −5.4 | −6.6 | −9.0 | −7.2 | 229.2 | 200.8 | 183.7 | |
| Avg. dif. Rel. [%] | 3.6 | 1.9 | −15.0 | −19.4 | −25.4 | −7.0 | 23.9 | 19.9 | 19.0 | |
| 1000 rpm | Avg. Horiba [ppm] | 46.8 | 59.7 | 45.6 | 51.0 | 122.9 | 241.5 | 435.0 | 1135.9 | 1208.8 |
| Avg. Tekber [ppm] | 29.2 | 42.1 | 28.6 | 35.3 | 111.2 | 230.5 | 444.9 | 1203.8 | 1303.6 | |
| Avg. dif. Abs. [ppm] | −17.5 | −17.6 | −17.0 | −15.7 | −11.7 | −11.0 | 10.0 | 67.8 | 94.8 | |
| Avg. dif. Rel. [%] | −37.5 | −29.5 | −37.2 | −30.8 | −9.6 | −4.5 | 2.3 | 6.0 | 7.8 | |
| 1500 rpm | Avg. Horiba [ppm] | 49.5 | 42.3 | 72.4 | 248.3 | 388.4 | 685.0 | 1110.8 | 1056.5 | 1064.6 |
| Avg. Tekber [ppm] | 46.0 | 42.8 | 62.5 | 230.3 | 392.1 | 715.0 | 1196.6 | 1169.1 | 1182.8 | |
| Avg. dif. Abs. [ppm] | −3.5 | 0.5 | −9.9 | −18.0 | 3.7 | 30.0 | 85.8 | 112.6 | 118.2 | |
| Avg. dif. Rel. [%] | −7.1 | 1.2 | −13.6 | −7.2 | 1.0 | 4.4 | 7.7 | 10.7 | 11.1 | |
| 2000 rpm | Avg. Horiba [ppm] | 56.1 | 61.7 | 141.8 | 193.3 | 287.9 | 681.0 | 1179.9 | 1175.0 | 1162.6 |
| Avg. Tekber [ppm] | 63.2 | 71.2 | 154.5 | 202.6 | 301.7 | 746.6 | 1349.8 | 1382.9 | 1384.2 | |
| Avg. dif. Abs. [ppm] | 7.1 | 9.5 | 12.7 | 9.3 | 13.8 | 65.6 | 170.0 | 207.9 | 221.6 | |
| Avg. dif. Rel. [%] | 12.6 | 15.4 | 9.0 | 4.8 | 4.8 | 9.6 | 14.4 | 17.7 | 19.1 | |
| 2500 rpm | Avg. Horiba [ppm] | 106.1 | 111.0 | 130.8 | 159.4 | 224.0 | 639.1 | 1080.7 | 1025.9 | 1057.1 |
| Avg. Tekber [ppm] | 101.0 | 86.5 | 106.5 | 135.7 | 211.5 | 669.5 | 1174.4 | 1134.0 | 1180.8 | |
| Avg. dif. Abs. [ppm] | −5.1 | −24.5 | −24.4 | −23.7 | −12.5 | 30.4 | 93.7 | 108.1 | 123.7 | |
| Avg. dif. Rel. [%] | −4.8 | −22.1 | −18.6 | −14.8 | −5.6 | 4.8 | 8.7 | 10.5 | 11.7 | |
| 3000 rpm | Avg. Horiba [ppm] | 128.3 | 164.2 | 215.3 | 245.2 | 243.6 | 444.0 | 1080.2 | 1054.5 | n.a.* |
| Avg. Tekber [ppm] | 120.8 | 158.3 | 213.1 | 255.3 | 262.6 | 498.7 | 1230.3 | 1183.1 | n.a.* | |
| Avg. dif. Abs. [ppm] | −7.5 | −5.9 | −2.2 | 10.1 | 19.0 | 54.7 | 150.1 | 128.5 | n.a.* | |
| Avg. dif. Rel. [%] | −5.9 | −3.6 | −1.0 | 4.1 | 7.8 | 12.3 | 13.9 | 12.2 | n.a.* |
| Engine Speed | Load Demand | 20% | 30% | 40% | 50% | 60% | 70% | 80% | 90% | 100% |
|---|---|---|---|---|---|---|---|---|---|---|
| 800 rpm | Avg. Horiba [ppm] | 93.8 | 207.3 | 391.0 | 639.7 | 796.4 | 873.0 | 917.7 | 904.1 | 888.5 |
| Avg. Tekber [ppm] | 91.3 | 350.6 | 566.1 | 713.2 | 813.0 | 836.2 | 1042.5 | 1458.0 | 1464.1 | |
| Avg. dif. Abs. [ppm] | −2.5 | 143.3 | 175.1 | 73.5 | 16.6 | −36.8 | 124.8 | 553.9 | 575.6 | |
| Avg. dif. Rel. [%] | −2.7 | 69.1 | 44.8 | 11.5 | 2.1 | −4.2 | 13.6 | 61.3 | 64.8 | |
| 1000 rpm | Avg. Horiba [ppm] | 194.1 | 488.3 | 584.4 | 748.7 | 1007.9 | 1011.5 | 1069.1 | 1180.0 | 1166.5 |
| Avg. Tekber [ppm] | 188.2 | 498.8 | 603.9 | 813.0 | 1106.2 | 1110.4 | 1193.5 | 1311.5 | 1281.1 | |
| Avg. dif. Abs. [ppm] | −5.8 | 10.5 | 19.6 | 64.3 | 98.3 | 98.9 | 124.4 | 131.5 | 114.5 | |
| Avg. dif. Rel. [%] | −3.0 | 2.1 | 3.3 | 8.6 | 9.8 | 9.8 | 11.6 | 11.1 | 9.8 | |
| 1500 rpm | Avg. Horiba [ppm] | 271.9 | 375.9 | 647.5 | 829.5 | 952.5 | 1024.8 | 1106.6 | 1060.2 | 1067.7 |
| Avg. Tekber [ppm] | 236.1 | 322.9 | 600.2 | 846.2 | 1018.7 | 1097.4 | 1189.8 | 1165.3 | 1186.4 | |
| Avg. dif. Abs. [ppm] | −35.8 | −53.0 | −47.3 | 16.7 | 66.1 | 72.6 | 83.2 | 105.1 | 118.7 | |
| Avg. dif. Rel. [%] | −13.2 | −14.1 | −7.3 | 2.0 | 6.9 | 7.1 | 7.5 | 9.9 | 11.1 | |
| 2000 rpm | Avg. Horiba [ppm] | 250.5 | 410.2 | 706.8 | 928.8 | 1070.7 | 1209.7 | 1216.9 | 1181.9 | 1179.7 |
| Avg. Tekber [ppm] | 235.0 | 407.9 | 764.6 | 1079.5 | 1300.3 | 1473.3 | 1459.1 | 1415.5 | 1399.5 | |
| Avg. dif. Abs. [ppm] | −15.5 | −2.2 | 57.8 | 150.7 | 229.6 | 263.6 | 242.2 | 233.6 | 219.9 | |
| Avg. dif. Rel. [%] | −6.2 | −0.5 | 8.2 | 16.2 | 21.4 | 21.8 | 19.9 | 19.8 | 18.6 | |
| 2500 rpm | Avg. Horiba [ppm] | 220.1 | 318.4 | 522.7 | 734.2 | 851.1 | 953.9 | 1060.1 | 957.1 | 955.4 |
| Avg. Tekber [ppm] | 200.5 | 308.5 | 538.6 | 783.5 | 934.8 | 1062.6 | 1166.8 | 1059.0 | 1077.8 | |
| Avg. dif. Abs. [ppm] | −19.6 | −9.8 | 15.9 | 49.3 | 83.7 | 108.7 | 106.6 | 101.9 | 122.5 | |
| Avg. dif. Rel. [%] | −8.9 | −3.1 | 3.0 | 6.7 | 9.8 | 11.4 | 10.1 | 10.6 | 12.8 | |
| 3000 rpm | Avg. Horiba [ppm] | 173.0 | 284.8 | 467.4 | 571.8 | 738.2 | 941.0 | 1085.1 | 1084.6 | 1053.9 |
| Avg. Tekber [ppm] | 148.1 | 284.8 | 446.5 | 574.7 | 775.1 | 1046.3 | 1236.5 | 1241.7 | 1208.4 | |
| Avg. dif. Abs. [ppm] | −24.9 | 0.0 | −20.9 | 2.9 | 37.0 | 105.3 | 151.4 | 157.1 | 154.4 | |
| Avg. dif. Rel. [%] | −14.4 | 0.0 | −4.5 | 0.5 | 5.0 | 11.2 | 13.9 | 14.5 | 14.7 |
References
- EEA. Air Quality in Europe 2021 Key Messages. Available online: https://www.eea.europa.eu/publications/air-quality-in-europe-2021 (accessed on 18 February 2022).
- EEA. Health Impacts of Air Pollution in Europe. 2021. Available online: https://www.eea.europa.eu/publications/air-quality-in-europe-2021/health-impacts-of-air-pollution (accessed on 19 February 2022).
- Tan, J.; Duan, J.; He, K.; Ma, Y.; Duan, F.; Chen, Y.; Fu, J. Chemical Characteristics of PM2.5during a Typical Haze Episode in Guangzhou. J. Environ. Sci. 2009, 21, 774–781. [Google Scholar] [CrossRef]
- Reşitoʇlu, I.A.; Altinişik, K.; Keskin, A. The Pollutant Emissions from Diesel-Engine Vehicles and Exhaust Aftertreatment Systems. Clean Technol. Env. Policy 2015, 17, 15–27. [Google Scholar] [CrossRef]
- Hooftman, N.; Messagie, M.; van Mierlo, J.; Coosemans, T. A Review of the European Passenger Car Regulations–Real Driving Emissions vs Local Air Quality. Renew. Sustain. Energy Rev. 2018, 86, 1–21. [Google Scholar] [CrossRef]
- EEA. Sources and Emissions of Air Pollutants in Europe—European Environment Agency. Available online: https://www.eea.europa.eu/publications/air-quality-in-europe-2021/sources-and-emissions-of-air (accessed on 18 February 2022).
- Lee, T.; Park, J.; Kwon, S.; Lee, J.; Kim, J. Variability in Operation-Based NOx Emission Factors with Different Test Routes, and Its Effects on the Real-Driving Emissions of Light Diesel Vehicles. Sci. Total Environ. 2013, 461–462, 377–385. [Google Scholar] [CrossRef] [PubMed]
- Wang, X.; Westerdahl, D.; Hu, J.; Wu, Y.; Yin, H.; Pan, X.; Max Zhang, K. On-Road Diesel Vehicle Emission Factors for Nitrogen Oxides and Black Carbon in Two Chinese Cities. Atmos. Environ. 2012, 46, 45–55. [Google Scholar] [CrossRef]
- O’Driscoll, R.; Stettler, M.E.J.; Molden, N.; Oxley, T.; ApSimon, H.M. Real World CO2 and NOx Emissions from 149 Euro 5 and 6 Diesel, Gasoline and Hybrid Passenger Cars. Sci. Total Environ. 2018, 621, 282–290. [Google Scholar] [CrossRef] [PubMed]
- Carslaw, D.C.; Beevers, S.D.; Tate, J.E.; Westmoreland, E.J.; Williams, M.L. Recent Evidence Concerning Higher NOx Emissions from Passenger Cars and Light Duty Vehicles. Atmos. Environ. 2011, 45, 7053–7063. [Google Scholar] [CrossRef]
- Williams, M.L.; Carslaw, D.C. New Directions: Science and Policy-Out of Step on NOx and NO2? Atmos. Environ. 2011, 45, 3911–3912. [Google Scholar] [CrossRef]
- Hoekman, S.K.; Robbins, C. Review of the Effects of Biodiesel on NOx Emissions. Fuel Processing Technol. 2012, 96, 237–249. [Google Scholar] [CrossRef]
- CITA. Monitoring of NOx Emissions as Part of the PTI; CITA: Brussels, Belgium, 2022. [Google Scholar]
- Fernández, E.; Valero, A.; Alba, J.J.; Ortego, A. A New Approach for Static NOx Measurement in PTI. Sustainability 2021, 13, 13424. [Google Scholar] [CrossRef]
- Campolo, M.; Sclabi, A.; Molin, D. TEDDIE Project-Final Report; CITA: Brussels, Belgium, 2010; Volume 32. [Google Scholar]
- Boulter, P.; Buekenhoudt, P.; Stricker, P.; Mäurer, H.-J.; Nolte, C.; Ost, T.; Schulz, W.H.; Witz, K.-U.; Afflerbach, G.; Förster, C.; et al. TEDDIE: A New Roadworthiness Emission Test for Diesel Vehicles Involving NO, NO2 and PM Measurements, Final Report. CITA 2011, 105. [Google Scholar] [CrossRef]
- OIML. OIML R99-1 & 2 Edition 2008 (E) Instruments for Measuring Vehicle Exhaust Emissions Part 1: Metrological and Technical Requirements Part 2: Metrological Controls and Performance Tests; OIML: Paris, France, 2008. [Google Scholar]
- Bermúdez, V.; García, A.; Villalta, D.; Soto, L. Assessment on the Consequences of Injection Strategies on Combustion Process and Particle Size Distributions in Euro VI Medium-Duty Diesel Engine. Int. J. Engine Res. 2020, 21, 683–697. [Google Scholar] [CrossRef]
- Fernández-Yáñez, P.; Soriano, J.A.; Mata, C.; Armas, O.; Pla, B.; Bermúdez, V. Simulation of Optimal Driving for Minimization of Fuel Consumption or NOX Emissions in a Diesel Vehicle. Energies 2021, 14, 5513. [Google Scholar] [CrossRef]
- Pla, B.; Piqueras, P.; Bares, P.; Aronis, A. NOx Sensor Cross Sensitivity Model and Simultaneous Prediction of NOx and NH3 Slip from Automotive Catalytic Converters under Real Driving Conditions. Int. J. Engine Res. 2020, 22, 3209–3218. [Google Scholar] [CrossRef]
- ISO 3930:2000(E)/OIML R99:2000(E); Instruments for Measuring Vehicle Exhaust Emissions. ISO: Geneva, Switzerland, 2000.
- The United Nations Economic Commission for Europe (UNECE) Regulation No 83 of the Economic Commission for Europe of the United Nations (UN/ECE)–Uniform Provisions Concerning the Approval of Vehicles with Regard to the Emission of Pollutants According to Engine Fuel Requirements. Off. J. Or Eur. Union 2006, L 375, 223–495.
- United States Environmental Protection Agency (EPA). CFR PART 1065: ENGINE-TESTING PROCEDURES. Code Fed. Regul. (CFR) 2021, 37, 46–293. [Google Scholar]
- United States Environmental Protection Agency (EPA). CFR PART 1066: VEHICLE-TESTING PROCEDURES. Code Fed. Regul. (CFR) 2021, 37, 293–393. [Google Scholar]
- ISO/IEC 17025:2005(E); General Requirements for the Competence of Testing and Calibration Laboratories. ISO: Geneva, Switzerland, 2005.
- Andros Inc. Model 6900 Product Manual (Compact Automotive Gas); Andros Incorporated: Richmond, CA, USA.
- British Standard BS ISO 15031-5:2006; Road Vehicles—Communication between Vehicle and External Equipment for Emissions Related Diagnosis, Part 5: Emissions-Related Diagnostic Services. British Standard: London, UK, 2006; p. 186.
- Dulac, J. Global Transport Outlook to 2050; International Energy Agency: Paris, France, 2012. [Google Scholar]
- Valero, A.; Valero, A.; Calvo, G.; Ortego, A. Material Bottlenecks in the Future Development of Green Technologies. Renew. Sustain. Energy Rev. 2018, 93, 178–200. [Google Scholar] [CrossRef]

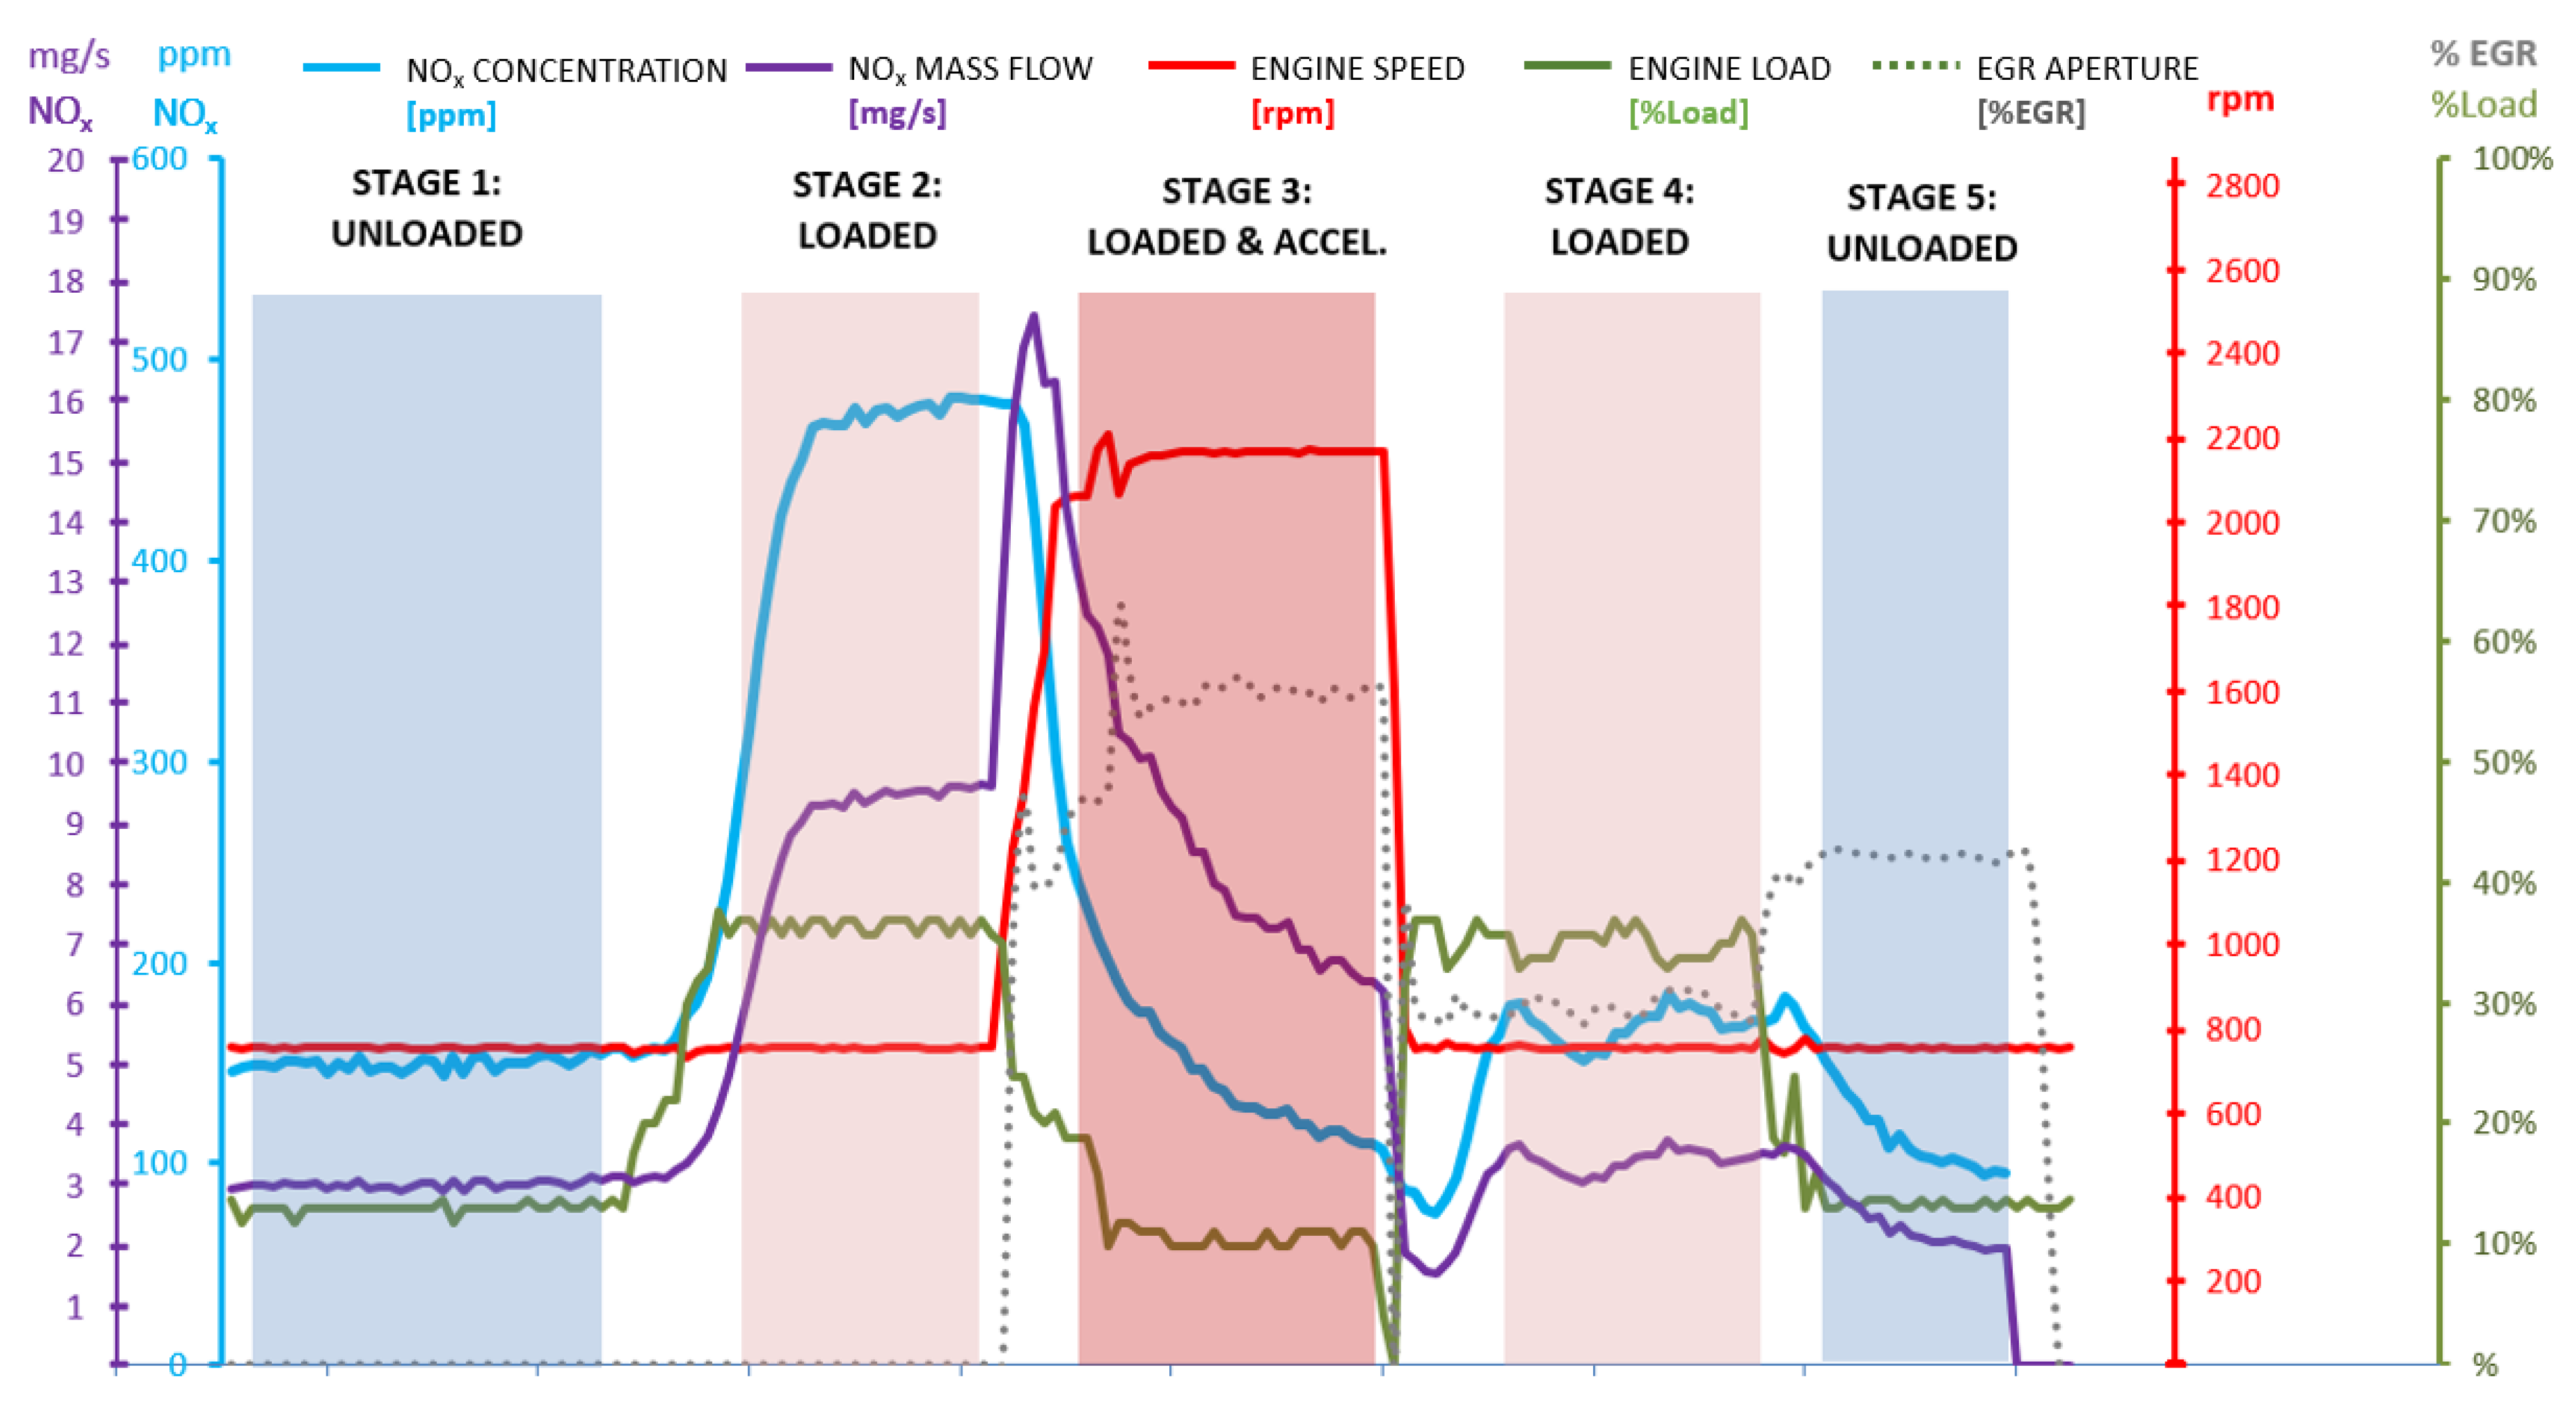


| Stage 1: Unloaded | Stage 2: Loaded | Stage 3: Loaded & Accelerated | Stage 4: Loaded | Stage 5: Unloaded | |
|---|---|---|---|---|---|
| Engine state | On | On | On | On | On |
| Engine speed [rpm] | Natural idle speed | Natural idle speed | >2000 rpm <3000 rpm | Natural idle speed | Natural idle speed |
| Vehicle extra load equipment | Disconnected | Connected | Connected | Connected | Disconnected |
| % Engine load [%] | <25% * | >25% * | Irrelevant | >25% * | <25% * |
| Low Load | High Load | |
|---|---|---|
| HORIBA Average NOx [ppm] | 53.7 | 44.3 |
| TEKBER Average NOx [ppm] | 53.6 | 36.2 |
| Avg. Absolute Diff. [ppm] | 2.6 | 8.6 |
| Avg. Relative Diff. [%] | 4.8% | 20.6% |
| Low Load | High Load | |
|---|---|---|
| HORIBA Average NOx [ppm] | 325.0 | 405.6 |
| TEKBER Average NOx [ppm] | 339.8 | 430.2 |
| Avg. Absolute Diff. [ppm] | 20.8 | 29.1 |
| Avg. Relative Diff. [%] | 5.9% | 7.1% |
| Load Demand | |||||||||
|---|---|---|---|---|---|---|---|---|---|
| Engine Speed | 20% | 30% | 40% | 50% | 60% | 70% | 80% | 90% | 100% |
| 800 rpm | 1.6 | 0.7 | 5.4 | 6.6 | 9.0 | 7.2 | 229.2 | 200.8 | 183.7 |
| 1000 rpm | 17.5 | 17.6 | 17.0 | 15.7 | 11.7 | 11.0 | 10.0 | 67.8 | 94.8 |
| 1500 rpm | 3.5 | 0.5 | 9.9 | 18.0 | 3.7 | 30.0 | 85.8 | 112.6 | 118.2 |
| 2000 rpm | 7.1 | 9.5 | 12.7 | 9.3 | 13.8 | 65.6 | 170.0 | 207.9 | 221.6 |
| 2500 rpm | 5.1 | 24.5 | 24.4 | 23.7 | 12.5 | 30.4 | 93.7 | 108.1 | 123.7 |
| 3000 rpm | 7.5 | 5.9 | 2.2 | 10.1 | 19.0 | 54.7 | 150.1 | 128.5 | n.d. |
| Avg. Diff. [ppm] | 7.1 | 9.8 | 11.9 | 13.9 | 11.6 | 33.2 | 123.1 | 137.6 | 148.4 |
| Rel. Diff. [%] | 9.8% | 12.4% | 11.1% | 8.9% | 5.4% | 7.1% | 12.6% | 12.8% | 13.6% |
| Load Demand | |||||||||
|---|---|---|---|---|---|---|---|---|---|
| Engine Speed | 20% | 30% | 40% | 50% | 60% | 70% | 80% | 90% | 100% |
| 800 | 2.5 | 143.3 | 175.1 | 73.5 | 16.6 | 36.8 | 124.8 | 553.9 | 575.6 |
| 1000 | 5.8 | 10.5 | 19.6 | 64.3 | 98.3 | 98.9 | 124.4 | 131.5 | 114.5 |
| 1500 | 35.8 | 53.0 | 47.3 | 16.7 | 66.1 | 72.6 | 83.2 | 105.1 | 118.7 |
| 2000 | 15.5 | 2.2 | 57.8 | 150.7 | 229.6 | 263.6 | 242.2 | 233.6 | 219.9 |
| 2500 | 19.6 | 9.8 | 15.9 | 49.3 | 83.7 | 108.7 | 106.6 | 101.9 | 122.5 |
| 3000 | 24.9 | 0.0 | 20.9 | 2.9 | 37.0 | 105.3 | 151.4 | 157.1 | 154.4 |
| Avg. Diff. [ppm] | 17.4 | 36.5 | 56.1 | 59.6 | 88.5 | 114.3 | 138.8 | 213.9 | 230.2 |
| Rel. Diff. [%] | 8.7% | 10.5% | 10.1% | 8.0% | 9.8% | 11.4% | 12.9% | 20.1% | 21.9% |
Publisher’s Note: MDPI stays neutral with regard to jurisdictional claims in published maps and institutional affiliations. |
© 2022 by the authors. Licensee MDPI, Basel, Switzerland. This article is an open access article distributed under the terms and conditions of the Creative Commons Attribution (CC BY) license (https://creativecommons.org/licenses/by/4.0/).
Share and Cite
Fernández, E.; Ortego, A.; Valero, A.; Alba, J.J. Suitability Assessment of NOx Emissions Measurements with PTI Equipment. Vehicles 2022, 4, 917-941. https://doi.org/10.3390/vehicles4040050
Fernández E, Ortego A, Valero A, Alba JJ. Suitability Assessment of NOx Emissions Measurements with PTI Equipment. Vehicles. 2022; 4(4):917-941. https://doi.org/10.3390/vehicles4040050
Chicago/Turabian StyleFernández, Eugenio, Abel Ortego, Alicia Valero, and Juan J. Alba. 2022. "Suitability Assessment of NOx Emissions Measurements with PTI Equipment" Vehicles 4, no. 4: 917-941. https://doi.org/10.3390/vehicles4040050
APA StyleFernández, E., Ortego, A., Valero, A., & Alba, J. J. (2022). Suitability Assessment of NOx Emissions Measurements with PTI Equipment. Vehicles, 4(4), 917-941. https://doi.org/10.3390/vehicles4040050