Abstract
Energy moderation of the road transportation sector is required to limit climate change and to preserve resources. This work is focused on the moderation of vehicle consumption by optimizing the speed policy along an itinerary while taking into account vehicle dynamics, driver visibility and the road’s longitudinal profile. First, a criterion is proposed in order to detect speed policies that are impeding drivers’ eco-driving ability. Then, an energy evaluation is carried out and an optimization is proposed. A numerical application is performed on a speed limiting point with 20 usage cases and 5 longitudinal slope values. In the hypothesis of a longitudinal slope of zero, energy savings of 27.7 liter per day could be realized by a speed sign displacement of only 153.6 m. Potential energy savings can increase to up to 308.4 L per day for a slope case, or up to 70.5 L per day for an ordinary slope, with a sign displacement of only 391.5 m. This results in a total of 771,975 L of fuel savings over a 30 year infrastructure life cycle period. Therefore a methodology has been developed to help road managers optimize their speed policies with the aim of moderating vehicle consumption.
1. Introduction
This work aims to propose simple strategies to reduce road vehicle consumption by enhancing eco-driving applicability with the help of small modifications to road management. The context is linked to the energy moderation needed in terms of both current energy availability issues and long-term climate change impacts.
The energy context is highly critical, as since 2021, the world has faced an energy crisis initiated by a large economic rebound after COVID-19 pandemic lockdowns, which was amplified in 2022 by the conflict between Ukraine and Russia, leading to the discontinuation of Russian gas and oil deliveries to Europe.
Lower availability and higher prices of energy sources, such as gas, petrol and electricity require strategies to limit all sorts of energy demands. Moreover this is in line with the needed global action to mitigate climate change, mainly through the moderation of fossil energy use.
Even if the energy context is so significant that the International Energy Agency is qualifying it as a “global energy crisis” [1], the tensions over energy availability are, however, linked to long-term processes. It has been more than half a century since the risks of oil availability were anticipated within the “peak oil” theory [2]. Oil availability was a major concern in the 1970s, but gas prices were impacted less. The present energy crisis concerns all major energy sources even electricity from nuclear plants and gas because energy economic models are more interlinked now than in the 1970s [1].
Energy moderation is necessary in this context, especially when considering the impact of oil-based energy on climate change [3], which is another major threat to worldwide populations. Indeed, concerning climate change associated with global fossil energy consumption, every Intergovernmental Panel on Climate Change (IPCC) special report is more alarming [4] and a massive cut to global CO2 emissions is recommended in order to limit global warming below 2 or 3 degrees.
Nevertheless global CO2 emissions are rising almost every year, as observed in 2018 and 2019 [5].
The road transportation sector accounts for 28% of worldwide energy use [5]. Attempts at energy reduction have been performed for infrastructure, drivers and vehicle parts. The infrastructure can be optimized in the construction phase by optimizing its longitudinal profile [6], with a possible energy moderation of up to 6%, and by considering the construction and usage phases over a 10 year period.
Energy reduction can be indirectly achieved by urban policies and planning favoring active mobility and public transportation [7]. In this field, in [8], the concept of urban regeneration was applied to the case study of a canal port in Italy, with the joint benefits of active mobility promotion and tree and vegetable implantation, leading to energy moderation and air pollution mitigation.
If considering the vehicles, their energy use still relies on non-renewable energy sources (primarily oil) due to its high energy density and ease of storage. While electric batteries and hydrogen fuel cells offer promising alternatives, they currently face challenges such as a lower energy density in batteries, leading to heavier vehicles or shorter displacement ranges, and hydrogen storage tanks with leakage issues in long-term storage, despite ongoing development of various hydrogen thermodynamic and material-based storage techniques [9].
Therefore this work is centered on the energy reduction of gasoline or diesel vehicles, but this methodology could be profitable for energy reduction in the global meaning for electric or hydrogen vehicles too, since it relies on the minimization of total mechanical energy demand from the road infrastructure.
The energy reduction of vehicles can be seen as the result of a given traffic model. Such information can be studied at different time and space scales, leading to different classification of traffic models. From smaller scales to larger scales, microscopic models describe each vehicle individually [10,11], the mesoscopic models rely on the statistical dynamics of drivers [12,13], and the macroscopic scale focuses on the mean variables regardless of each vehicle’s dynamics [14]. Our study belongs to microscopic models, which take into account interactions between vehicles and roads.
Energy use of a vehicle can be related to the vehicle’s characteristics, such as its mass, frontal area, motor efficiency or tire width, but it also dependents on the driver’s behavior or route planning. Additionally, energy consumption can be influenced by some road properties such as the macrotexture, longitudinal slopes, or variations in allowed speeds along an itinerary.
This study takes into account three categories of impact on energy use: vehicle, driver and road infrastructure. Particular attention is paid to the road impact, from the road management point of view, because this energy moderation mean has been investigated little up to now. In particular, this work aims to reduce the energy use of vehicles by optimizing road signalization. Thus, the context is the road energy demand, which is expected to increase by a factor of 1.4–2.3 by 2030 compared with the levels observed in 2020 and 2010 in China [15].
The subcontext is the eco-driving ability, with for example a reduction of more than 10% of energy that could be achieved by teaching eco-driving rules to a group of more than 100 participants [16]. Therefore, the motivation and novelty of our research are to induce eco-driving behavior from usual drivers, only by suggesting speed profiles close to those followed by eco-drivers. A supplementary advantage of our methodology is giving drivers an opportunity to reduce their energy consumption without having to deal with multiple goals in driving behavior, such as safety, time saving and fuel saving [17].
Lastly it is important to note that road speed management has two primary aims: road safety and mobility efficiency. Our work endeavors to add the energy moderation aim to these while keeping the same or a higher road safety level by always enlarging a lower-speed road section over the neighboring higher-speed section. By doing so, mobility is affected and the road manager should be attentive to excessive length of speed sign displacement proposed by the model. Therefore, the real novelty of this research is to add the energy savings aim to the usual objectives of safety, comfort and mobility. For example, in [18] the speed distribution over an itinerary generally takes into account the high slopes for braking safety, but no attention is paid to less marked slopes in the energy moderation concern, from the road manager point of view. Individually, for a given vehicle, an onboard optimization could be provided to adapt the speed profile to the road profile [19], and specific look-ahead control system could allow up to 3.5% reduction in fuel consumption [20]. The present work is extending this energy moderation opportunity to a whole vehicle traffic facing a given road, without the need of onboard systems.
Our study methodology is detailed in the following part, and then an experimental case is described and results are given.
2. Methodology
2.1. Improper Road Signalization
There are situations on roads that force drivers to brake mechanically, whereas most eco-driving rules focus on decelerating without braking.
If we consider a given road route, we will call the road speed-sectioning the succession of allowed speed along an itinerary, and each point modifying the allowed speed will be called a speed-sectioning point.
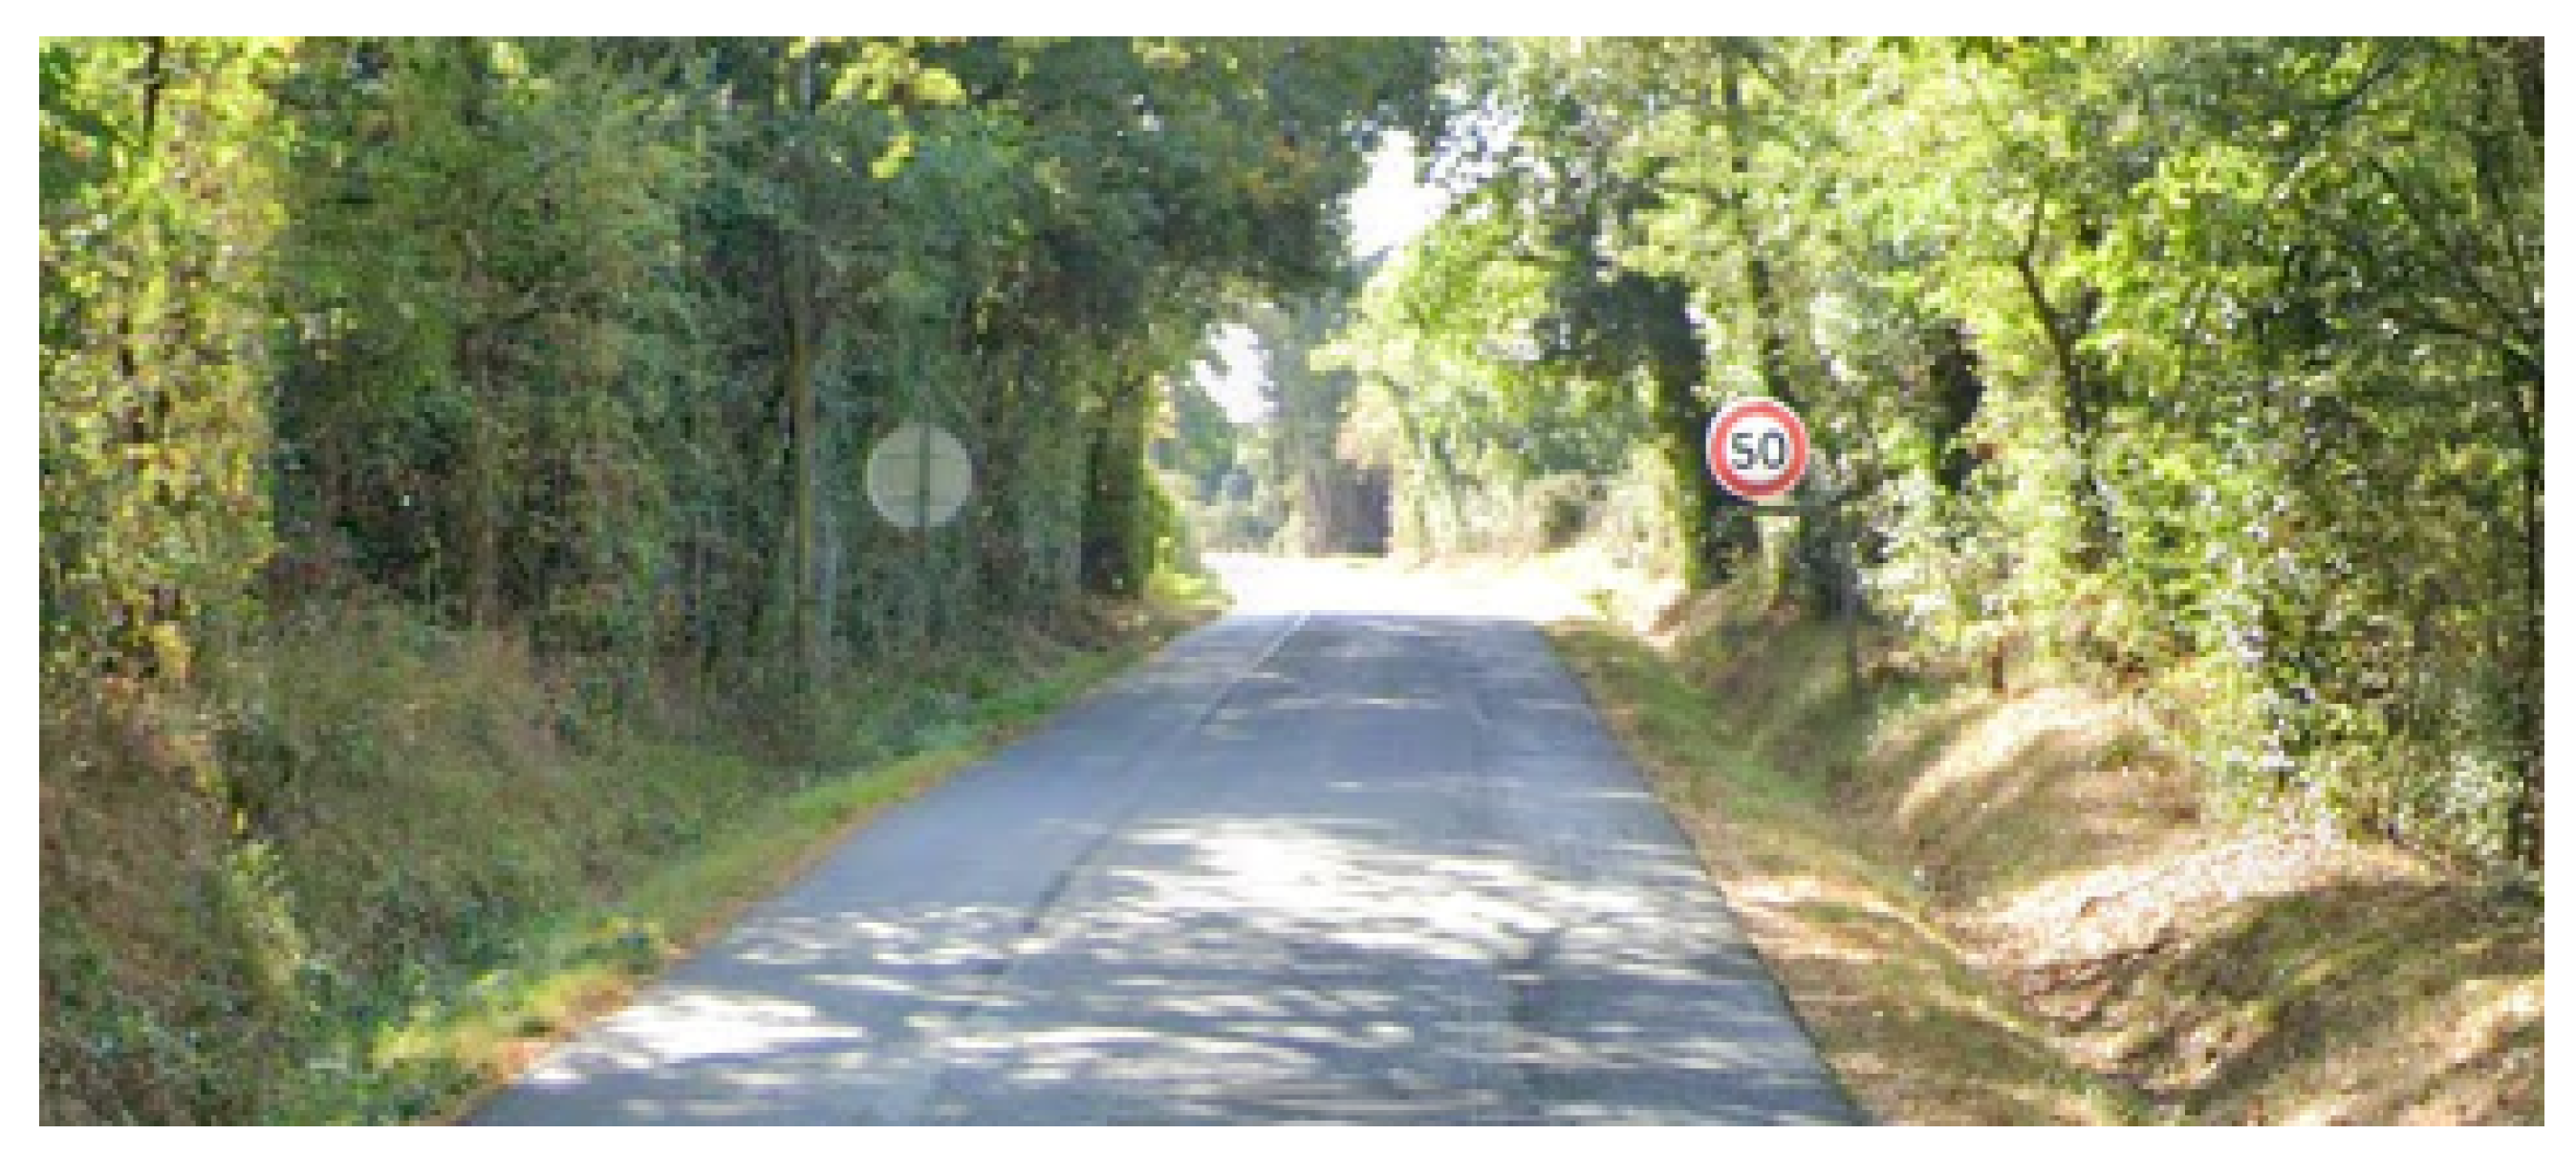
Therefore, in the general case, situations that force drivers to brake are induced by a speed-sectioning point which can be the presence of a conventional speed sign, such as the sign visible in Figure 1, with a specific speed limit on it, or a roundabout, with a virtual speed limitation associated with its diameter or visibility field, or a stop sign with an implicit zero km/h limit, a road speed bump, a village entrance panel, and so on.
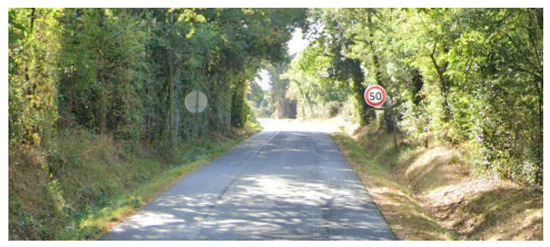
Figure 1.
Conventional speed sign beside a road.
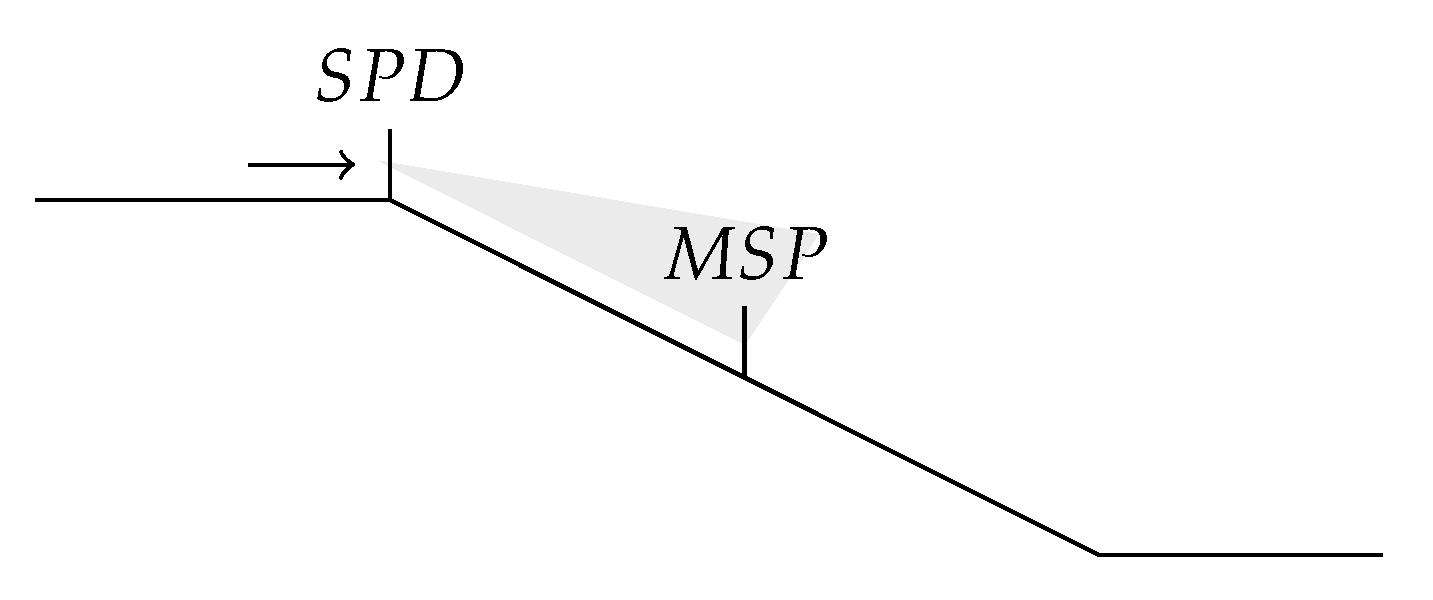
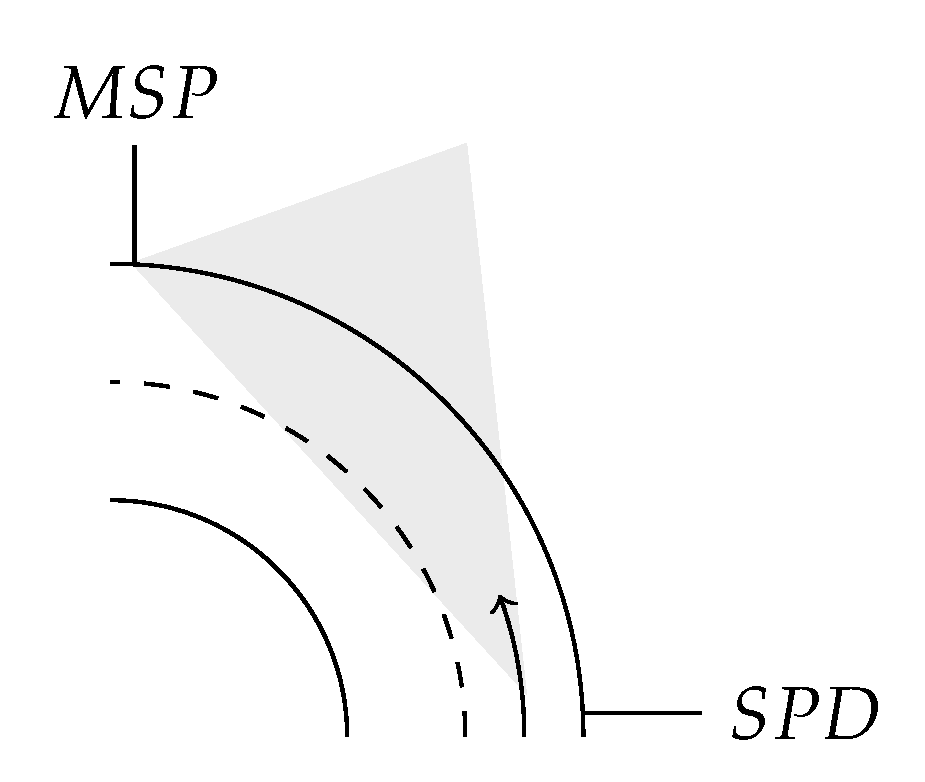
To study the decelerating maneuvers, the considered speed-sectioning point will be referred to as the Misplaced Speed Panel (MSP) position, and the upstream point from which the driver effectively sees the corresponding sign and starts to decelerate will be referred to as the Starting Point of Deceleration (SPD) point.
The necessity to use mechanical brakes will then rely on the difference in speed between the sections that are separated by the speed-sectioning point, the driver’s visibility distance, reaction time, and the natural deceleration rate of the vehicle.
MSP and SPD positions can be reported in worsened road cases with the presence of a longitudinal slope, as illustrated in Figure 2, or in the presence of a sharp turn, as illustrated in Figure 3.
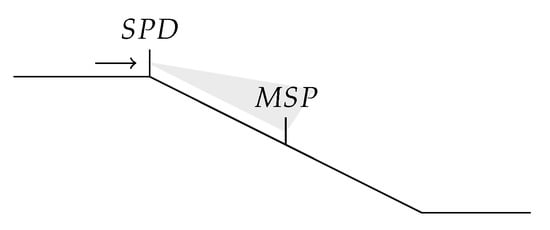
Figure 2.
Slope situation.
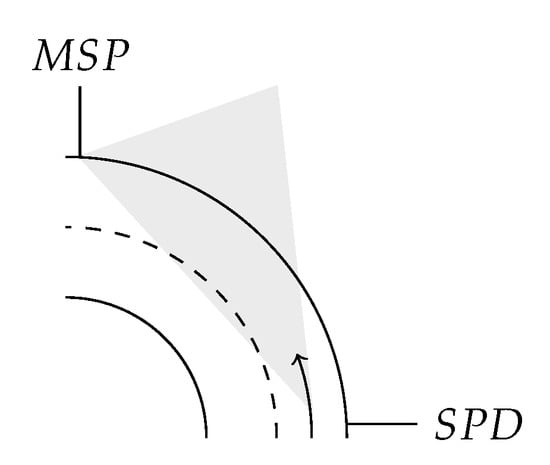
Figure 3.
(Left-) turn situation.
Other situations impeding eco-driving can be a combination of these two situations, such as the slope case without height variation or the turn case with a curvilinear slope.
In an “optimal situation”, eco-driving should be assured if the driver starts to decelerate without braking at the SPD point and then reaches the MSP point at the exact indicated speed on this speed sign.
Our methodology is based on the determination of the optimal maneuver distance from the decelerating point to the sign position or speed-sectioning point, to be able to propose a technical modification of the road signalization that optimizes eco-driving. The optimization involves the opportunity to decelerate without using brakes and reach the sign at the required speed. However, this is just an opportunity and this work does not consider the diversity of driver behaviors.
Two evaluations of the eco-driving road level are proposed. First, a simple criterion, independent of the vehicle characteristics, is based on the mean loss of total mechanical energy of a vehicle facing a speed-sectioning point. This criterion would easily be used to roughly identify speed-sectioning points that are not allowing eco-driving since it will be expressed only in terms of allowed speed, sight distance and elevation difference. Second a more complex energy expression based on the vehicle characteristics, such as mass, aerodynamic and rolling coefficients, will be developed. This expression will allow determining the optimal maneuver distance for each type of vehicle. These two evaluations means are detailed in the next sections.
2.2. Vehicle-Independent Criterion
In a first approach, a criterion is established to evaluate if a speed sectioning point can to impede eco-driving. A vehicle-independent criterion is proposed to be easily used by road managers without considering road traffic data too much.
For any case depicted in Figure 1, Figure 2 and Figure 3, with or without a slope or turn, the approaching speed of the vehicle is defined as , and the restricted speed of the sign (with the hypothesis of required deceleration, i.e. ).
In an attempt to eco-drive, it is considered that the driver decelerates without braking over the distance separating SPD and MSP positions, and that he reaches the MSP position at the exact speed.
The criterion is built on the dissipation of mechanical energy along the decelerating distance. For a given vehicle of mass m, this dissipation of energy is decomposed into kinematic and gravitational potential energies:
and the kinematic and potential energies are then expressed only as a function of vehicle mass and speeds, and , and vehicle altitudes, and , at the SPD and MSP positions.
To be more conveniently used by road managers, the criterion should be independent of the considered vehicle.
If we consider that the car-specific dissipation forces are related to the weight, particularly the rolling and air resistance, a dimensionless criterion can be built by dividing the total energy by a decreasing part of the weight over the maneuver distance.
This criterion, named Energy Alert Speed Management (EASM) and noted , is then proposed by the following relation:
The logarithm function is used to take into account the dominant aerodynamic drag, which decreases as the vehicle decelerates.
The criterion can be developed as a sum of a kinetic part and potential energy part:
For road managers, a low value of this criterion indicates a better eco-driving potentiality of a given speed sectioning point. Nevertheless, in the following section, a more accurate energy evaluation is developed for specific vehicles.
2.3. Energy Evaluation of a Speed-Sectioning Point
In this section, the energy-saving assessment is estimated for an optimal speed-sectioning point. This energy takes into account the vehicle dissipating forces and the traffic composition.
The vehicle is modelled as a point undergoing natural deceleration from to . The applied forces are:
- The aerodynamic drag: , with being the air density, S being the frontal surface, being the drag coefficient, being the apparent wind (assumed to be equal to the vehicle speed);
- Rolling resistance: , with m being the mass, g being the gravity, being the rolling resistance coefficient;
- Internal forces of the vehicle: (frictions and motor resistance, auxiliaries);
- Gravity forces: , with being the slope angle in radians.
By applying the fundamental principle of dynamics, the acceleration can be calculated as:
that can be of the form:
with and .
Without variation in the slope, the analytical solution is:
with , , .
The position x is given by integration:
with .
With the condition the time taken by the vehicle to travel the distance is:
At last, the energy that can be saved by an optimal speed-sectioning is:
In this ideal eco-driving friendly situation, the vehicle reaches only through natural deceleration. This saved energy can be converted into saved CO2 emissions, either by using classical conversion factor or by taking into account the traffic impacted by this configuration. This saved CO2 quantity is denoted as .
3. Experimental Case: A New Road Project in Nantes Métropole
In a research collaboration with the French Nantes Métropole city, our methodology has been applied in a real road project in the suburbs. This project is taken as a simple application example, since its realization is not yet validated. It gives us some general hypothesis, such as speeds, distances, and traffic.
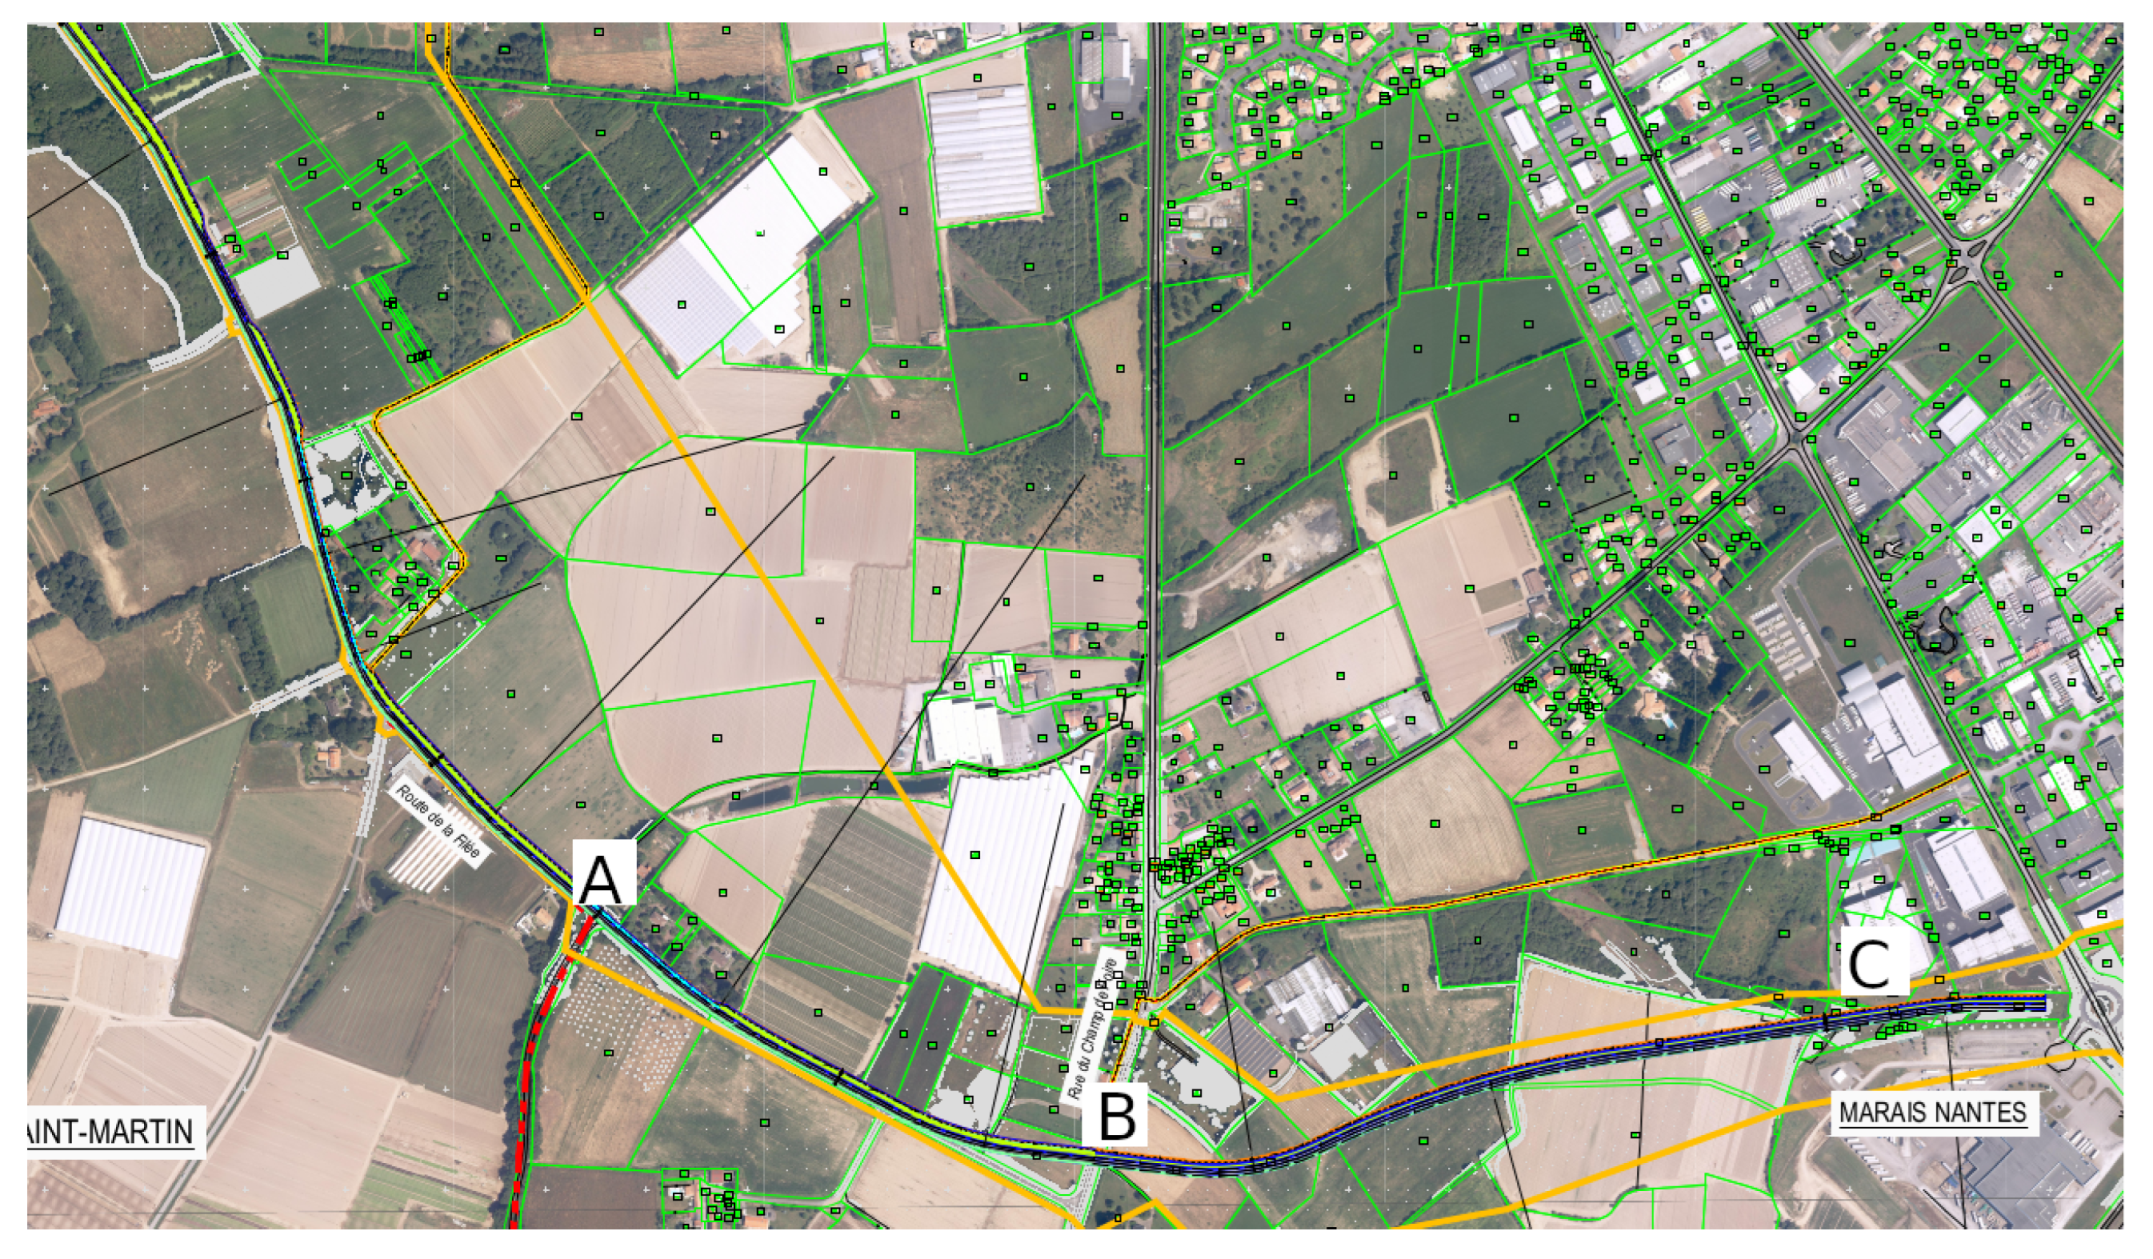
After the first phase of variants selection, the retained geometry is given in Figure 4. Over this geometry, the present work is focusing on two sections: the existing section from A to B in Figure 4 and the projected section from B to C. The junction at the B point is supporting a principal traffic from A to B of around 7700 vehicles per day and a secondary traffic of 2100 vehicles per day on the crossing road at the B point. Two hypotheses for the junction are considered, either a roundabout or a simple crossroad with a stop sign on the transverse branch.
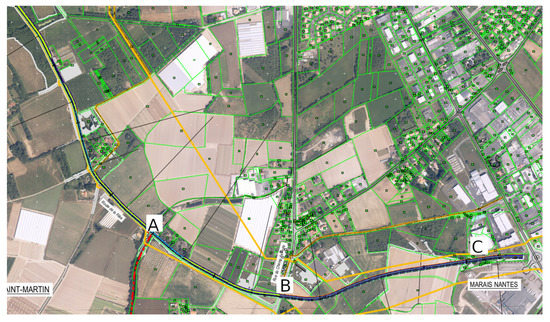
Figure 4.
General plan of the circumvention road project.
At first approximation, there is no longitudinal slope on the two roads in the junction vicinity. Therefore, our modeling effort will first be focused on vehicle speed, road layouts in horizontal plane, and related eco-driving opportunities. Nonetheless, simulations will be worked out for longitudinal slopes varying from −4% to 4% by 2% increments, in order to apprehend eco-driving assessments in case of possible road geometry of the definitive project.
Both the criterion and the energy-saving evaluation require knowledge of the variation in elevation of the vehicle, either explicitly for the criterion in Equation (5) or indirectly for the energy evaluation via the longitudinal slope in Equation (6).
Our research is applied to a road project without slopes and to project variations with fixed slopes from −4% to 4%. To apply our methodology on a yet already built road, the variation in elevation could be measured from onboard systems. Usually, GNSS systems are used for vehicle position and speed acquisition. In [21], a differential GPS-RTK system has been used for an experimental campaign in France, and a simple non-differential GPS for a campaign in Bosnia. The z-axis precision of a differential GNSS system is decimeter (about 0.3), which is sufficient, but the z-axis data for the Bosnian campaign are reported to be filtered due to a lack of precision.
Nevertheless GNSS systems may not be sufficiently reliable in some situations because satellite signals are easily obstructed by trees and buildings and multipath signals may affect position computation. Therefore, this absolute sensor could be associated with dead-reckoning sensors such as inertial measurement units (IMU). Signal obstruction of the absolute GNSS system and measurement drift of the inertial system are weaknesses that can be overcome by a complementary usage of these two techniques, by data fusion [22]. Inertia and GNSS data fusion is especially important for autonomous vehicle to ensure a safe driving [23]. By extension other sensors can be added to the data fusion process, such as cameras or LiDAR [24]. These means should be considered for the application of our methodology to hilly terrains or dense urban areas.
In the next section, the criterion and energy gains are computed for these two geometrical hypotheses and several usage cases, such as allowed speed and signalization positions, and for various slopes cases. Results are given in energy gains and in CO2 emission equivalent .
4. Modeling Parameters from Experimental Conditions
In this section the road junction (“B” point on Figure 4) is detailed in terms of allowed speeds and sign implementations, that is, usage and infrastructure configuration terms. Then, the eco-driving potential associated with each of these configuration/usage sets will be evaluated in first approximation by the means of the simple criterion .
4.1. Manoeuvre Distance Hypothesis
Two distances between the speed sign and the intersection are considered: 100 m and 200 m, chosen from French Road rules. Two sight distances are taken into account: 100 m and 300 m.
4.2. Traffic Hypothesis
The traffic is considered to be 4000 vehicles per day on the new road segment, 7700 on the old road segment, and 2100 on the two segments of the transverse road.
Computations were performed for a diesel passenger car since heavy vehicles are not permitted on this circumvention, and diesel vehicles are dominant in the French vehicle market. The characteristics of this vehicle are recalled in Table 1 with data from [25].

Table 1.
Characteristics of an average diesel vehicle.
4.3. Case Study Definition
The existing segment on the principal road, from A to B is named ES. The new segment from B to C is named NS. Then the transverse road is named TR.
The crossroad case is named CR and the roundabout case in named RA. The first speed case is of 50 km/h on ES and NS segments; the second speed case is of 70 km/h on ES and 70 km/h on NS. These cases are named V5050 and V5070.
Then, the eight geometrical configurations:
- C1: RA (roundabout), V5050, position 100 m on ES, NS and TR;
- C2: RA, V5050, position 200 m on ES, NS and TR;
- C3: RA, V5070, position 100 m on ES, NS and TR;
- C4: RA, V5070, position 200 m on ES, NS and TR;
- C5: CR (crossroad), V5050, position 100 m on TR;
- C6: CR, V5050, position 200 m on TR;
- C7: CR, V5070, position 100 m on TR;
- C8: CR, V5070, position 200 m on TR.
The indicated position is the distance from the information sign to the junction (crossing or roundabout). The manoeuvre distance, effectively used by the driver to decelerate, is the sum of this “position” and the sight distance.
Facing these junction configurations, vehicles can have several usages. The most noticeable usages are presented in Table 2. The first usage hypothesis considers the driver’s sight distance, whose values considered here are 100 m and 300 m. The vehicle can reach a roundabout or a crossing, so it should lower its speed to 20 km/h (speed hypothesis at the entrance of a roundabout) or to 0 km/h (stop panel case), or to 50 km/h while initially travelling at 70 km/h.

Table 2.
Definition of the usage cases.
In this table, the usages that do not require a deceleration are not specified. Turning situations are generally not taken into account either, since the set of geometry/usage combinations is already large for a single junction, and its aim is to illustrate the optimization method. Larger applications could justify the use of micro-traffic simulations [26].
4.4. Criterion Values Facing Road Usages
In this part, each usage combination of the junction is evaluated by the criterion . As previously indicated, this criterion has the unique aim of helping the road manager in the predetermination of geometrical configurations and usages of speed-sectioning points that can impede eco-driving.
Table 3 shows results for the 20 usage cases. Its columns are constituted by the configuration and usage label, the approaching and limited speeds and , the distance of the pre-signalization sign from of the speed-sectioning point, the visibility distance of the driver on this sign , the manoeuvre distance , and lastly, the criterion .

Table 3.
Criterion values for each usage case and for the first hypothesis of a zero slope.
It appears that cases involving high speed and low speed are associated with high criterion values, ranging from 6.8 to 7.7 for the C3.U2, C4.U6, and C3.U6 usage cases, all of them with speed of 70 km/h and speed of 20 km/h.
Reductions in speed from 50 km/h to 0 km/h or 20 km/h are associated with intermediate criterion values varying from 3.1 to 4.3. The lowest values are associated with longer maneuver distances , for otherwise common speed cases.
Reductions in speed from 70 km/h to 50 km/h lead to similar values as for the last group of speed cases, with values varying from 3.5 to 4.1.
As a first conclusion, the criterion is able to separate speed cases into several value classes. Nonetheless, the relevance of the criterion will be verified by the means of an energy-saving assessment in the next section.
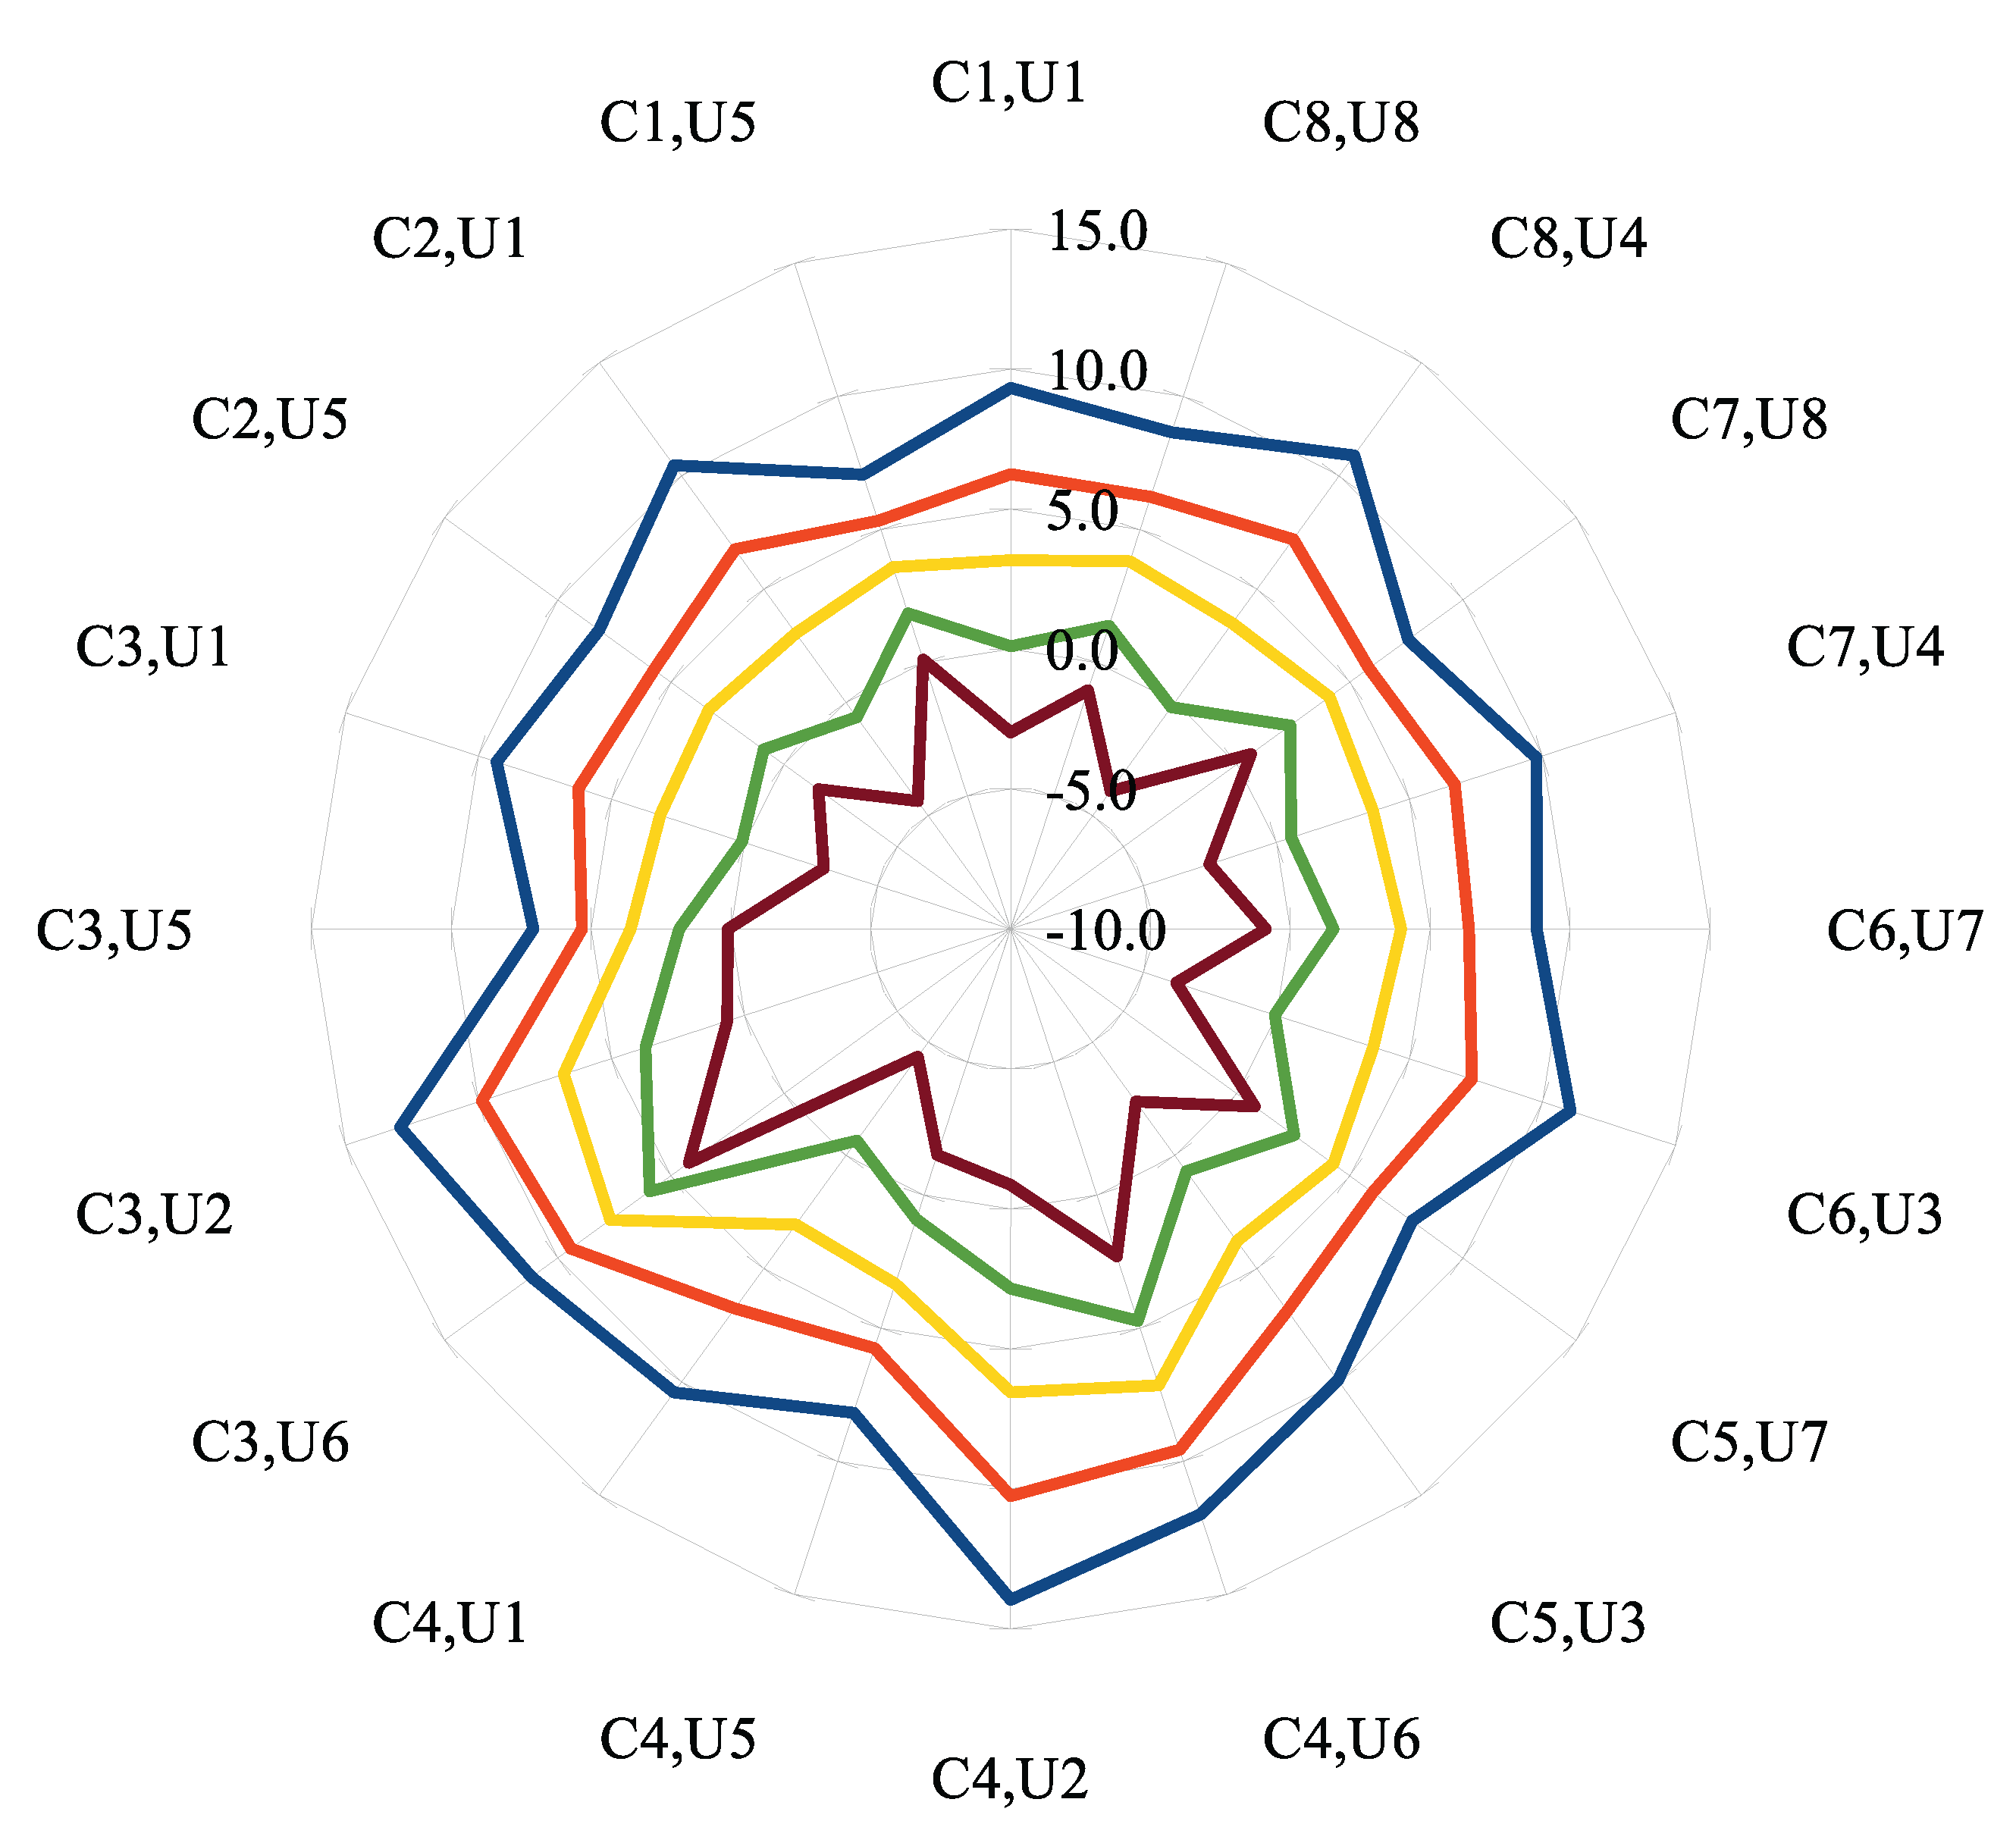
In anticipation of a possible non-flat road project and to illustrate the criterion’s relevance in the face of slope variations, Figure 5 presents the criterion value evolution for slopes varying from −4% to 4% with 2% increments for the entire set of configuration/usage cases.
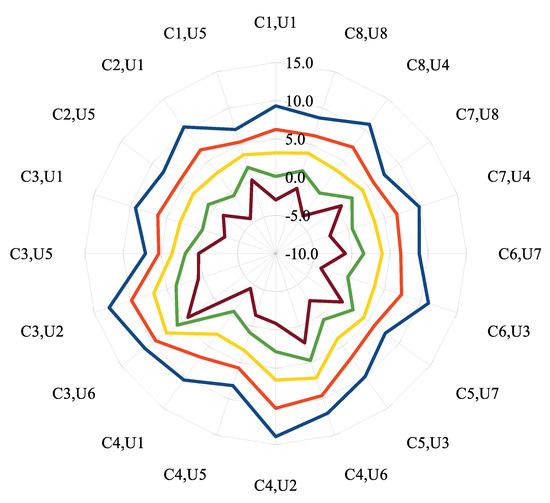
Figure 5.
Criterion values for each usage case and for five slope hypotheses from −4% to 4% with 2% increments.
As a result, increasing the slope from −4% to 4% always decrease the criterion value for each slope increment of 2%. However, compared to the flat case (yellow curve), the variation of the slope does not have a homothetic effect on each usage case. For example, for the C4.U2 case, the criterion value is increasing in a larger proportion with negative slopes than for the C7.U8 case. Indeed, for this example, C4.U2 consists of deceleration from 70 km/h to 20 km/h over a maneuver distance of 500 m, and this large deceleration requirement, even over a long distance, remains difficult to achieve on a −4% slope without braking. The C7.U8 consists of a smaller deceleration from 50 km/h to 20 km/h over a short maneuver distance of 200 m, so it appears to be less sensitive to the slope intensity.
5. Results: Energy Savings Assessment for Several Slopes Projects
5.1. Modeling Results for a Road Set without Slopes
In this section, the 20 configurations and usage combinations from Table 2 are considered in the project’s first hypothesis of horizontal road segments, with a zero slope.
For each usage case, Table 4 lists at first the input parameters such as speeds and maneuver distance.

Table 4.
Eco-driving assessment results for the whole set of configuration/usage: 0% longitudinal slope case.
Then, below the “initial scenario” label, computed values are given for the time taken by the vehicle to travel the distance , the , and the energy value. These quantities are defined in Equations (10) and (11).
Labels “NC” in the table indicate that, while decelerating, the vehicle has reached a 0 km/h speed before reaching the speed sign. Such situations are relative to large maneuver distances and/or small required reduction of speed. In these cases, , and are all linked and not calculable since the speed-sectioning sign cannot be reached.
If the vehicle reaches the speed sign, its speed can be either lower, equal or greater than the required speed, with a respective value of being negative, zero, or positive. Then, the is a difference in mechanical energy between the required speed and the actual speed corresponding to the input case parameters (speeds and distances).
Finally, in the “optimization and gain” column of the Table 4, the computed optimal decelerating duration and distance and given, as well as the corresponding energy gain expressed in terms of fuel liters and potential CO2 emission equivalent, . These values correspond to the optimal situation in terms of eco-driving, in which the vehicle decelerates over the maneuvering distance and reaches the speed-sectioning point at the exact required speed.
The corresponding gain, in liters per day, is based on the fuel consumption hypothesis of a light vehicle, ranging from to , while covering the and distance difference, and multiplied by a conventional vehicle traffic of 4000 vehicles per day. Then, the associated emissions are taken as a linear proportion of the energy gain (fixed emissions factor of ).
As a result, the configurations C3.U6, C4.U6, and C5.U7 are the 3 usage cases for which the initial speed-sectioning impedes eco-driving and they lead to respective energy gains of , , and L per day.
In terms of speeds, the vehicle reaches the speed-sectioning point at instead of 20 for C3.U6, at instead of 20 for C4.U6, and at instead of 0 for C5.U7.
For these three cases, the is greater than the initial distance, and their difference correspond to the length that has to be added to the maneuver distance in order to allow the eco-driving by respecting the speed regulation without braking.
Other usage cases show negative values, indicating that the initial distance is more than sufficient to reach the speed at the speed-sectioning point without braking. For example, the negative values of with the higher absolute values, such as for the C8.U8 usage case, have the more excessive values. Some usage cases have no values since the vehicle stopped before reaching the MSP point, so the obviously exceeds too.
The fact that only three usage cases lead to potential energy savings is linked to the chosen ratio between vehicle mass, which is 1200 kg for the chosen light vehicle, and the engine brake intensity, which is chosen at based on experimental measurements. It would be different if the energy evaluation were applied for heavy vehicles or with proportionally smaller engine brake values.
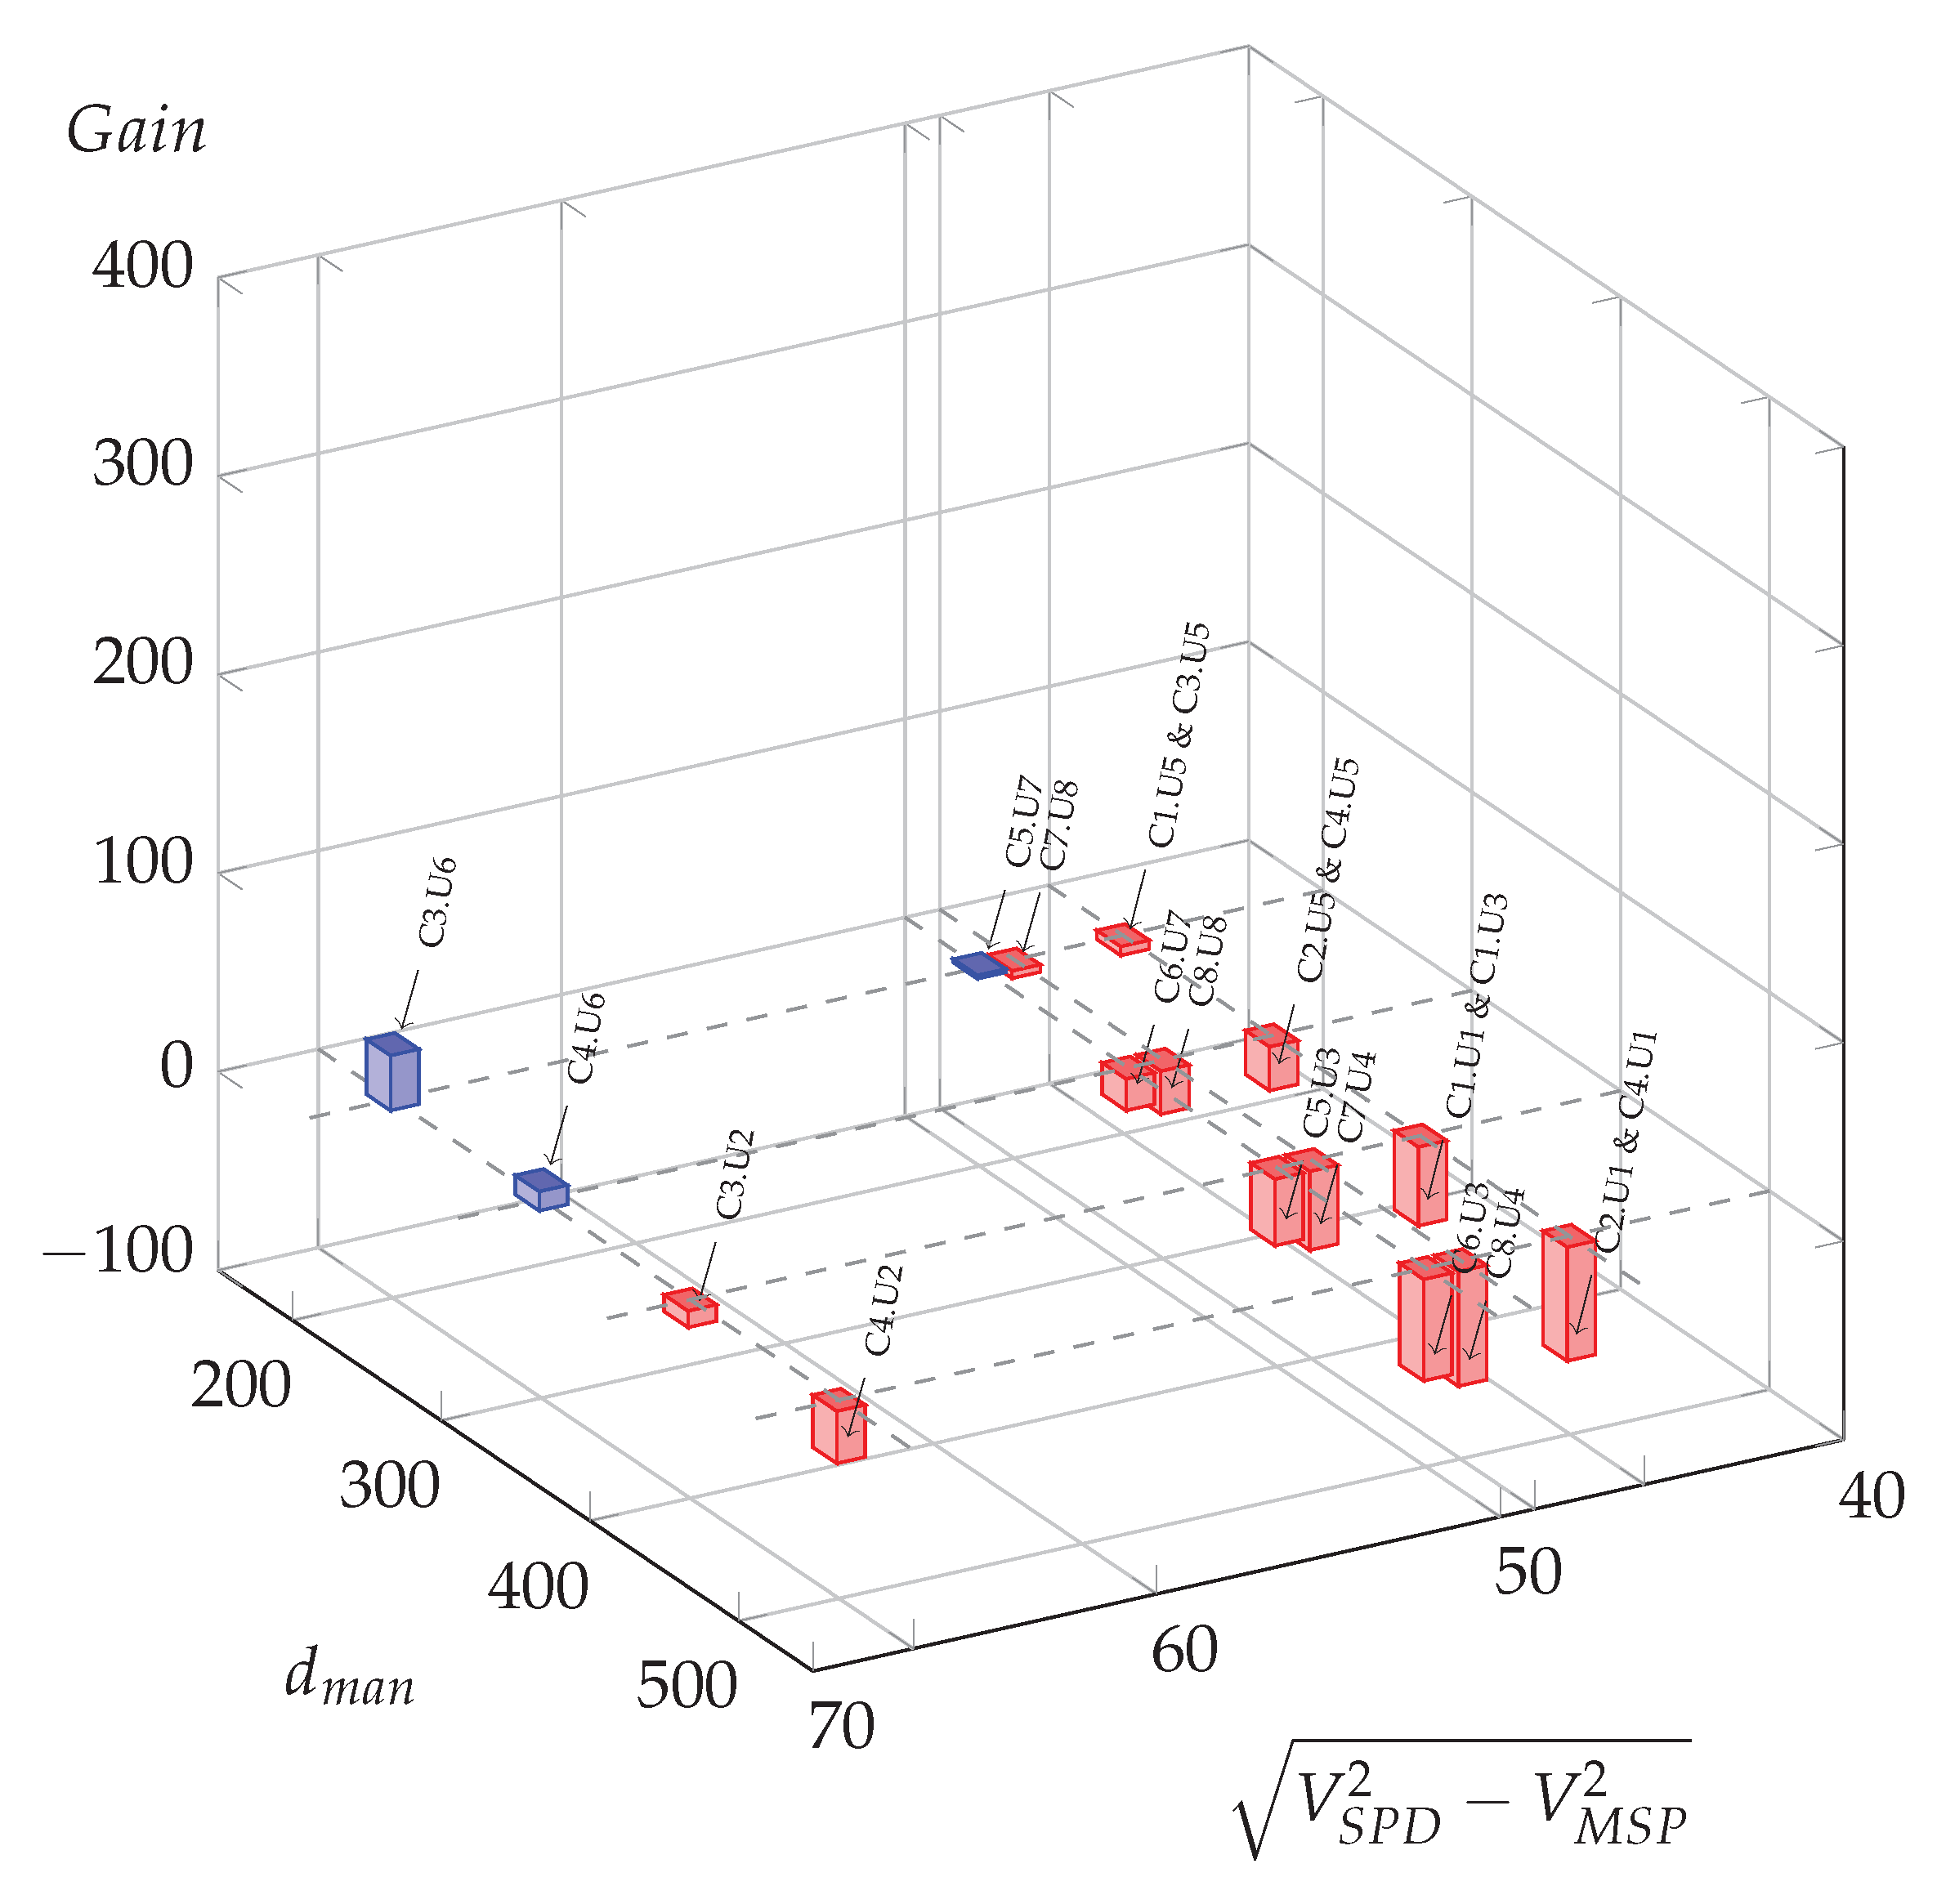
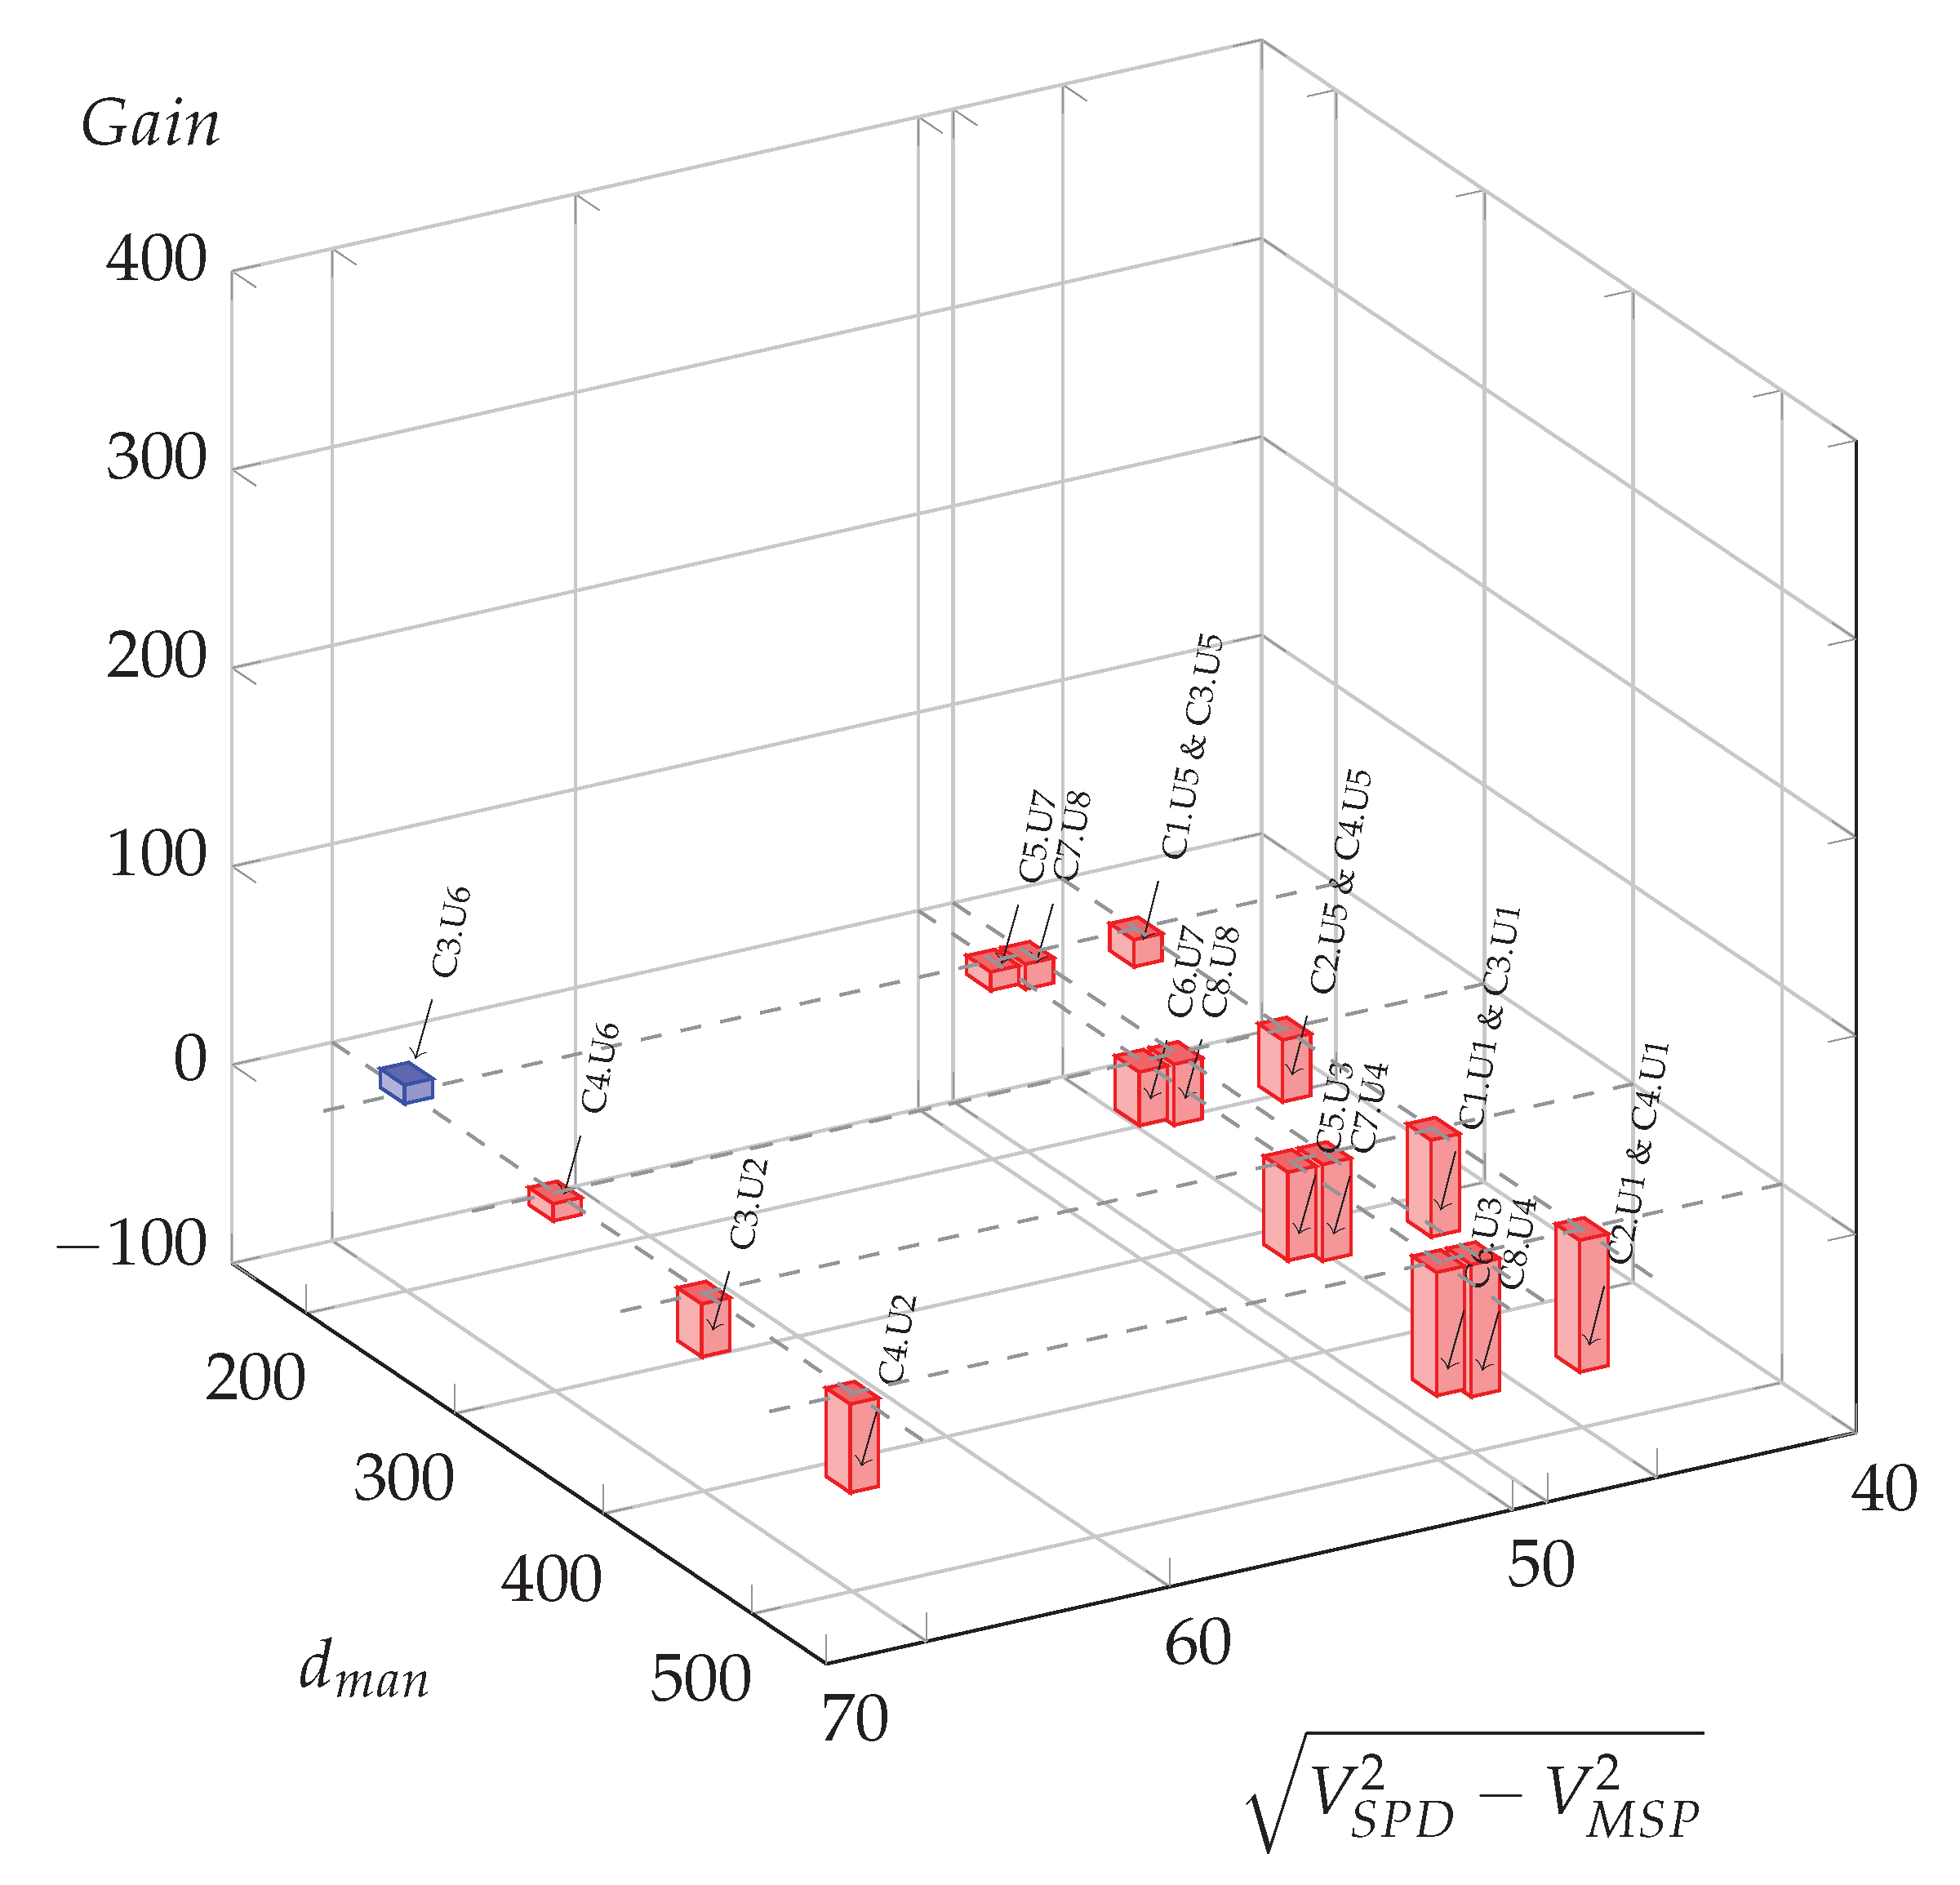
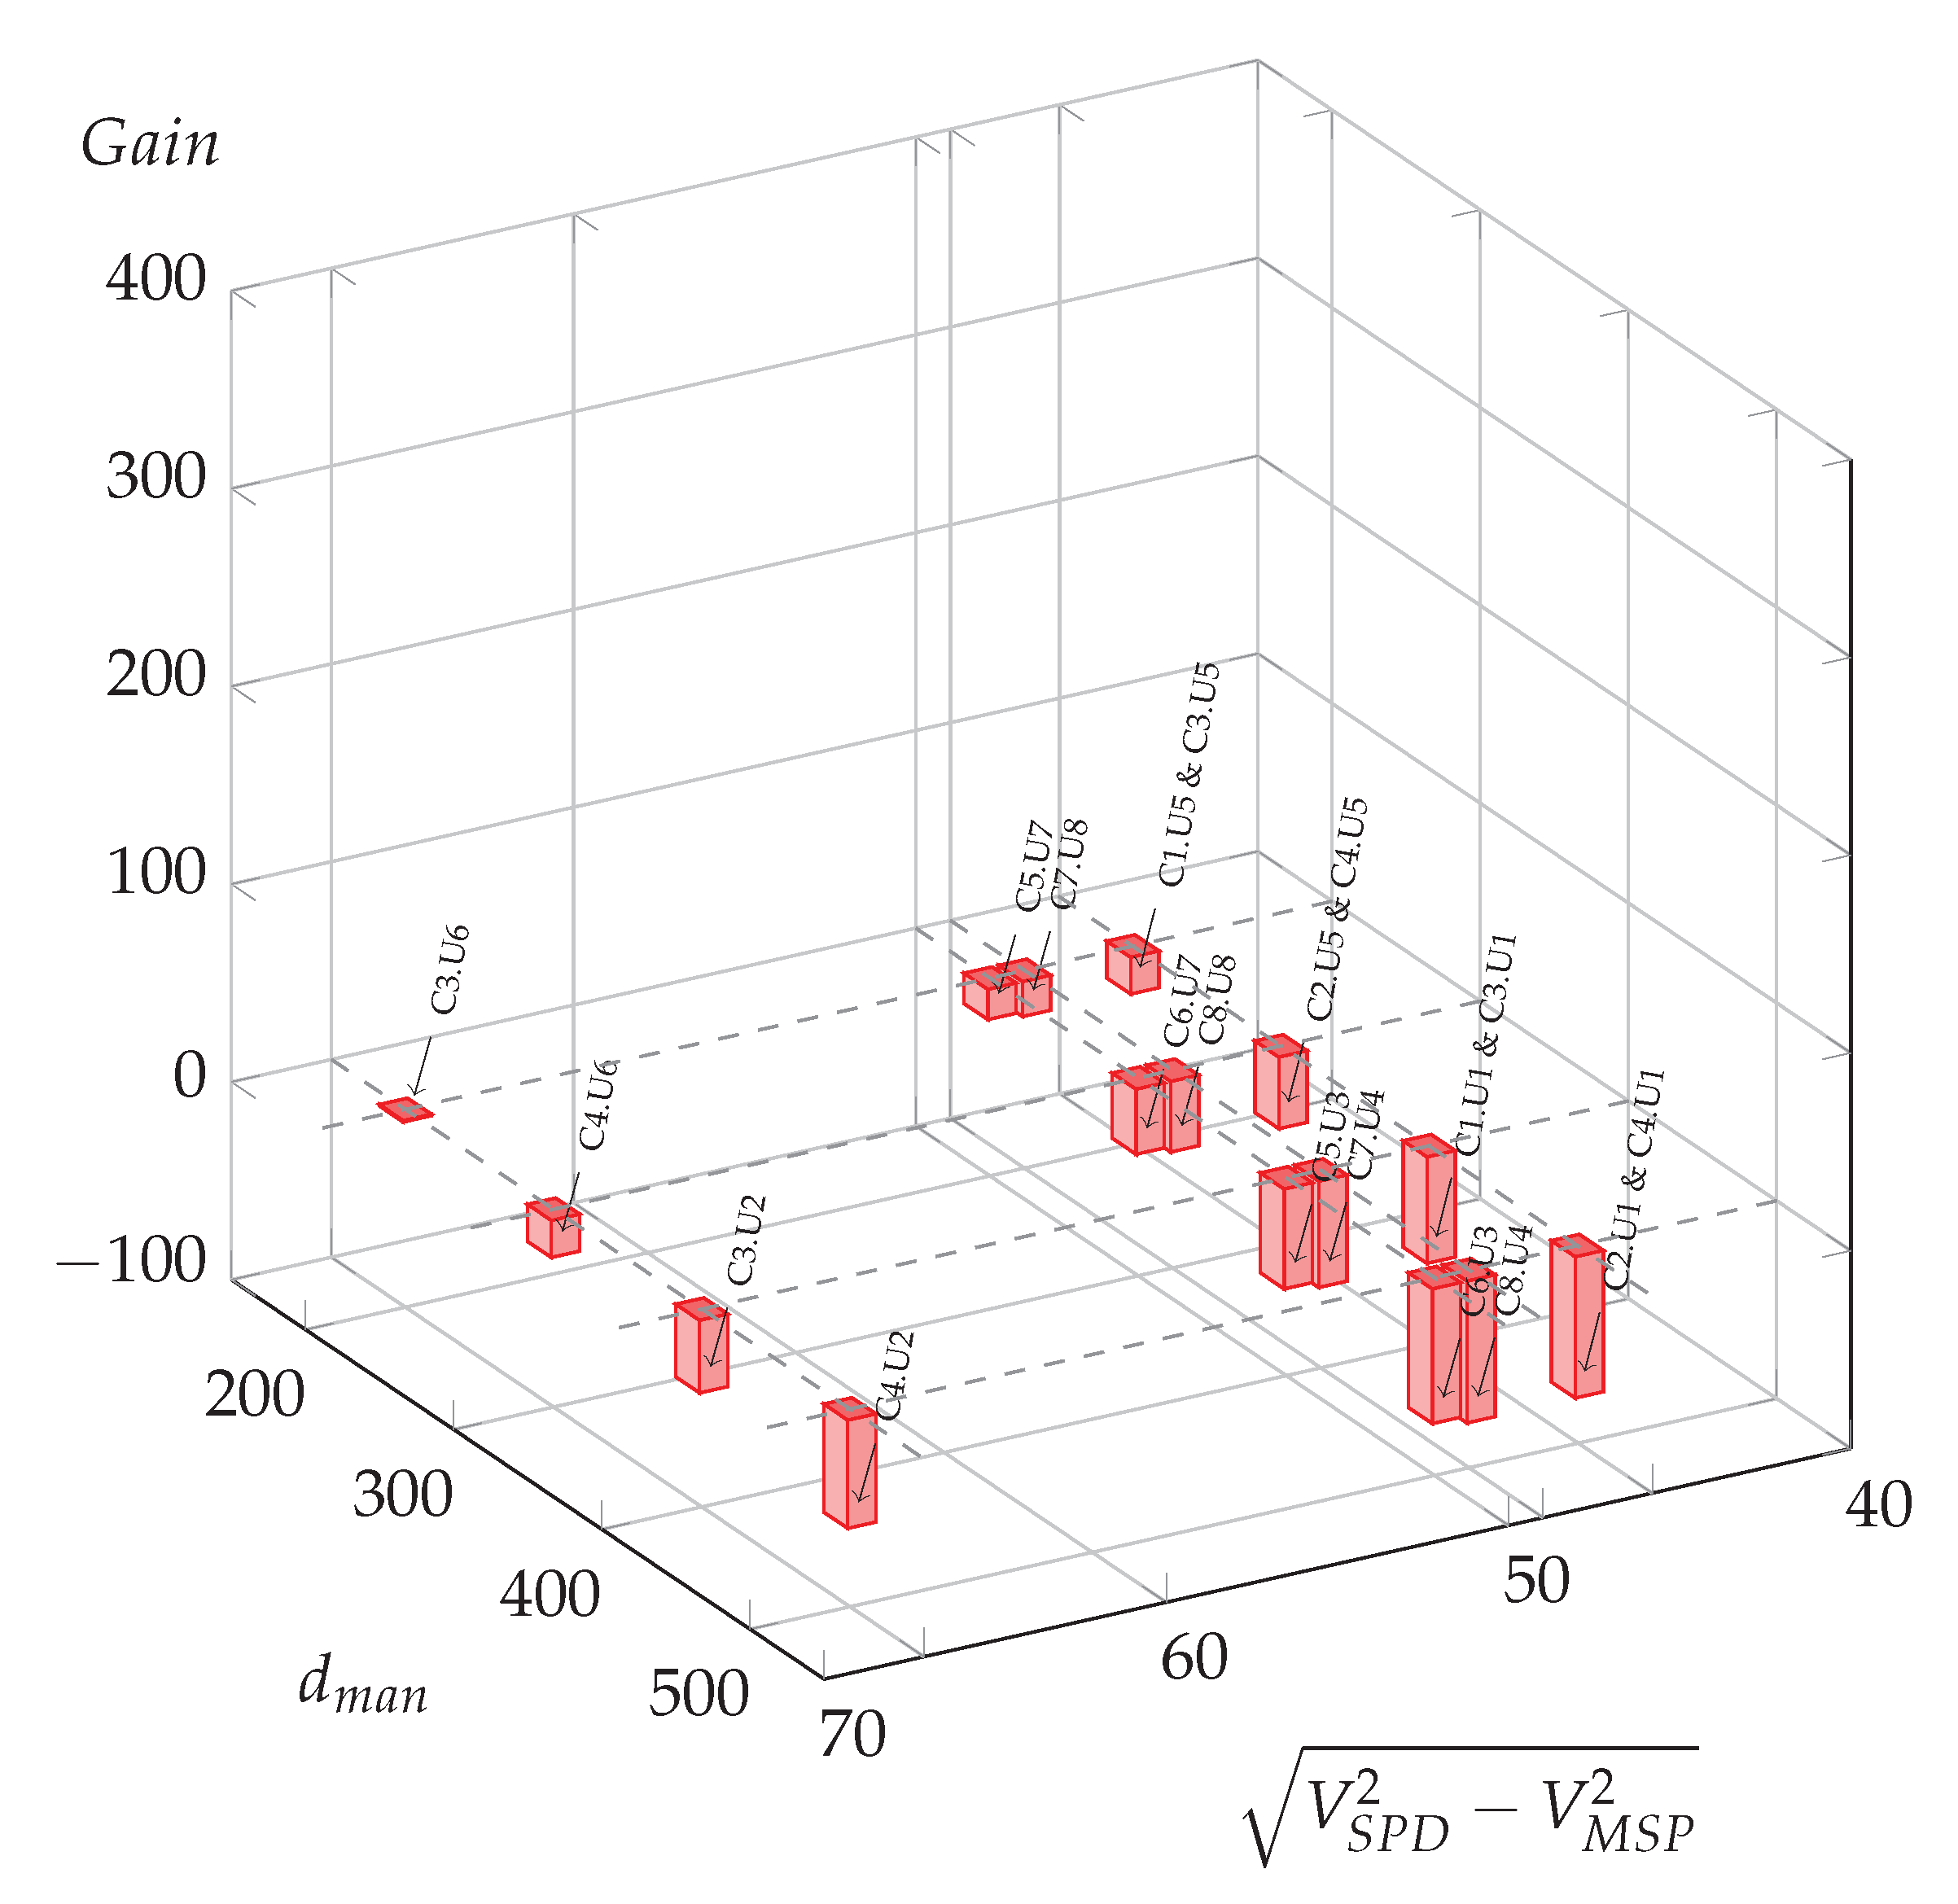
As an illustration, Figure 6 represents the three cases of effective potential energy gains in blue bars, and the cases with no potential energy gains in red bars. This figure shows the impact of the maneuver distance and the impact of the difference in speed from to , with the arbitrary form of the square root of the difference of squared speeds. As expected, low maneuver distances and large differences in speed are more prone to lead to possible optimization energy gains.
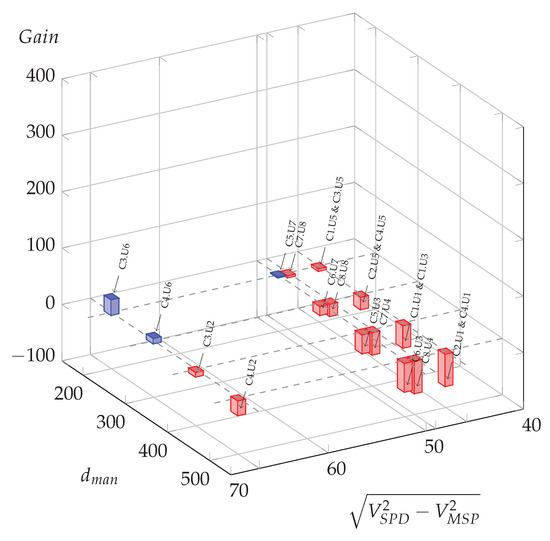
Figure 6.
Possible oil gains (L per day) for all meaningful usage cases in function of manoeuvre distance and the difference of squared speed at 0%.
In the next section, an investigation will be done on the effect of ordinary longitudinal slopes to evaluate this additional effect on speed-sectioning optimization.
5.2. Modeling Results for Roads with Various Longitudinal Slopes
As previously indicated for the criterion, in the anticipation of a possible non-flat road project, and to discuss the methodology’s application over several slope cases, the potential energy gains and associated parameters are evaluated for several representatives slopes for ordinary road conditions, ranging from −4% to 4% with 2% increments, and again for the entire set of configuration/usage cases.
The synthesis of initial situations and optimization results is given in Appendix A in Table A1, Table A2, Table A3, and Table A4, respectively for the −4%, −2%, 2%, and 4% slope hypothesis.
Table A1 corresponds to a slope case of −4%, which is a relatively steep descent, but neither rare nor exceptional. For that slope scenario, the vehicle never stops before the speed-sectioning point and, moreover, it never reaches it at a lower speed than the mandatory speed of . Therefore, the optimal distance is always longer than the initial distance. The case that requires the lighter optimization is the C8.U4 usage case, which involves deceleration from to over a maneuver distance. The optimal maneuver distance is , and without optimization the initial configuration leads to a 56.5 km/h speed instead of 50 km/h at the end of the maneuver. This case has a significant energy-saving potential of liter per day.
In contrast, the C3.U6 case requires the stronger optimization: the initial maneuver involves deceleration from to over a short distance of , leading to a speed of at the speed-sectioning point and a potential energy savings of , by enlarging the deceleration segment up to 1913.6 m. This case illustrates the joint importance of the slope, speed and speed-sectioning layout.
In Table A2, for a very ordinary slope intensity of −2%, results are more divided, with eleven usage cases leading to effective energy saving potential ranging from to , and nine usage cases that do no need optimization and lead to “virtual” gain values of to . Six of these cases even correspond to vehicles stopping with reaching the end of the distance.
In Table A3, for an ordinary ascent of 2%, eighteen cases are leading to the stopping of the vehicle within the maneuver distance. The two other cases, C3.U6 and C7.U8, both correspond to a deceleration from and a length of , but with mandatory speeds of 20 and , respectively, whereas the common computed v speed is of . Therefore, in the first case, the energy-saving potential is , and there is a potential gain of in the second case, indicating no effective potential, and no need to optimize the initial situation.
In Table A4, for a relatively important ascent of 4%, eighteen cases again lead to the stopping of the vehicle within the maneuver distance, and the two remaining cases lead to negative energy potential gains of and “virtual” liters per day, meaning that the uphill allows eco-driving deceleration in any situation, with no overspeeding at the speed-sectioning point.
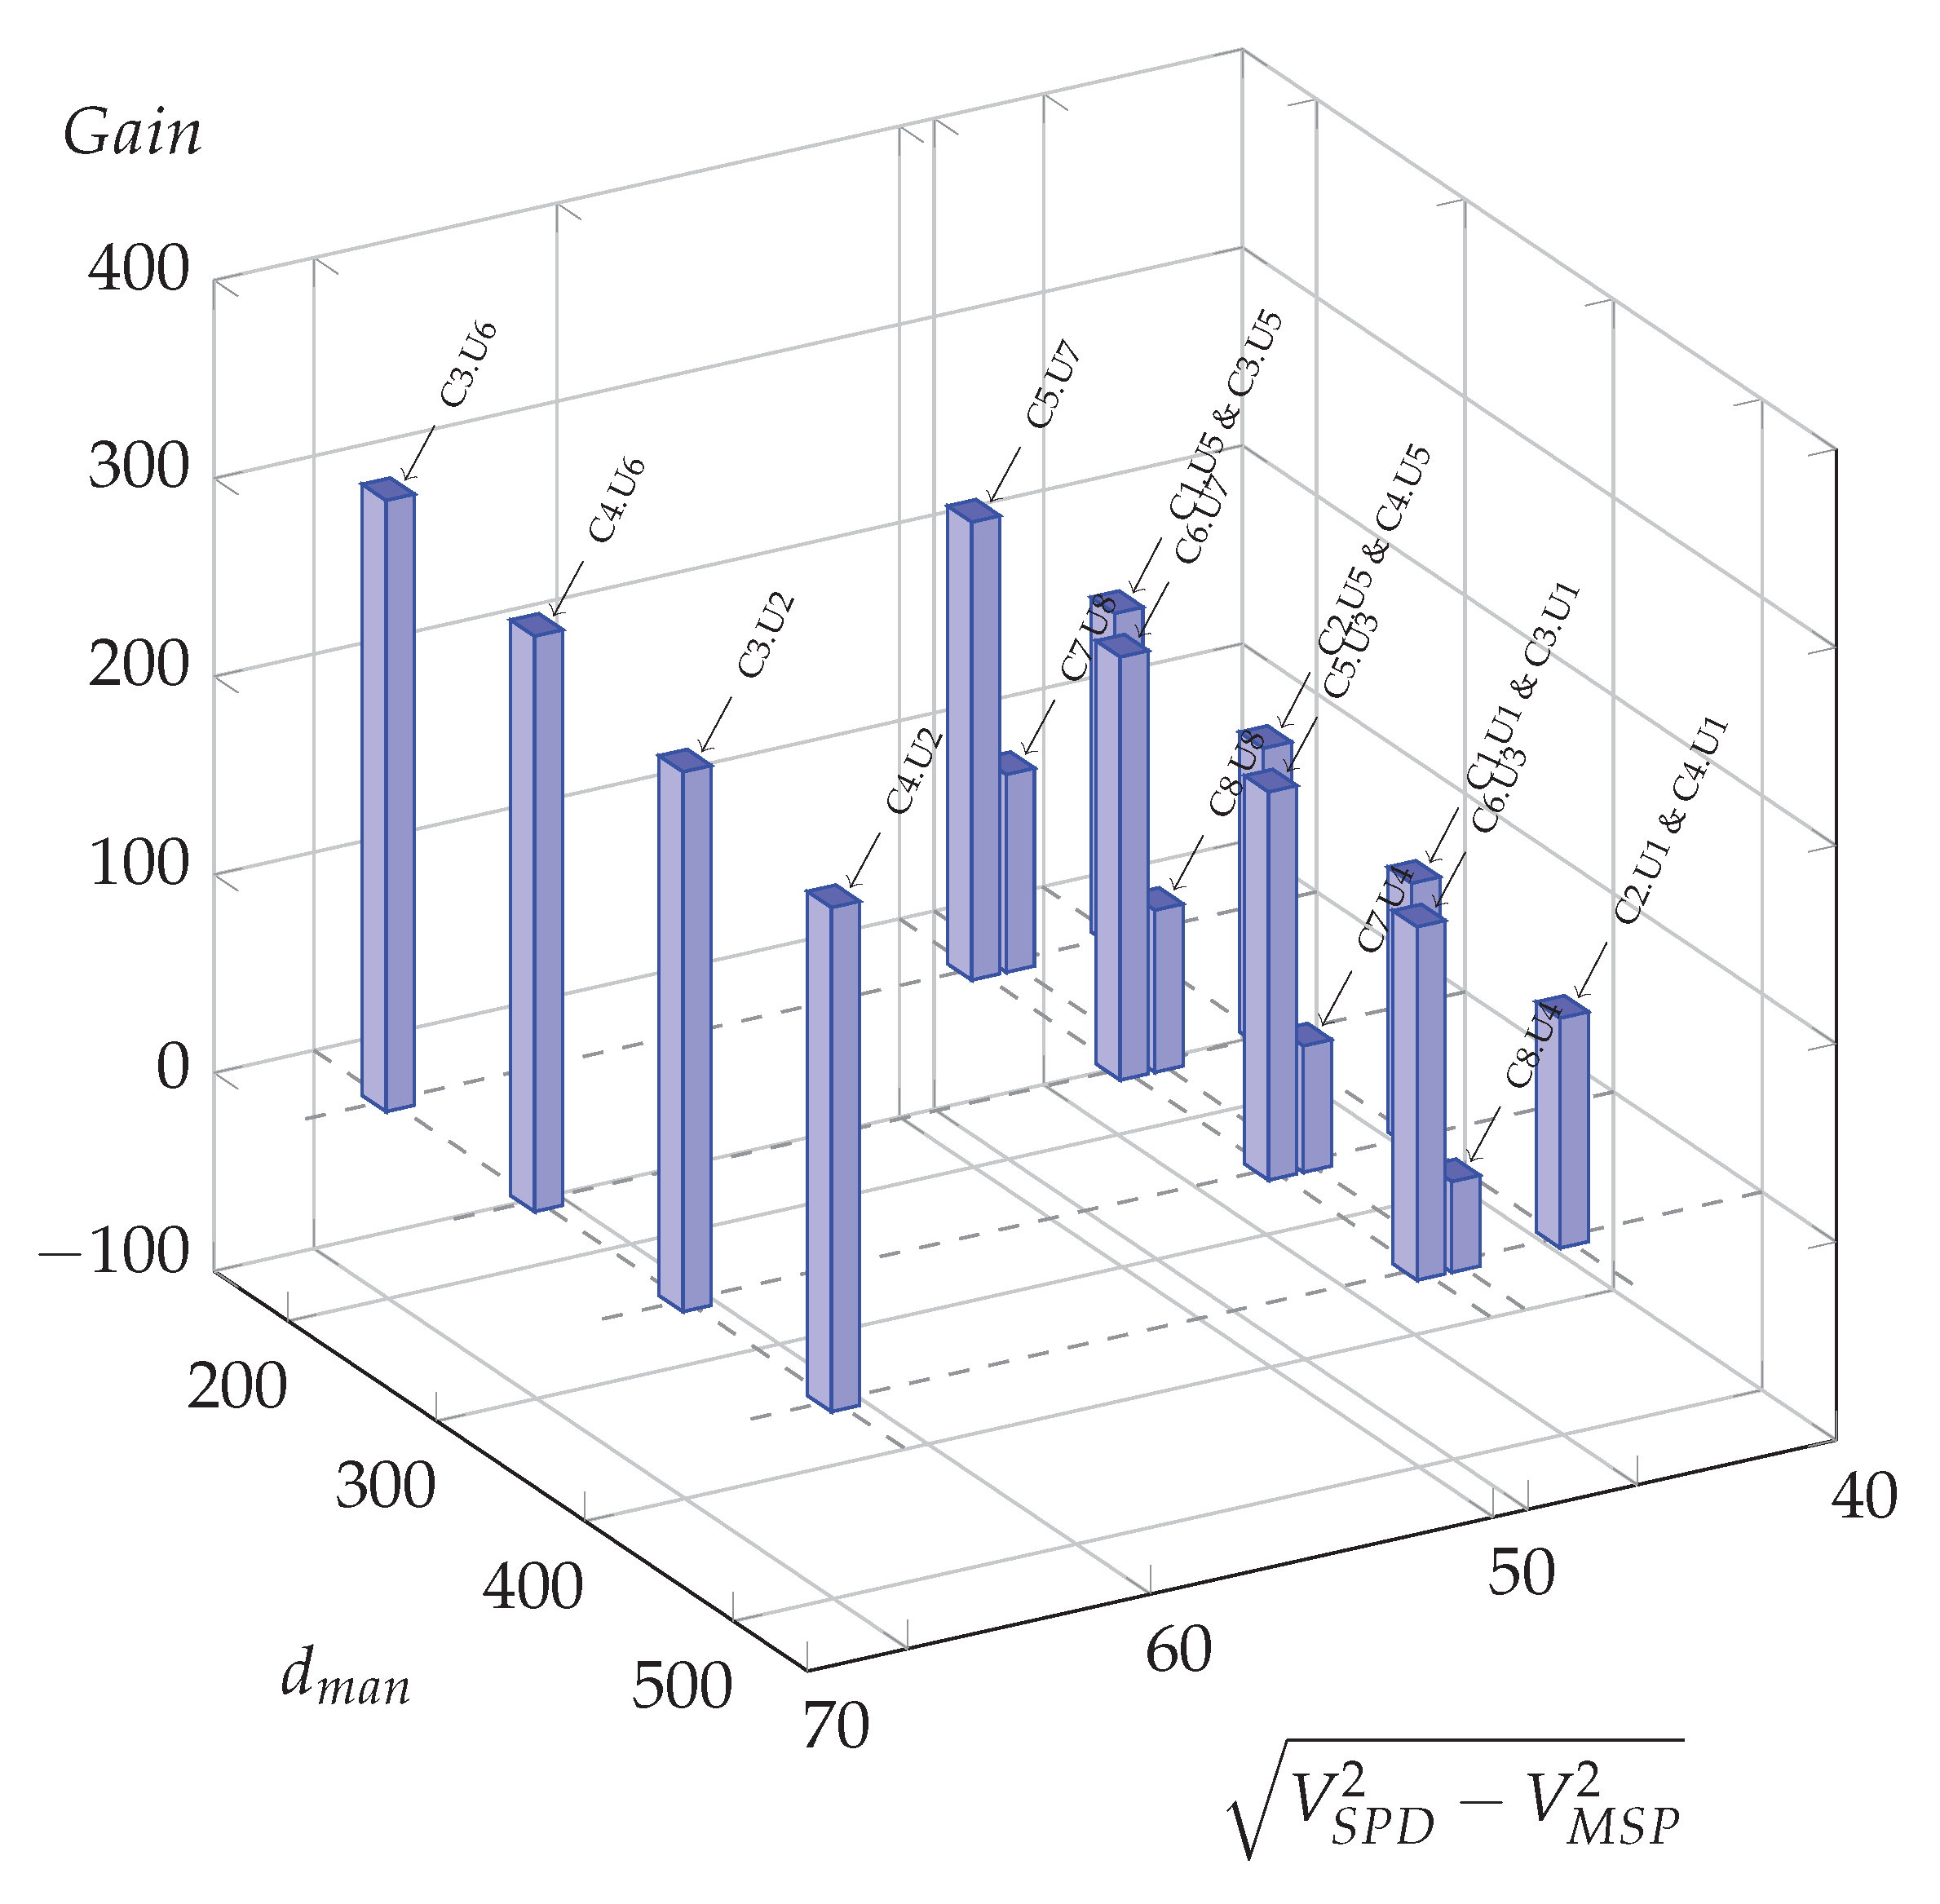
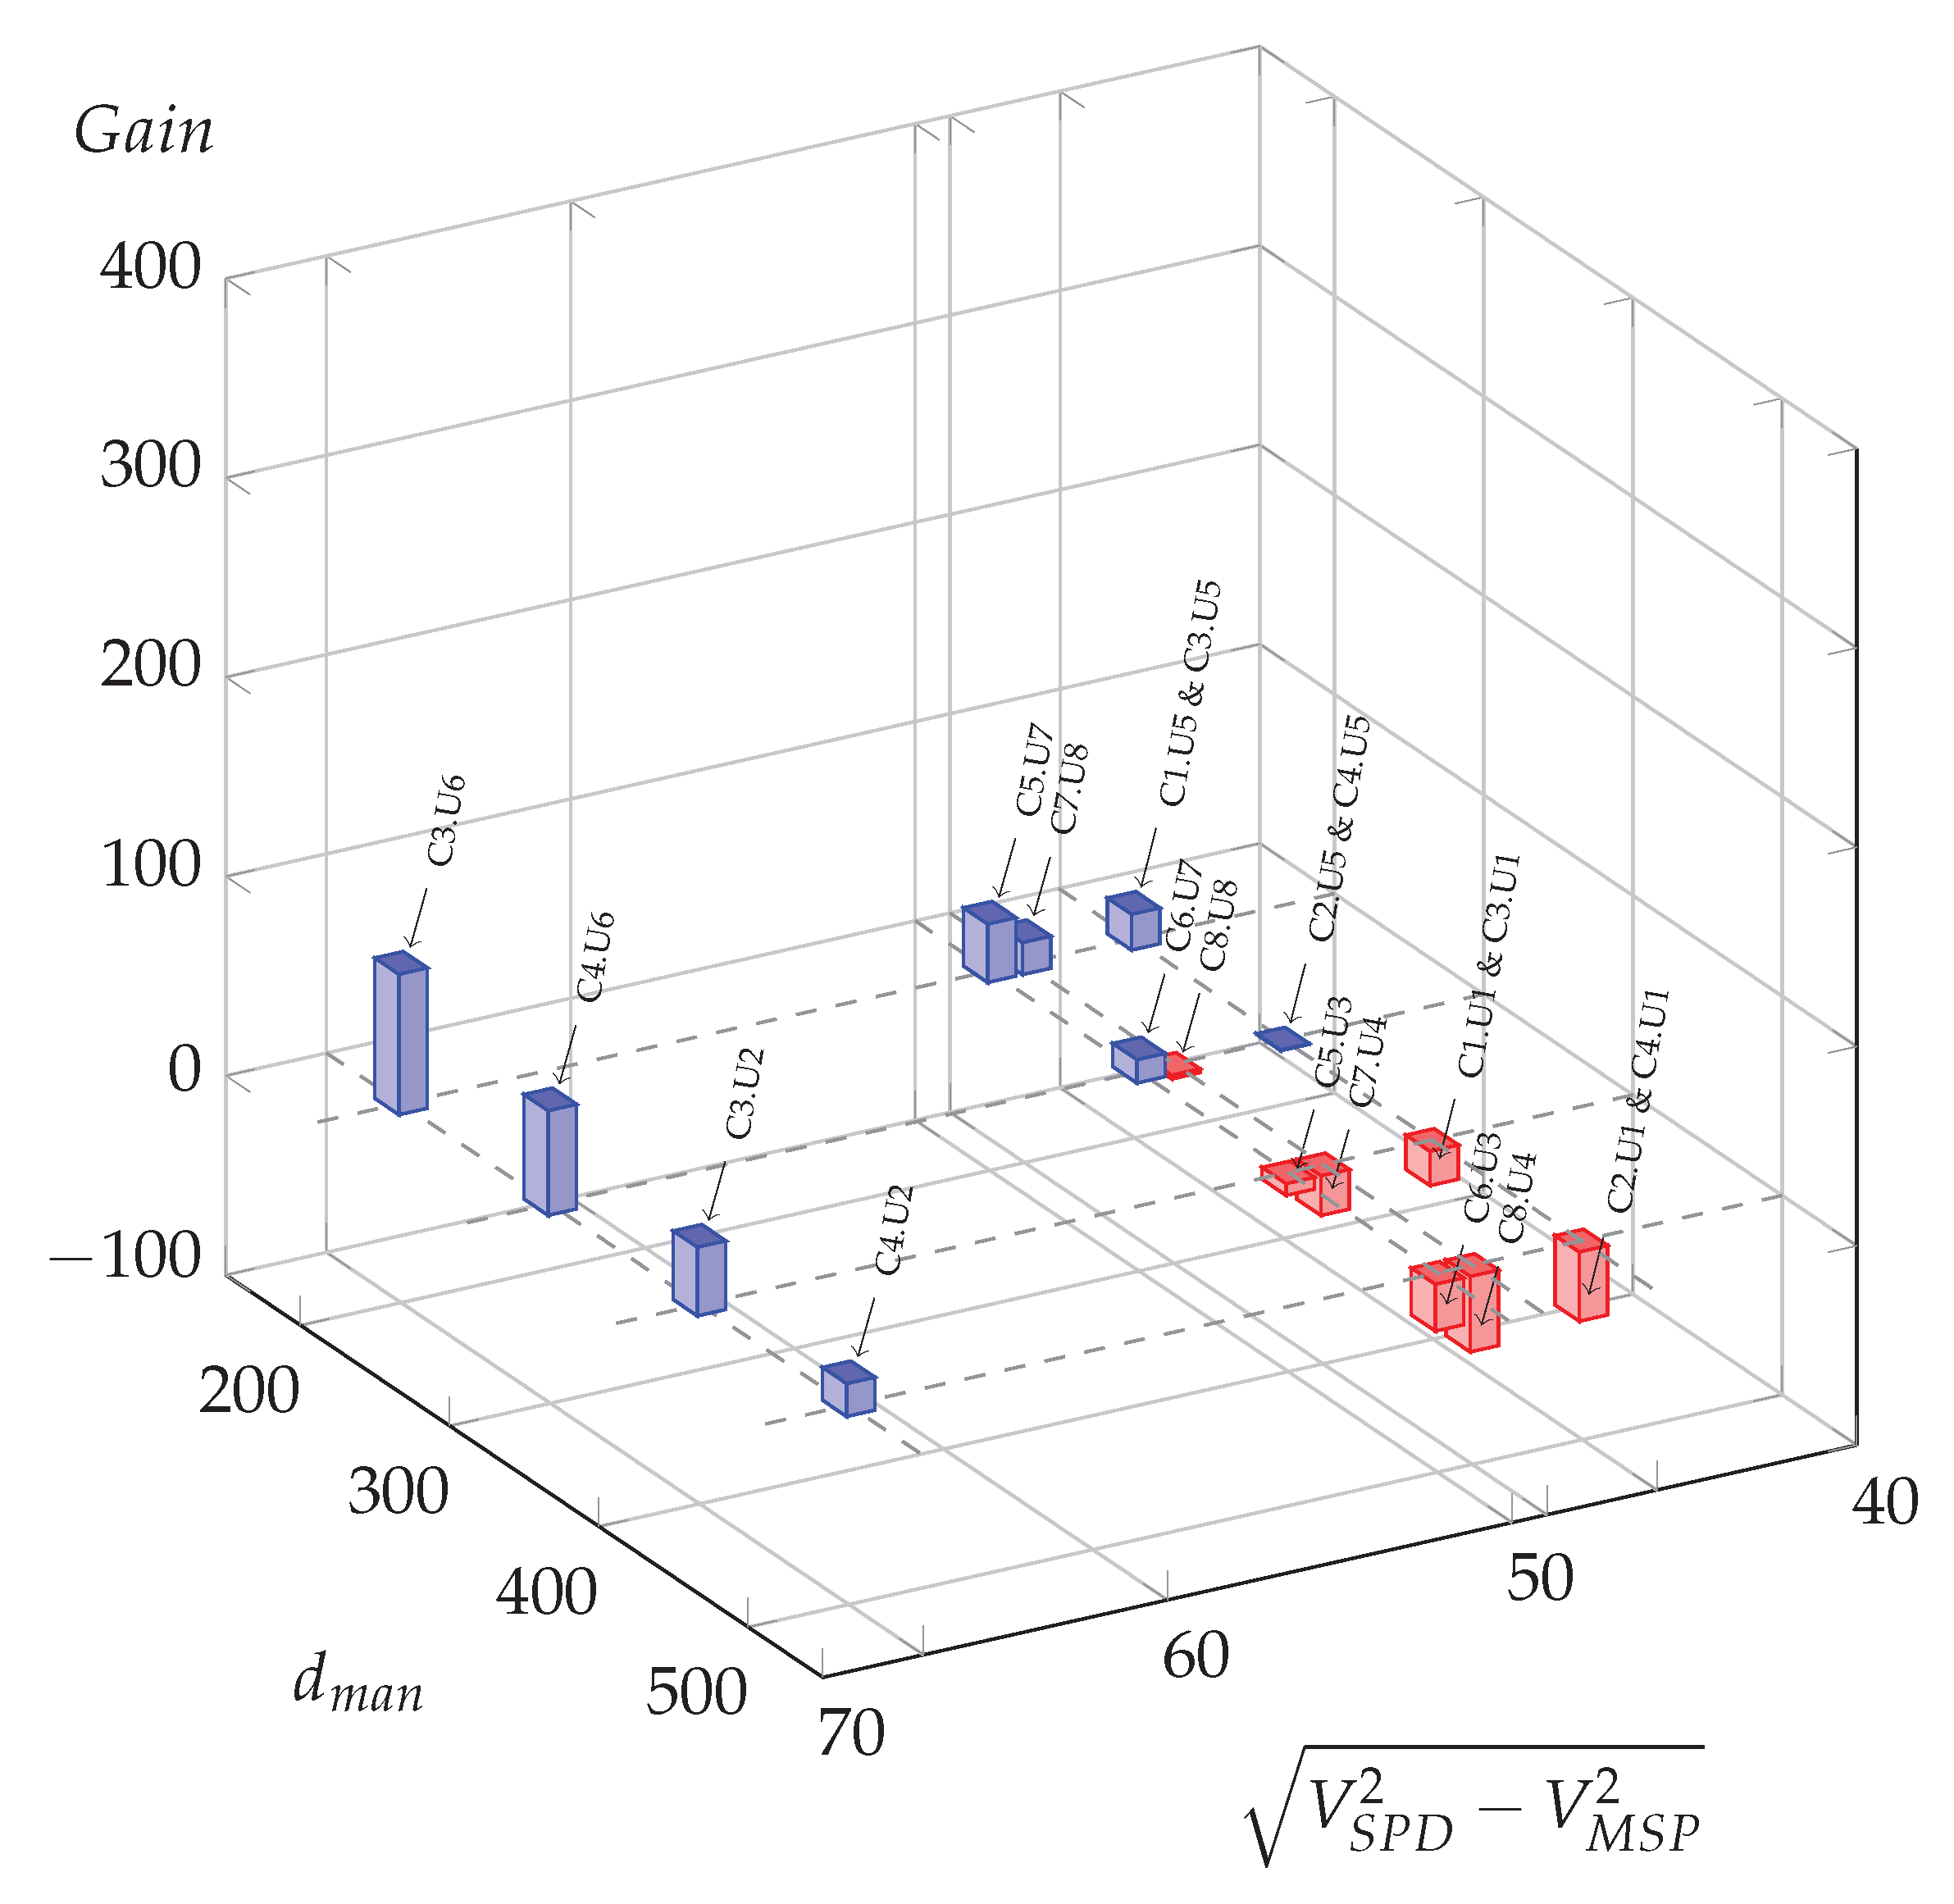
Figure 7, Figure 8, Figure 9 and Figure 10 are a graphical representation of the Table A1, Table A2, Table A3 and Table A4 results.
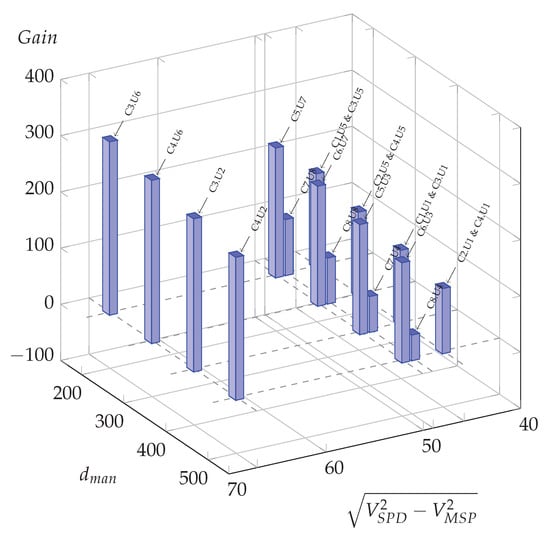
Figure 7.
Possible oil gains (L per day) for all meaningful usage cases in function of manoeuvre distance and the difference of squared speed at −4%.
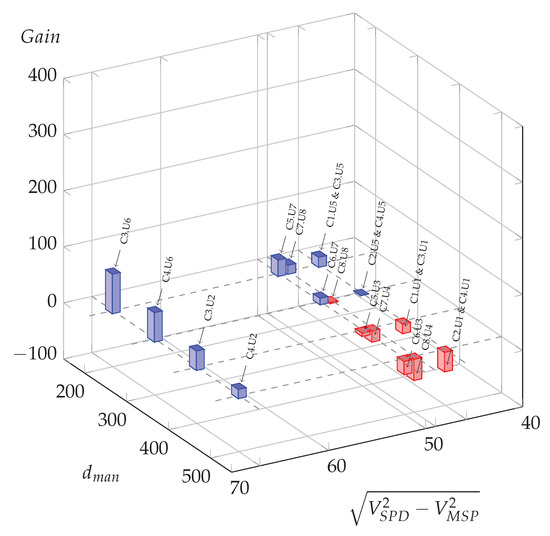
Figure 8.
Possible oil gains (L per day) for all meaningful usage cases in function of manoeuvre distance and the difference of squared speed at −2%.
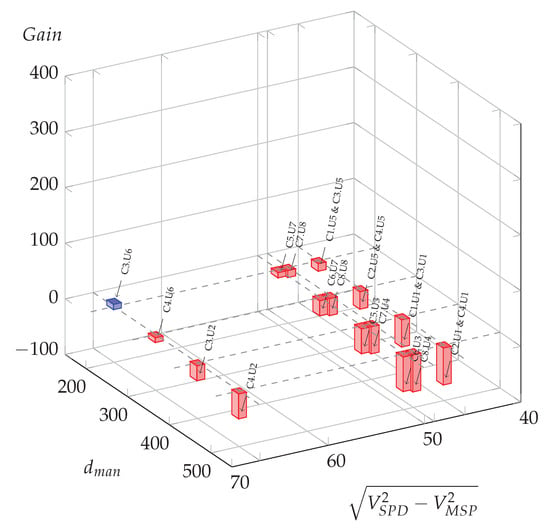
Figure 9.
Possible oil gains (L per day) for all meaningful usage cases in function of manoeuvre distance and the difference of squared speed at 2%.
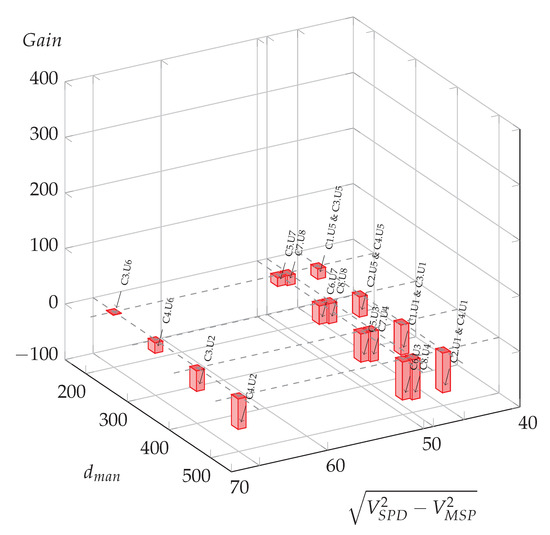
Figure 10.
Possible oil gains (L per day) for all meaningful usage cases in function of manoeuvre distance and the difference of squared speed at 4%.
Compared to the zero slope case (Figure 6), for which three situations led to potential energy savings, it is clear that all situations could benefit from optimization for the −4% slope hypothesis (blue bars), and around half of them for the −2% slope hypothesis, with a majority of them for high Euclidean speed differences and larger potential gains for the shorter maneuver distance, .
When considering a positive slope, that is to say uphill, the slope case shows only one usage case with a potential energy saving (C3.U6), and for the slope case all usage cases lead to negative computed gain, meaning that the initial maneuver distance is always sufficient to allow eco-driving.
6. Discussion
In an attempt to verify whether speed-sectioning of the road could impede eco-driving, several tools are proposed in this work for road managers. Firstly, a criterion based on road’s geometrical configuration and speed policy is proposed as a simple means of eco-driving impeding detection. Then, evaluation of the energy waste linked to the initial configuration is introduced by the expression. Lastly, an optimization is computed, leading to the computation of an optimal maneuver distance, , with an associated gain value expressed in liters per day and proportional CO2 emissions.
The criterion and modeled energetic quantities have been applied to a specific speed-sectioning point in a road project, with variations in imposed speed deceleration and maneuver distance. Although the road project is expected to be on a global horizontal plane, the criterion and the modeled quantities have been evaluated for several longitudinal slope hypotheses, within ordinary values ranging from −4% to .
The criterion alone is able to distinguish the usage case that are more susceptible to impede eco-driving, such as the C3.U6, C3.U2, C4.U2 and C4.U6 cases, which can be identified as external curvature discontinuities visible on the yellow curve of Figure 5 or as high values in Table 3. On the polar plot, the influence of road slope is easily apprehended too: the slope variation induces a rise of the criterion for each positive slope increment and for each usage case, up to values of 14 (C4.U2 case, blue curve of Figure 5); and a decrease of the criterion for each negative slope increment, even towards negative values such as for C4.U1 and C2.U1 usage cases (brown curve of Figure 5).
By using the energetic model relying on Equations (8), (9) and (11) an energetic evaluation of the speed-sectioning is given to road managers, considering the variety of speeds, distances and longitudinal slopes. As a result Figure 6, Figure 7 and Figure 8 and Figure 10 allow distinguishing the usage cases needing a speed-sectioning optimization, in blue bars, from the situations that do not impede eco-driving, in red bars. These figures show the crucial impact of maneuver distances, requirements in speed reduction, and slopes.
Moreover, Table A1, Table A2, Table A3, and Table A4 provide optimal maneuver distances, , for which a driver, using only the engine brakes, without mechanical brakes, would need to reach the speed-sectioning point at the exact mandatory speed. For example, the three cases needing optimization in the zero slope case (Table 4) lead to distances of 353.6; 353.6; 209.6 m instead of the respective initial distances of 200; 300; 200 m. So, for the first of these cases (C3.U6), a speed sign displacement of upstream could allow an energy saving evaluated at in that case with a reduction of of co2 emissions.
If optimization exists in the zero slope case, it becomes very important and systematic for descent cases, as for the −4% slope case (Figure 7), C3.U6 usage case, with energy savings gains up to and an associated reduction of of co2 emissions. Nevertheless, the corresponding speed-sign displacement should be of 1713.6 m, so an intermediate solution should be adopted, in a mix between mechanical brake requirements and maneuver distance extension.
Generally speaking, over an life cycle of an infrastructure, for the C3.U6 case and the zero slope hypothesis, more than 300,000 L of fuel could be saved over 30 years—that is nearly a tonne of CO2—if we consider the traffic of 4000 vehicles per day, and simply by moving a speed sign of .
It is even more significant with an ordinary slope of −2%, with for the C3.U6 usage case, corresponding to a sign displacement and of potential fuel savings over a 30 year infrastructure life cycle period, or 2447 t of CO2 emissions. This represents considerable savings for a relatively small and acceptable sign displacement.
In the eco-construction field, optimizing a road profile could lead to a 6% global energy gain over a 10 year period [6], taking into account both the building energy and the vehicle usage energy. Here the energy gain is either a given amount from the infrastructure point of view ( over 30 years in the preceding case), without associated building cost, or a fixed value for each vehicle. It is not possible to compare this percentage with vehicle mean consumption since it depends on the number of speed-sectioning points that can be optimized in the vehicle route.
The model allows finding the limits of acceptance for drivers, with up to 1713 m sign displacement needed to apply eco-driving rules in the C3.U6 case and −4% slope hypothesis. A trade-off should be found in such cases between acceptable sign displacement and mechanical brake requirements.
Finally, it should be reminded that optimizing speed relies on driver behavior. A driver who practices eco-driving will benefit from better speed-sectioning, but the advantage will be lower for a defensive driver (typically elderly drivers) or aggressive driver. For example, in [21], energy savings were estimated to reach for eco-drivers but less than for aggressive drivers. Therefore, our methodology, validated on slope variations, should be extended to various traffic conditions and driver behaviors by integration into a micro-traffic simulation.
7. Conclusions
This work deals with the infrequently studied influence of road speed variations on fuel consumption. Typically, speed policies are based on road safety and mobility efficiency criteria. This work aims to reduce vehicle fuel consumption by slight modifying a given road speed-sectioning and allowing eco-driving, without degrading road safety levels. The major eco-driving rule that is taken into account here is to avoid any mechanical braking during a decelerating maneuver, from the point of view of a speed sectioning point to its overpassing at the exact mandatory speed.
Firstly, a proposed criterion based on road geometrical configuration and road speed policy, is a simple means of detecting eco-driving impeding inconsistencies. It has the advantages of being vehicle-independent and quick to work out, allowing for a fast detection of road speed-sectioning inconsistency.
Then, the evaluation of the energy waste due to the initial configuration is introduced and computed. Lastly, an optimization is proposed, with an updated maneuver distance, mainly consisting of the displacement of a speed sign or the addition of an extra sign. The energetic gains associated with this optimization are expressed in liters per day and in proportional CO2 emissions.
This criterion and the optimization process have been applied to a road project in the Nantes-Metropole area to evaluate different configurations of a city road circumvention. For this practical application, 20 configuration and usage cases have been built using speed and distance parameters.
In the initial road project hypothesis, with a zero longitudinal slope, an energy saving of could be achieved with a single speed-sectioning point optimization by a speed sign displacement of only .
While considering alternative project slopes, potential energy savings become very large and systematic for descent cases as for a −4% slope case with energy savings gains up to . Nevertheless, the corresponding speed-sign displacement should be more than 1700 m, so a compromise should be adopted, mixing between mechanical brake requirement and maneuver distance extension.
An intermediate scenario with an ordinary slope of −2% leads to consistent energy savings of by a sign displacement of only , resulting in of potential fuel savings over a 30 year infrastructure life cycle period. It appears to be considerable for an acceptable sign displacement.
As a global comparison, the eco-conception of a road could lead to a global energy gain of 6%, by limiting the resulting longitudinal slopes, over a 10 year period. Here, the gain is localized to a given position, so the impact on mean vehicle consumption should require a micro-traffic simulation to extend the local gain to several gains over a route.
A study limitation is linked to the driver behavior: a driver prone to eco-driving will benefit from a better speed-sectioning, but the advantage will be lower for a defensive driver (typically elderly drivers) or aggressive driver. In perspective, our methodology, validated on slope variations, should be extended to various traffic conditions and driver behavior by integration into a micro-traffic simulation, such as the DLR-SUMO simulator. Another limitation is our hypothesis of decelerating without braking: in a constrained traffic, braking could be required to avoid vehicle interactions, and the energy savings would be lower. Again a traffic simulation could be used to take into account various traffic compositions.
So far, this research proposes a simple criterion, an energetic evaluation, and an optimization process to help road managers adapt a given road speed-sectioning to reduce the vehicles consumption while considering longitudinal slopes and sight distances.
Author Contributions
Conceptualization, C.A. and V.P.-O.; Methodology, C.A. and V.P.-O.; Writing, C.A., V.P.-O. and N.R.; Data curation, V.P.-O., C.A. and N.R.; Visualization, C.A. and N.R. All authors have read and agreed to the published version of the manuscript.
Funding
This work received the financial support of Nantes-Métropole and Université Gustave Eiffel in the frame of a research collaboration.
Data Availability Statement
Data are available upon reasonable request to the authors.
Conflicts of Interest
The authors declare no conflict of interest.
Appendix A. Eco-Driving Assessment: Results for Various Longitudinal Slopes

Table A1.
Eco-driving assessment results: −4% longitudinal slope case.
Table A1.
Eco-driving assessment results: −4% longitudinal slope case.
| Usage | Input Case Parameters | Initial Scenario | Optimization and Gain | |||||||||
|---|---|---|---|---|---|---|---|---|---|---|---|---|
| Gain | ||||||||||||
| (km/h) | (km/h) | (m) | (m) | (m) | (s) | (km/h) | (kJ) | (s) | (m) | (L/d) | (kg) | |
| C1,U1 | 50 | 20 | 100 | 300 | 400 | 32.1 | 40.1 | 55.8 | 125.4 | 1158.9 | 133.6 | 423.4 |
| C1,U5 | 50 | 20 | 100 | 100 | 200 | 15.2 | 45.0 | 75.3 | 125.4 | 1158.9 | 168.8 | 535.0 |
| C2,U1 | 50 | 20 | 200 | 300 | 500 | 41.4 | 37.6 | 46.9 | 125.4 | 1158.9 | 116.0 | 367.6 |
| C2,U5 | 50 | 20 | 200 | 100 | 300 | 23.4 | 42.5 | 65.3 | 125.4 | 1158.9 | 151.2 | 479.2 |
| C3,U1 | 50 | 20 | 100 | 300 | 400 | 32.1 | 40.1 | 55.8 | 125.4 | 1158.9 | 133.6 | 423.4 |
| C3,U5 | 50 | 20 | 100 | 100 | 200 | 15.2 | 45.0 | 75.3 | 125.4 | 1158.9 | 168.8 | 535.0 |
| C3,U2 | 70 | 20 | 100 | 300 | 400 | 22.4 | 59.1 | 143.2 | 171.3 | 1913.6 | 272.4 | 863.6 |
| C3,U6 | 70 | 20 | 100 | 100 | 200 | 10.7 | 64.5 | 173.8 | 171.3 | 1913.6 | 308.4 | 977.8 |
| C4,U1 | 50 | 20 | 200 | 300 | 500 | 41.4 | 37.6 | 46.9 | 125.4 | 1158.9 | 116.0 | 367.6 |
| C4,U5 | 50 | 20 | 200 | 100 | 300 | 23.4 | 42.5 | 65.3 | 125.4 | 1158.9 | 151.2 | 479.2 |
| C4,U2 | 70 | 20 | 200 | 300 | 500 | 28.6 | 56.5 | 129.2 | 171.3 | 1913.6 | 254.4 | 806.6 |
| C4,U6 | 70 | 20 | 200 | 100 | 300 | 16.4 | 61.8 | 158.1 | 171.3 | 1913.6 | 290.4 | 920.7 |
| C5,U3 | 50 | 0 | 100 | 300 | 400 | 32.1 | 40.1 | 74.3 | 257.6 | 1512.8 | 195.9 | 620.9 |
| C5,U7 | 50 | 0 | 100 | 100 | 200 | 15.2 | 45.0 | 93.8 | 257.6 | 1512.8 | 231.1 | 732.5 |
| C6,U3 | 50 | 0 | 200 | 300 | 500 | 41.4 | 37.6 | 65.5 | 257.6 | 1512.8 | 178.3 | 565.1 |
| C6,U7 | 50 | 0 | 200 | 100 | 300 | 23.4 | 42.5 | 83.8 | 257.6 | 1512.8 | 213.5 | 676.7 |
| C7,U4 | 70 | 50 | 100 | 300 | 400 | 22.4 | 59.1 | 46.0 | 45.9 | 754.6 | 63.8 | 202.4 |
| C7,U8 | 70 | 50 | 100 | 100 | 200 | 10.7 | 64.5 | 76.6 | 45.9 | 754.6 | 99.8 | 316.5 |
| C8,U4 | 70 | 50 | 200 | 300 | 500 | 28.6 | 56.5 | 32.0 | 45.9 | 754.6 | 45.8 | 145.3 |
| C8,U8 | 70 | 50 | 200 | 100 | 300 | 16.4 | 61.8 | 60.8 | 45.9 | 754.6 | 81.8 | 259.4 |

Table A2.
Eco-driving assessment results: −2% longitudinal slope case.
Table A2.
Eco-driving assessment results: −2% longitudinal slope case.
| Usage | Input Case Parameters | Initial Scenario | Optimization and Gain | |||||||||
|---|---|---|---|---|---|---|---|---|---|---|---|---|
| Gain | ||||||||||||
| (km/h) | (km/h) | (m) | (m) | (m) | (s) | (km/h) | (kJ) | (s) | (m) | (L/d) | (kg) | |
| C1,U1 | 50 | 20 | 100 | 300 | 400 | NC | NC | NC | 31.5 | 302.2 | −17.2 | −54.6 |
| C1,U5 | 50 | 20 | 100 | 100 | 200 | 17.5 | 32.7 | 30.9 | 31.5 | 302.2 | 18.0 | 57.0 |
| C2,U1 | 50 | 20 | 200 | 300 | 500 | NC | NC | NC | 31.5 | 302.2 | −34.8 | −110.3 |
| C2,U5 | 50 | 20 | 200 | 100 | 300 | 31.1 | 20.3 | 0.7 | 31.5 | 302.2 | 0.4 | 1.2 |
| C3,U1 | 50 | 20 | 100 | 300 | 400 | NC | NC | NC | 31.5 | 302.2 | −17.2 | −54.6 |
| C3,U5 | 50 | 20 | 100 | 100 | 200 | 17.5 | 32.7 | 30.9 | 31.5 | 302.2 | 18.0 | 57.0 |
| C3,U2 | 70 | 20 | 100 | 300 | 400 | 26.2 | 41.1 | 59.5 | 48.9 | 591.5 | 34.5 | 109.3 |
| C3,U6 | 70 | 20 | 100 | 100 | 200 | 11.4 | 56.5 | 129.5 | 48.9 | 591.5 | 70.5 | 223.4 |
| C4,U1 | 50 | 20 | 200 | 300 | 500 | NC | NC | NC | 31.5 | 302.2 | −34.8 | −110.3 |
| C4,U5 | 50 | 20 | 200 | 100 | 300 | 31.1 | 20.3 | 0.7 | 31.5 | 302.2 | 0.4 | 1.2 |
| C4,U2 | 70 | 20 | 200 | 300 | 500 | 36.1 | 31.6 | 27.6 | 48.9 | 591.5 | 16.5 | 52.2 |
| C4,U6 | 70 | 20 | 200 | 100 | 300 | 18.2 | 49.2 | 93.5 | 48.9 | 591.5 | 52.5 | 166.3 |
| C5,U3 | 50 | 0 | 100 | 300 | 400 | NC | NC | NC | 54.8 | 366.6 | −5.9 | −18.7 |
| C5,U7 | 50 | 0 | 100 | 100 | 200 | 17.5 | 32.7 | 49.4 | 54.8 | 366.6 | 29.3 | 92.9 |
| C6,U3 | 50 | 0 | 200 | 300 | 500 | NC | NC | NC | 54.8 | 366.6 | −23.5 | −74.4 |
| C6,U7 | 50 | 0 | 200 | 100 | 300 | 31.1 | 20.3 | 19.2 | 54.8 | 366.6 | 11.7 | 37.1 |
| C7,U4 | 70 | 50 | 100 | 300 | 400 | 26.2 | 41.1 | −37.7 | 17.4 | 289.3 | −19.9 | −63.2 |
| C7,U8 | 70 | 50 | 100 | 100 | 200 | 11.4 | 56.5 | 32.3 | 17.4 | 289.3 | 16.1 | 50.9 |
| C8,U4 | 70 | 50 | 200 | 300 | 500 | 36.1 | 31.6 | −69.6 | 17.4 | 289.3 | −37.9 | −120.2 |
| C8,U8 | 70 | 50 | 200 | 100 | 300 | 18.2 | 49.2 | −3.8 | 17.4 | 289.3 | −1.9 | −6.1 |

Table A3.
Eco-driving assessment results: 2% longitudinal slope case.
Table A3.
Eco-driving assessment results: 2% longitudinal slope case.
| Usage | Input Case Parameters | Initial Scenario | Optimization and Gain | |||||||||
|---|---|---|---|---|---|---|---|---|---|---|---|---|
| Gain | ||||||||||||
| (km/h) | (km/h) | (m) | (m) | (m) | (s) | (km/h) | (kJ) | (s) | (m) | (L/d) | (kg) | |
| C1,U1 | 50 | 20 | 100 | 300 | 400 | NC | NC | NC | 12.7 | 122.6 | −48.8 | −154.8 |
| C1,U5 | 50 | 20 | 100 | 100 | 200 | NC | NC | NC | 12.7 | 122.6 | −13.6 | −43.2 |
| C2,U1 | 50 | 20 | 200 | 300 | 500 | NC | NC | NC | 12.7 | 122.6 | −66.4 | −210.6 |
| C2,U5 | 50 | 20 | 200 | 100 | 300 | NC | NC | NC | 12.7 | 122.6 | −31.2 | −99.0 |
| C3,U1 | 50 | 20 | 100 | 300 | 400 | NC | NC | NC | 12.7 | 122.6 | −48.8 | −154.8 |
| C3,U5 | 50 | 20 | 100 | 100 | 200 | NC | NC | NC | 12.7 | 122.6 | −13.6 | −43.2 |
| C3,U2 | 70 | 20 | 100 | 300 | 400 | NC | NC | NC | 20.5 | 252.5 | −26.6 | −84.2 |
| C3,U6 | 70 | 20 | 100 | 100 | 200 | 13.7 | 35.8 | 40.7 | 20.5 | 252.5 | 9.4 | 29.9 |
| C4,U1 | 50 | 20 | 200 | 300 | 500 | NC | NC | NC | 12.7 | 122.6 | −66.4 | −210.6 |
| C4,U5 | 50 | 20 | 200 | 100 | 300 | NC | NC | NC | 12.7 | 122.6 | −31.2 | −99.0 |
| C4,U2 | 70 | 20 | 200 | 300 | 500 | NC | NC | NC | 20.5 | 252.5 | −44.6 | −141.2 |
| C4,U6 | 70 | 20 | 200 | 100 | 300 | NC | NC | NC | 20.5 | 252.5 | −8.6 | −27.1 |
| C5,U3 | 50 | 0 | 100 | 300 | 400 | NC | NC | NC | 21.5 | 147.0 | −44.5 | −141.2 |
| C5,U7 | 50 | 0 | 100 | 100 | 200 | NC | NC | NC | 21.5 | 147.0 | −9.3 | −29.6 |
| C6,U3 | 50 | 0 | 200 | 300 | 500 | NC | NC | NC | 21.5 | 147.0 | −62.1 | −196.9 |
| C6,U7 | 50 | 0 | 200 | 100 | 300 | NC | NC | NC | 21.5 | 147.0 | −26.9 | −85.4 |
| C7,U4 | 70 | 50 | 100 | 300 | 400 | NC | NC | NC | 7.8 | 129.9 | −48.6 | −154.1 |
| C7,U8 | 70 | 50 | 100 | 100 | 200 | 13.7 | 35.8 | −56.5 | 7.8 | 129.9 | −12.6 | −40.0 |
| C8,U4 | 70 | 50 | 200 | 300 | 500 | NC | NC | NC | 7.8 | 129.9 | −66.6 | −211.2 |
| C8,U8 | 70 | 50 | 200 | 100 | 300 | NC | NC | NC | 7.8 | 129.9 | −30.6 | −97.1 |

Table A4.
Eco-driving assessment results: 4% longitudinal slope case.
Table A4.
Eco-driving assessment results: 4% longitudinal slope case.
| Usage | Input Case Parameters | Initial Scenario | Optimization and Gain | |||||||||
|---|---|---|---|---|---|---|---|---|---|---|---|---|
| Gain | ||||||||||||
| (km/h) | (km/h) | (m) | (m) | (m) | (s) | (km/h) | (kJ) | (s) | (m) | (L/d) | (kg) | |
| C1,U1 | 50 | 20 | 100 | 300 | 400 | NC | NC | NC | 9.8 | 94.5 | −53.8 | −170.4 |
| C1,U5 | 50 | 20 | 100 | 100 | 200 | NC | NC | NC | 9.8 | 94.5 | −18.6 | −58.8 |
| C2,U1 | 50 | 20 | 200 | 300 | 500 | NC | NC | NC | 9.8 | 94.5 | −71.4 | −226.2 |
| C2,U5 | 50 | 20 | 200 | 100 | 300 | NC | NC | NC | 9.8 | 94.5 | −36.2 | −114.6 |
| C3,U1 | 50 | 20 | 100 | 300 | 400 | NC | NC | NC | 9.8 | 94.5 | −53.8 | −170.4 |
| C3,U5 | 50 | 20 | 100 | 100 | 200 | NC | NC | NC | 9.8 | 94.5 | −18.6 | −58.8 |
| C3,U2 | 70 | 20 | 100 | 300 | 400 | NC | NC | NC | 15.9 | 196.4 | −36.7 | −116.2 |
| C3,U6 | 70 | 20 | 100 | 100 | 200 | 16.6 | 17.9 | −3.6 | 15.9 | 196.4 | −0.7 | −2.1 |
| C4,U1 | 50 | 20 | 200 | 300 | 500 | NC | NC | NC | 9.8 | 94.5 | −71.4 | −226.2 |
| C4,U5 | 50 | 20 | 200 | 100 | 300 | NC | NC | NC | 9.8 | 94.5 | −36.2 | −114.6 |
| C4,U2 | 70 | 20 | 200 | 300 | 500 | NC | NC | NC | 15.9 | 196.4 | −54.7 | −173.2 |
| C4,U6 | 70 | 20 | 200 | 100 | 300 | NC | NC | NC | 15.9 | 196.4 | −18.7 | −59.1 |
| C5,U3 | 50 | 0 | 100 | 300 | 400 | NC | NC | NC | 16.5 | 113.2 | −50.5 | −160.0 |
| C5,U7 | 50 | 0 | 100 | 100 | 200 | NC | NC | NC | 16.5 | 113.2 | −15.3 | −48.4 |
| C6,U3 | 50 | 0 | 200 | 300 | 500 | NC | NC | NC | 16.5 | 113.2 | −68.1 | −215.8 |
| C6,U7 | 50 | 0 | 200 | 100 | 300 | NC | NC | NC | 16.5 | 113.2 | −32.9 | −104.2 |
| C7,U4 | 70 | 50 | 100 | 300 | 400 | NC | NC | NC | 6.1 | 101.9 | −53.7 | −170.1 |
| C7,U8 | 70 | 50 | 100 | 100 | 200 | 16.6 | 17.9 | −100.8 | 6.1 | 101.9 | −17.7 | −56.0 |
| C8,U4 | 70 | 50 | 200 | 300 | 500 | NC | NC | NC | 6.1 | 101.9 | −71.7 | −227.2 |
| C8,U8 | 70 | 50 | 200 | 100 | 300 | NC | NC | NC | 6.1 | 101.9 | −35.7 | −113.1 |
References
- IEA. Global Energy Crisis, IEA, Paris. 2023. Available online: https://www.iea.org/topics/global-energy-crisis (accessed on 13 March 2023).
- Hubbert, M. Nuclear energy and fossil fuel. In Proceedings of the Spring Meeting of the Southern District, American Petroleum Institute, San Antonio, TX, USA, 7–9 March 1956. Publication No. 95, Shell Development Co. [Google Scholar]
- Verbruggen, A.; Marchohi, M.A. Views on peak oil and its relation to climate change policy. Energy Policy 2010, 38, 5572–5581. [Google Scholar] [CrossRef]
- Rogelj, J.; Shindell, D.; Fifita, K.J.S.; Forster, P.; Ginzburg, V.; Handa, C.; Kheshgi, H.; Kobayashi, S.; Kriegler, E.; Mundaca, L.; et al. Mitigation pathways compatible with 1.5 °C in the context of sustainable development. In Global Warming of 1.5 °C. An IPCC Special Report on the Impacts of Global Warming of 1.5 °C above Pre-Industrial Levels and Related Global Greenhouse Gas Emission Pathways, in the Context of Strengthening the Global Response to the Threat of Climate Change, Sustainable Development, and Efforts to Eradicate Poverty; Masson-Delmotte, V., Zhai, P., Portner, H.O., Roberts, D., Skea, J., Shukla, P.R., Pirani, A., Moufouma-Okia, W., Péan, C., Pidcock, R., et al., Eds.; IPCC: Geneva, Switzerland, 2018. [Google Scholar]
- IEA. Global CO2 Emissions in 2019, IEA, Paris. 2020. Available online: https://www.iea.org/articles/global-co2-emissions-in-2019 (accessed on 13 March 2023).
- Vandanjon, P.O.; Vinot, E.; Cerezo, V.; Coiret, A.; Dauvergne, M.; Bouteldja, M. Longitudinal profile optimization for roads within an eco-design framework. Transp. Res. Part D Transp. Environ. 2019, 67, 642–658. [Google Scholar] [CrossRef]
- Tiboni, M.; Rossetti, S.; Vetturi, D.; Torrisi, V.; Botticini, F.; Schaefer, M.D. Urban Policies and Planning Approaches for a Safer and Climate Friendlier Mobility in Cities: Strategies, Initiatives and Some Analysis. Sustainability 2021, 13, 1778. [Google Scholar] [CrossRef]
- Corticelli, R.; Pazzini, M.; Mazzoli, C.; Lantieri, C.; Ferrante, A.; Vignali, V. Urban Regeneration and Soft Mobility: The Case Study of the Rimini Canal Port in Italy. Sustainability 2022, 14, 14529. [Google Scholar] [CrossRef]
- Grady, C.; McWhorter, S.; Sulic, M.; Sprik, S.J.; Thornton, M.J.; Brooks, K.P.; Tamburello, D.A. Design tool for estimating adsorbent hydrogen storage system characteristics for light-duty fuel cell vehicles. Int. J. Hydrogen Energy 2022, 47, 29847–29857. [Google Scholar] [CrossRef]
- Gipps, P. A Behavioural Car-Following Model for Computer Simulation. Transp. Res. Part B Methodol. 1981, 15, 105–111. [Google Scholar] [CrossRef]
- Kerner, B. Congested Traffic Flow: Observations and Theory. Transp. Res. Rec. J. Transp. Res. Board 1999, 1678, 160–167. [Google Scholar] [CrossRef]
- Treiber, M.; Kesting, A. Traffic Flow Dynamics; Springer: Berlin/Heidelberg, Germany, 2013. [Google Scholar] [CrossRef]
- Noël, R.; Navarro, L.; Courbebaisse, G. Lattice boltzmann method for heterogeneous multi-class traffic flow. J. Comput. Theor. Transp. 2020, 50, 27–51. [Google Scholar] [CrossRef]
- Payne, H.J. Models of Freeway Traffic and Control. In Mathematical Models of Public Systems; Simulation Concils Incorporation: La Jolla, CA, USA, 1971; Volume 28, pp. 51–61. [Google Scholar]
- Yanli, M.; Yanjiang, L.; Yuee, G. Forecast on Energy Demand of Road Transportation in China. Energy Procedia 2012, 16, 403–408. [Google Scholar] [CrossRef]
- Ho, S.H.; Wong, Y.D.; Chang, V.W.C. What can eco-driving do for sustainable road transport? Perspectives from a city (Singapore) eco-driving programme. Sustain. Cities Soc. 2015, 14, 82–88. [Google Scholar] [CrossRef]
- Dogan, E.; Steg, L.; Delhomme, P. The influence of multiple goals on driving behavior: The case of safety, time saving, and fuel saving. Accid. Anal. Prev. 2011, 43, 1635–1643. [Google Scholar] [CrossRef] [PubMed]
- Camacho-Torregrosa, F.J.; Pérez-Zuriaga, A.M.; Campoy-Ungría, J.M.; García-García, A. New geometric design consistency model based on operating speed profiles for road safety evaluation. Accid. Anal. Prev. 2013, 61, 33–42. [Google Scholar] [CrossRef] [PubMed]
- Sundström, C.; Voronov, A.; Lindgärde, O.; Lagerberg, A. Optimal Speed and Gear Shift Control of Long-haulage Trucks. IFAC-PapersOnLine 2019, 52, 471–477. [Google Scholar] [CrossRef]
- Hellström, E.; Ivarsson, M.; Åslund, J.; Nielsen, L. Look-ahead control for heavy trucks to minimize trip time and fuel consumption. Control Eng. Pract. 2009, 17, 245–254. [Google Scholar] [CrossRef]
- Coiret, A.; Deljanin, E.; Vandanjon, P.O. Vehicle energy savings by optimizing road speed-sectioning. Eur. Transp. Res. Rev. 2020, 12, 1–15. [Google Scholar] [CrossRef]
- Xiong, L.; Xia, X.; Lu, Y.; Liu, W.; Gao, L.; Song, S.; Yu, Z. IMU-based Automated Vehicle Body Sideslip Angle and Attitude Estimation Aided by GNSS using Parallel Adaptive Kalman Filters. IEEE Trans. Veh. Technol. 2020, 69, 10668–10680. [Google Scholar] [CrossRef]
- Xia, X.; Hashemi, E.; Xiong, L.; Khajepour, A. Autonomous Vehicle Kinematics and Dynamics Synthesis for Sideslip Angle Estimation Based on Consensus Kalman Filter. IEEE Trans. Control Syst. Technol. 2023, 31, 179–192. [Google Scholar] [CrossRef]
- Liu, W.; Xiong, L.; Xia, X.; Lu, Y.; Gao, L.; Song, S. Vision-aided Intelligent Vehicle Sideslip Angle Estimation Based on Dynamic Model. IET Intell. Transp. Syst. 2020, 14, 1183–1189. [Google Scholar] [CrossRef]
- Rouchaud, D. Mobilités: Coûts Externes et Tarification du Déplacement; Technical report; Ministère de la Transition Écologique, Commissariat général au développement durable, Tour Séquoia: Paris, France, 2020. [Google Scholar]
- Helbing, D. Traffic Theory from First Principles. In SSRN Electronic Journal; SSRN: Rochester, NY, USA, 2015; 263p. [Google Scholar] [CrossRef]
Disclaimer/Publisher’s Note: The statements, opinions and data contained in all publications are solely those of the individual author(s) and contributor(s) and not of MDPI and/or the editor(s). MDPI and/or the editor(s) disclaim responsibility for any injury to people or property resulting from any ideas, methods, instructions or products referred to in the content. |
© 2023 by the authors. Licensee MDPI, Basel, Switzerland. This article is an open access article distributed under the terms and conditions of the Creative Commons Attribution (CC BY) license (https://creativecommons.org/licenses/by/4.0/).

