Abstract
Stakeholders expect emerging urban air mobility (UAM) services that use electric vertical takeoff and landing (eVTOL) aircraft to revolutionize transportation systems. However, to be effective, eVTOL facilities, known as vertiports, must seamlessly integrate with the existing multimodal transportation infrastructure. This research analyzes how to best integrate vertiports with the existing public transit network of a city, with San Francisco in the United States as a case study. This study developed a composite optimization model to identify the locations for an optimum number of vertiports within each of the eleven (11) supervisorial districts of San Francisco that would minimize the network distance to its bus stops. The results revealed that 38 locations for vertiports covered 3245 bus stops with an average walk time close to 10 min. Walking 10 min from each vertiport would cover 41.6% of the total road network length and 49.8% of all bus stop locations. Power-law regressions of the average distances as a function of the number of vertiports will help planners to make informed decisions about the optimal vertiport placements in each district by identifying diminishing returns in travel-time savings, and adjustments that consider income and population as additional demand factors.
1. Introduction
Urban air mobility (UAM) is emerging as an air passenger mode of transport for both intra and inter-urban trips. The concept of utilizing air taxis to alleviate urban traffic congestion has been gaining popularity as manufacturers demonstrate their electric vertical takeoff and landing (eVTOL) aircraft. Numerous eVTOL prototypes are undergoing tests for regulatory compliance [1] and preliminary network operations [2]. Analysts forecast that UAM will be growing at a rate of 45.9% by 2040 [3]. Market studies have predicted that the UAM passenger service has a market potential of between USD 2.8 and USD 4 billion in the U.S. alone, by 2030 [4].
UAM is a disruptive service [5] and eVTOL aircraft will have capacity constraints based on the infrastructure availability for vertiports that support eVTOL aircraft services [6]. Several factors such as weather may pose challenges to the quality of a UAM passenger service [7], requiring passengers to use alternative modes of transportation such as public transport or ride sharing. Hence, vertiports integrated into a public transportation system should accommodate station-to-station travel options [8]. Integrating vertiports into the existing transportation system, and particularly the public transportation system, will assure equitable accessibility for everyone [9]. Vertiports and public transit stops share the same principle—designing the network to attract passengers [10].
To establish an economically sustainable service, the placement of vertiports should cover the potential demand for UAM [10]. There is a gap in the studies that have considered the public transit facility distribution to identify potential accessibility points for vertiports. Previous studies attempted to identify suitable vertiport locations in metro areas [1,11]. One study identified ground-based congestion as a criterion for designing the UAM infrastructure [11]. Another study optimized the number, sizes, and locations of vertiports in a metropolitan area using a facility location structure, a queuing network, and a demand function [12]. In 2021, the U.S. Federal Aviation Administration provided vertiport design guidance that focused on the foundational aspects while acknowledging the evolving nature of VTOL technology and operations [13]. The FAA guidance provided detailed design considerations for the touchdown and lift-off area, final approach and takeoff area, safety area, and various operational aspects like hover performance, takeoff, landing, downwash/outwash effects, load-bearing capacity, surface characteristics, gradient for drainage, visual aids to aid pilot navigation especially at night, firefighting support, charging facilities, and elevated vertiport considerations. Studies that identified candidate locations based on spatial optimization techniques did not provide an adequate rationale regarding the optimal number of vertiports required when considering walkability and accessibility from public transit access points [14,15].
This study addresses these research gaps by developing a composite model to identify the optimum number of vertiport locations within an urban area, considering walkability and accessibility to public transit access points. The typical approach when applying spatial analysis to estimate travel demand is to select pre-defined activity centers in pre-defined transportation zones as candidate locations for a facility. However, obtaining data about activity centers is not only difficult and costly, but those centers may not be easily accessible to public transit. Therefore, this study considered areas near existing bus stops as candidate locations because they inherently capture demand for public transit and accessibility. These are also factors considered in transit-oriented development (TOD) to integrate other modes like micromobility, commuter rail and subways, and bike path accessibility [16]. This study also produced trends between the optimal number of vertiports and other factors such as mean network distance to demand points, population, employment, and income so that transportation planners can determine the optimum number of vertiports to install that maximizes travel-time savings and accessibility. The authors selected San Francisco, a city in the state of California for the case study area because of its high percentage of long-distance commuters and suitable weather [17]. Additionally, the city has multiple urban centers that can offer profitability for UAM operations [18].
2. Literature Review
2.1. Vertiport Locating
One study found that there has been an exponential growth in UAM-related research publications since 2018 [19]. UAM networks include vertiports that can support additional services such as electric vehicle charging, parking, and aircraft maintenance [1]. The U.S. Federal Aviation Administration (FAA) defined vertiports as “locations from which UAM flights arrive and depart” [20]. Vertiports are medium-sized eVTOL facilities with two to three landing pads, and a maximum of six parked aircraft. Vertiports cost between USD 500,000 and USD 800,000 to build [21]. One of the advantages of eVTOL vehicles is that they can take off and land on dedicated infrastructure, even on high rise buildings [22]. However, various challenges such as public acceptance, noise ordinances, air traffic restrictions, real estate availability, and the high costs of infrastructure development are factors for consideration in vertiport placement decisions [23]. These considerations increase uncertainties [24] that exacerbate eVTOL design challenges [25]. Therefore, planners must consider these challenges, and the need for convenient access, airspace sharing, and emergency procedures to provide for vertical take-off and landing services [26]. Moreover, predicting UAM demand is difficult because of uncertainties in factors such as pricing strategy, telecommuting trend, and the lack of Global Positioning System (GPS) trace data [27]. These uncertainties make the task of finding suitable locations for vertiports more challenging.
Identifying transportation facility locations using network planning and optimization techniques is a widely discussed topic among transportation researchers. Loidl et al. (2019) identified preferred locations for bike stations using a spatial framework and overlay analysis with demographic characteristics [28]. Askarzadeh and Bridgelall (2021) solved a location–allocation problem using a spatial optimization model within a geographic information system (GIS) framework and identified the best locations for five new bike-sharing stations in Fargo, North Dakota [29].
To identify candidate vertiport locations, a 2016 study used a k-means clustering approach that relied on data from long-distance Uber rides to identify potential vertiport locations in Los Angeles and London [30]. However, this study narrowly focused on demand for vertiports on uber routes covering heavily congested urban and suburban areas. Bulusu et al. (2020) also applied k-means clustering to the San Francisco Bay Area [31]. However, the demand data used in the study did not cover the entire metropolitan region, which is an important criterion for understanding the broader impacts on the transportation network. Other studies that used k-means clustering found that the location of vertiports was more critical than the number of vertiports [32,33]. One disadvantage of k-means clustering is that outlier data points may lead to vertiports being situated farther away from major demand points, which could affect UAM demand estimation. Furthermore, a subset of vertiport locations identified in the models may not be practical in real-world scenarios, considering noise, equity, and other factors. Moreover, none of the mentioned studies considered integration with the existing transportation network, and particularly public transit.
Previous studies attributed different demand factors to UAM services. For example, Schweigher and Preis (2022) considered population as a demand factor for vertiports by stating that vertiports should be in densely populated areas and inside city boundaries [19]. A focus group considered income as a demand factor for UAM by revealing that wealthy households are likely to embrace air taxi services due to more affordability [34]. However, such an assumption does not account for government or employer subsidies and price reduction with higher demand to increase equitable access. A comprehensive literature review, conducted in 2021, identified employment as one of the demand factors for UAM services [5]. These studies indicated that planners should consider demand factors such as population, income, and employment in vertiport placement decision making. However, a survey conducted in Ohio and California by NASA revealed that respondents wanted vertiports to be located close to public transit stations [26]. For predicting the long-term application potential of urban air mobility complementing public transport, Ploetner et al. (2020) suggested that UAM resembles a public transport mode in the mobility system and selected a transit mode (train) as the reference mode for UAM in developing an incremental logit model for mode choice [8].
There were only a handful of studies that considered the integration of vertiports in existing transportation networks. For example, Willey and Salmon selected and optimized 12 potential vertiport locations in three different metropolitan and micropolitan areas within the United States by formulating the vertiport selection problem as a single-allocation p-hub median location problem [1]. This study evaluated neighboring subgroups rather than evaluating the overall network. A related study identified the optimized number, size, and locations of vertiports in a metropolitan area using a facility location structure, a queuing network, and a demand function [12].
2.2. Transit System Integration
According to Garrow et al. (2021), UAM can thrive if it seamlessly blends with current urban infrastructure in a manner that is agreeable to local populations [5]. The San Francisco Municipal Transportation Agency (SFMTA) Travel Decision Survey Report revealed that transit is one of the priority modes. Hence, one of the objectives of SFMTA’s 2021 transportation plan is to increase the trips taken by the priority modes [35]. UAM needs integration with the existing city infrastructure in ways that are acceptable to local communities, “while providing service levels that offer time savings over existing modes at a price point that individuals are willing to pay” [5]. The proximity of vertiports to intermodal public transit connections is ideal to accommodate “last mile” transit and to provide alternatives to “ridesharing” services [16].
Integrating UAM with the public transit system is also important from the viewpoint of TOD, which is to ensure that a transportation system fits with the mass-transit stations or centers developed to support and encourage public transport usage to achieve sustainable mobility [36]. Since areas with land use diversity and population density attract more trips to transit [37], TOD creates an interaction between transit infrastructure and its surrounding area. TOD locates major access points within 2000 feet or a 10 min walking distance to activity centers such as retail shops, residential areas, employments, and parks while considering housing types, densities, and costs in land use planning [36]. TOD also encourages development and redevelopment along existing transit corridors in the transportation network [38]. Therefore, locating vertiports near public transit stops embraces the principles and objectives of TOD.
Figure 1 shows an original illustration from the authors for a concept that integrates a vertiport with a bus stop.
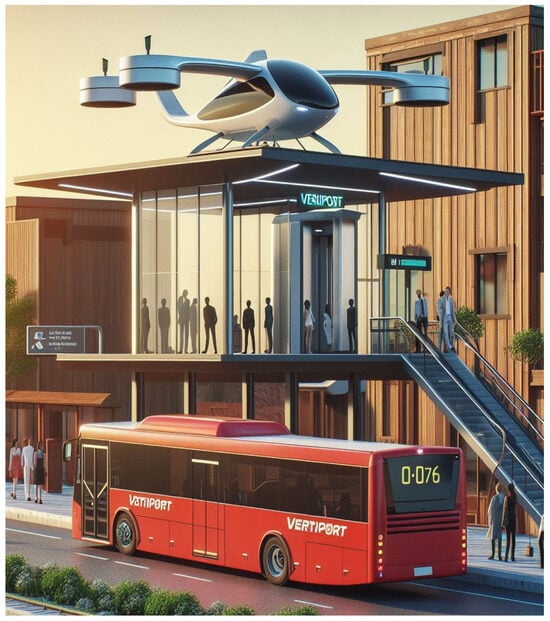
Figure 1.
A conceptual transit-oriented design for vertiports.
This conceptual design includes stairs necessary for evacuation, a sheltered staging area on the ground and second floors for security screening, ticketing, and waiting for both eVTOL and buses, and an elevator to access each floor and the aircraft.
The above literature review revealed that despite the similarity between UAM network planning and TOD, none of the studies considered transit stops to be potential demand points for UAM. Therefore, a unique contribution of this study is to use existing bus stop locations as candidate vertiport locations, adhering to TOD design principles.
3. Methodology
The methodology focused on location optimization within districts of the city to maintain compatibility with local jurisdictional differences in planning, zoning, demographics, and budgeting. This approach was also more computationally efficient than attempting to optimize for the entire city at once. A GIS service coverage optimization model calculated the optimal placements for a given number of vertiports within each district by minimizing the total network distance between the vertiports and the demand points covered. The workflow varied the number of facilities within a range to evaluate the trend in reducing the average network distance to the covered demand points. The workflow then fitted a function to predict the reduction of average network distance with additional vertiport placements and to identify a point of diminishing returns. The authors then adjusted the number of vertiports within each district to equalize the average walk time. Finally, an isochrone map showed the demand points covered by the equalized average walk time along the road network. The authors then discuss additional factors to further adjust the number of vertiports within each district considering the three demand factors of population, employment, and per capita income. The next subsections provide details of the workflow.
3.1. Data
The authors collected relevant data for a case study of a U.S. city, San Francisco in California. The population, income, and employment data were census-block level and available from the American Community Survey [39]. GIS shapefiles of San Francisco transit stops and the district boundaries were available at the San Francisco Open Data website [40]. There were 3245 bus stops in the city’s road network. To reduce computational complexity, the authors organized the data into 11 supervisory districts. The workflow converted population, employment, and income data at the census-block level into point shapefiles associated with their geospatial locations and then spatially joined these to the census block polygons. Subsequently, a GIS dissolve procedure aggregated that data at the district level. Population, employment, and per capita income represent demand factors that would influence the number of vertiport placements in each district. The GIS workflow joined the transit stop points to the census block polygons and San Francisco district shapefile to show the bus stops within each of the 11 district boundaries. The workflow also sourced the latest data on registered businesses in the city of San Francisco from the San Francisco Open Data website [40]. This data enabled the calculation of the percentage of businesses covered by the proposed vertiports within a given walking distance threshold.
3.2. Optimization Model
Service coverage optimization is a spatial model to identify locations where a finite number of service facilities will minimize the cost of serving a finite number of demand locations within a region [41]. In transportation planning, the cost C is usually a travel distance or a travel time [42]. The constraint of the model is that a facility can serve multiple demand points, but more than one facility cannot serve the same demand point. To identify a trend in cost reduction with the number of vertiports placed, the workflow iterated the number of facilities within a range and for each calculated the average network distance from the optimally placed vertiports to the demand locations. The optimization problem formulation is to minimize the cost C as follows:
Minimize:
Subject to:
and
and
where
and
- I: the set of N demand node locations indexed by I (bus stop locations).
- J: the set of M candidate vertiport station locations indexed by j.
- P: the number of vertiports to deploy.
- dij: the network distance between bus stops i and candidate locations of vertiports j.
The input parameters used in the network optimization model were the bus stop locations from an associated points shape file. Each iteration of the optimization, incrementing the number of vertiports, produced an average network distance from the optimally placed vertiports to the bus stop locations, for each of the 11 districts.
The expected reduction in average distance with each additional vertiport placed in a district should follow a monotonically decreasing function. The best fit trend were power-law regressions, estimating predictive models for the mean network distance as a function of the number of optimally placed vertiports in each district. Planners can use these regression models to make data-driven decisions regarding vertiport placement by anticipating trends in the reduction of average network distance between vertiports and activity points. The models enable planners to reliably predict walk-time reduction and identify points of diminishing returns when adding more vertiports to a district. Subsequently, planners can adjust the number of vertiports to equalize the average walk time among the districts.
The workflow calculated the average walk time based on a walking speed of 4 feet per second or 2.72 mph that the U.S. Federal Highway Administration (FHWA) proposed for planning purposes [43]. An isochrone map of the average walk time obtained at the point of diminishing returns from each vertiport in a district provided a visualization of the demand location catchment and gaps within each district. The visualization will inform further adjustments in the number of vertiports to place in each district.
Previous studies suggested that planners should consider the population, employment, and income of users in vertiport placement decision-making [5,19,34]. The workflow showed the relationship between the number of vertiports placed in a district, overlaid with data on the population, employment, and income. This additional information would allow planners to further adjust the number of vertiports in each district to balance demand based on those other criteria.
An alternative placement strategy may be to simply locate vertiports in the highest population tracts of each district to serve a potential demand. To compare the impact of the two placement strategies, the workflow placed a single vertiport at a bus stop near the centroid of the highest population tract in each district. The workflow then placed a single vertiport in each district by using the spatial optimization method. The workflow then created a distribution of the walk times from all districts, one for each approach. The workflow then fitted a function to each distribution and conducted a statistical test for goodness-of-fit.
4. Results and Discussions
There were 3245 bus stops that all vertiports covered. Figure 2 shows the trend in mean network distance with the number of vertiports placed in each district, D1 to D11. The optimization runs ranged the number of vertiports from one to ten. The best fit function was the power law of the form,
where
- d = mean network distance from facilities to the demand points in meters;
- n = number of vertiports with optimal placements;
- α = mean network distance when n = 1;
- β = a parameter that maximizes the R2 value of the model.
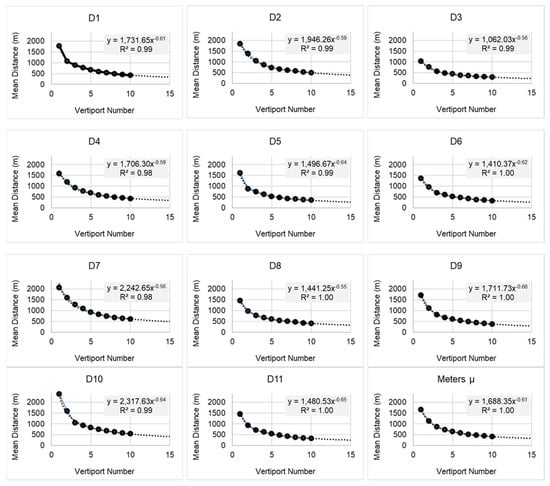
Figure 2.
Trends in the reduction of average network distance between vertiports and activity points.
Figure 2.
Trends in the reduction of average network distance between vertiports and activity points.
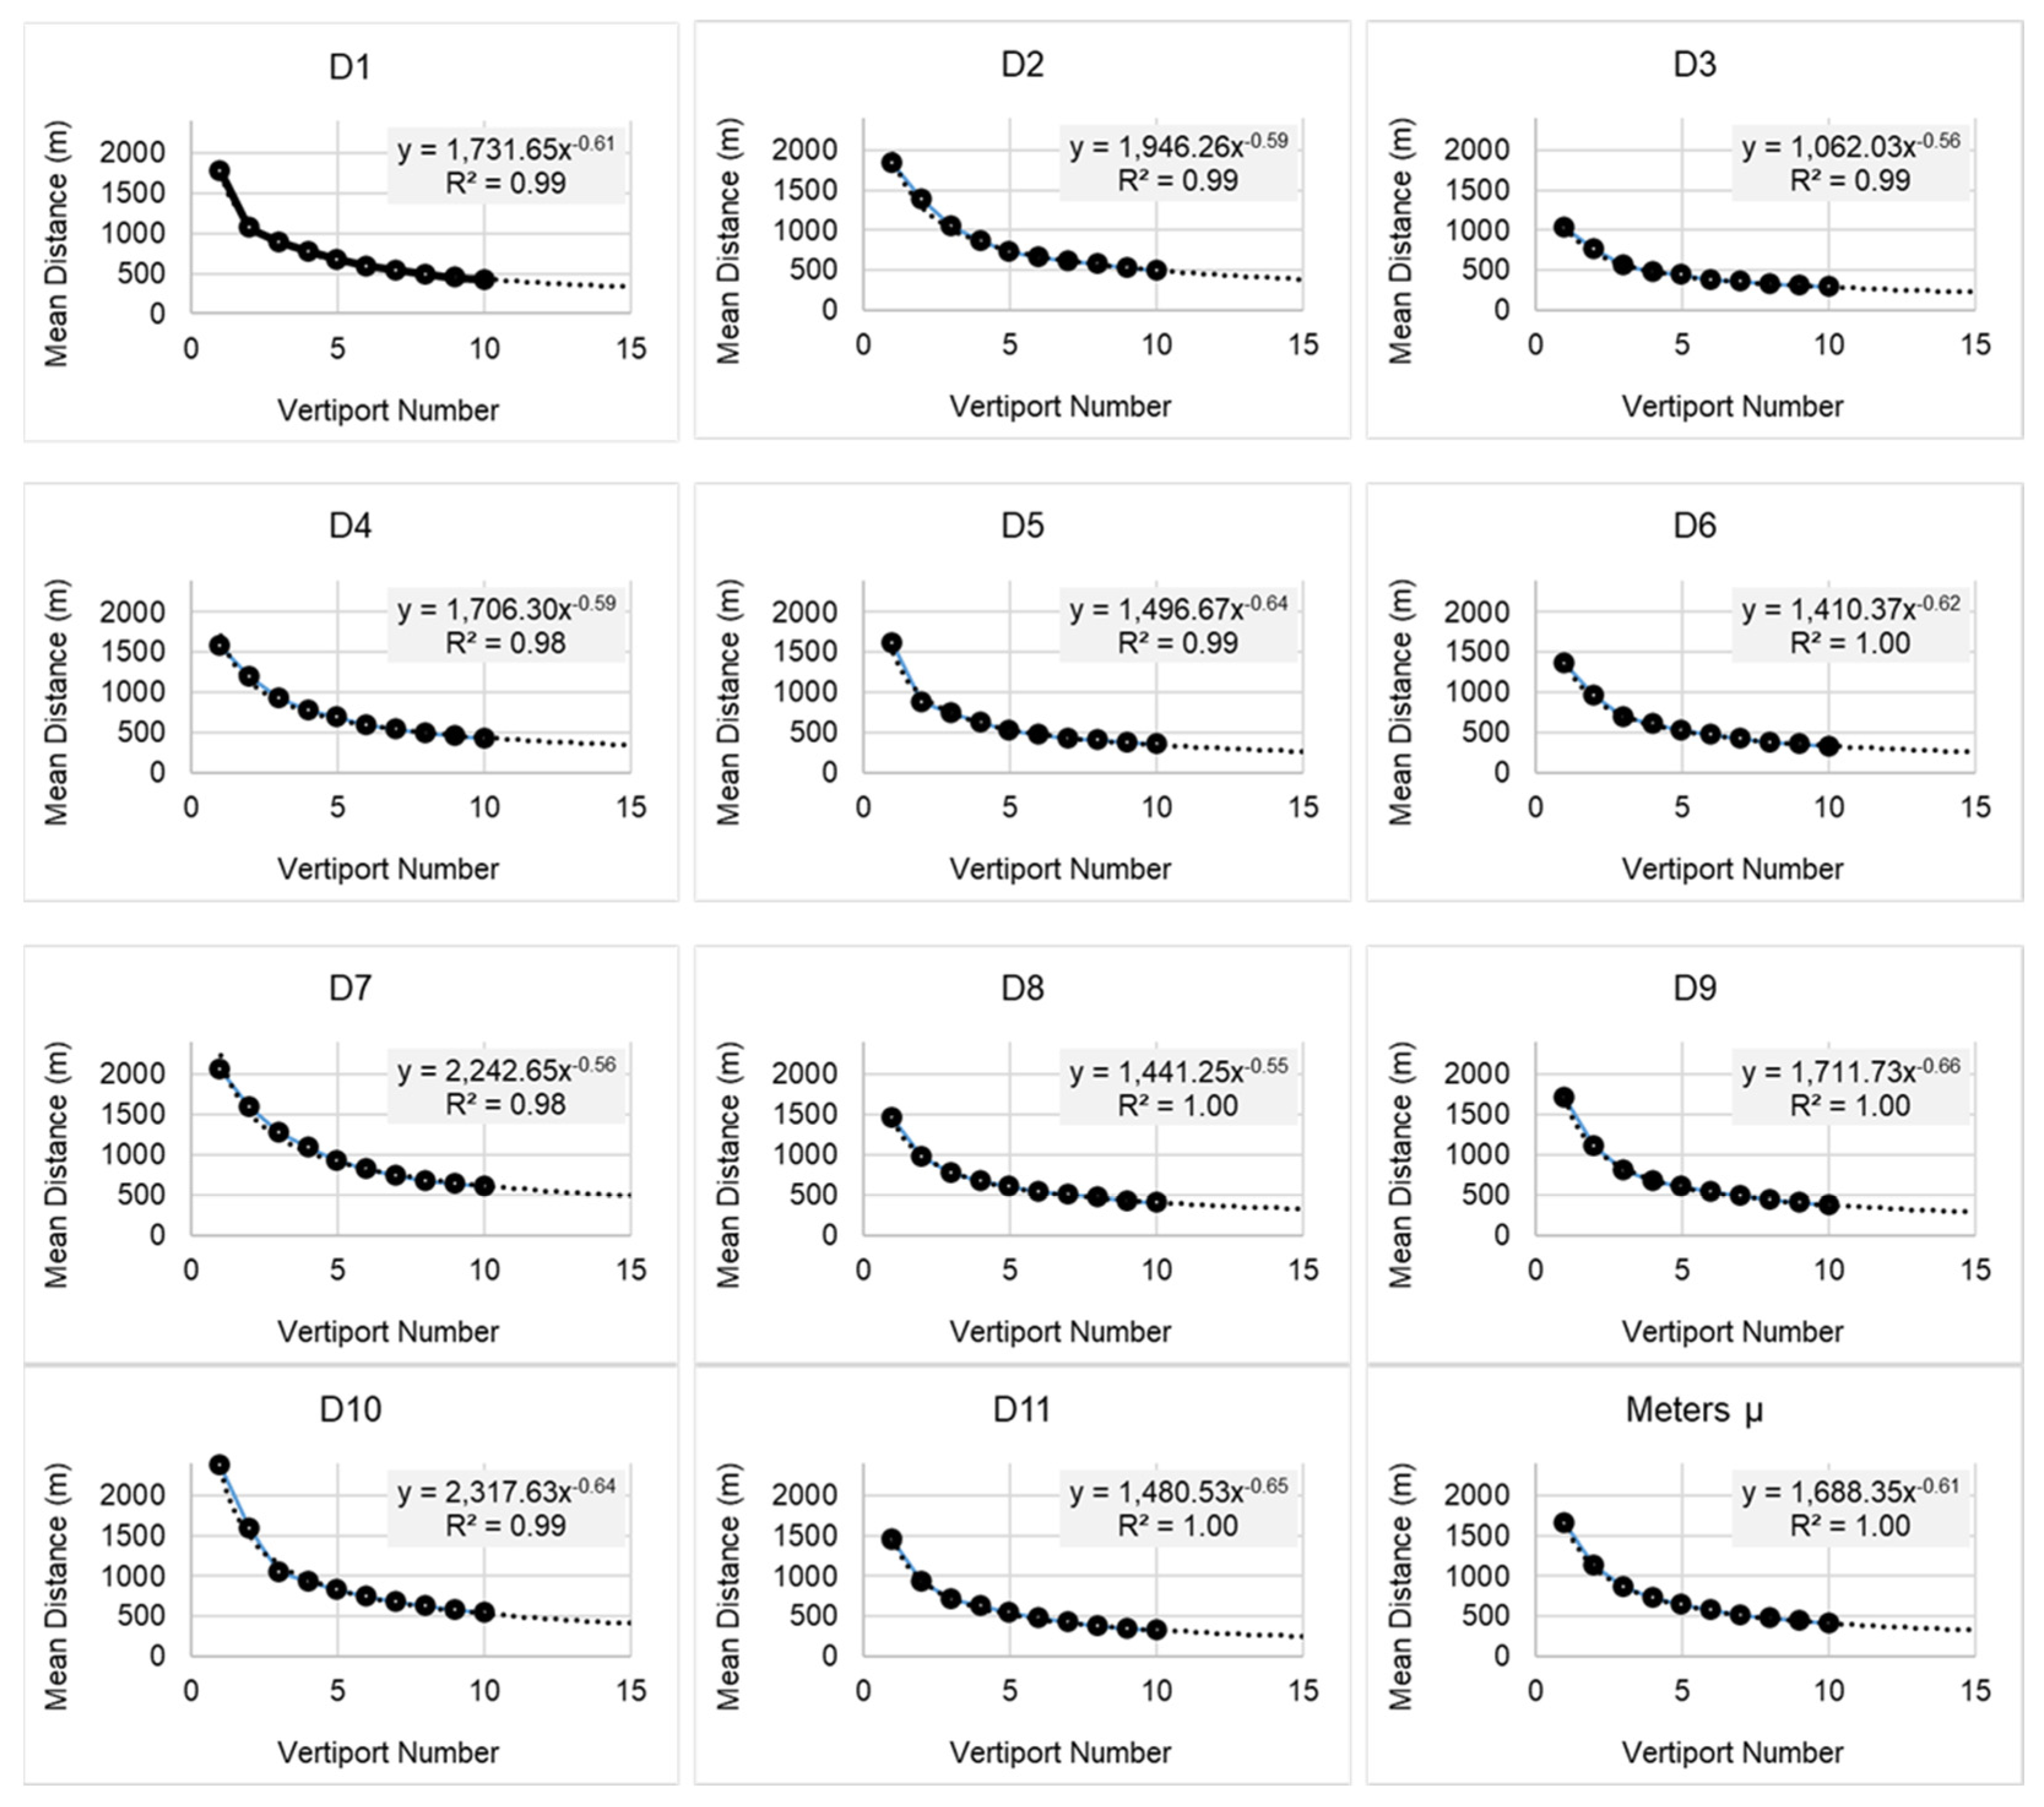
Table 1 summarizes the parameters of the power-law regression that estimated predictive models for mean network distance as a function of the number of optimally placed vertiports in each district. All predictive models had an R2 value of at least 0.98, suggesting an excellent predictive performance. The coefficients indicate the scale of the distance when there is a single vertiport. For example, the regression model for district 1 had a coefficient of 1731.65 which indicates that when there is a single vertiport, 1731.65 m is the mean network distance that can cover all the bus stop locations. The beta coefficient characterizes the relationship between the mean network distance and number of vertiports, with the negative sign indicating that the mean network distance decreases as the number of vertiports increases. However, selecting the point of diminishing returns for each district is both empirical and heuristic. For example, the mean network distance to all bus stops in D1 is 1767.7 m with a single vertiport placement and reduces by 40% with a second vertiport placed. The reduction is 16.7% and 12.7% with a third and fourth vertiport placement, respectively. Adding up to 10 more vertiports results in only another 12.6% reduction in mean network distance, which was comparable to the reduction after adding a fourth vertiport. Therefore, adding more vertiports after four did not generate an appreciable reduction in network distance to justify the investment. As observed, all districts show a similar trend of four vertiports as the point of diminishing returns. Table 2 shows the average walk time for at most four vertiports per district. This scenario showed that 38 locations for vertiports covered 3245 demand points with an average walk time of close to 10 min.

Table 1.
Parameters for power-law regressions.
Table 2.
Walk time to bus stops from the vertiports.
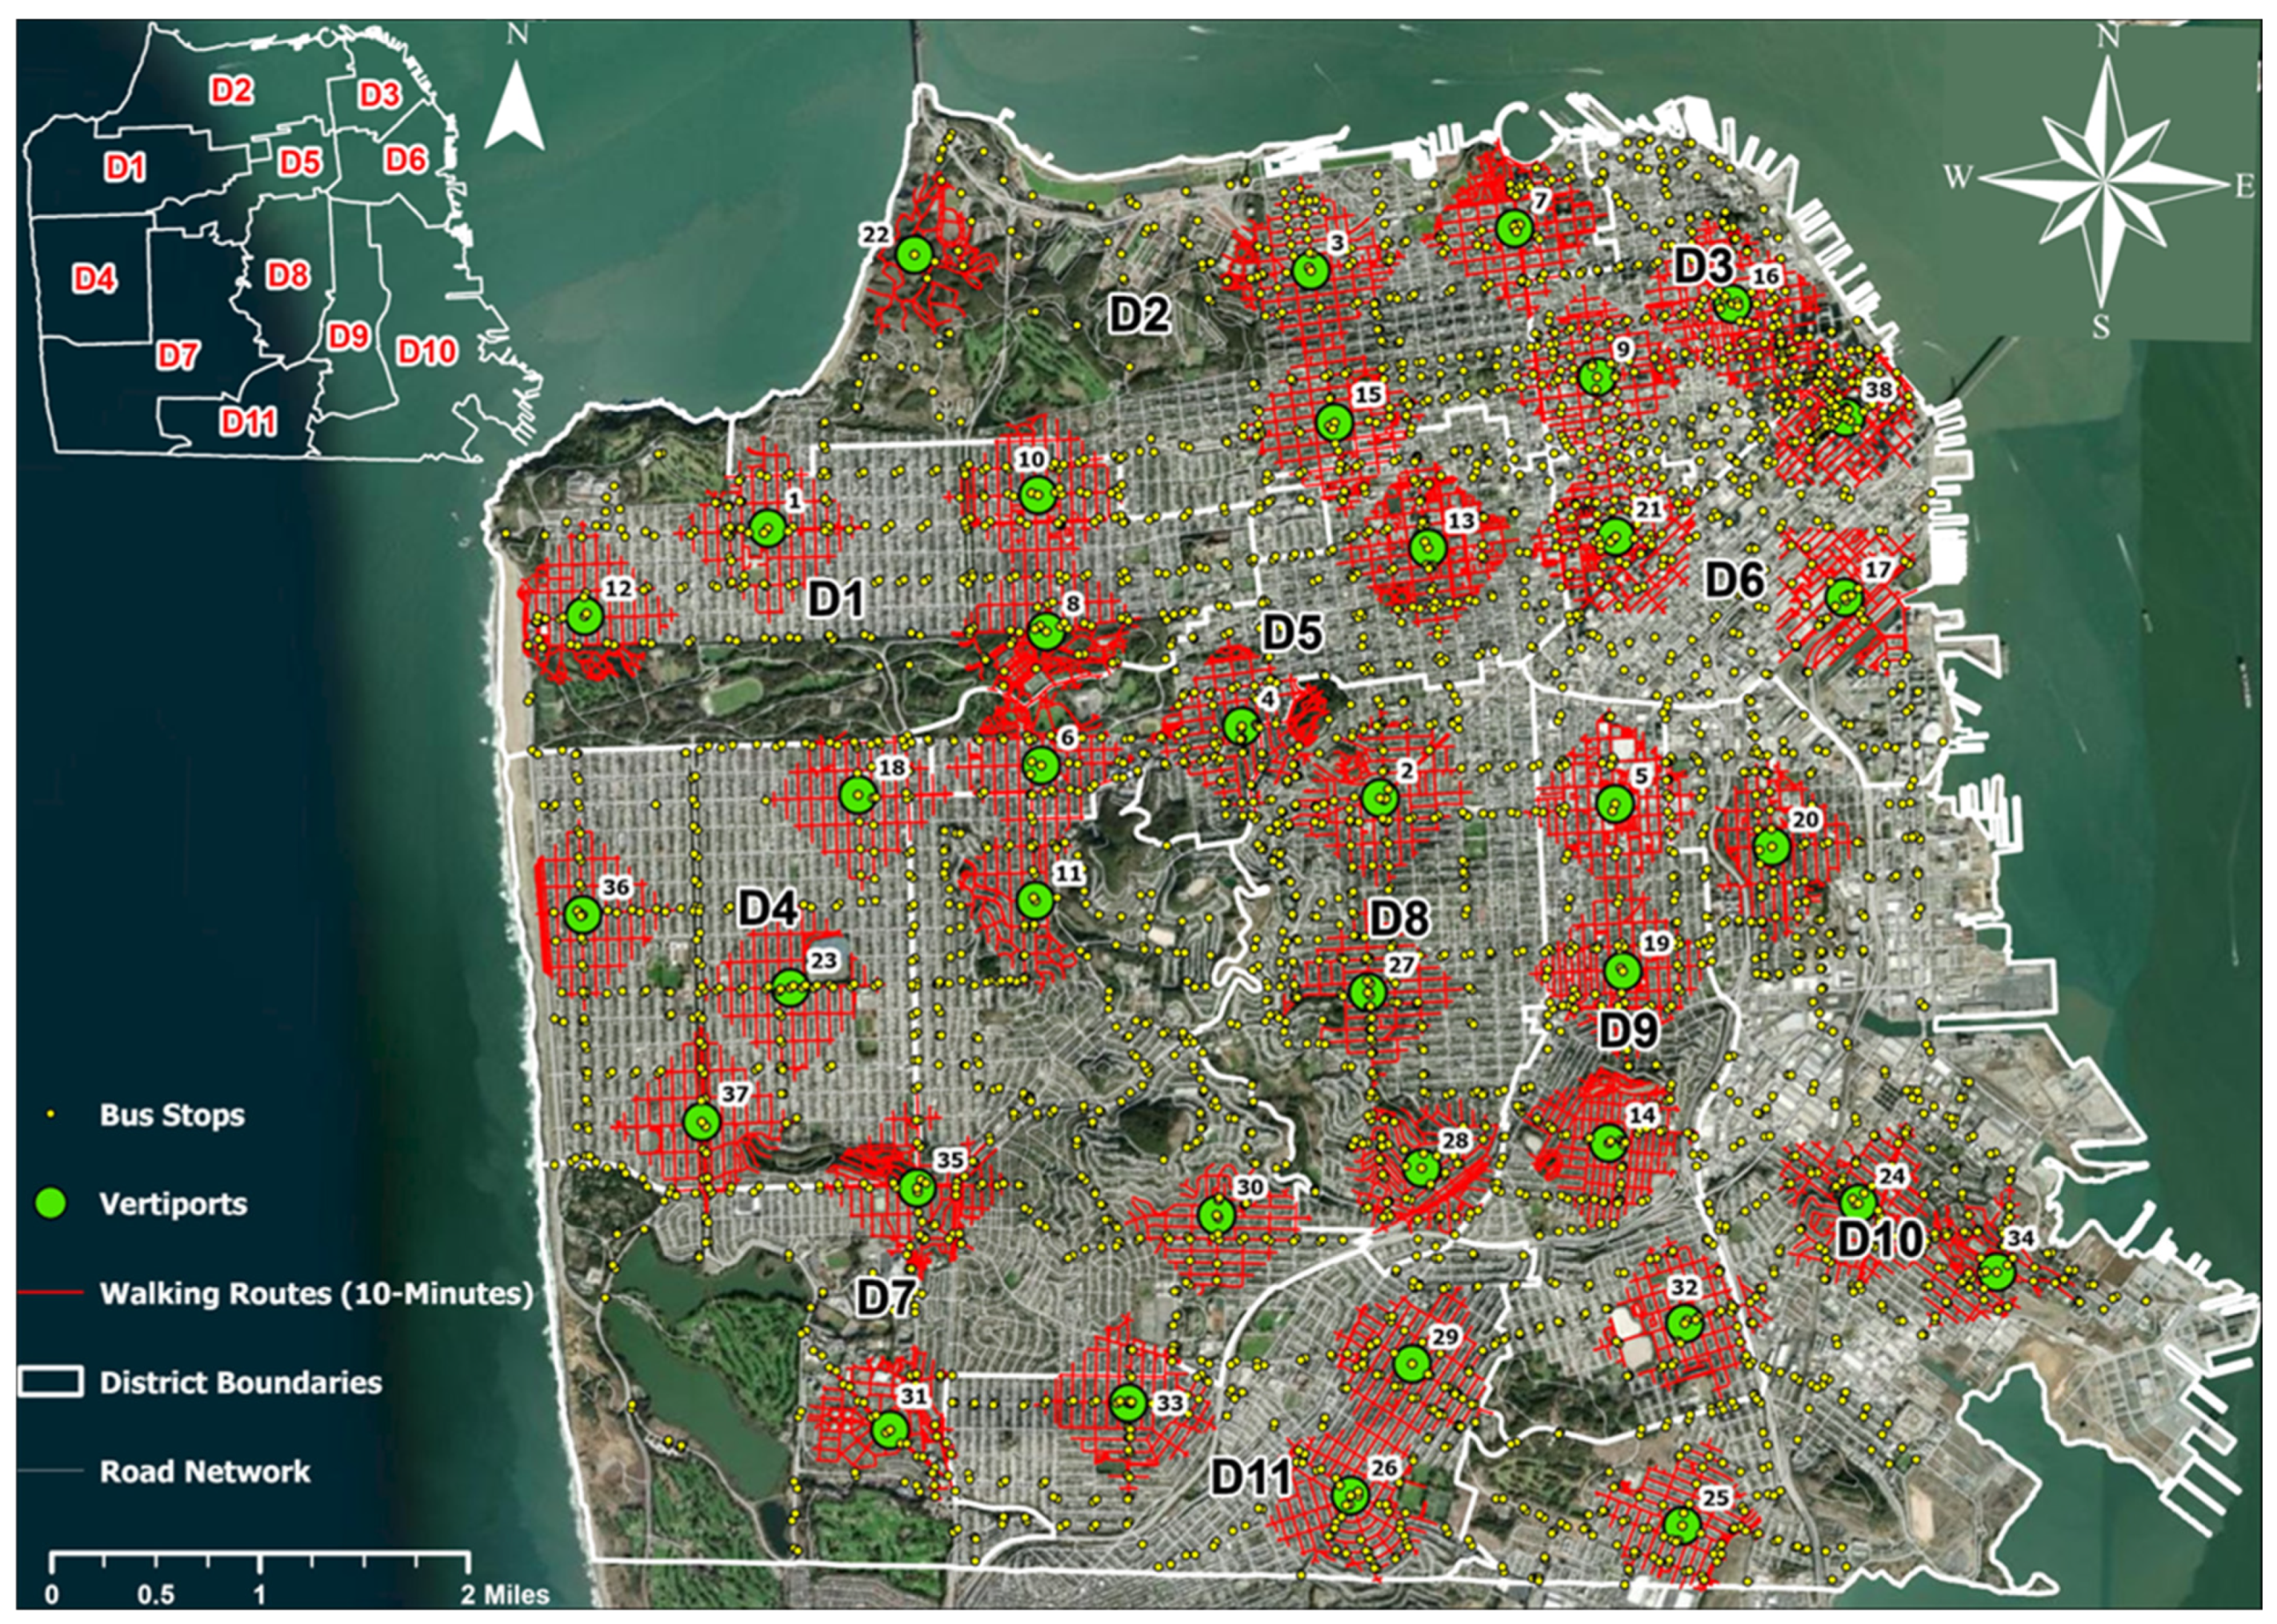
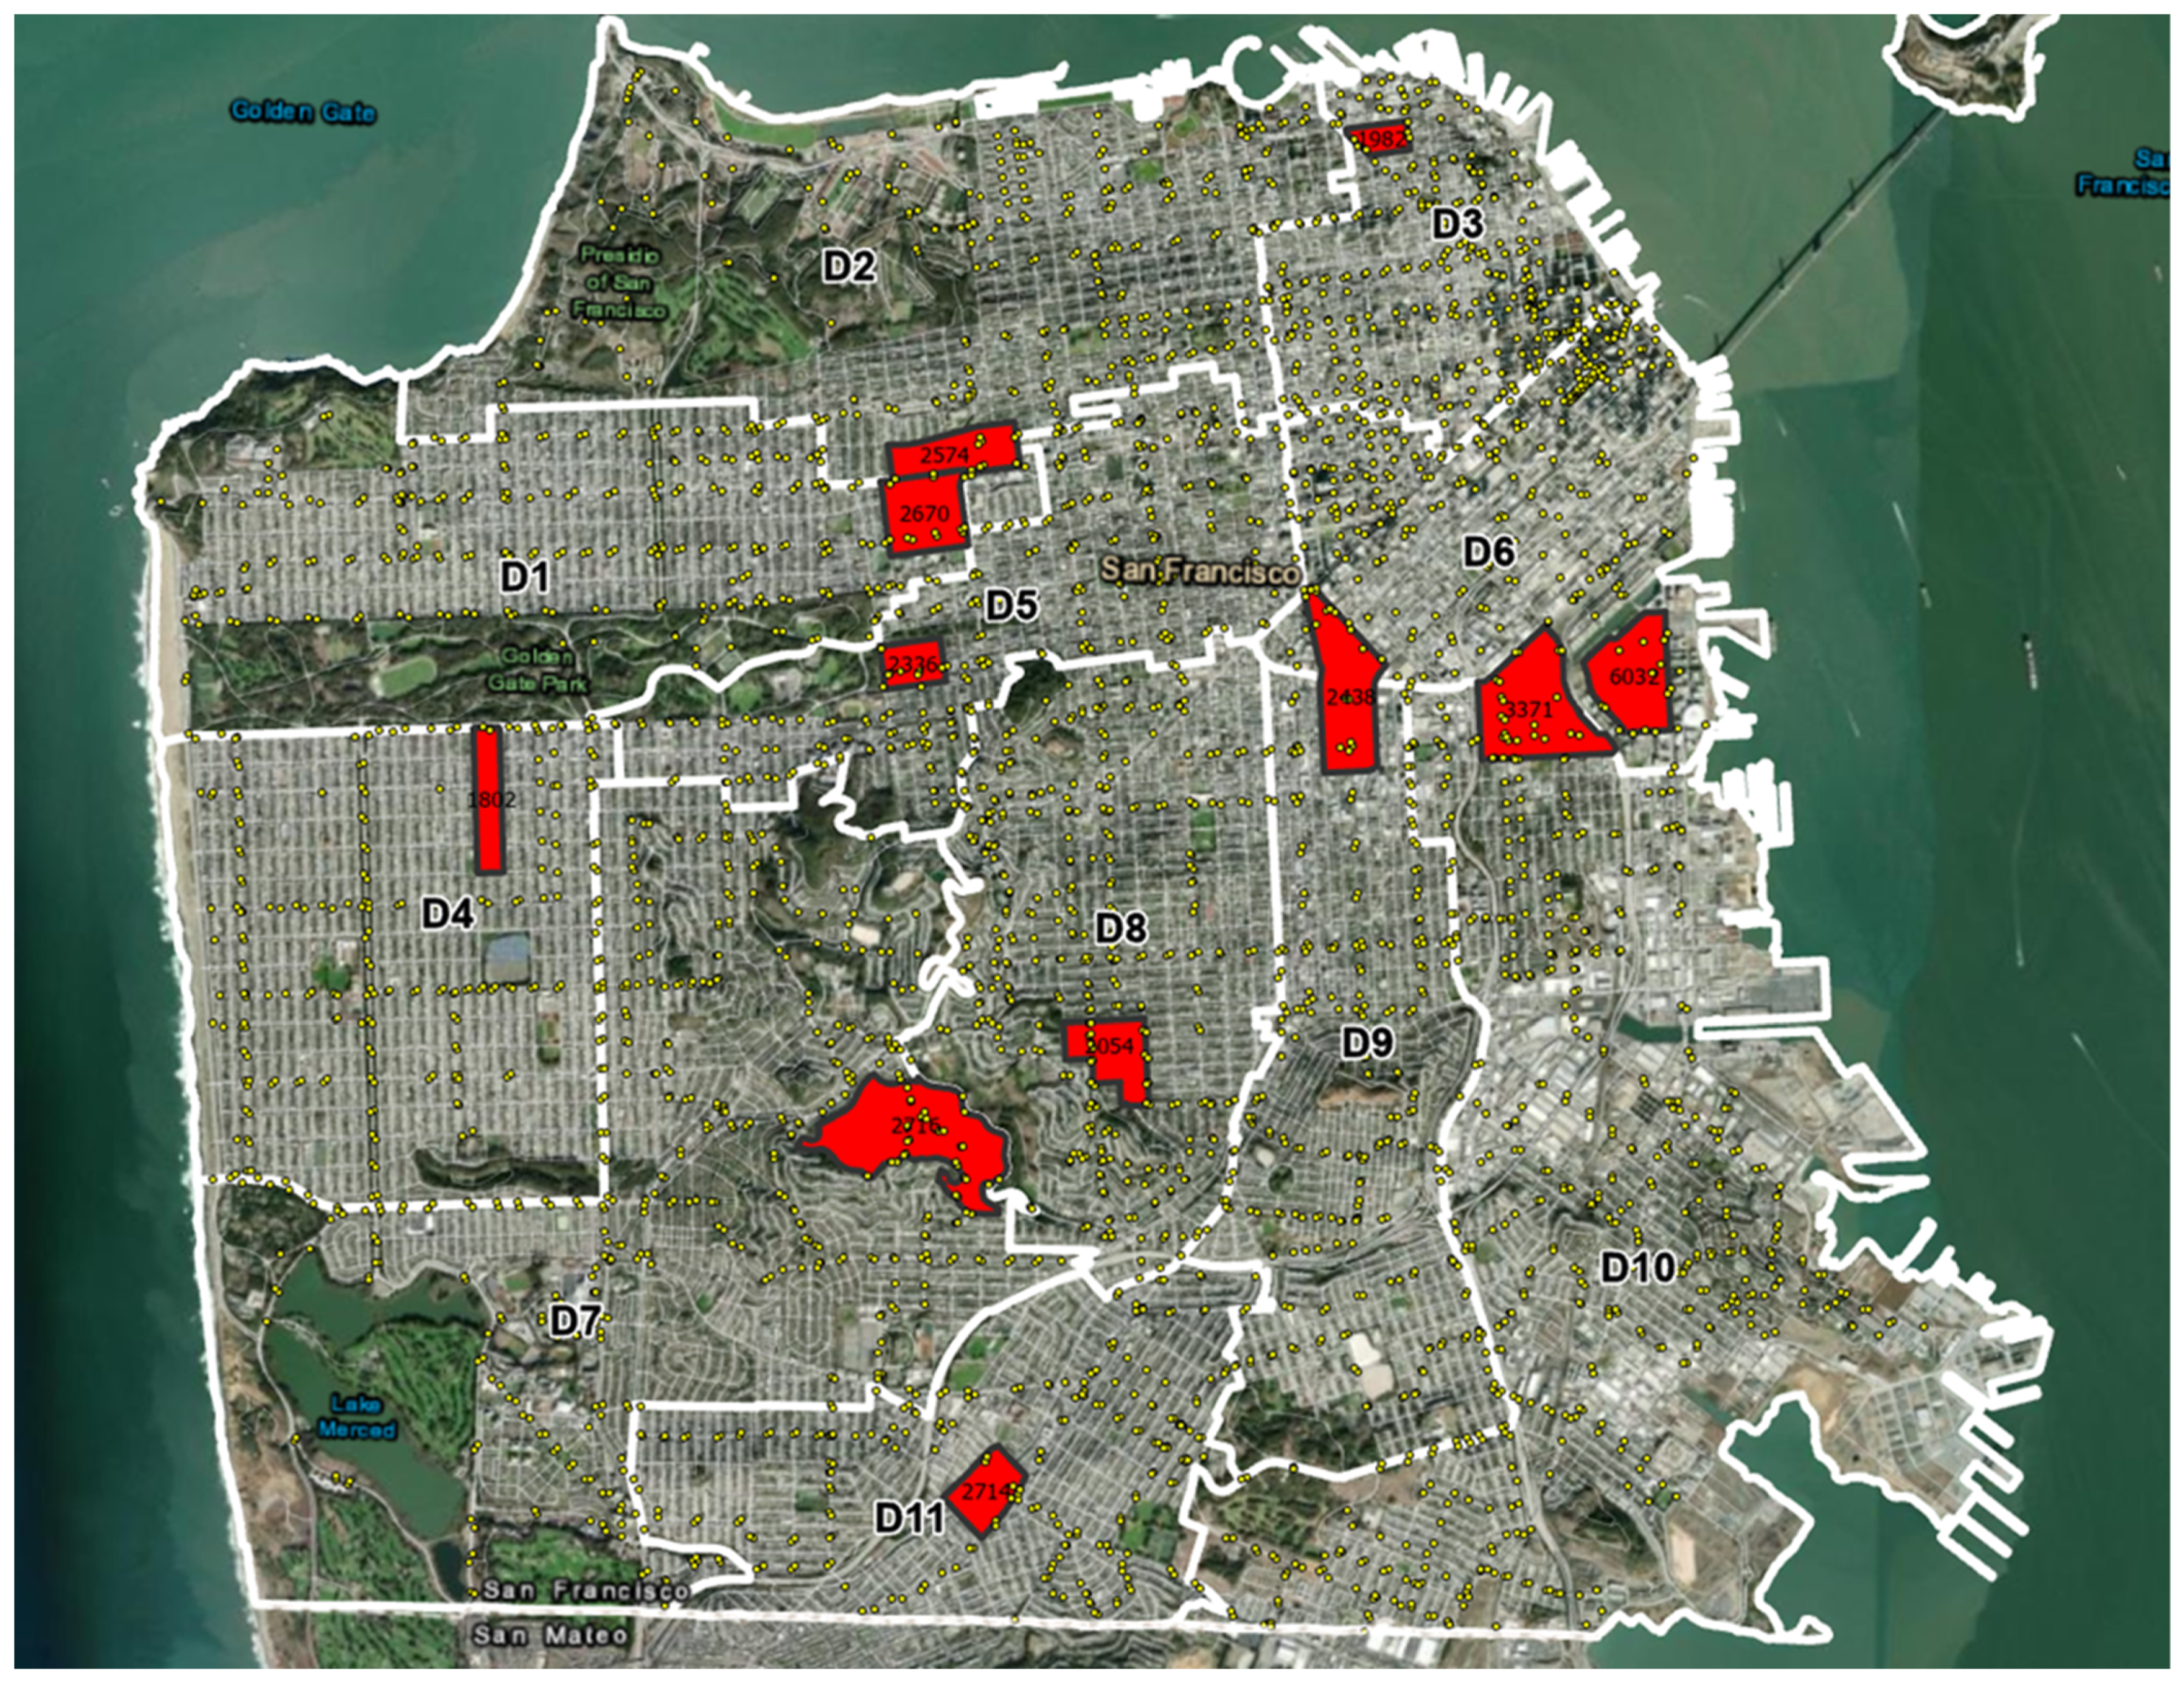
Figure 3 shows the 10 min street walk isochrones (red lines) from each vertiport (green circles). Walking 10 min from each vertiport covered 41.6% of the total road network length and 49.8% of all bus stop locations (yellow dots). That is, the walk time to reach the remaining 50.2% of activity points will be longer than 10 min. The isochrone map also revealed that 124,027 of the 252,891 businesses (49%) are accessible within the 10 min walk time from each vertiport. Additionally, the isochrones cover approximately 47% of the schools in all districts. As observed, the gaps on the isochrone map are mostly parks, green areas, and lakes, which is a consequence of a lack of activity points in those locations.

Figure 3.
Ten-minute street walk isochrones from each vertiport.
Figure 4 shows the walk-time distribution for the above coverage scenario with a Gaussian distribution fit. The outliers of this distribution are from 28 to 38 min which contained only 0.89% of the instances. After excluding the outliers, a chi-square test for normality produced a p-value of 0.35, which means that the test could not reject the null hypothesis that the distribution follows a Gaussian. This finding suggests that, based on the properties of a normal distribution, a spatially optimized placement of vertiports in this scenario has a central tendency towards a 10 min walk for two-thirds of the demand locations.
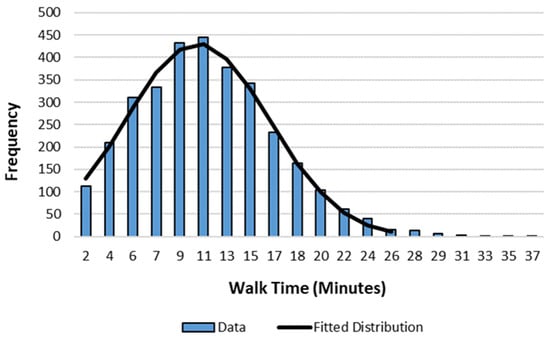
Figure 4.
Walk-time distribution to all bus stops with equalized walk-time scenario.
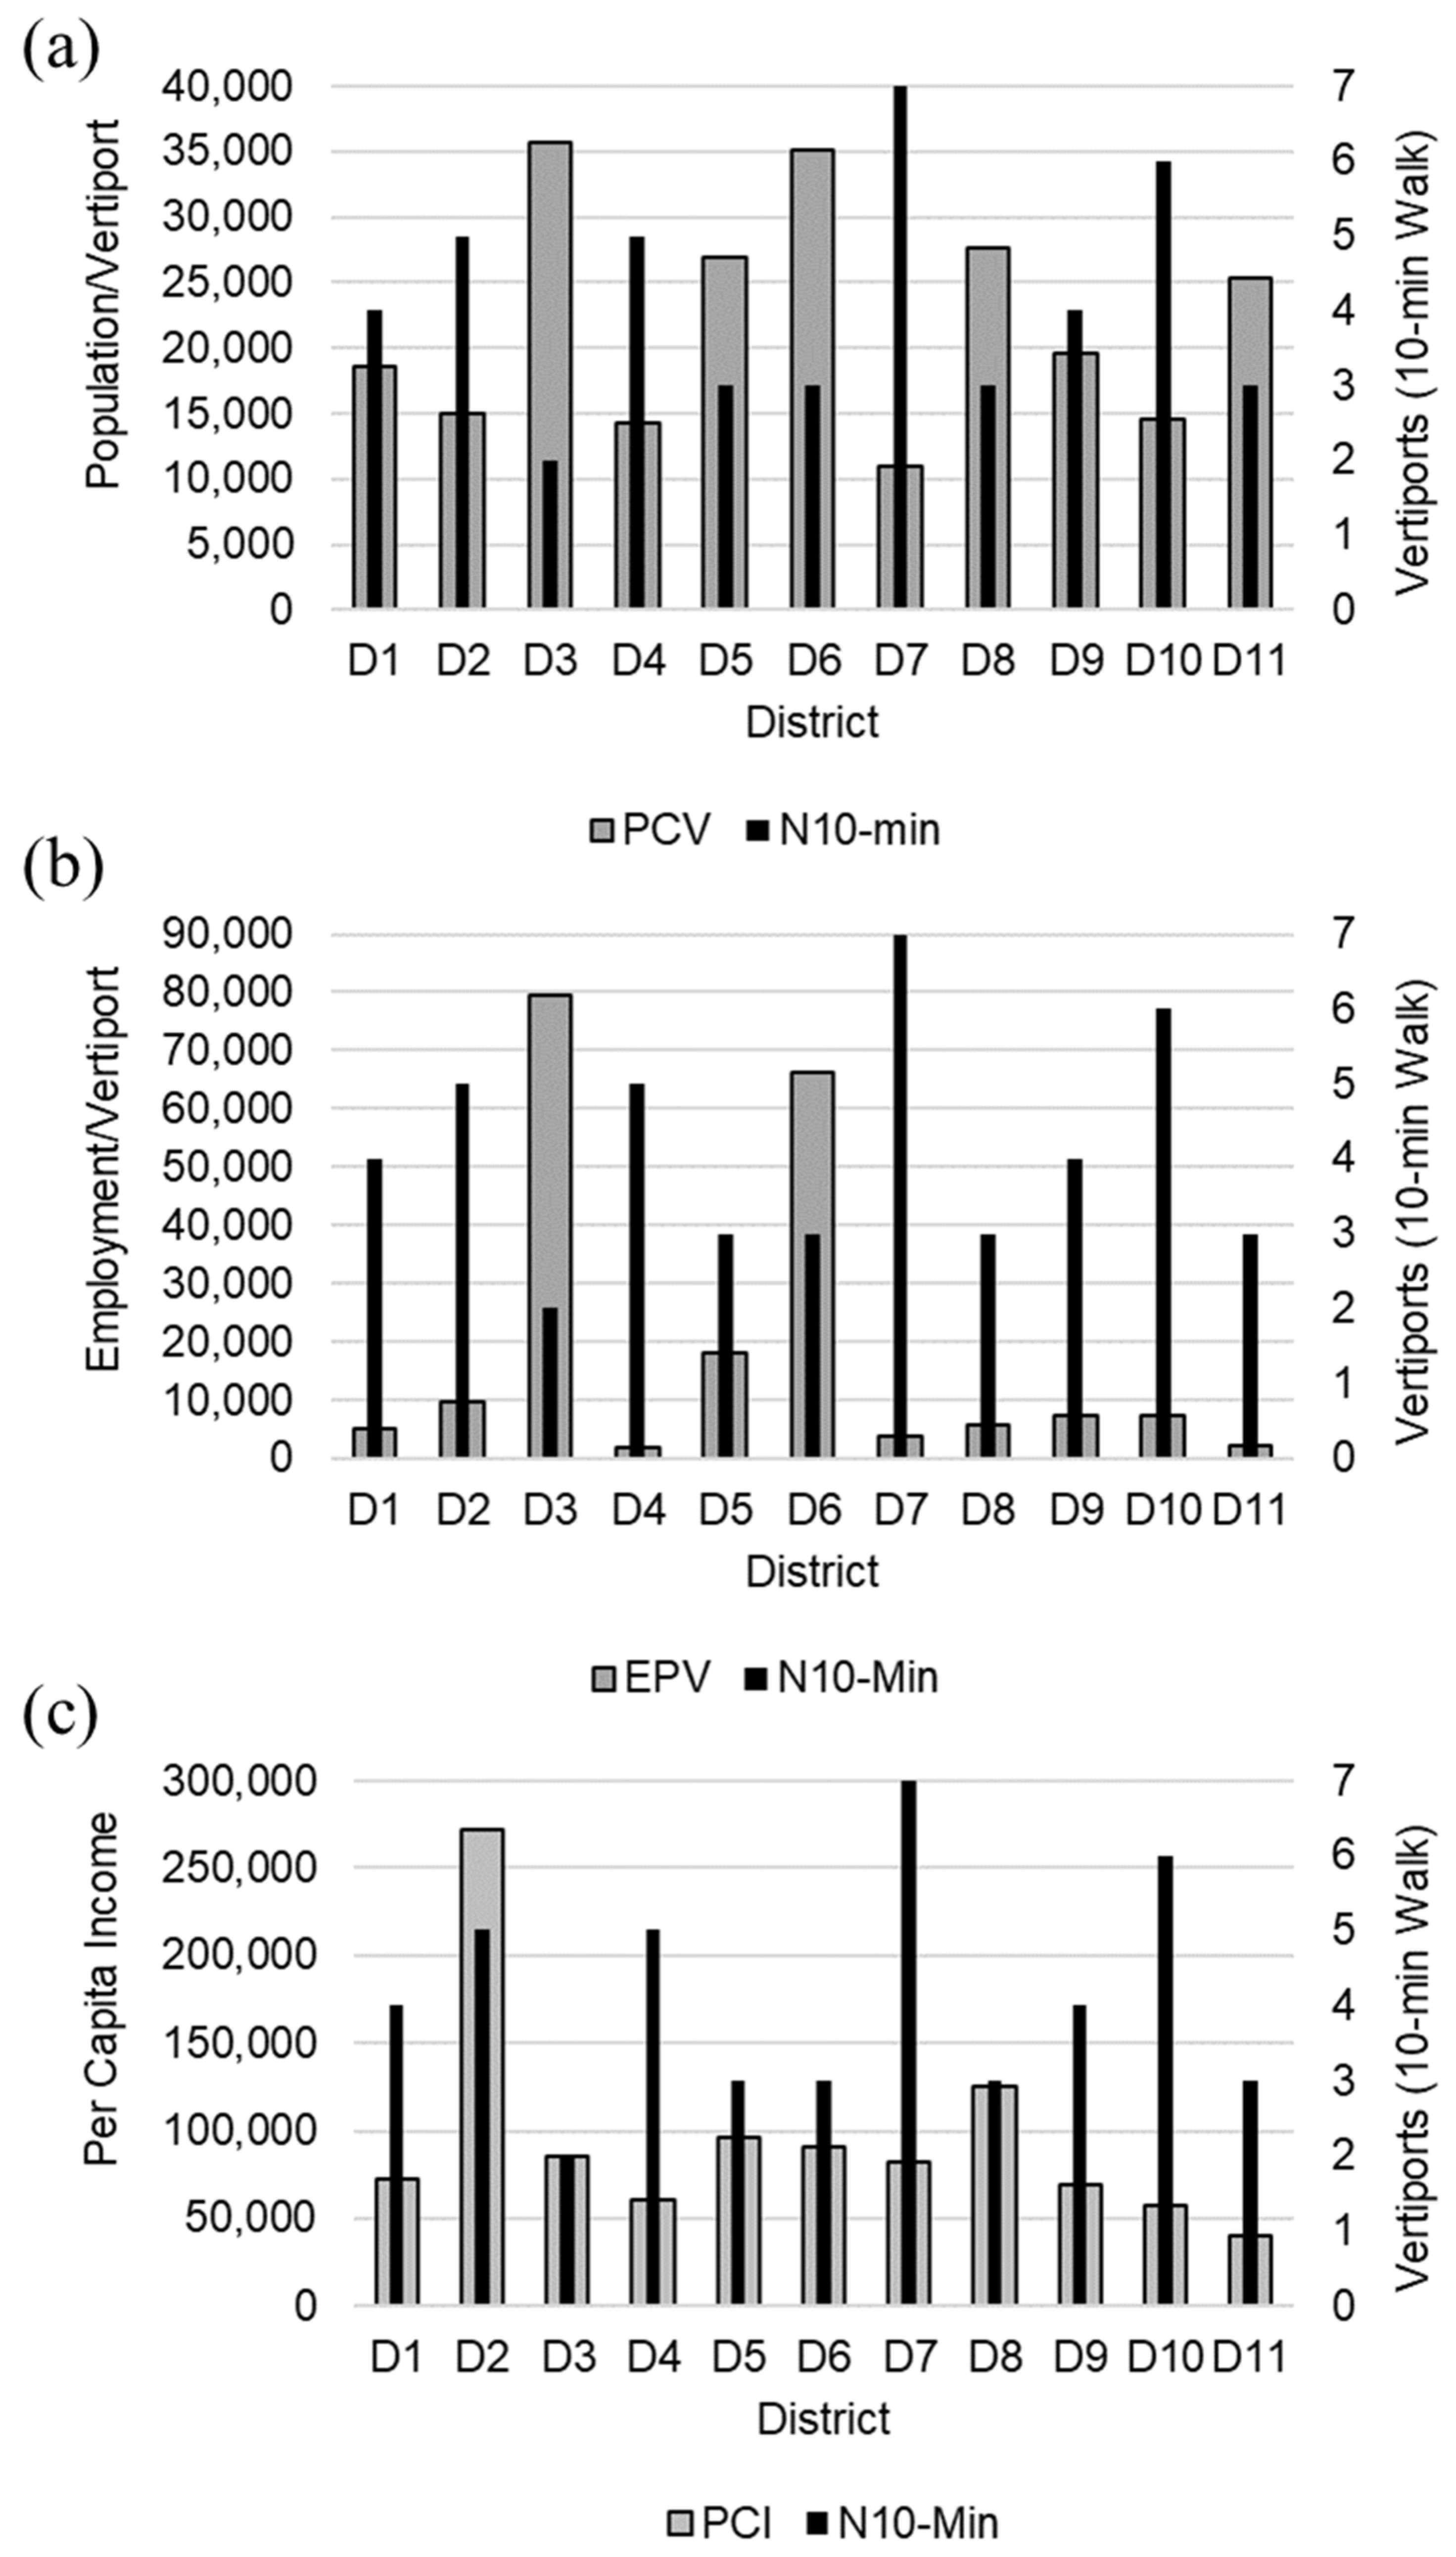
Figure 5 presents the tradeoff scenarios considering three additional demand factors: population, employment, and per capita income. Table 3 presents all trade-off scenarios including minimum distance, population, employment, and income. The “N 10 min” column represents the number of vertiports required for a 10 min average walk time to all bus stops within the district. The “N Capped” column represents capping the number of vertiports per district to four, which is the point of diminishing returns per the trend charts. The values under µ minutes are the resulting average walk time to all the bus stops for that district. PPV, EPV, and PCI are the population, employment, and income per vertiport, respectively. Planners can use these figures to tradeoff walk time equalization (accessibility) with demand equalization based on population, employment, and income level. For example, district 7 has the highest number of vertiports, but the lowest potential demand based on employment and population. Therefore, reducing the number of vertiports will trade off an increase in walk time for an increase in potential demand. District 2 may require more than four vertiports based on potential high demand due to population and income.

Figure 5.
Candidate locations of vertiports in San Francisco. Vertiports per district for a 10 min walk compared with (a) population per vertiport (PCV), (b) employment per vertiport (EPV), and (c) per capita income (PCI).
Table 3.
Trade-off scenarios with maximum 4 vertiports per district.
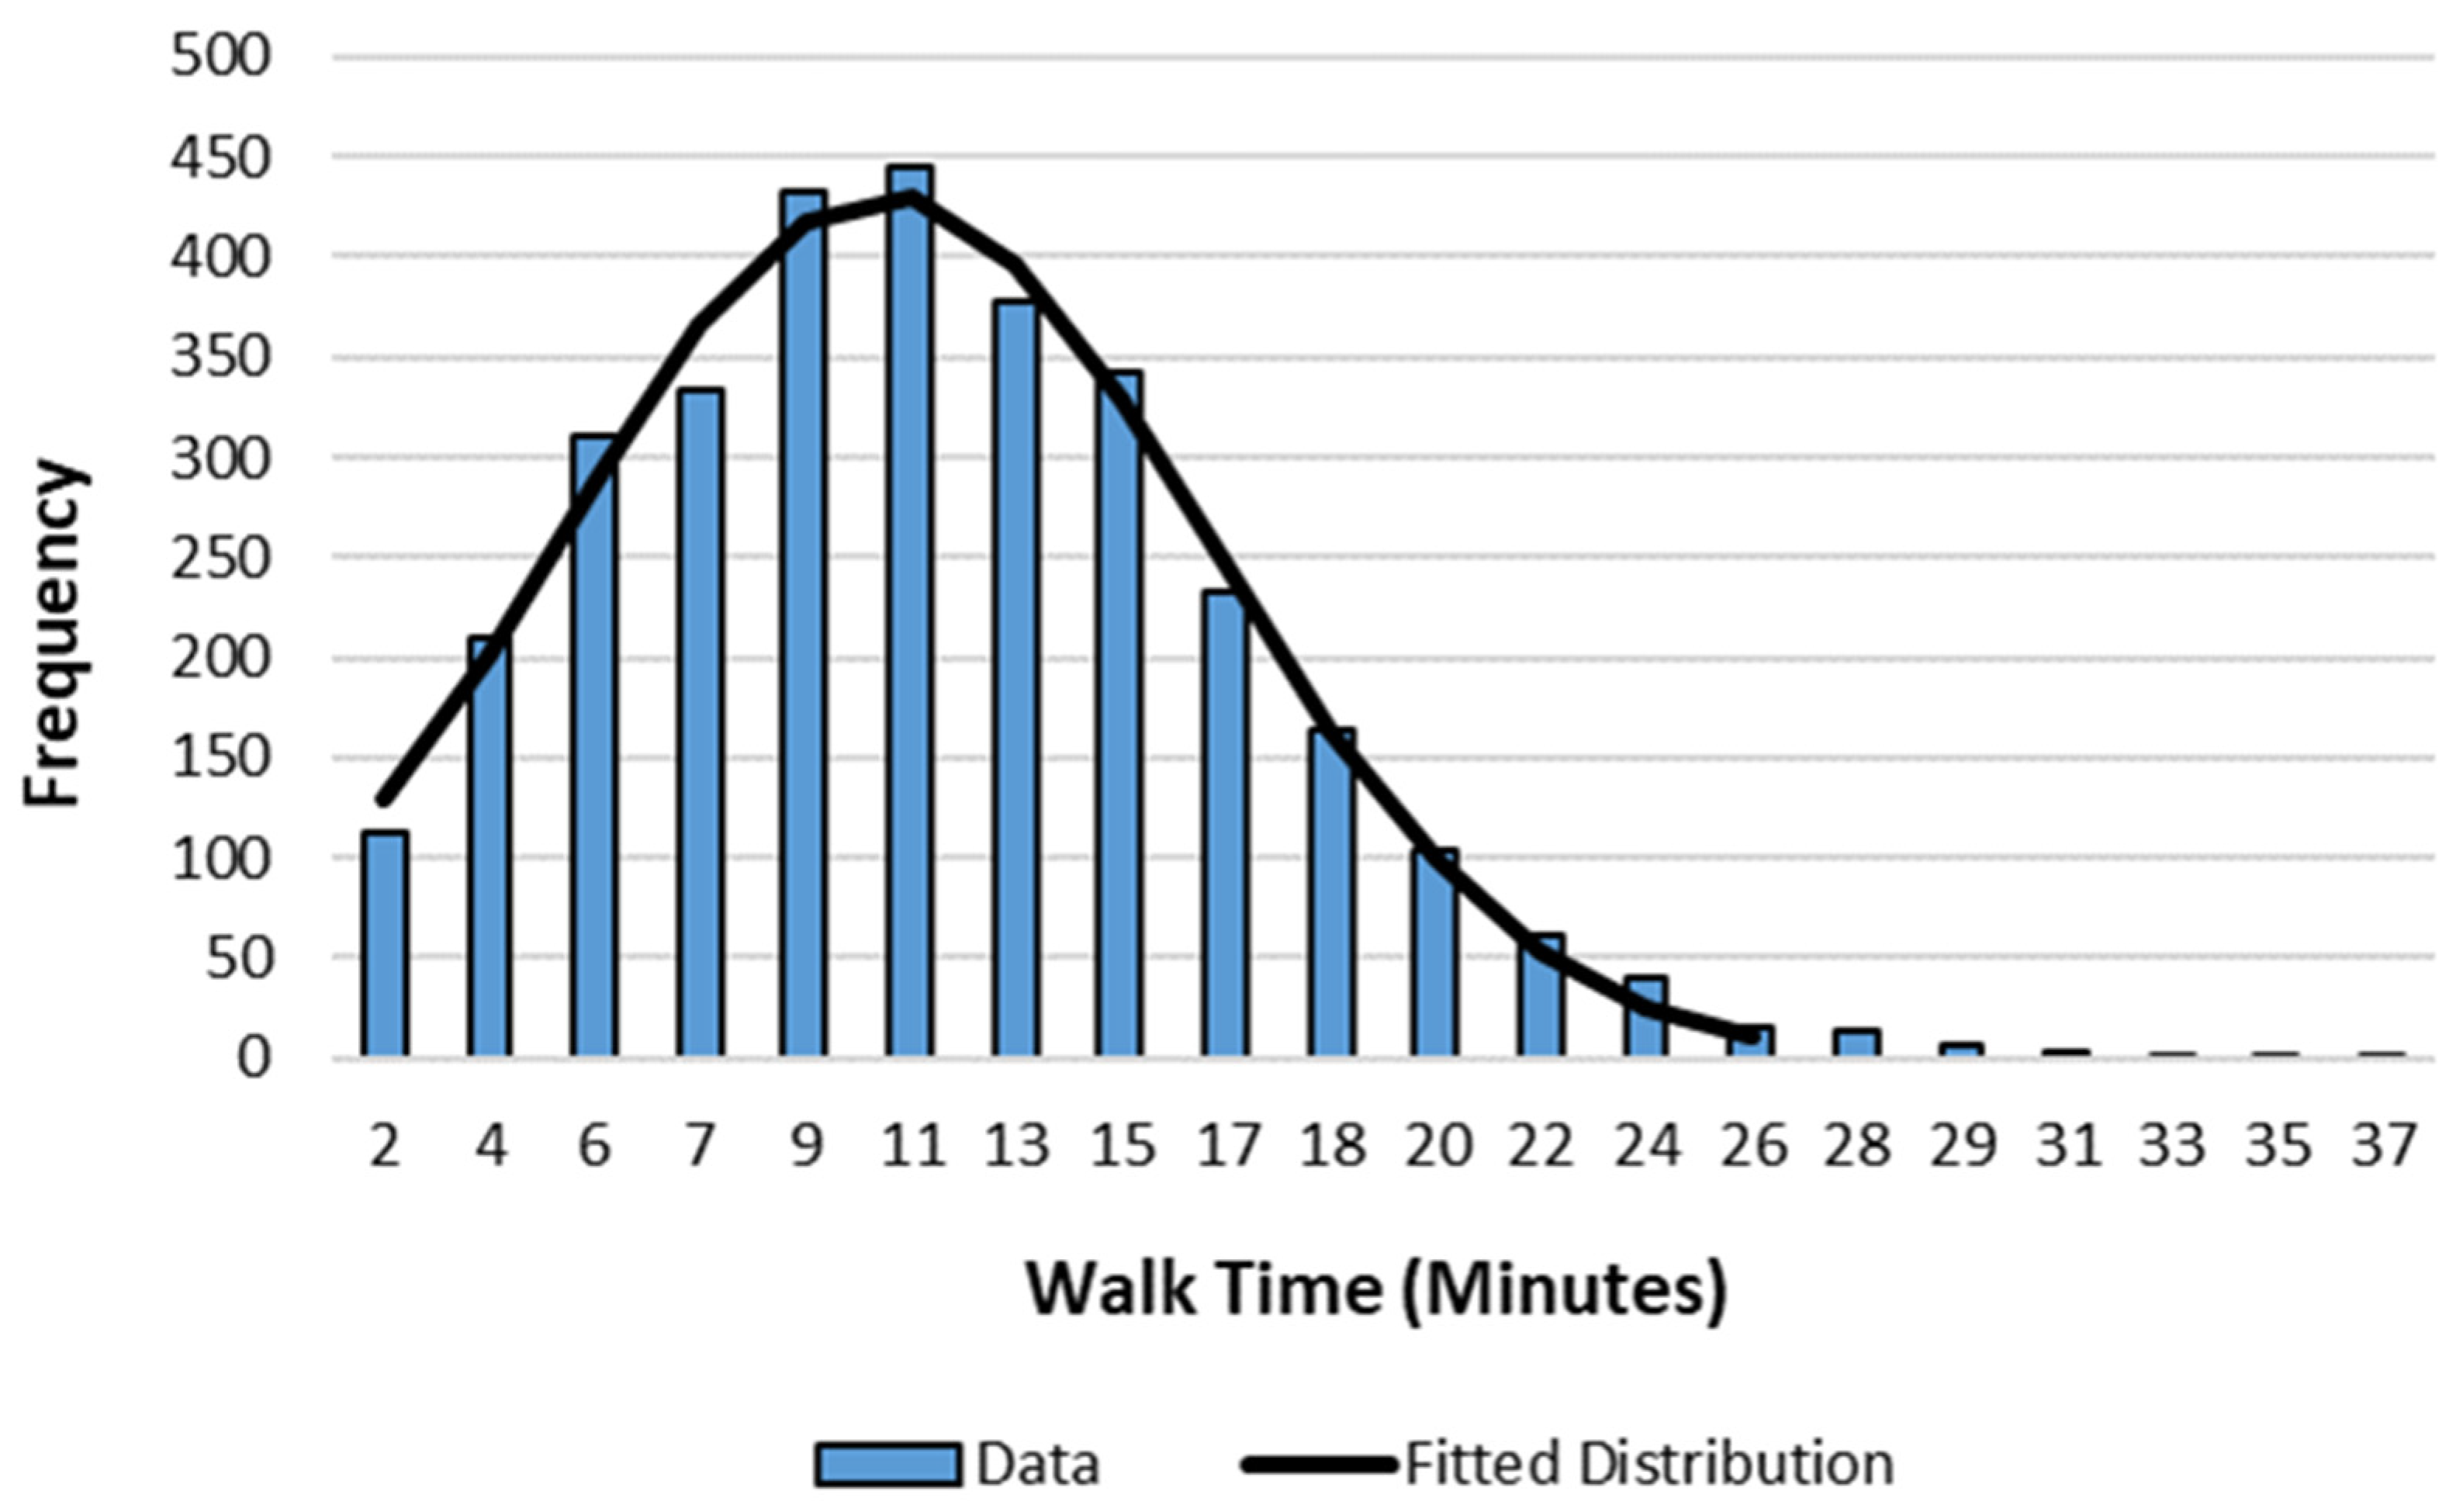
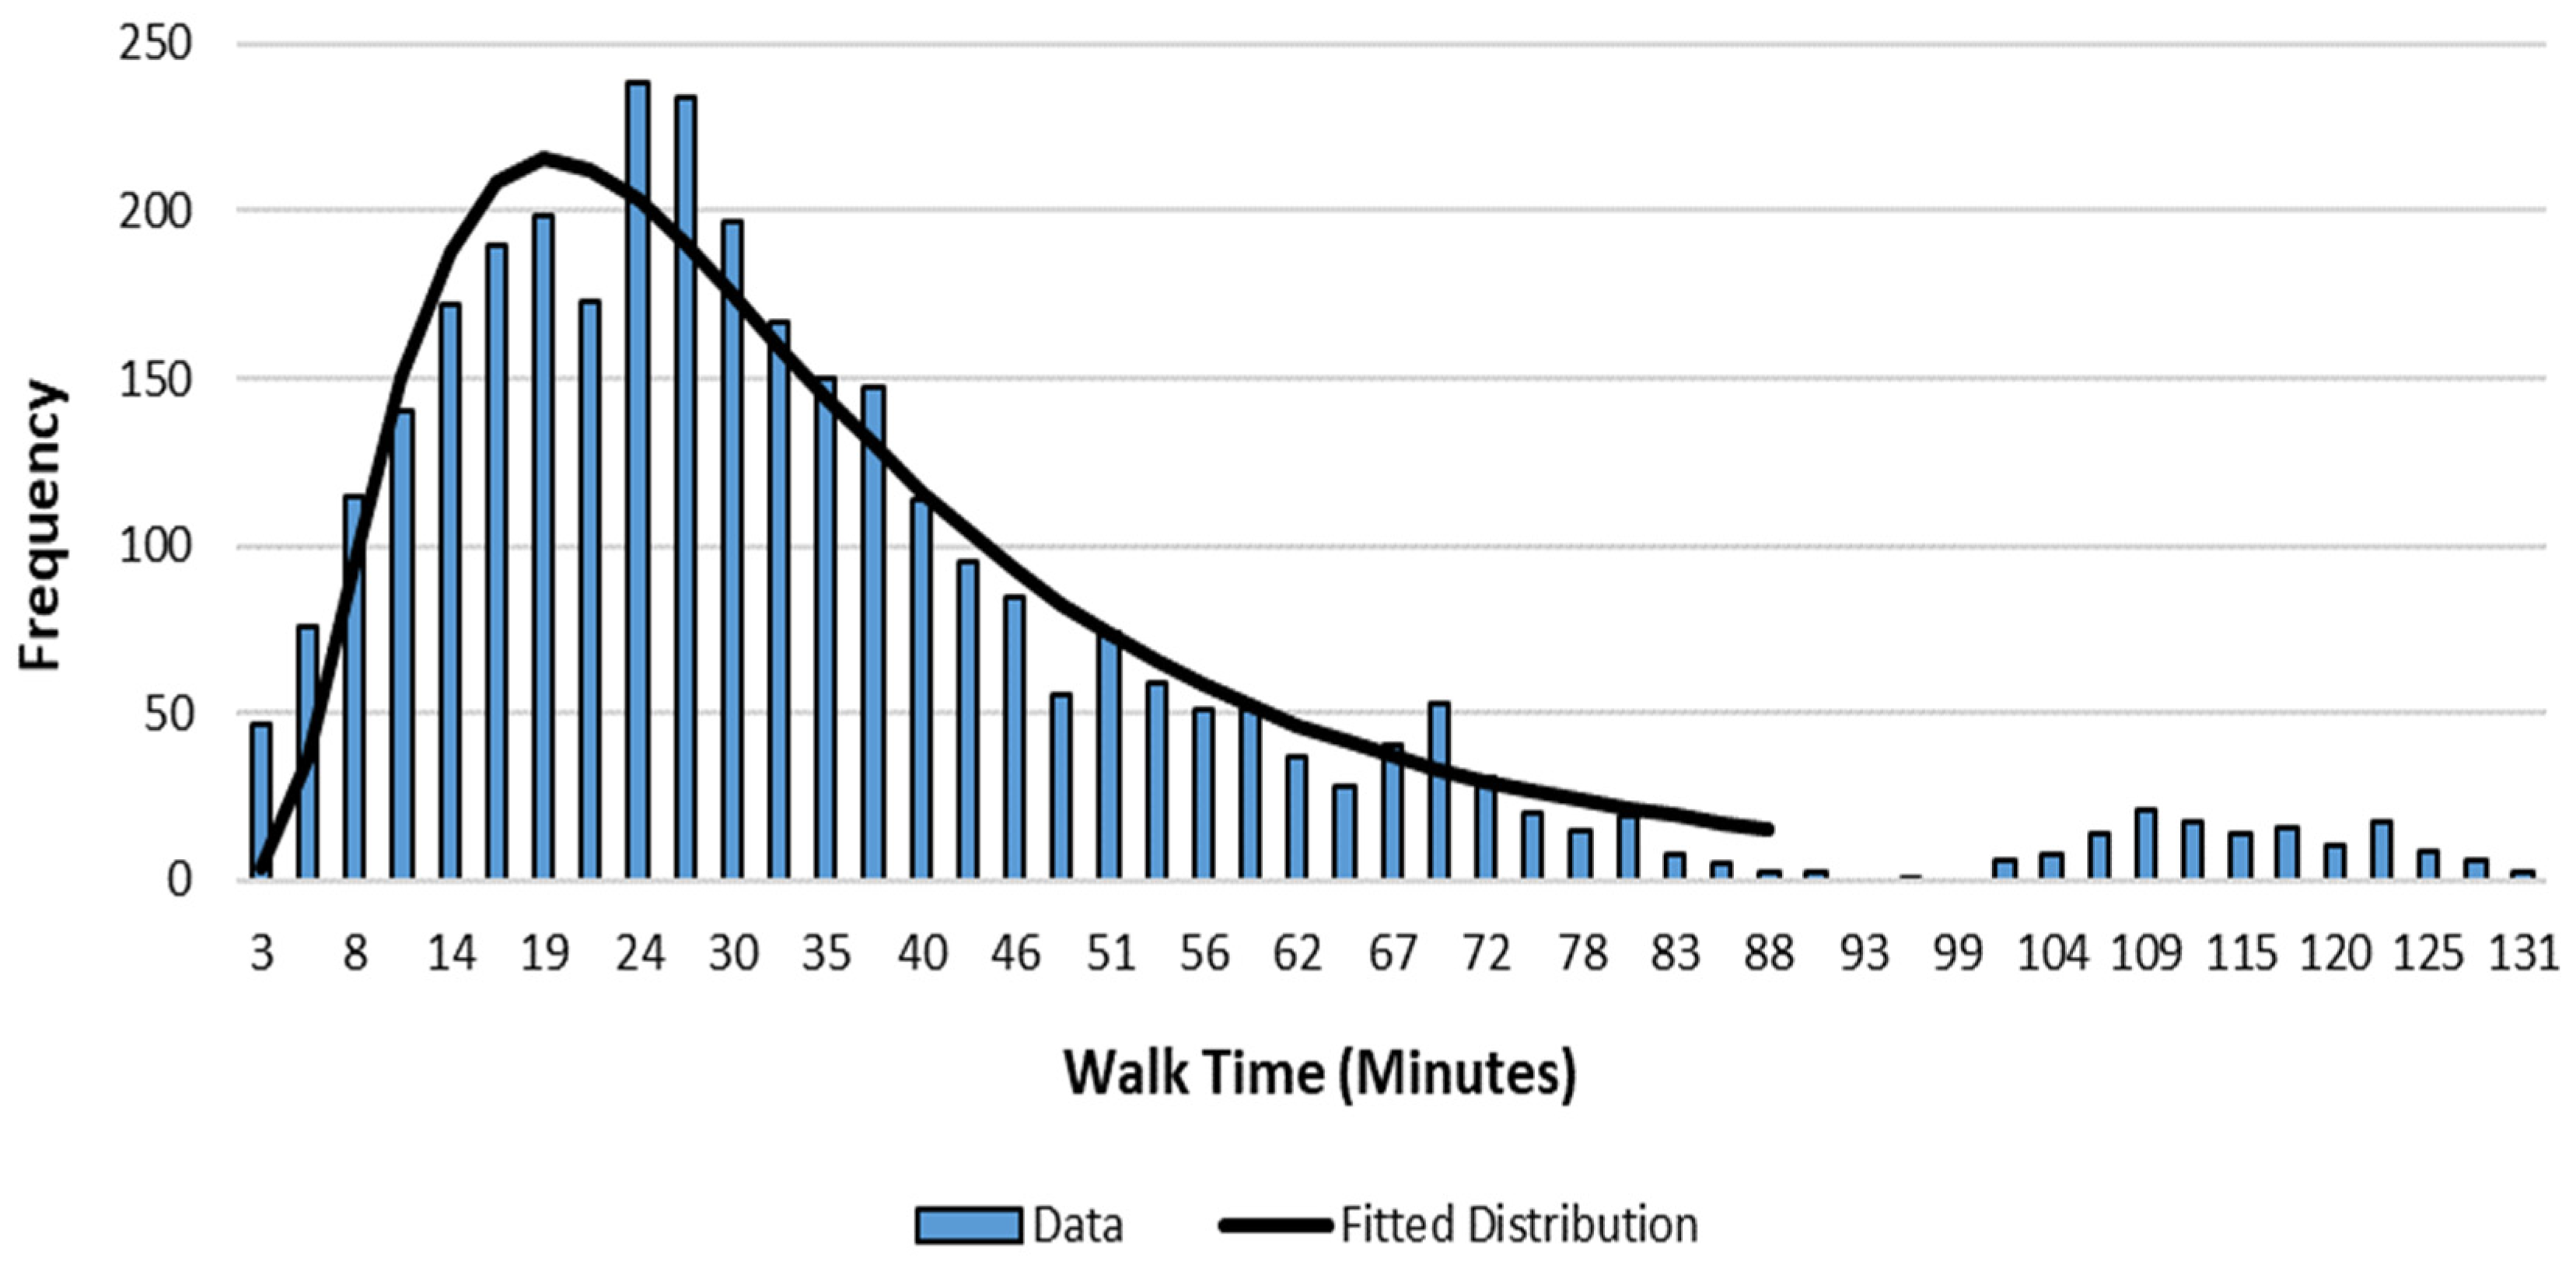
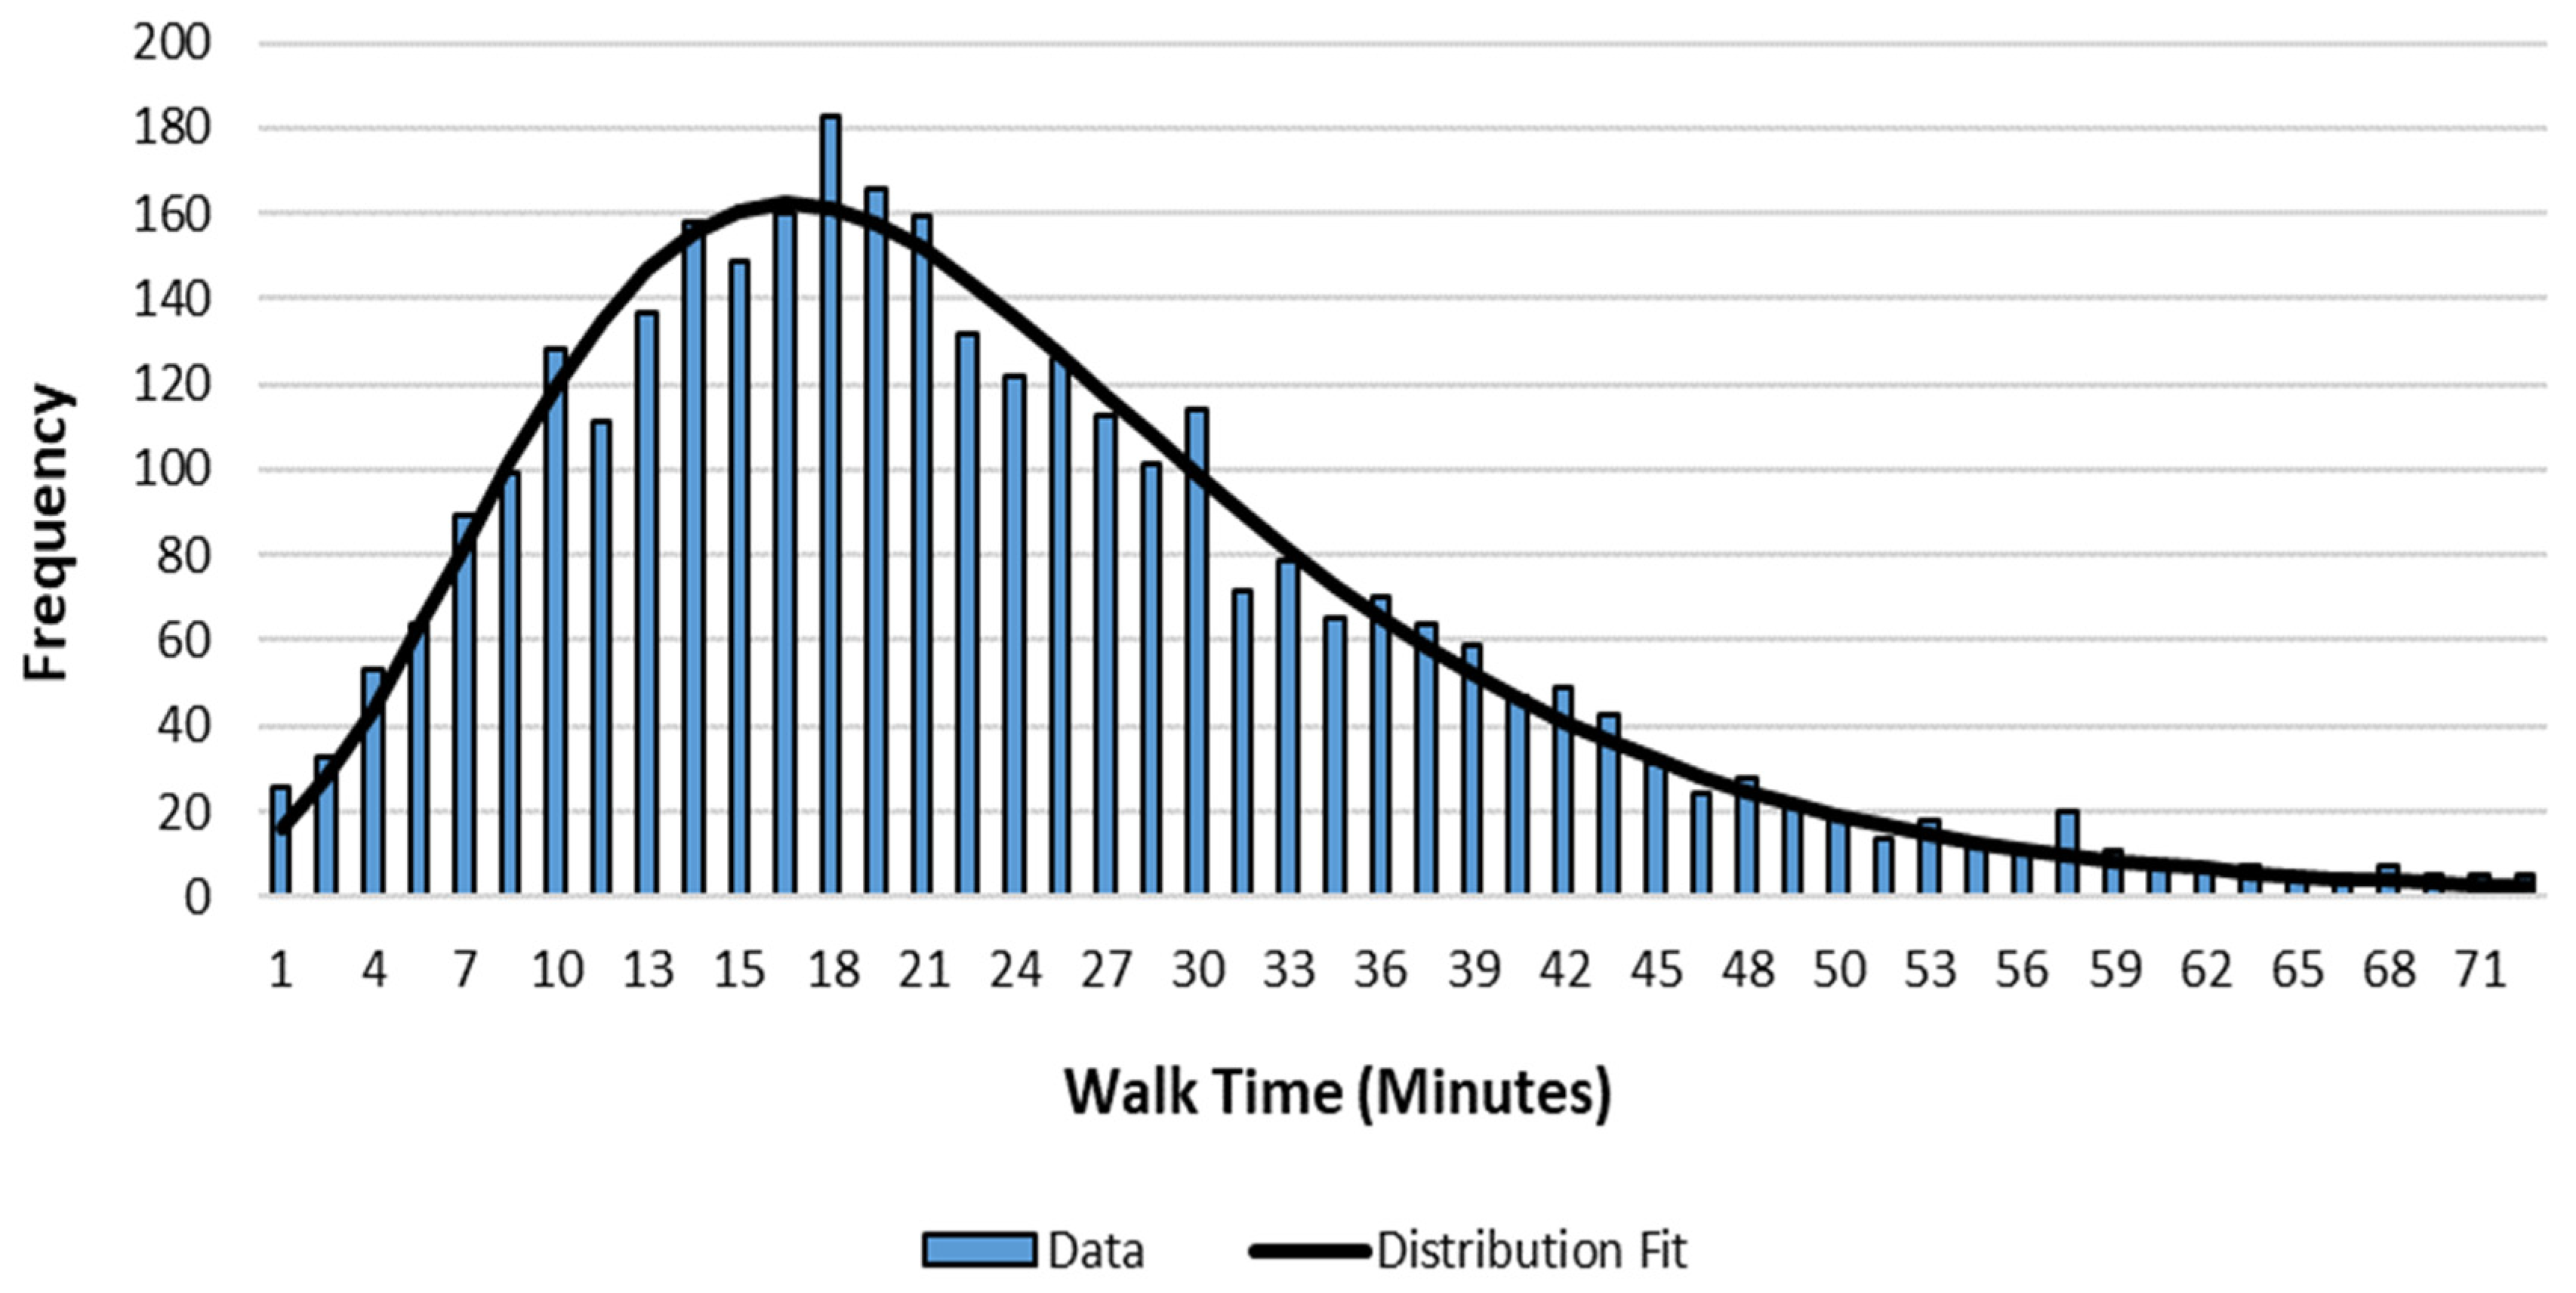
Figure 6 shows the highest population tracts in each district to consider for the case of placing a single vertiport to compare the distributions with the single optimal placement. Figure 7 and Figure 8 show the walk-time distribution for the single vertiport placement in the highest population tracts of each district and the optimal placement, respectively. The best fit distributions for each are the lognormal. The chi-squared test provided a p-value of zero and 0.25 for the highest population tract and optimal scenarios, respectively. Therefore, only the optimal placement case followed a classic distribution for the walk time. Moreover, the highest population tract exhibited some bi-modality, suggesting a strong bias toward poor accessibility. The optimal placement strategy reduced both the mean and variance in walk time over the alternative placement strategy.
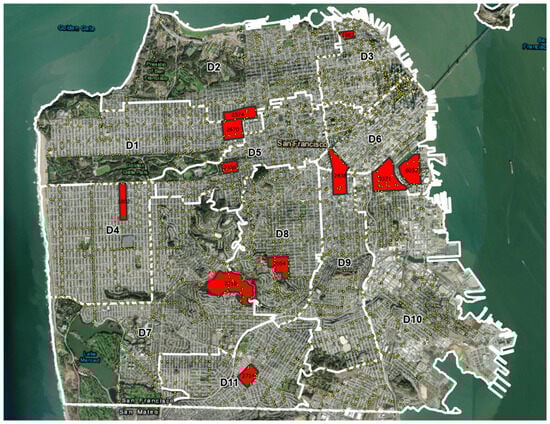
Figure 6.
Highest population tracts within district.

Figure 7.
Overall walk-time distribution for a single vertiport placed in the highest population tracts.
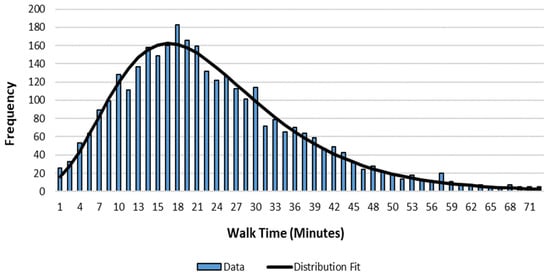
Figure 8.
Overall walk-time distribution for a single vertiport optimally placed in each district.
5. Conclusions
The previous studies related to vertiport ground infrastructure planning mostly focused on the integration of UAM within the National Airspace System (NAS). Very few of the previous studies considered integration with the existing public transportation system as a criterion for selecting vertiport locations. Additionally, there were gaps in the methodologies such as considering sub-groups of networks rather than the entire transportation network. This study mitigated the above study gaps and developed a methodology to identify vertiport locations that optimize UAM access to a maximum number of bus stops with minimum travel time. This study also established a rationale for planners to identify tradeoff points to make data-driven decisions regarding the optimal number of vertiports to place in each district of San Francisco. Planners can replicate the approach to make decisions regarding the integration of UAM with existing public transit systems in other urban areas suitable for UAM services, for example, Phoenix and Dallas.
There are several limitations in this study. The optimization model for each district only considered minimizing the network distance among the vertiports and bus stops within a district boundary. This study did not conduct any location suitability analysis near SF bus stops to identify if there is any available land or buildings to repurpose near an existing SF bus stop. Analysts may consider extending this optimization model with an objective function that minimizes network distance from the vertiports within a district to all the bus stops within the city. In future studies, planners can conduct a location suitability analysis by scouting locations near transit points to identify available space for vertiports, including considerations for cost, economic, and environmental impacts. This study only considered bus stops as representative of the transit system.
The current scope is a first step in exploring the possibilities of UAM integration with the existing transportation system of a large city. By focusing the analysis on a city, this study captured the impacts from its unique urban layout and transportation challenges as they relate to the development of urban air mobility. Hence, future work should consider the impact of layout factors when extending the case study area outside of the city, such as the entire SF Bay area. Future studies could also include BART rail stations or multimodal transit centers in addition to bus stops to cover the entire multimodal surface transit infrastructure in the city. Researchers may also consider other demand factors such as income and employment to observe changes in the isochrone map and walk-time distribution. The outcome of this study will help agencies and service providers to make investment decisions regarding the infrastructure development of UAM.
Author Contributions
Conceptualization, B.R. and R.B.; methodology, B.R. and R.B.; software, B.R. and M.F.H.; formal analysis, M.F.H., B.R. and R.B.; data curation, B.R. and M.F.H.; writing—original draft preparation, B.R. and R.B.; writing—review and editing, B.R., R.B., M.F.H. and D.M.; visualization, M.F.H., B.R. and R.B.; supervision, R.B. and D.M. All authors have read and agreed to the published version of the manuscript.
Funding
This research received no specific grant or funding from any funding agency or source.
Data Availability Statement
Data are contained within the article.
Conflicts of Interest
The authors declare no conflict of interest.
References
- Willey, L.C.; Salmon, J.L. A method for urban air mobility network design using hub location and subgraph isomorphism. Transp. Res. Part C Emerg. Technol. 2021, 125, 102997. [Google Scholar] [CrossRef]
- Treeck, H. Volocopter Air Taxi Flies over Singapore’s Marina Bay—Volocopter. 22 October 2019. Available online: https://www.volocopter.com/en/newsroom/volocopter-air-taxi-flies-over-singapores-marina-bay (accessed on 15 June 2023).
- Valente, F. Frost & Sullivan Presents the Evolving Urban Air Mobility Landscape up to 2040. 12 December 2022. Available online: https://www.frost.com/news/press-releases/frost-sullivan-presents-the-evolving-urban-air-mobility-landscape-up-to-2040/ (accessed on 15 June 2023).
- Yedavalli, P.; Cohen, A. Planning Land Use Constrained Networks of Urban Air Mobility Infrastructure in the San Francisco Bay Area. Transp. Res. Rec. J. Transp. Res. Board 2022, 2676, 106–116. [Google Scholar] [CrossRef]
- Garrow, L.A.; German, B.J.; Leonard, C.E. Urban air mobility: A comprehensive review and comparative analysis with autonomous and electric ground transportation for informing future research. Transp. Res. Part C Emerg. Technol. 2021, 132, 103377. [Google Scholar] [CrossRef]
- Straubinger, A.; Fu, M. Identification of strategies how urban air mobility can improve existing public transport networks. In Proceedings of the Mobil, TUM, Munich, Germany, 11–12 September 2019. [Google Scholar]
- Reiche, C.; Cohen, A.P.; Fernando, C. An Initial Assessment of the Potential Weather Barriers of Urban Air Mobility. IEEE Trans. Intell. Transp. Syst. 2021, 22, 6018–6027. [Google Scholar] [CrossRef]
- Ploetner, K.O.; Al Haddad, C.; Antoniou, C.; Frank, F.; Fu, M.; Kabel, S.; Llorca, C.; Moeckel, R.; Moreno, A.T.; Pukhova, A.; et al. Long-term application potential of urban air mobility complementing public transport: An upper Bavaria example. CEAS Aeronaut. J. 2020, 11, 991–1007. [Google Scholar] [CrossRef]
- Bauranov, A.; Rakas, J. Designing airspace for urban air mobility: A review of concepts and approaches. Prog. Aerosp. Sci. 2021, 125, 100726. [Google Scholar] [CrossRef]
- Fadhil, D.N.; Moeckel, R.; Rothfeld, R. GIS-based Infrastructure Requirement Analysis for an Electric Vertical Take-off and Landing Vehicle-based Transportation System. Transp. Res. Procedia 2019, 41, 101–103. [Google Scholar] [CrossRef]
- Rothfeld, R.; Balac, M.; Ploetner, K.O.; Antoniou, C. Initial analysis of urban air mobility’s transport performance in Sioux falls. In Proceedings of the 2018 Aviation Technology, Integration, and Operations Conference, Atlanta, GA, USA, 25–29 June 2018. [Google Scholar]
- Wang, K.; Li, A.; Qu, X. Urban aerial mobility: Network structure, transportation benefits, and Sino-US comparison. Innovation 2023, 4, 100393. [Google Scholar] [CrossRef]
- Bassey, R. Engineering Brief No. 105, Vertiport Design; Federal Aviation Administration (FAA): Washington, DC, USA, 2022. [Google Scholar]
- Vitalle, R.F.; Zhang, Y.; Normann, B.; Shen, N. A Model for the Integration of UAM operations in and near Terminal Areas. In Proceedings of the Aiaa Aviation 2020 Forum, Virtual, 15–19 June 2020. [Google Scholar]
- Wu, Z.; Zhang, Y. Integrated Network Design and Demand Forecast for On-Demand Urban Air Mobility. Engineering 2021, 7, 473–487. [Google Scholar] [CrossRef]
- Tuchen, S.; LaFrance-Linden, D.; Hanley, B.; Lu, J.; McGovern, S.; Litvack-Winkler, M. Urban Air Mobility (UAM) and Total Mobility Innovation Framework and Analysis Case Study: Boston Area Digital Twin and Economic Analysis. In Proceedings of the IEEE/AIAA 41st Digital Avionics Systems Conference (DASC), Portsmouth, VA, USA, 18–22 September 2022. [Google Scholar]
- Antcliff, K.R.; Moore, M.D.; Goodrich, K.H. Silicon Valley as an early adopter for on-demand civil VTOL operations. In Proceedings of the 16th AIAA Aviation Technology, Integration, and Operations Conference, Washington, DC, USA, 12–16 July 2016. [Google Scholar]
- Skabardonis, A.; Varaiya, P.; Petty, K.F. Measuring Recurrent and Nonrecurrent Traffic Congestion. Transp. Res. Rec. J. Transp. Res. Board 2003, 1856, 118–124. [Google Scholar] [CrossRef]
- Schweiger, K.; Preis, L. Urban Air Mobility: Systematic Review of Scientific Publications and Regulations for Vertiport Design and Operations. Drones 2022, 6, 179. [Google Scholar] [CrossRef]
- Fontaine, P. Urban Air Mobility (UAM) Concept of Operation Version 2.0; Federal Aviation Administration: Washington, DC, USA, 2023. [Google Scholar]
- Johnston, T.; Riedel, R.; Sahdev, S. McKinsey & Company-Automotive and Assembly; 31 August 2020. Available online: https://www.mckinsey.com/industries/automotive-and-assembly/our-insights/to-take-off-flying-vehicles-first-need-places-to-land (accessed on 4 July 2023).
- Kai, W.; Jacquillat, A.; Vaze, V. Vertiport Planning for Urban Aerial Mobility: An Adaptive Discretization Approach. Manuf. Serv. Oper. Manag. 2022, 24, 3215–3235. [Google Scholar] [CrossRef]
- Johnson, W.; Silva, C. NASA concept vehicles and the engineering of advanced air mobility aircraft. Aeronaut. J. 2021, 126, 59–91. [Google Scholar] [CrossRef]
- Rostami, M.; Bardin, J.; Neufeld, D.; Chung, J. EVTOL Tilt-Wing Aircraft Design under Uncertainty Using a Multidisciplinary Possibilistic Approach. Aerospace 2023, 10, 718. [Google Scholar] [CrossRef]
- Ugwueze, O.; Statheros, T.; Horri, N.; Bromfield, M.A.; Simo, J. An Efficient and Robust Sizing Method for eVTOL Aircraft Configurations in Conceptual Design. Aerospace 2023, 10, 311. [Google Scholar] [CrossRef]
- Bridgelall, R.; White, S.; Tolliver, D. Integrating Electric Vertical Takeoff and Landing Aircraft into Public Airspace: A Scenario Study. Futur. Transp. 2023, 3, 1029–1045. [Google Scholar] [CrossRef]
- Goyal, R.; Reiche, C.; Fernando, C.; Serrao, J.; Kimmel, S.; Cohen, A.; Shaheen, S. Urban Air Mobility (UAM) Market Study; NASA: Washington, DC, USA, 2018. [Google Scholar]
- Loidl, M.; Witzmann-Müller, U.; Zagel, B. A spatial framework for Planning station-based bike sharing systems. Eur. Transp. Res. Rev. 2019, 11, 9. [Google Scholar] [CrossRef]
- Askarzadeh, T.; Bridgelall, R. Micromobility Station Placement Optimization for a Rural Setting. J. Adv. Transp. 2021, 2021, 9808922. [Google Scholar] [CrossRef]
- Holden, J.; Goel, N. Fast-Forwarding to a Future of On-Demand Urban Air Transportation. 27 October 2016. Available online: https://evtol.news/__media/PDFs/UberElevateWhitePaperOct2016.pdf (accessed on 4 July 2023).
- Bulusu, V.; Onat, E.; Sengupta, R.; Yedavalli, P.; Macfarlane, J. A traffic demand analysis method for urban air mobility. IEEE Trans. Intell. Transp. Syst. 2021, 22, 6039–6047. [Google Scholar] [CrossRef]
- Gentile, G.; Meschini, L.; Papola, N. Spillback congestion in dynamic traffic assignment: A macroscopic flow model with time-varying bottlenecks. Transp. Res. Part B Methodol. 2007, 41, 1114–1138. [Google Scholar] [CrossRef]
- Syed, N.; Rye, M.; Ade, M.; Trani, A.; Hinze, N.; Swingle, H.; Smith, J.C.; Dollyhigh, S.; Marien, T. Preliminary considerations for ODM air traffic management based on analysis of commuter passenger demand and travel patterns for the Silicon Valley region of California. In Proceedings of the 17th AIAA Aviation Technology, Integration, and Operations Conference, Denver, CO, USA, 5–9 June 2017. [Google Scholar]
- Rajendran, S.; Srinivas, S. Air taxi service for urban mobility: A critical review of recent developments, future challenges, and opportunities. Transp. Res. Part E Logist. Transp. Rev. 2020, 143, 102090. [Google Scholar] [CrossRef]
- SFMTA. Travel Decisions Survey 2021; San Francisco Municipal Transportation Agency: San Francisco, CA, USA, 2021. [Google Scholar]
- Berawi, M.A.; Saroji, G.; Iskandar, F.A.; Ibrahim, B.E.; Miraj, P.; Sari, M. Optimizing Land Use Allocation of Transit-Oriented Development (TOD) to Generate Maximum Ridership. Sustainability 2020, 12, 3798. [Google Scholar] [CrossRef]
- Li, Y.; Guo, H.L.; Li, H.; Xu, G.H.; Wang, Z.R.; Kong, C.W. Transit-Oriented Land Planning Model Considering Sustainability of Mass Rail Transit. J. Urban Plan. Dev. 2010, 136, 243–248. [Google Scholar] [CrossRef]
- Dock, F.C.; Swenson, C.J. Transit-Oriented Urban Design Impacts on Suburban Land Use and Transportation Planning. Transp. Res. Rec. J. Transp. Res. Board 2003, 1831, 184–192. [Google Scholar] [CrossRef]
- United States Census Bureau. American Community Survey Data. Available online: https://www.census.gov/programs-surveys/acs/data.html (accessed on 4 July 2023).
- SFGov. San Francisco Open Data. Available online: https://datasf.org/opendata/ (accessed on 4 July 2023).
- Bridgelall, R. Tutorial and Practice in Linear Programming: Optimization Problems in Supply Chain and Transport Logistics. arXiv. 2023. arXiv:2211.07345v2. Available online: https://arxiv.org/abs/2211.07345 (accessed on 4 July 2023).
- Turner, S.; Sandt, L.; Toole, J.; Benz, R.; Patten, R. Federal Highway Administration University Course on Bicycle and Pedestrian Transportation; Federal Highway Administration: Washington, DC, USA, 2006. [Google Scholar]
- FHWA. Public Roads: Detecting Pedestrians; Federal Highway Administration (FHWA): Washington, DC, USA, 2009. [Google Scholar]

Disclaimer/Publisher’s Note: The statements, opinions and data contained in all publications are solely those of the individual author(s) and contributor(s) and not of MDPI and/or the editor(s). MDPI and/or the editor(s) disclaim responsibility for any injury to people or property resulting from any ideas, methods, instructions or products referred to in the content. |
© 2023 by the authors. Licensee MDPI, Basel, Switzerland. This article is an open access article distributed under the terms and conditions of the Creative Commons Attribution (CC BY) license (https://creativecommons.org/licenses/by/4.0/).