


Connected Automated and Human-Driven Vehicle Mixed Traffic in Urban Freeway Interchanges: Safety Analysis and Design Assumptions


Abstract
1. Introduction
2. Related Research Studies
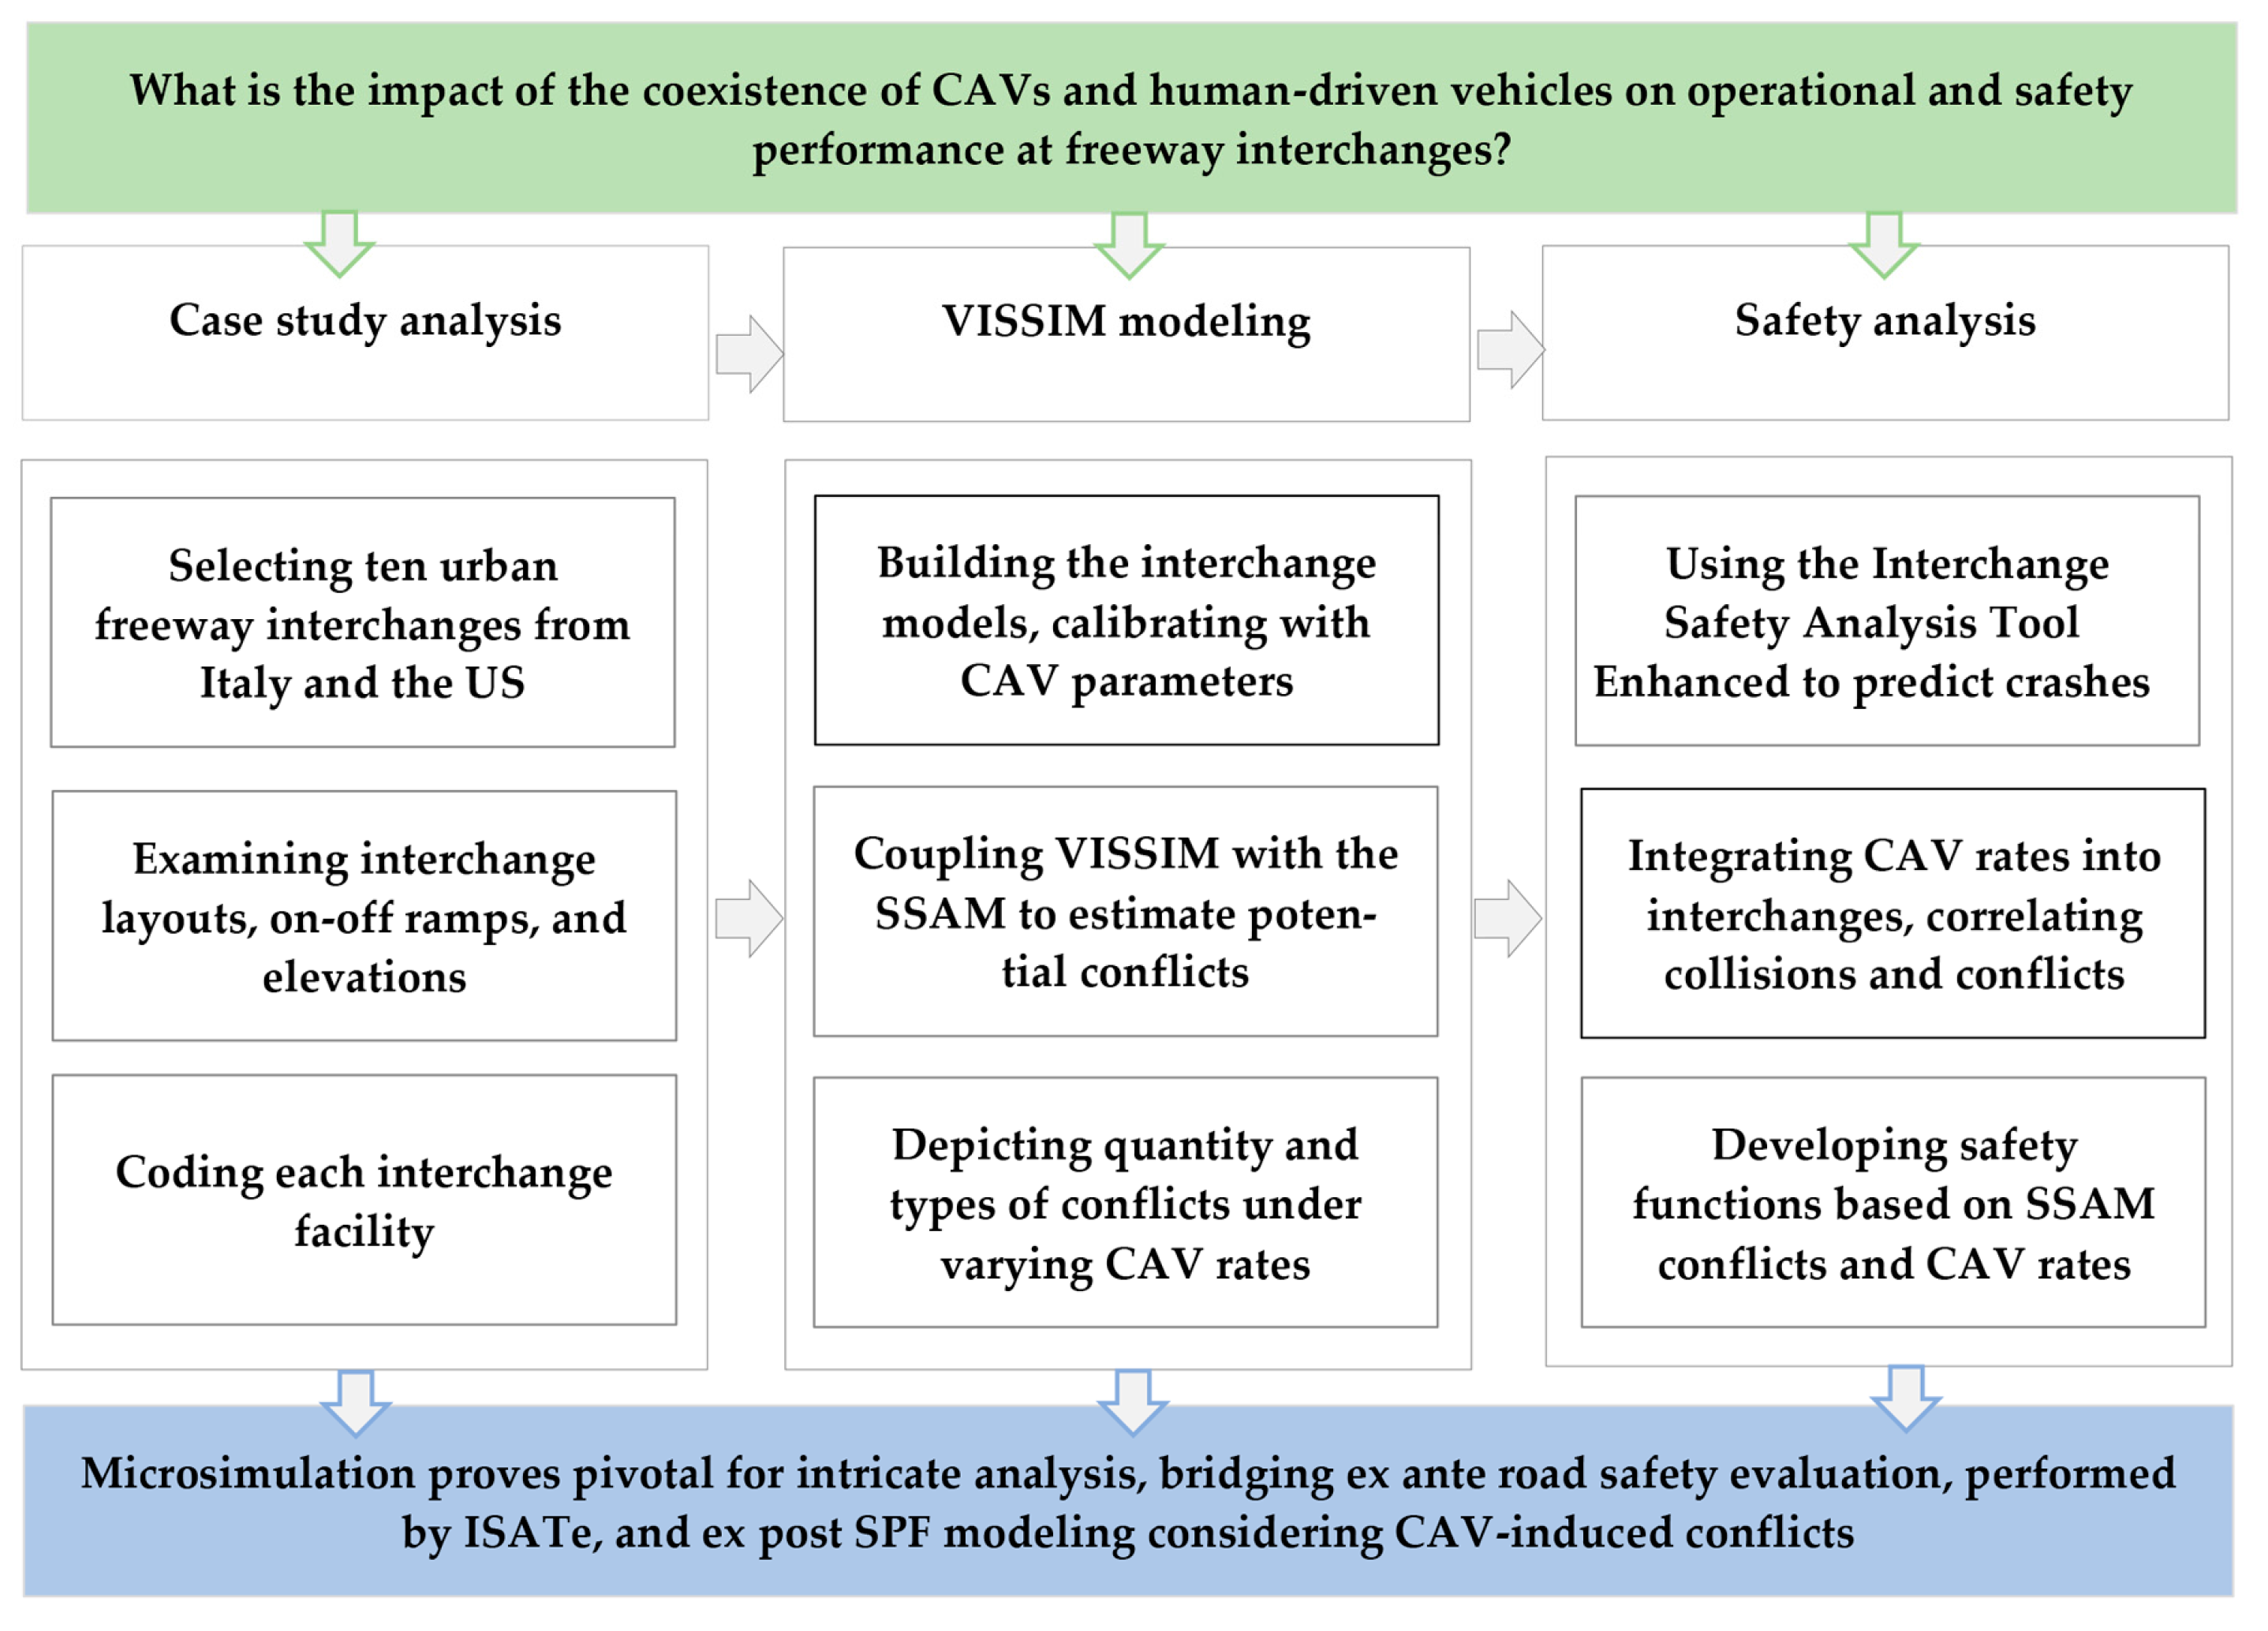
3. Materials and Methods
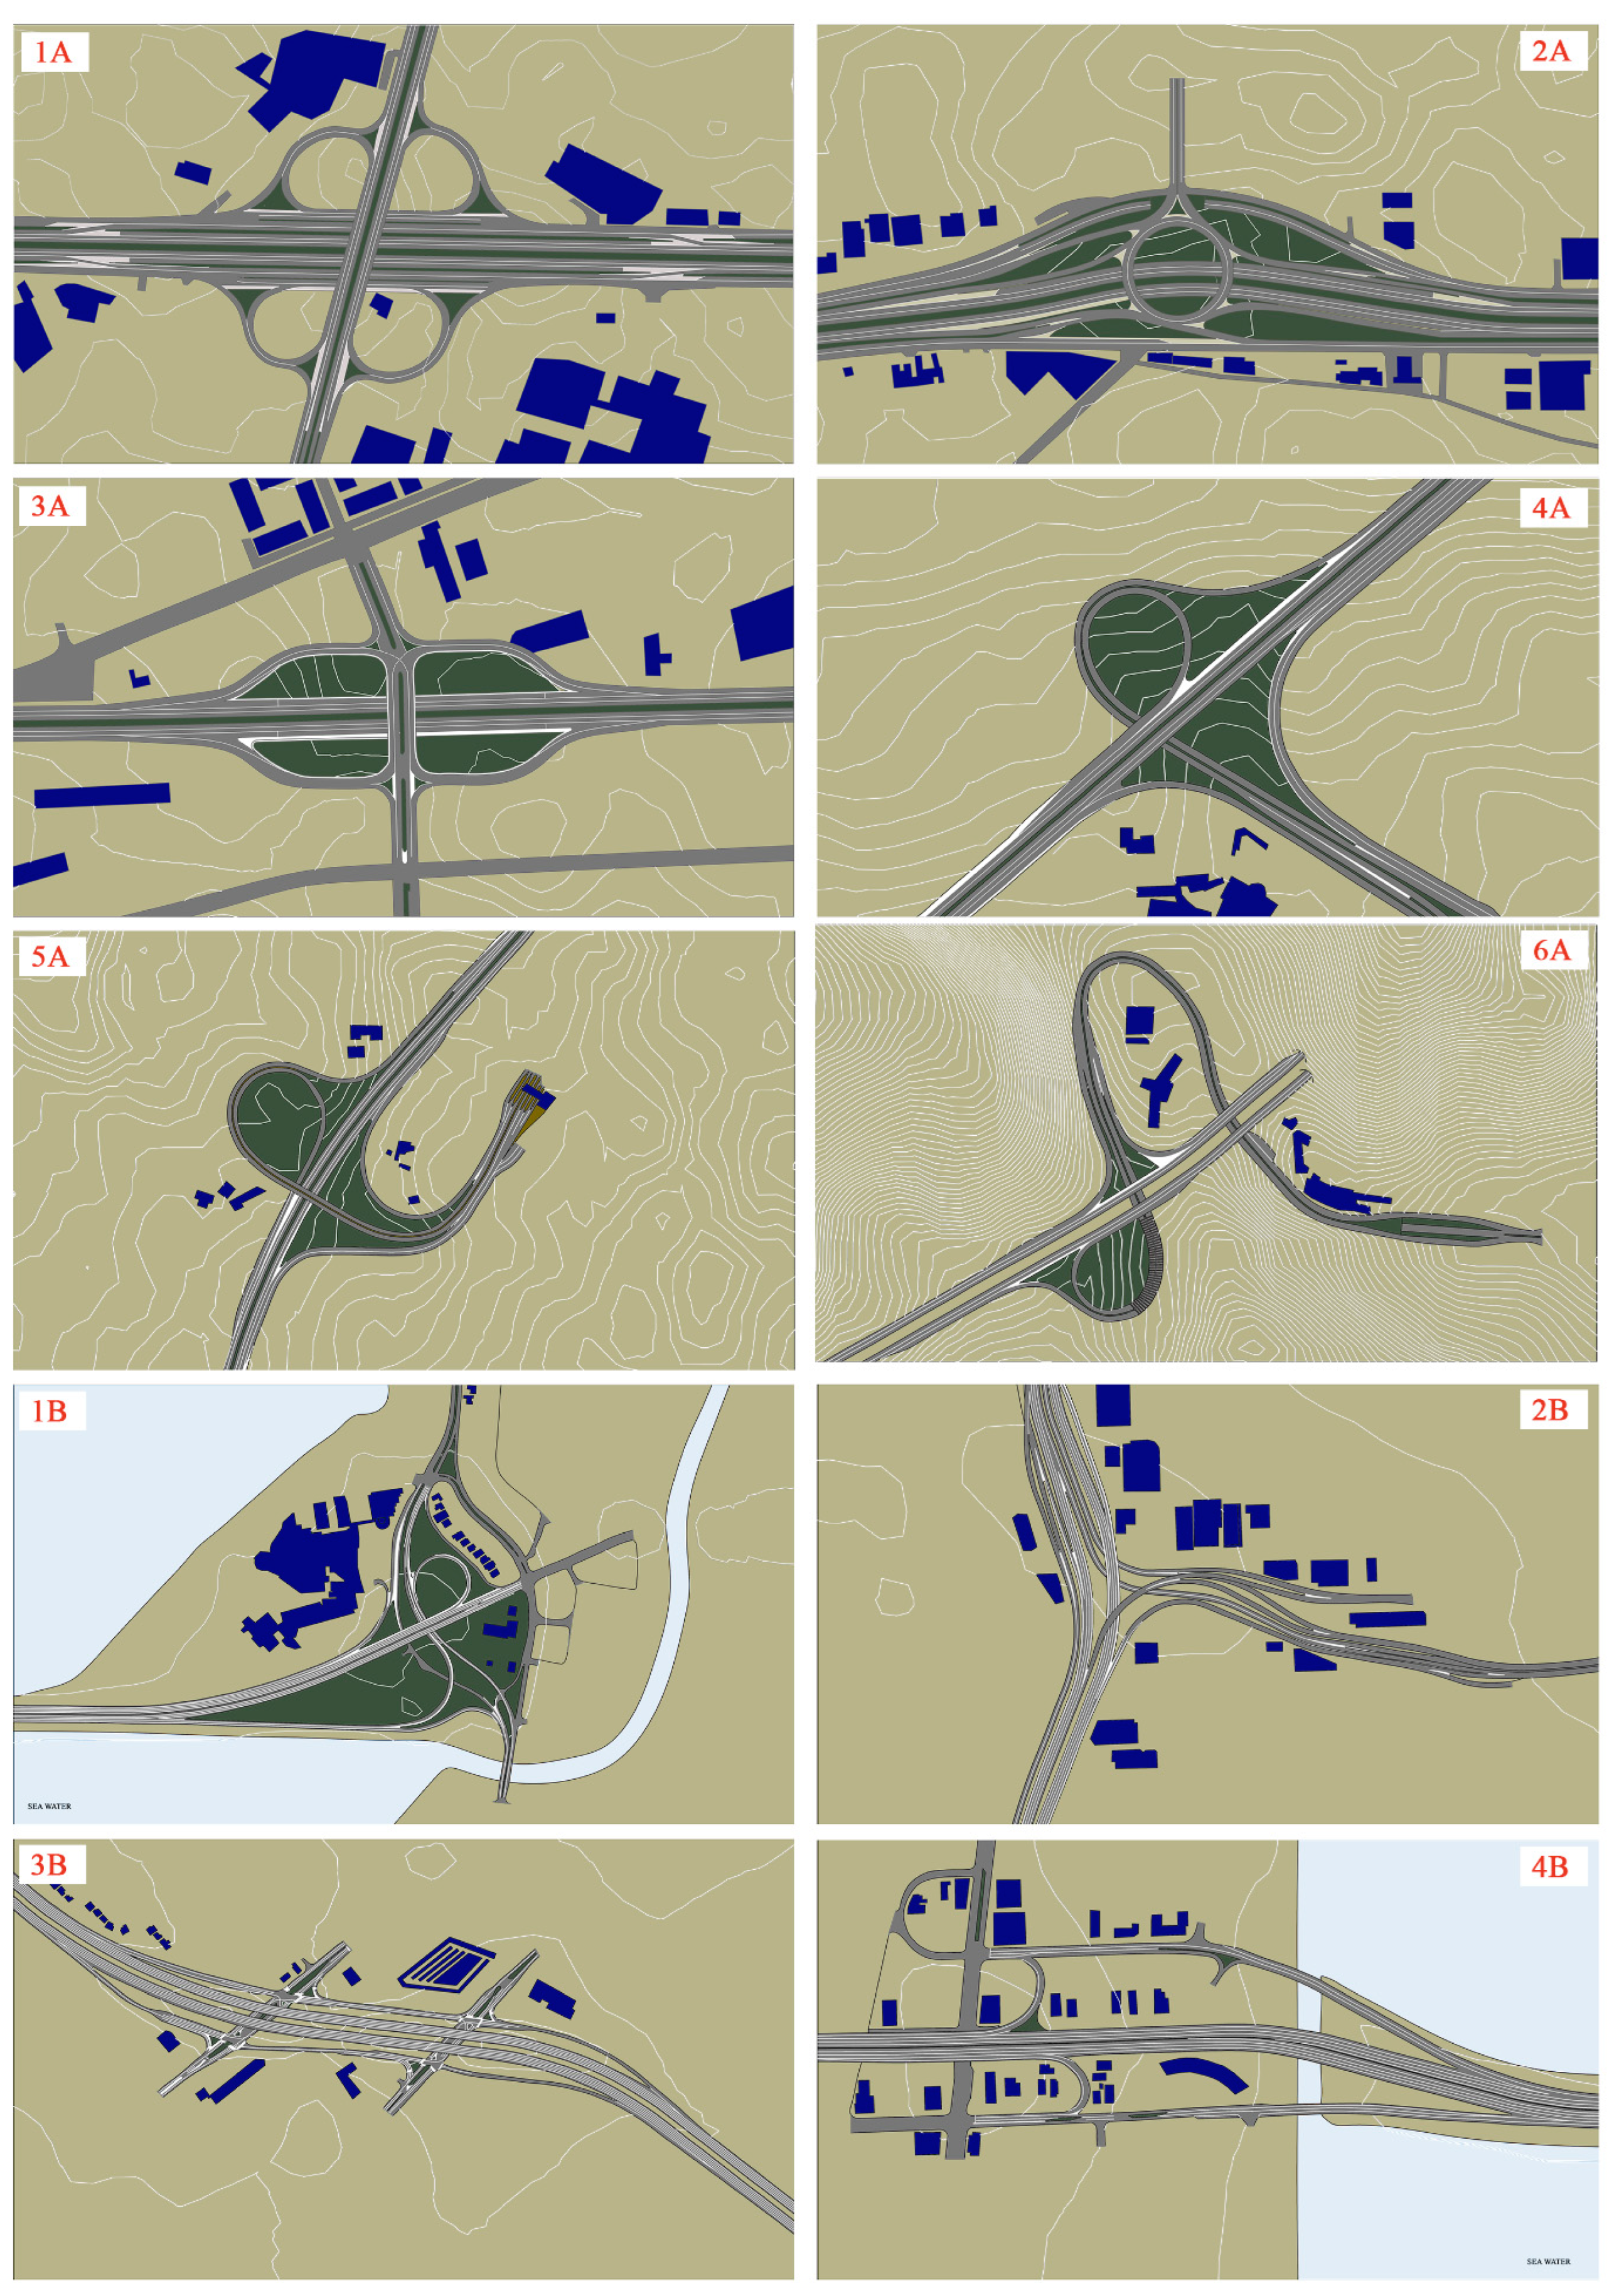
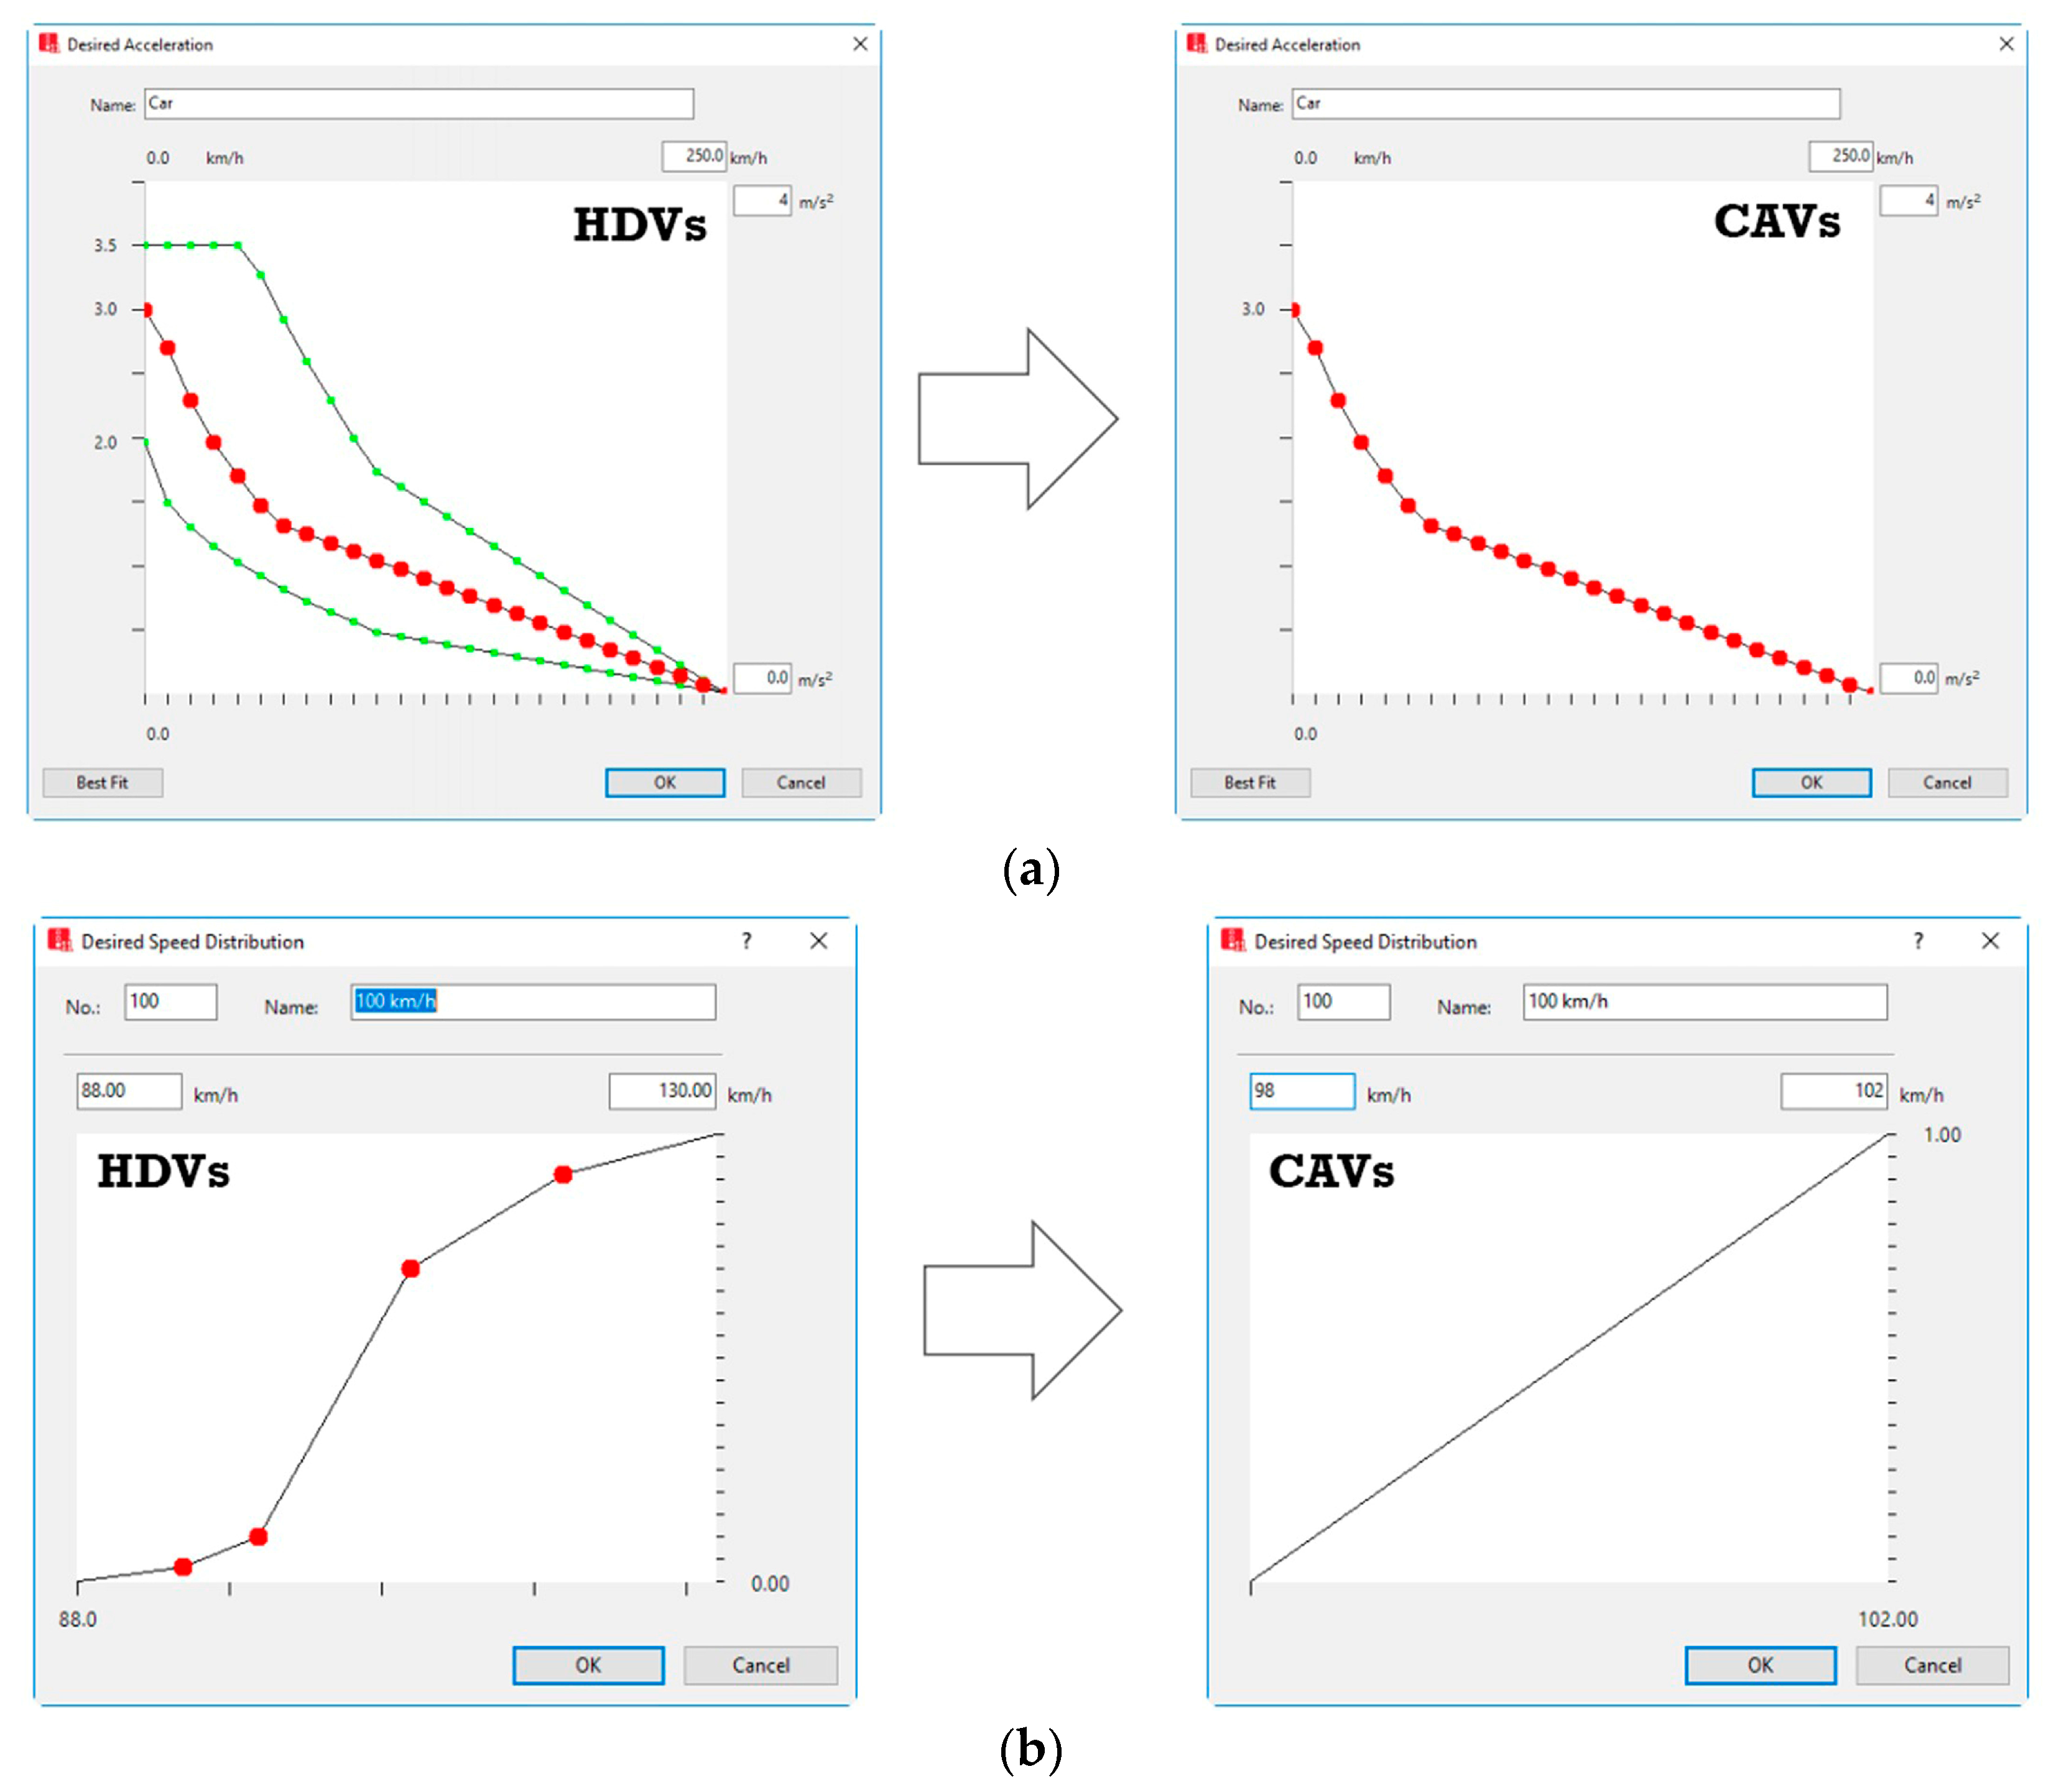
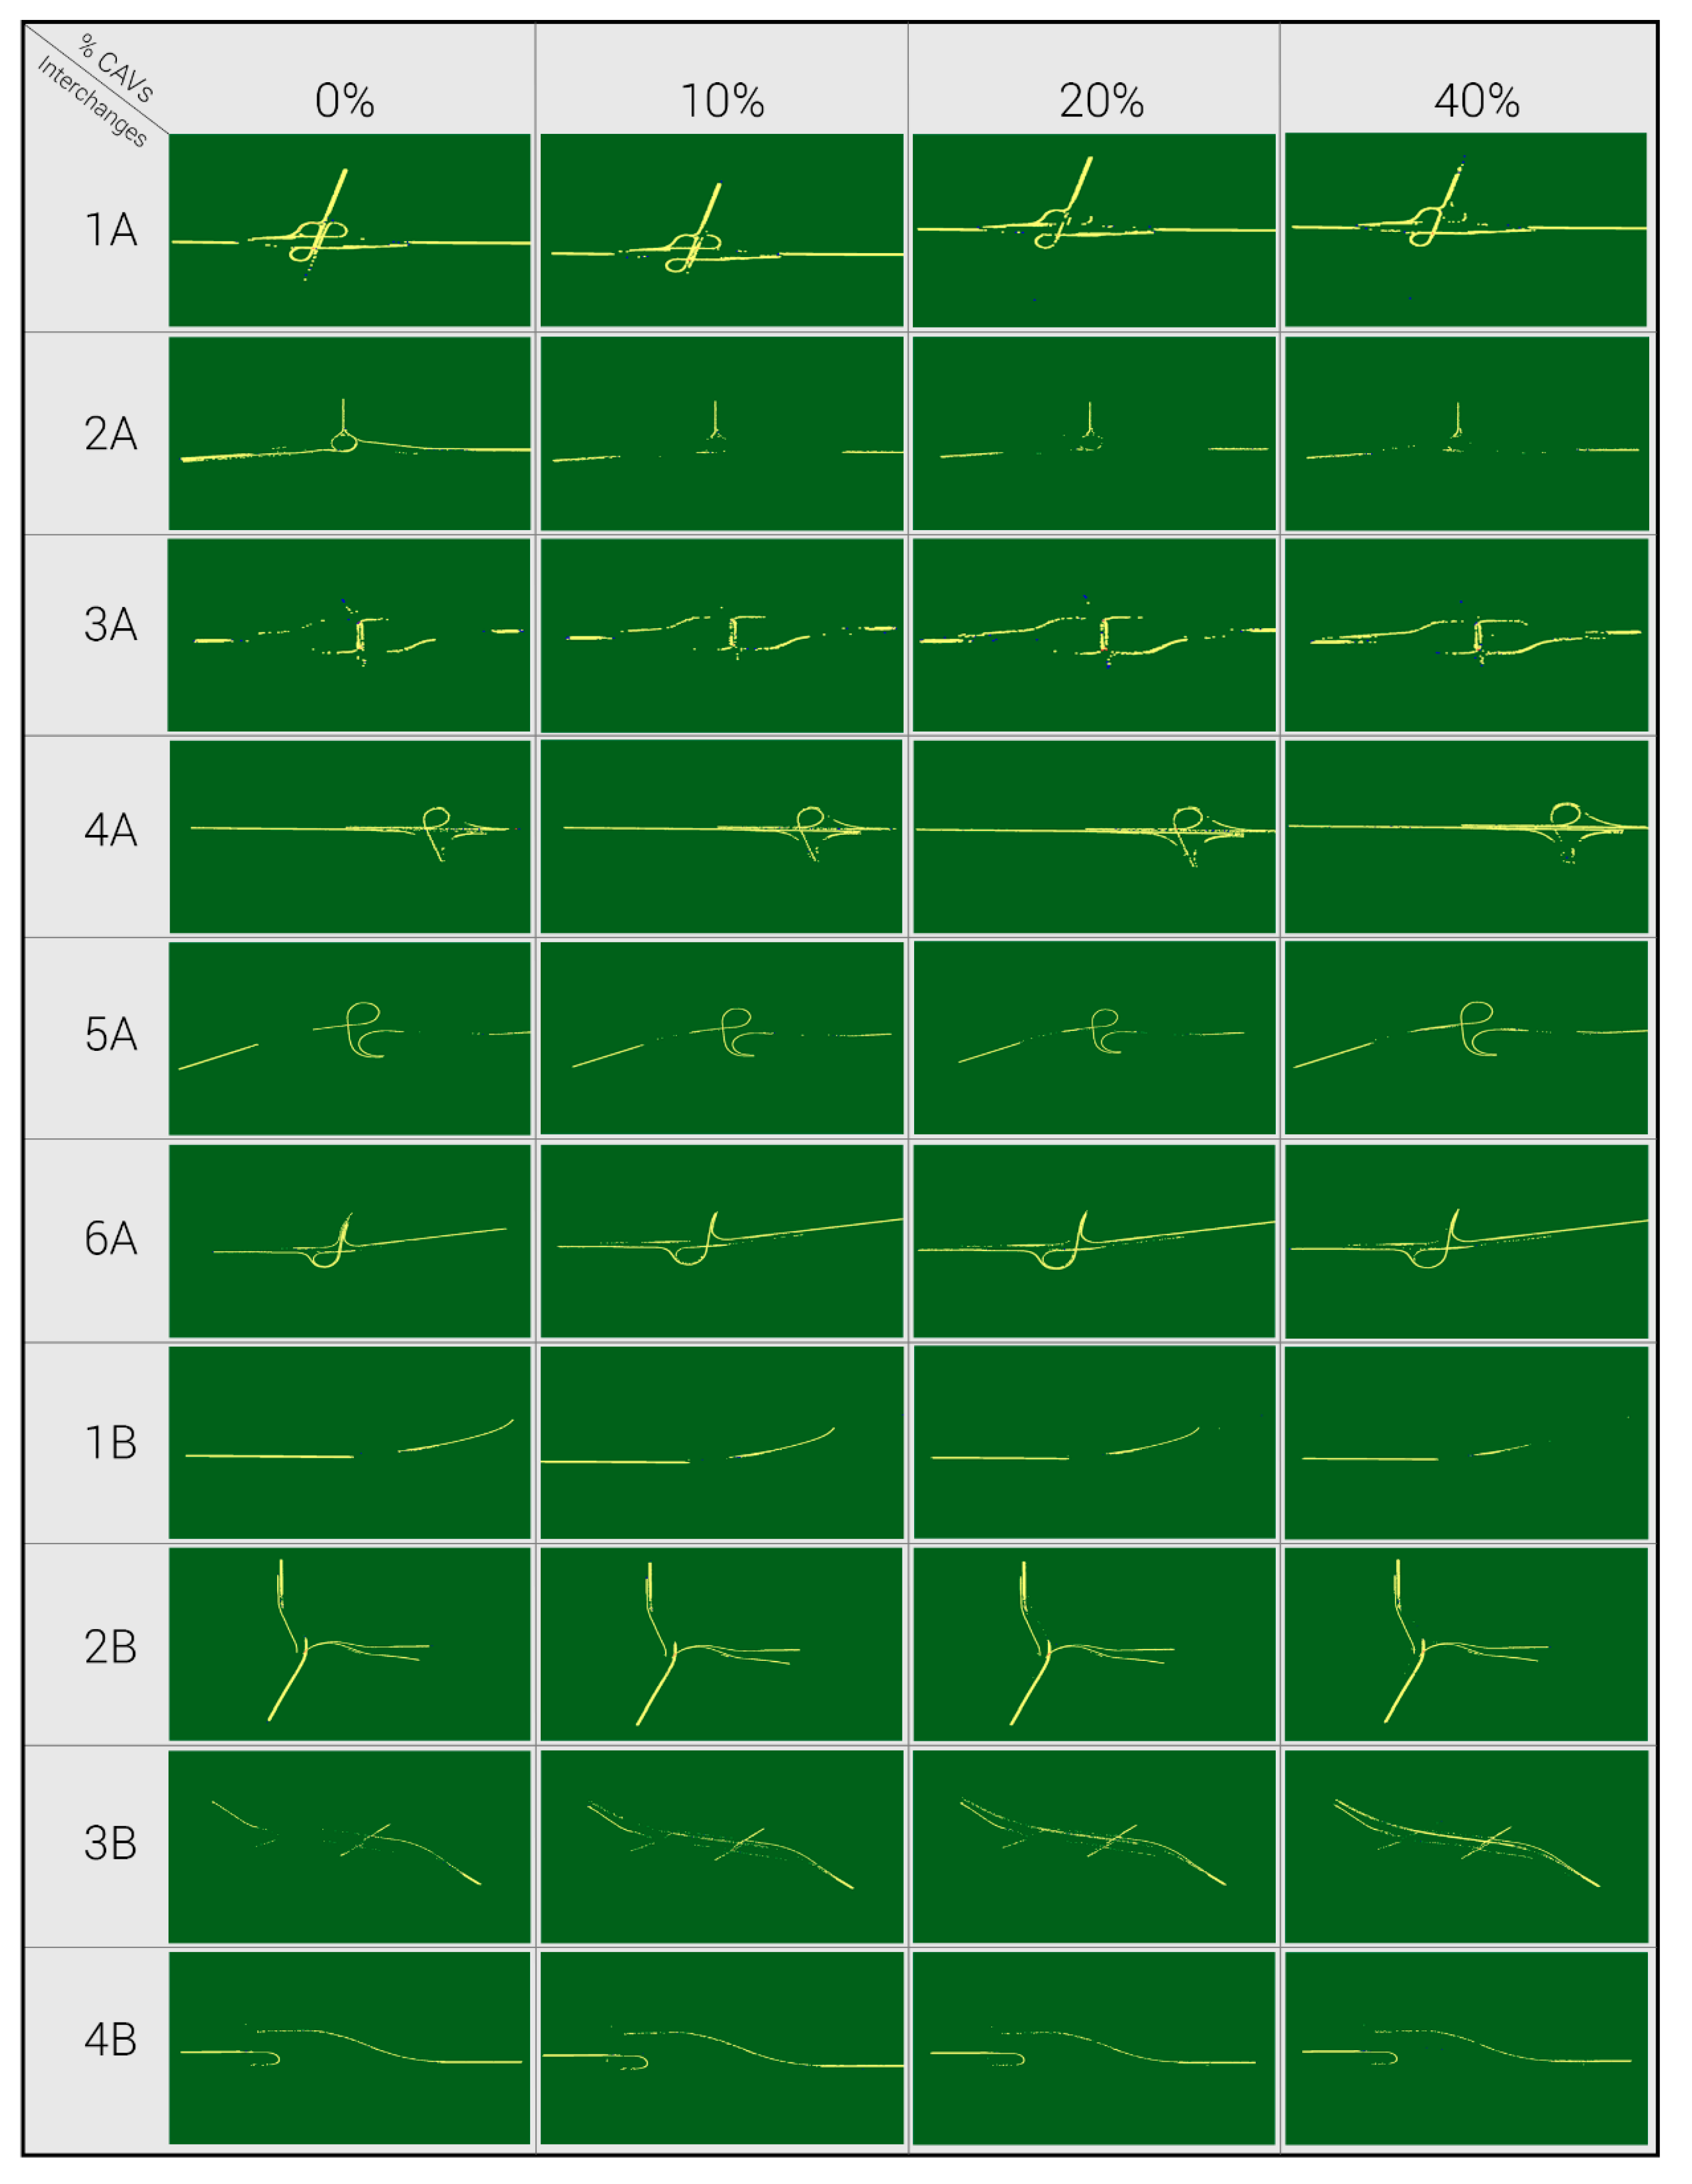
VISSIM Modeling
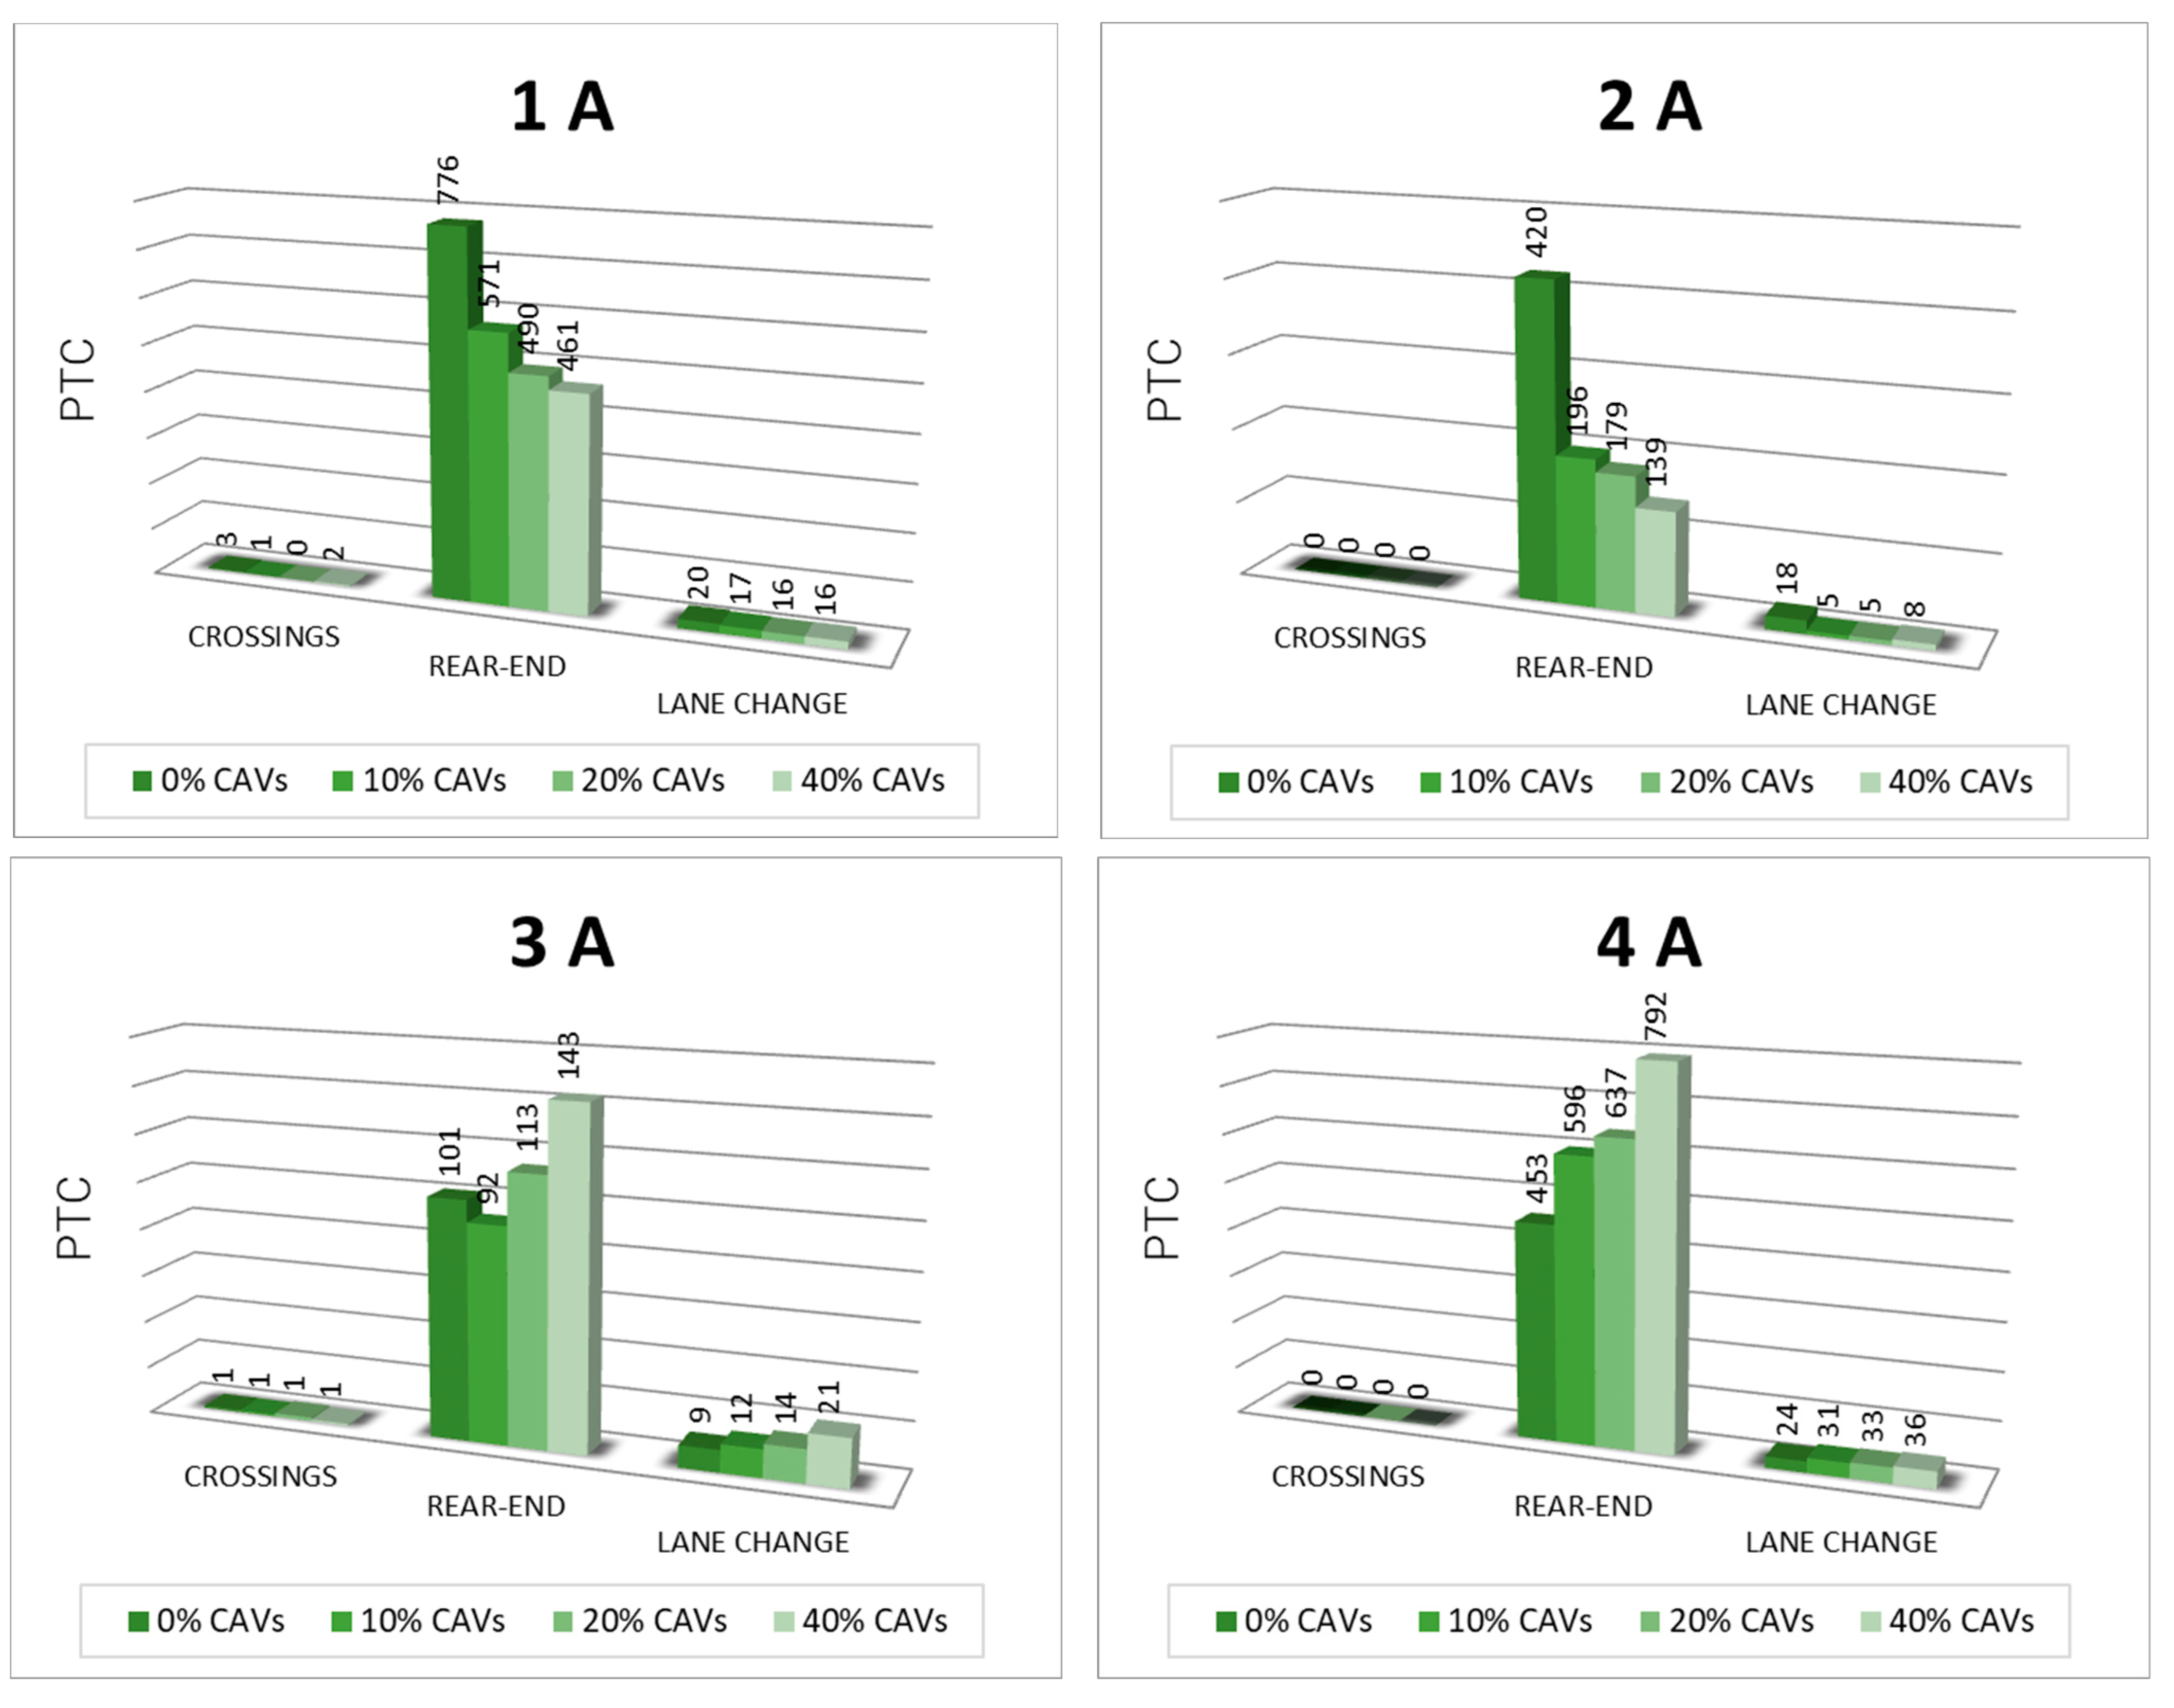
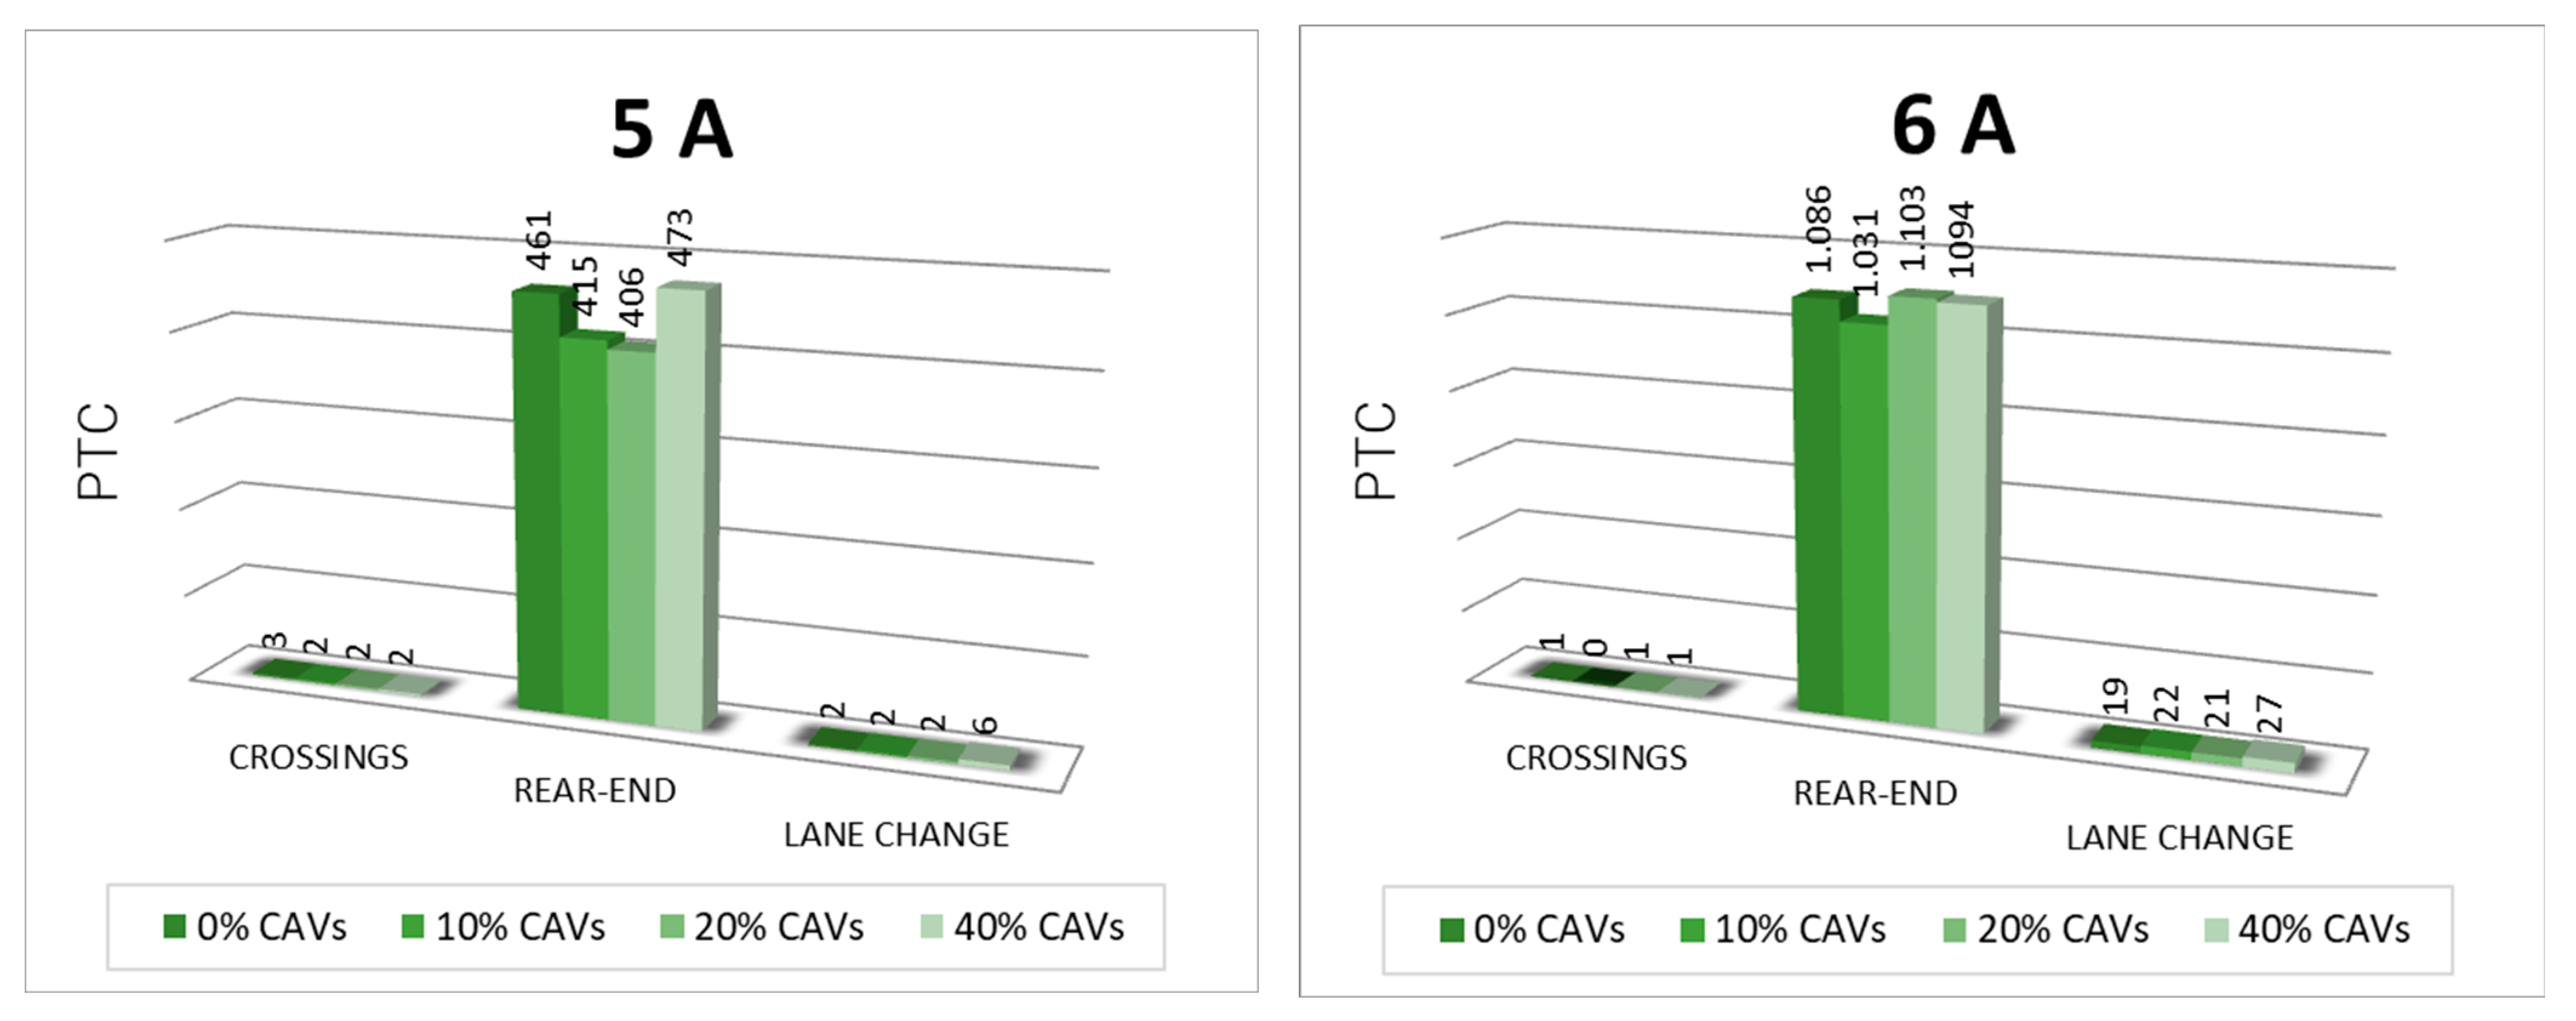
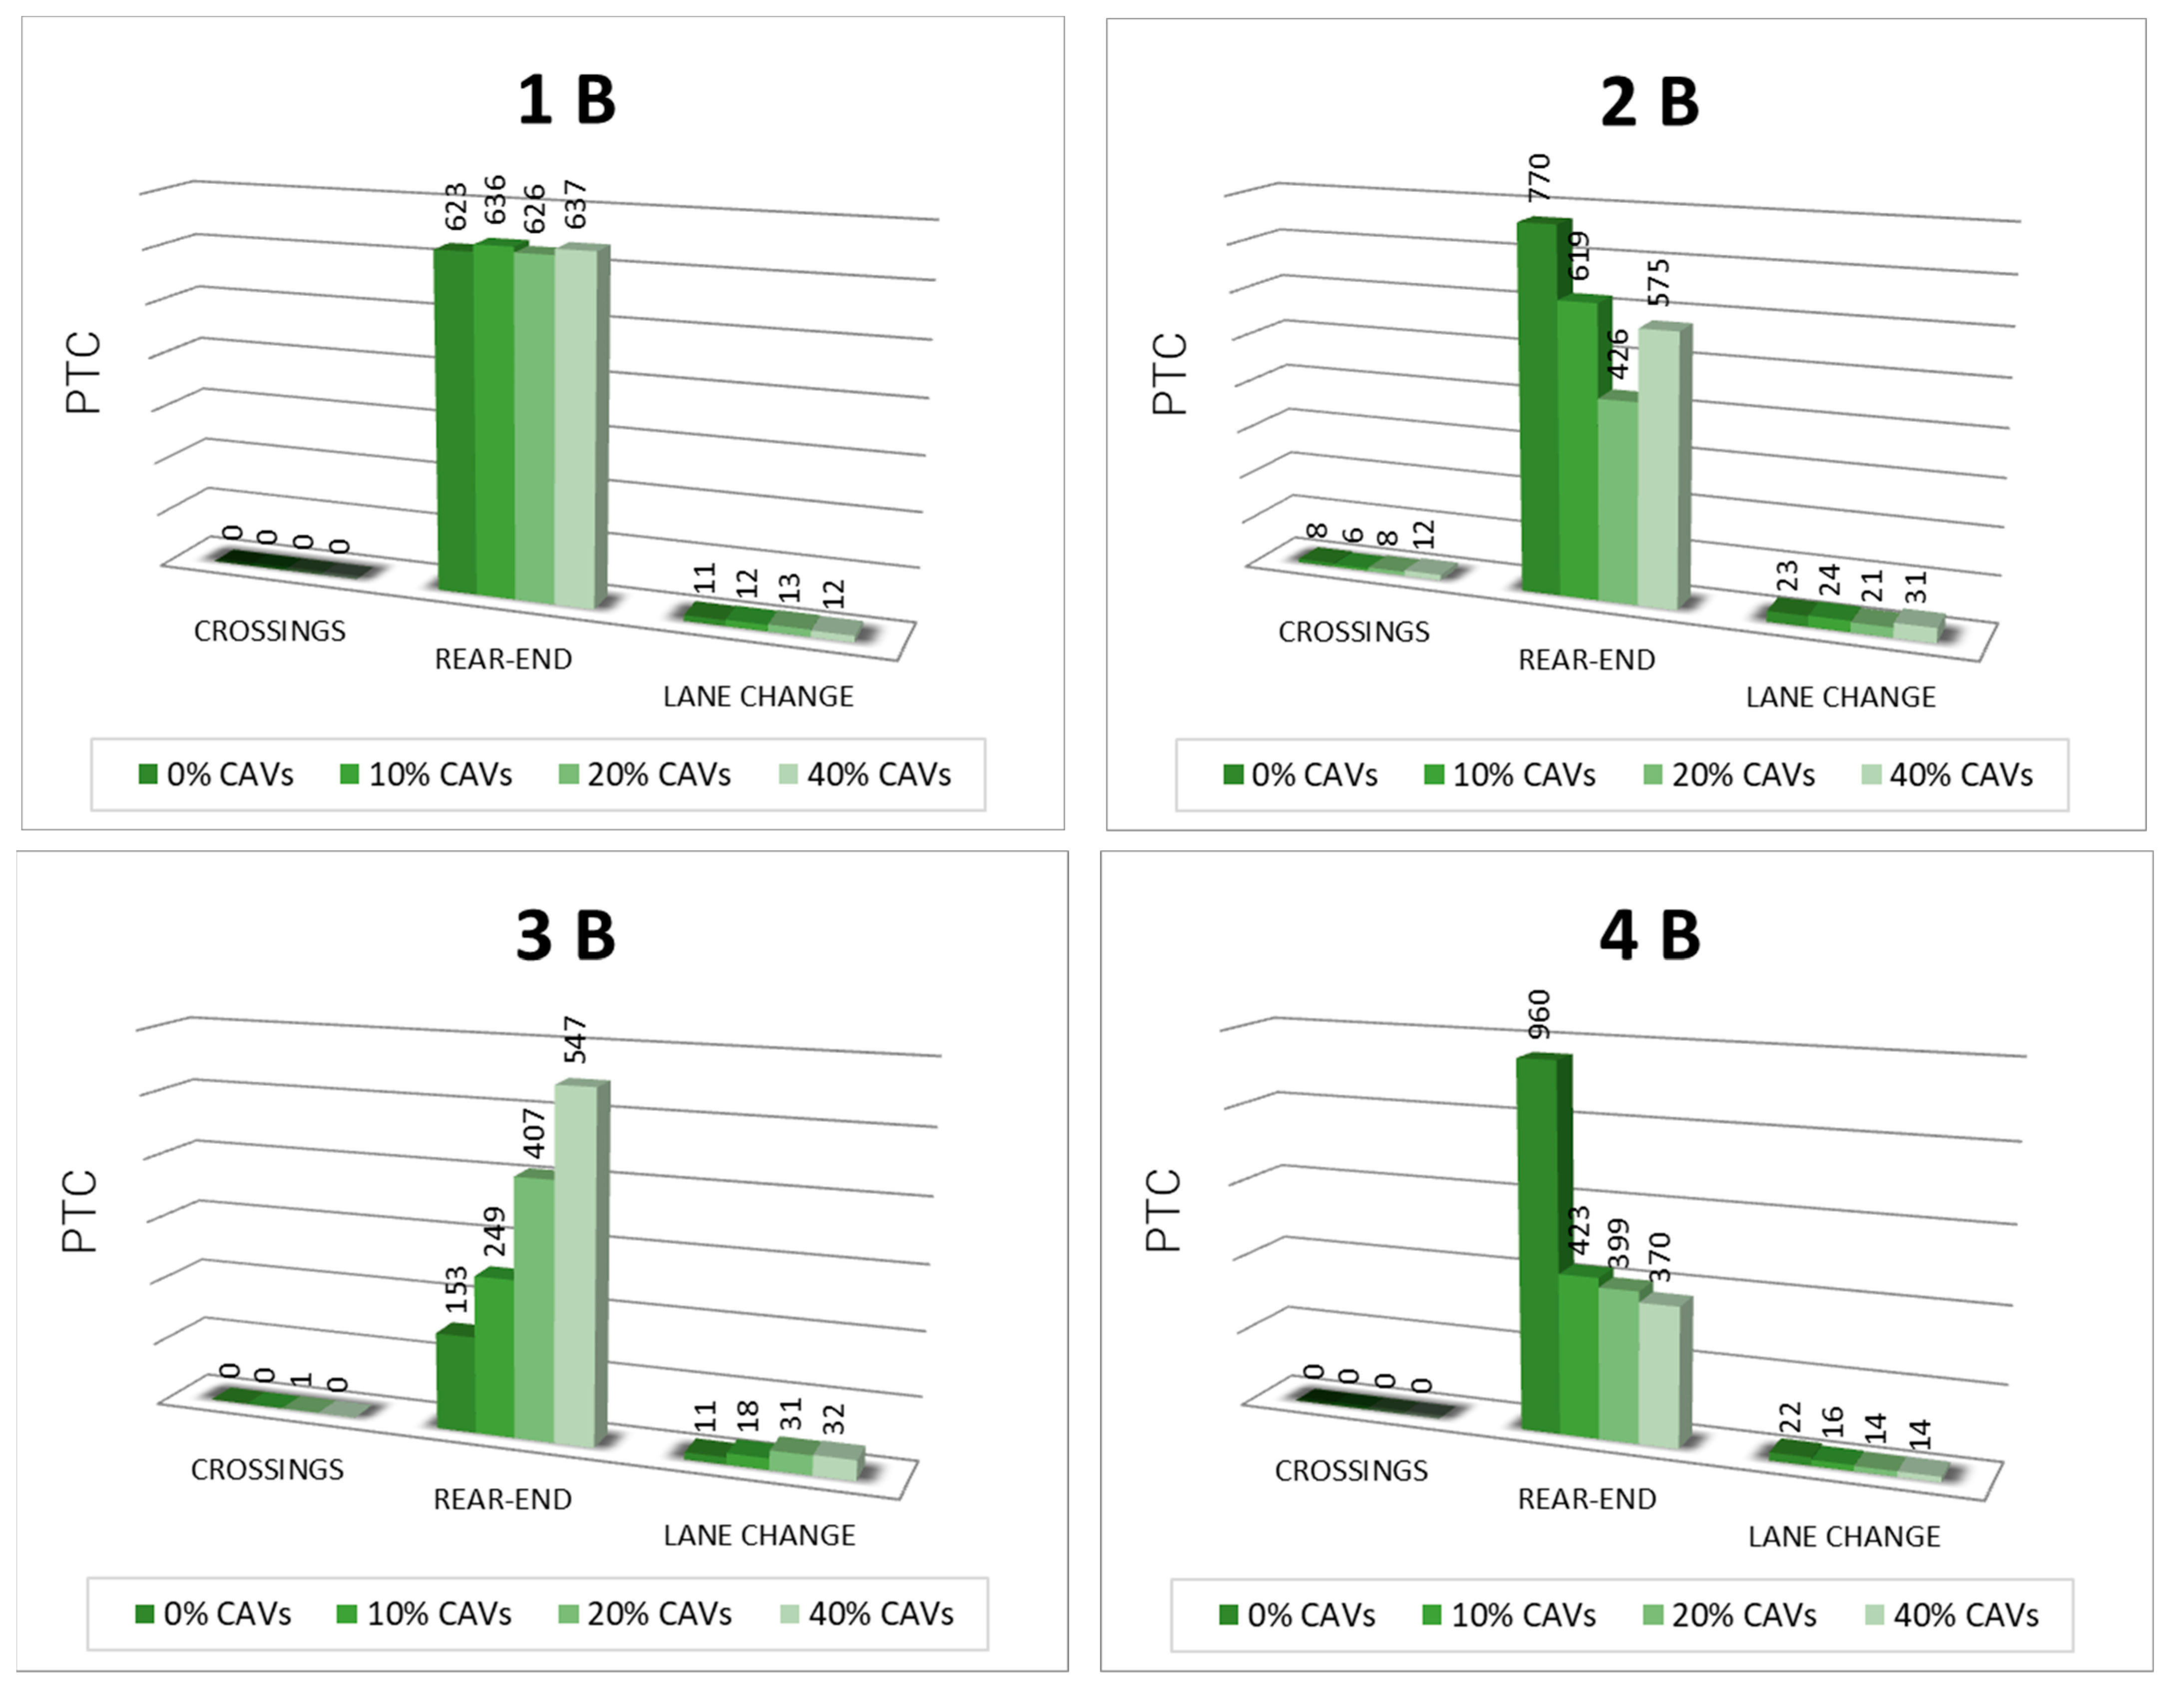
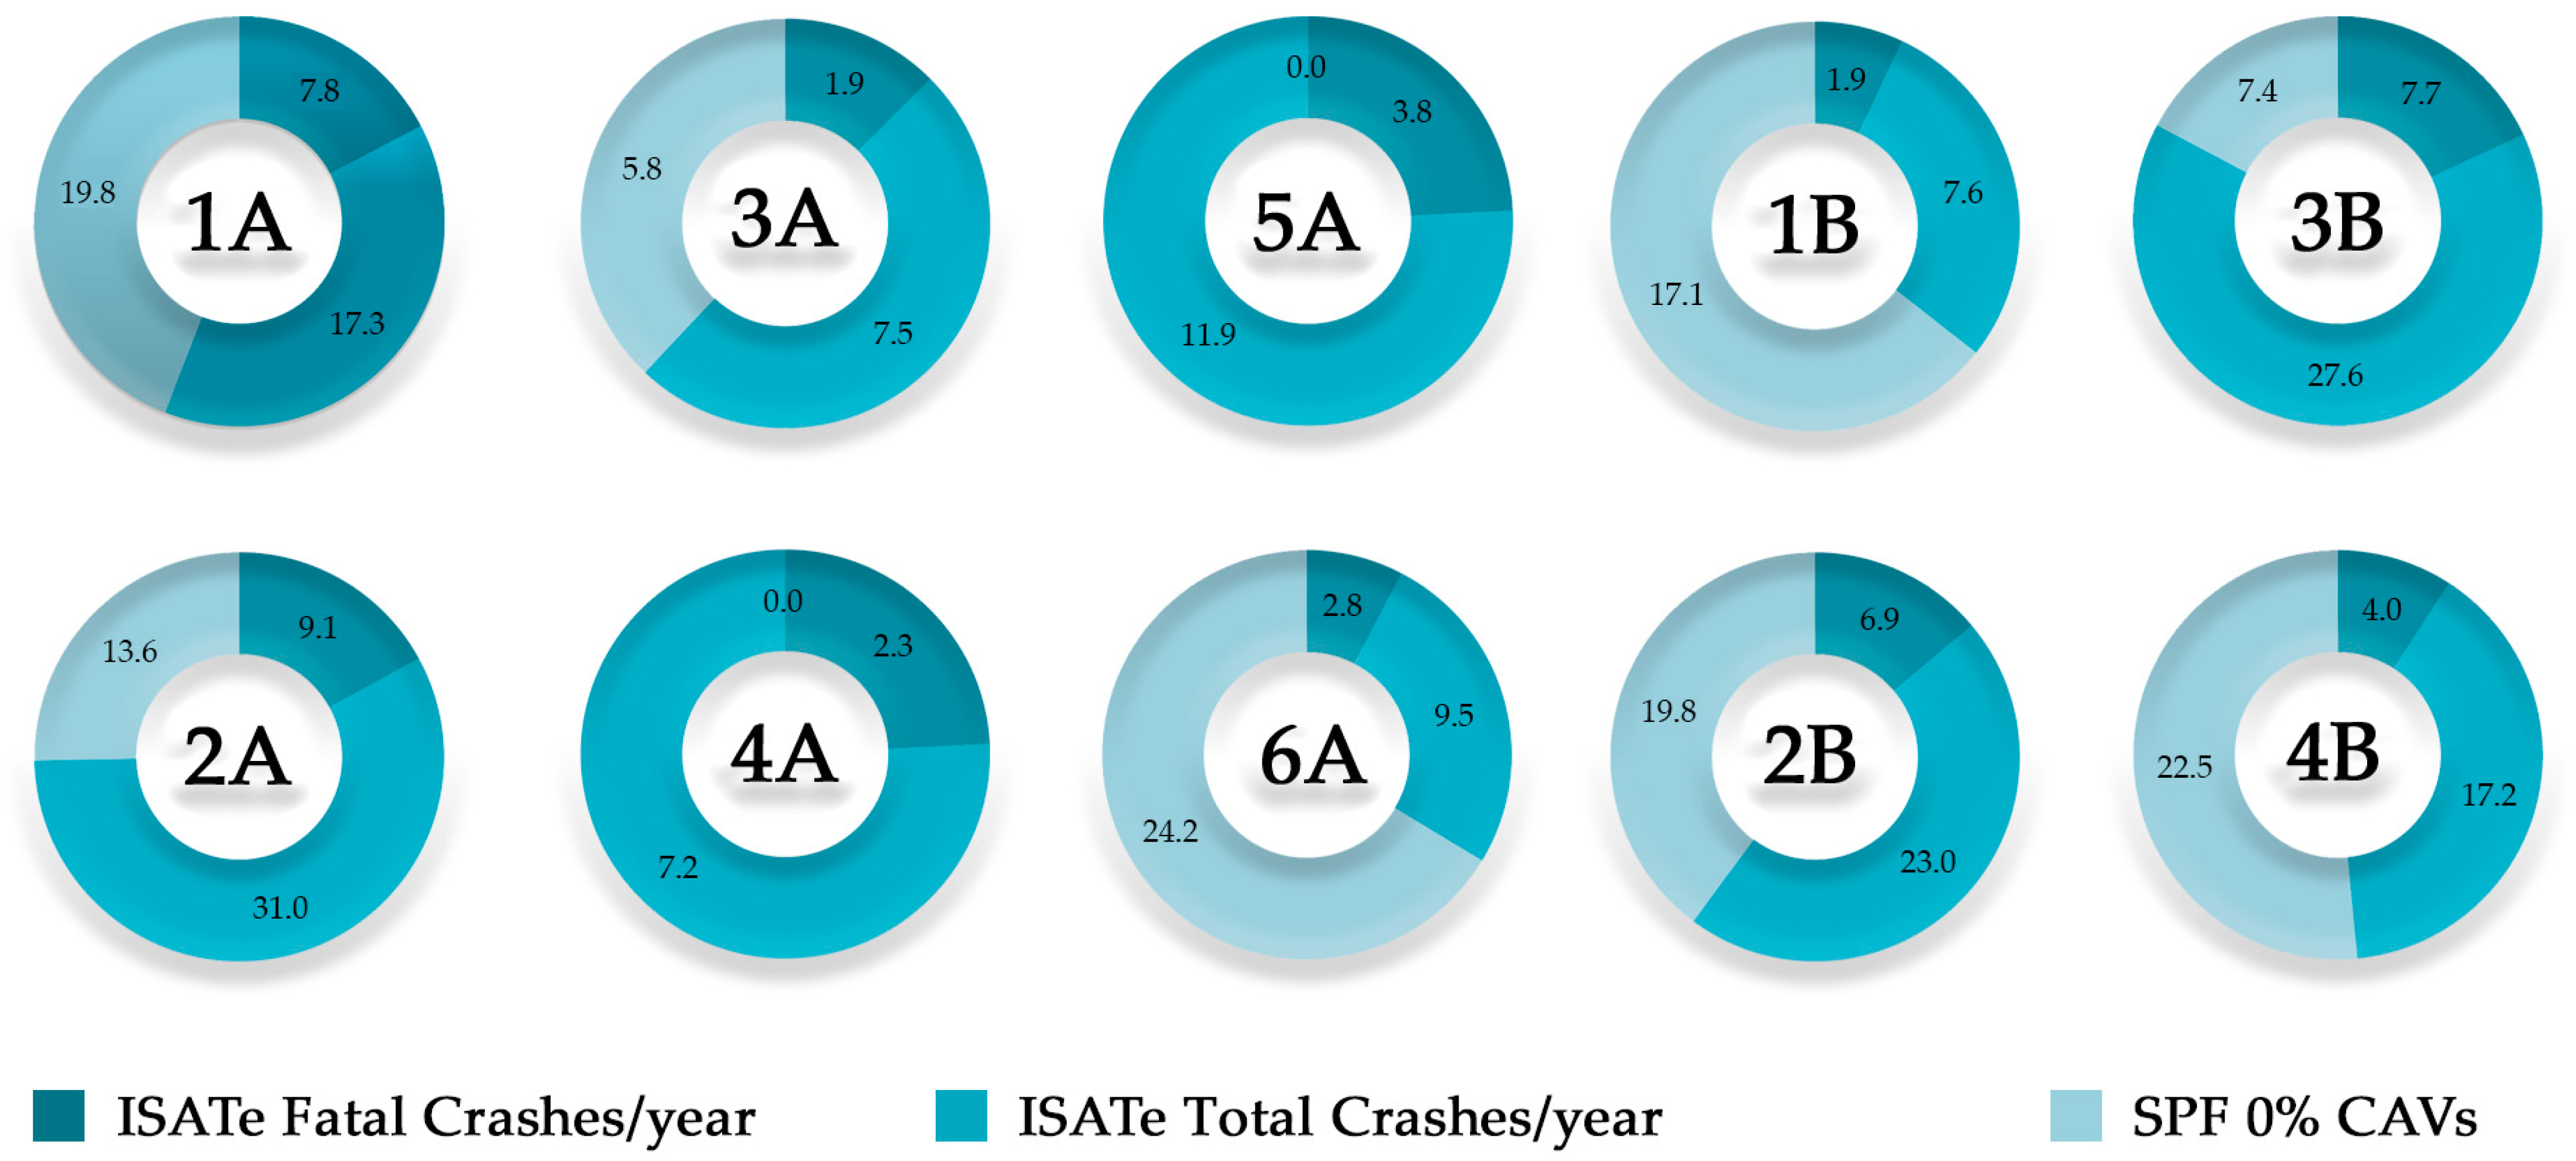
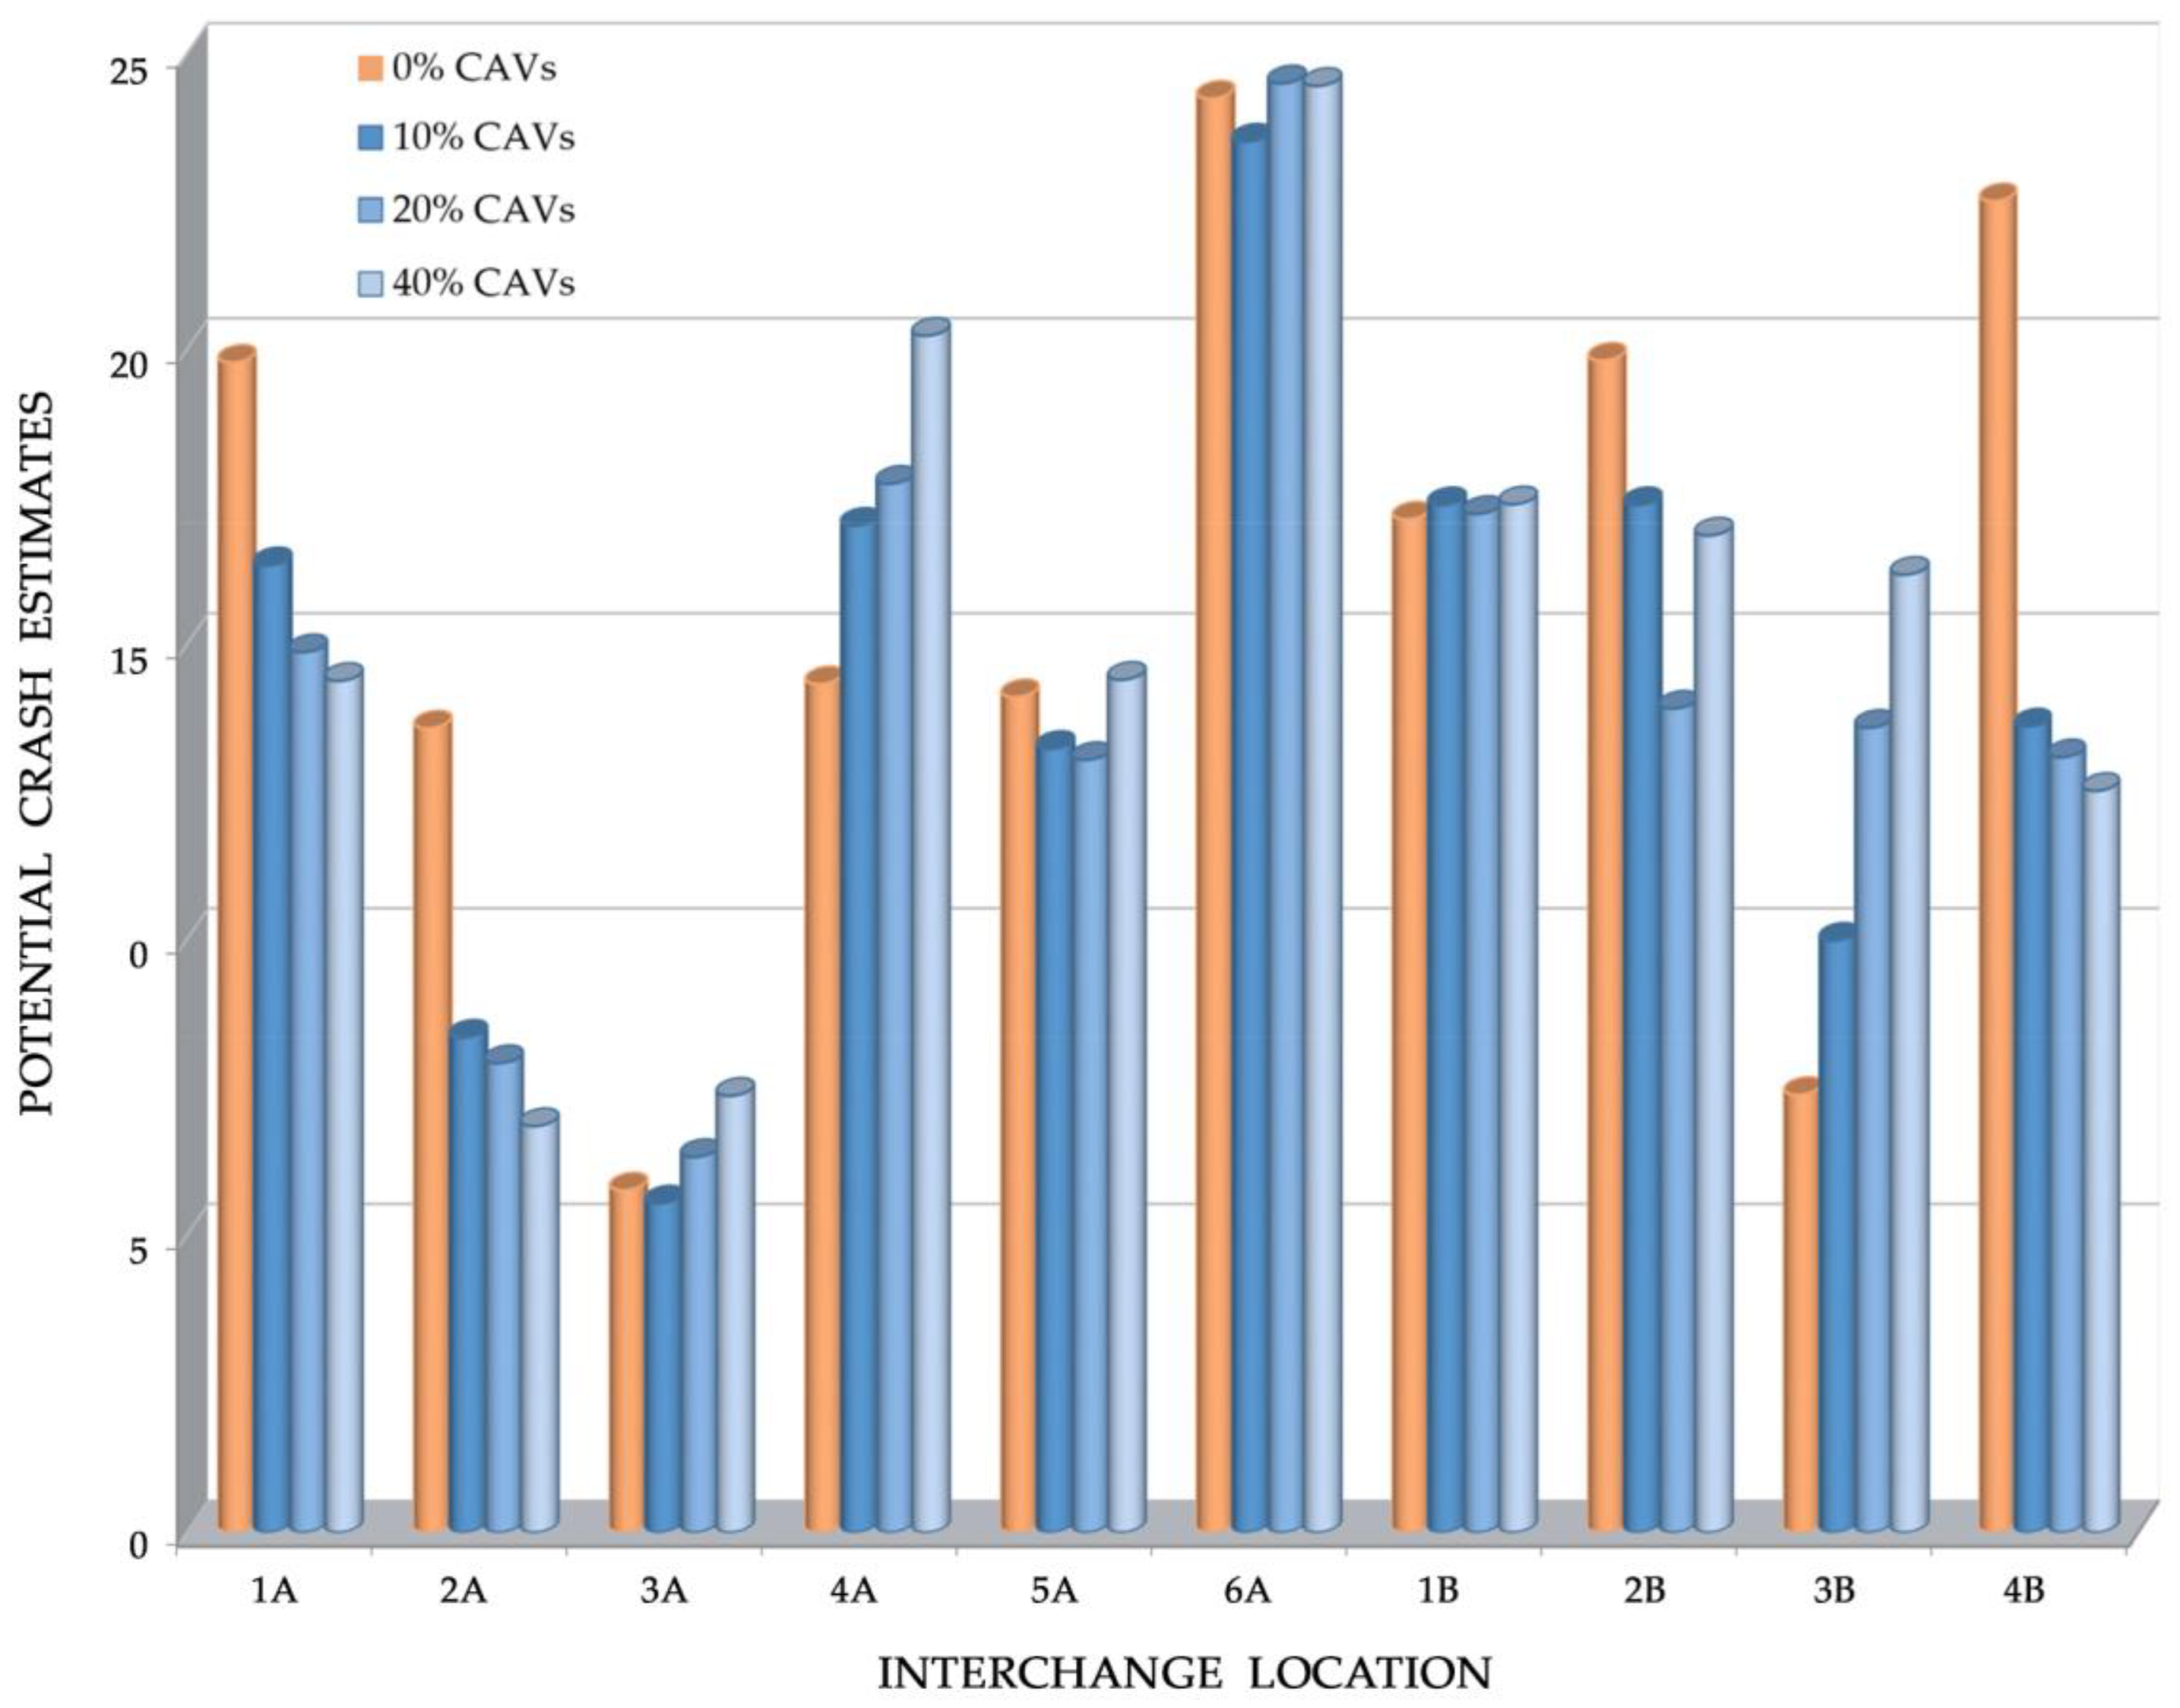
4. Results
5. Discussion
6. Conclusions
Author Contributions
Funding
Data Availability Statement
Acknowledgments
Conflicts of Interest
References
- Serok, N.; Havlin, S.; Blumenfeld Lieberthal, E. Identification, cost evaluation, and prioritization of urban traffic congestions and their origin. Sci. Rep. 2022, 12, 13026. [Google Scholar] [CrossRef] [PubMed]
- Shankar Iyer, L. AI enabled applications towards intelligent transportation. Transp. Eng. 2021, 5, 100083. [Google Scholar] [CrossRef]
- Rana, M.M.; Hossain, K. Connected and Autonomous Vehicles and Infrastructures: A Literature Review. Int. J. Pavement Res. Technol. 2023, 16, 264–284. [Google Scholar] [CrossRef]
- Othman, K. Exploring the implications of autonomous vehicles: A comprehensive review. Innov. Infrastruct. Solut. 2022, 7, 165. [Google Scholar] [CrossRef]
- Like Jiang, L.; Chen, H.; Paschalidis, E. Diffusion of connected and autonomous vehicles concerning mode choice, policy interventions and sustainability impacts: A system dynamics modelling study. Transp. Policy 2023, 141, 274–290. [Google Scholar] [CrossRef]
- Brost, M.; Deniz, Ö.; Österle, I.; Ulrich, C.; Senzeybek, M.; Hahn, R.; Schmid, S. Energy Consumption of Connected and Automated Vehicles. In Book Electric, Hybrid, and Fuel Cell Vehicles, Encyclopedia of Sustainability Science and Technology, 2nd ed.; Elgowainy, A., Ed.; Springer: New York, NY, USA, 2021; pp. 216–224. [Google Scholar]
- Hamad, K.; Alozi, A.R. Shared vs. dedicated lanes for automated vehicle deployment: A simulation-based assessment. Int. J. Transp. Sci. Technol. 2022, 11, 205–215. [Google Scholar] [CrossRef]
- Gora, P.; Katrakazas, C.; Drabicki, A.; Islam, F.; Ostaszewski, P. Microscopic traffic simulation models for connected and automated vehicles (CAVs)–state-of-the-art. Procedia Comput. Sci. 2020, 170, 474–481. [Google Scholar] [CrossRef]
- Tumminello, M.L.; Macioszek, E.; Granà, A.; Giuffrè, T. Simulation-Based Analysis of “What-If” Scenarios with Connected and Automated Vehicles Navigating Roundabouts. Sensors 2022, 22, 6670. [Google Scholar] [CrossRef]
- Chen, Y.; Kong, D.; Sun, L.; Zhang, T.; Song, Y. Fundamental diagram and stability analysis for heterogeneous traffic flow considering human-driven vehicle driver’s acceptance of cooperative adaptive cruise control vehicles. Phys. A Stat. Mech. Appl. 2022, 589, 126647. [Google Scholar] [CrossRef]
- Dong, J.; Luo, D.; Gao, Z.; Wang, J.; Chen, L. Benefit of connectivity on promoting stability and capacity of traffic flow in automation era: An analytical and numerical investigation. Phys. A Stat. Mech. Appl. 2023, 629, 129170. [Google Scholar] [CrossRef]
- Hung, Y.-C.; Zhang, K. Impact of Cooperative Adaptive Cruise Control on Traffic Stability. Transp. Res. Rec. 2022, 2676, 226–241. [Google Scholar] [CrossRef]
- Liu, H.; Kan, X.; Shladover, S.E.; Lu, X.-Y.; Ferlis, R.E. Modeling impacts of Cooperative Adaptive Cruise Control on mixed traffic flow in multi-lane freeway facilities. Transp. Res. Part C Emerg. Technol. 2018, 95, 261–279. [Google Scholar] [CrossRef]
- Messer, C.J.; Bonneson, J.A.; Anderson, S.D.; McFarland, W.F. Single Point Urban Interchange Design and Operations Analysis; National Cooperative Highway Research Program (NCHRP) Report 345; Transportation Research Board (TRB): Washington, DC, USA.
- Hancock, M.W.; Wright, B. A Policy on Geometric Design of Highways and Streets, 6th ed.; Green Book, Publication Code: GDHS-6; American Association of State Highway and Transportation Officials: Washington, DC, USA, 2013; p. 20001. ISBN 978-1-56051-508-1. [Google Scholar]
- Functional and Geometric Standards for the Construction of Road Intersections. Ministry of Infrastructure and Transport, 19 April 2006. Available online: https://www.mit.gov.it/normativa/decreto-ministeriale-19042006 (accessed on 25 February 2024).
- PTV Planung Transport Verkehr AG. PTV Verkehr. In Städten–SIMulationsmodell (VISSIM), Version 10; User Manual Karlsruhe: Karlsruhe, Germany, 2018. [Google Scholar]
- Gettman, D.; Pu, L.; Sayed, T.; Shelby, S.G. Surrogate Safety Assessment Model and Validation: Final Report; Georgetown Pike (US) Report FHWA HRT 08–051; Federal Highway Administration: Washington, DC, USA, 2008. [Google Scholar]
- Li, Q.; Chen, Z.; Li, X. A Review of Connected and Automated Vehicle Platoon Merging and Splitting Operations. IEEE Trans. Intell. Transp. Syst. 2022, 23, 22790–22806. [Google Scholar] [CrossRef]
- Yang, Y.; Yuan, Z.; Meng, R. Exploring traffic crash occurrence mechanism towards cross-area freeways via an improved data mining approach. J. Transp. Eng. Part A Syst. 2022, 148, 04022052. [Google Scholar] [CrossRef]
- Wu, Y.; Wang, D.Z.W.; Zhu, F. Influence of CAVs platooning on intersection capacity under mixed traffic. Phys. A Stat. Mech. Appl. 2022, 593, 126989. [Google Scholar] [CrossRef]
- Lee, D.; Hess, D.J. Public concerns and connected and automated vehicles: Safety, privacy, and data security. Humanit. Soc. Sci. Commun. 2022, 9, 90. [Google Scholar] [CrossRef]
- Hearne, R.; Siddiqui, A. Issues of dedicated lanes for an automated highway. In Proceedings of the Conference on Intelligent Transportation Systems, Boston, MA, USA, 12 November 1997; pp. 619–624. [Google Scholar] [CrossRef]
- Liu, Z.; Song, Z. Strategic planning of dedicated autonomous vehicle lanes and autonomous vehicle/toll lanes in transportation networks. Transp. Res. Part C Emerg. Technol. 2019, 106, 381–403. [Google Scholar] [CrossRef]
- Kulmala, R.; Rämä, P. Definition of behavioural adaptation. In Behavioural Adaptation and Road Safety: Theory, Evidence and Action, 1st ed.; Rudin-Brown, C., Jamson, S.L., Eds.; CRC Press (Taylor & Francis): Boca Raton, FL, USA, 2013; pp. 11–21. [Google Scholar]
- Piccinini, G.F.B.; Rodrigues, C.M.; Leitão, M.; Simões, A. Driver’s behavioral adaptation to Adaptive Cruise Control (ACC): The case of speed and time headway. J. Saf. Res. 2014, 49, 77–84. [Google Scholar] [CrossRef]
- Miller, E.E.; Boyle, L. Adaptations in attention allocation: Implications for takeover in an automated vehicle. Transp. Res. Part F Traffic Psychol. Behav. 2019, 66, 101–110. [Google Scholar] [CrossRef]
- Chen, X.; Wu, Z.; Liang, Y. Modeling Mixed Traffic Flow with Connected Autonomous Vehicles and Human-Driven Vehicles in Off-Ramp Diverging Areas. Sustainability 2023, 15, 5651. [Google Scholar] [CrossRef]
- Nowakowski, C.; O’Connell, J.; Shladover, S.E.; Cody, D. Cooperative Adaptive Cruise Control: Driver Acceptance of Following Gap Settings Less than One Second. Proc. Hum. Factors Ergon. Soc. Annu. Meet. 2010, 54, 2033–2037. [Google Scholar] [CrossRef]
- Tanveer, M.; Kashmiri, F.A.; Naeem, H.; Yan, H.; Qi, X.; Rizvi, S.M.A.; Wang, T.; Lu, H. An Assessment of Age and Gender Characteristics of Mixed Traffic with Autonomous and Manual Vehicles: A Cellular Automata Approach. Sustainability 2020, 12, 2922. [Google Scholar] [CrossRef]
- Caruso, G.; Yousefi, M.K.; Mussone, L. From Human to Autonomous Driving: A Method to Identify and Draw Up the Driving Behaviour of Connected Autonomous Vehicles. Vehicles 2022, 4, 1430–1449. [Google Scholar] [CrossRef]
- Sukennik, P. Micro-simulation guide for automated vehicles. COEXIST 2019. Available online: https://www.rupprecht-consult.eu/project/coexist (accessed on 25 February 2024).
- National Academies of Sciences, Engineering, and Medicine. Highway Capacity Manual, 7th ed.; A Guide for Multimodal Mobility Analysis; The National Academies Press: Washington, DC, USA, 2022. [Google Scholar]
- Evanson, A. Connected autonomous vehicle (CAV) simulation using PTV Vissim. In Proceedings of the 2017 Winter Simulation Conference (WSC), Las Vegas, NV, USA, 3–6 December 2017; p. 4420. [Google Scholar] [CrossRef]
- Abdelkader, G.; Elgazzar, K.; Khamis, A. Connected Vehicles: Technology Review, State of the Art, Challenges and Opportunities. Sensors 2021, 21, 7712. [Google Scholar] [CrossRef] [PubMed]
- Gazder, U.; Alhalabi, K.; AlAzzawi, O. Calibration of autonomous vehicles in PTV VISSIM. In Proceedings of the 3rd Smart Cities Symposium (SCS 2020), Online Conference, 21–23 September 2020; pp. 39–42. [Google Scholar] [CrossRef]
- Giuffrè, T.; Trubia, S.; Canale, A.; Persaud, B. Using Microsimulation to Evaluate Safety and Operational Implications of Newer Roundabout Layouts for European Road Networks. Sustainability 2017, 9, 2084. [Google Scholar] [CrossRef]
- Weyland, C.M.; Baumann, M.V.; Buck, H.S.; Vortisch, P. Parameters Influencing Lane Flow Distribution on Multilane Freeways in PTV Vissim. Procedia Comput. Sci. 2021, 184, 453–460. [Google Scholar] [CrossRef]
- Vortisch, P. Wiedemann-99 Source Code. Available online: https://www.researchgate.net/post/Where-I-can-find-the-mathematical-formulation-of-Wiedemann-99-car-following-model (accessed on 20 November 2023).
- Giuffrè, T.; Curto, S.; Petralia, A. Freeway interchanges maintenance operations. Preliminary safety analysis of connected automated vehicles impact on road traffic. In Proceedings of the Roads and Airports Pavement Surface Characteristics-Proceedings of the 9th International Symposium on Pavement Surface Characteristics, SURF 2022, Milan, Italy, 12–14 September 2022. [Google Scholar] [CrossRef]
- Saleem, T.; Persaud, B.; Shalaby, A.; Ariza, A. Can Microsimulation be used to Estimate Intersection Safety? Transp. Res. Rec. 2018, 2432, 142–148. [Google Scholar] [CrossRef]
- Tumminello, M.L.; Macioszek, E.; Granà, A.; Giuffrè, T. A Methodological Framework to Assess Road Infrastructure Safety and Performance Efficiency in the Transition toward Cooperative Driving. Sustainability 2023, 15, 9345. [Google Scholar] [CrossRef]
- Saulino, G.; Persaud, B.; Bassani, M. Calibration and application of crash prediction models for safety assessment of roundabouts based on simulated conflicts. In Proceedings of the 94th Transportation Research Board (TRB) Annual Meeting, Washington, DC, USA, 11–15 January 2015. [Google Scholar]
- Sadid, H.; Antoniou, C. Modelling and simulation of (connected) autonomous vehicles longitudinal driving behavior: A state-of-the-art. IET Intell. Transp. Syst. 2023, 17, 1051–1071. [Google Scholar] [CrossRef]
- Sharma, S.; Dabbiru, L.; Hannis, T.; Mason, G.; Carruth, D.W.; Doude, M.; Goodin, C.; Hudson, C.; Ozier, S.; Ball, J.E.; et al. CaT: CAVS Traversability Dataset for Off-Road Autonomous Driving. IEEE Access 2022, 10, 24759–24768. [Google Scholar] [CrossRef]
- Schoettle, B.; Sivak, M. A Preliminary Analysis of Real-World Crashes Involving Self-Driving Vehicles; UMTRI-2015-34; The University of Michigan, Transportation Research Institute: Ann Arbor, MI, USA, 2015; pp. 1–24. [Google Scholar]
- Interchange Safety Analysis Tool Enhanced (ISATe): User Manual; National Cooperative Highway Research Program Project 17-45 Enhanced Safety Prediction Methodology and Analysis Tool for Freeways and Interchanges. 2012. Available online: https://highways.dot.gov/research/safety/interactive-highway-safety-design-model/interactive-highway-safety-design-model-ihsdm-overview (accessed on 29 February 2024).
- Saha, D.; Alluri, P.; Gan, A. Applicability of enhanced Interchange Safety Analysis Tool (ISATe) for local applications: A Florida case study. Adv. Transp. Stud. 2019, 49, 129–144. [Google Scholar]
- Islam, M.B.; Perez-Bravo, D.; Silverman, K.K. Freeway Safety Evaluation: A Quantitative Approach Using Highway Safety Manual to Informed Decisions; CUTR Faculty Journal Publications, University of South Florida: Tampa, FL, USA, 2018; Volume 103, Available online: https://digitalcommons.usf.edu/cutr_facpub/103 (accessed on 29 February 2024).
- Sacchi, E.; Sayed, T. Conflict-Based Safety Performance Functions for Predicting Traffic Collisions by Type. Transp. Res. Rec. J. Transp. Res. Board 2016, 2583, 50–55. [Google Scholar] [CrossRef]
- Rahman, M.H.; Abdel-Aty, M.; Wu, Y. A multi-vehicle communication system to assess the safety and mobility of connected and automated vehicles. Transp. Res. Part C Emerg. Technol. 2021, 124, 102887. [Google Scholar] [CrossRef]
- Li, Y.; Li, Z.; Wang, H.; Wang, W.; Xing, L. Evaluating the safety impact of adaptive cruise control in traffic oscillations on freeways. Accid. Anal. Prev. 2017, 104, 137–145. [Google Scholar] [CrossRef] [PubMed]
- Papadoulis, A.; Quddus, M.; Imprialou, M. Evaluating the safety impact of connected and autonomous vehicles on motorways. Accid. Anal. Prev. 2017, 124, 12–22. [Google Scholar] [CrossRef] [PubMed]
- Karbasi, A.; O’Hern, S. Investigating the impact of connected and automated vehicles on signalized and unsignalized intersections safety in mixed Traffic. Transp. Plan. Technol. 2022, 2, 24–40. [Google Scholar] [CrossRef]
- Deluka Tibljaš, A.; Giuffrè, T.; Surdonja, S.; Trubia, S. Introduction of autonomous vehicles: Roundabouts design and safety performance evaluation. Sustainability 2018, 10, 1060. [Google Scholar] [CrossRef]
- Morando, M.M.; Tian, Q.; Truong, L.T.; Vu, H.L. Studying the safety impact of autonomous vehicles using simulation-based surrogate safety measures. J. Adv. Transp. 2018, 2018, 1–11. [Google Scholar] [CrossRef]
- Wang, C.; Xie, Y.; Huang, H.; Liu, P. A review of surrogate safety measures and their applications in connected and automated vehicles safety modeling. Accid. Anal. Prev. 2021, 157, 106157. [Google Scholar] [CrossRef]
- Ren, T.; Xie, Y.; Jiang, L. New England merge: A novel cooperative merge control method for improving highway work zone mobility and safety. J. Intell. Transp. Syst. 2021, 25, 107–121. [Google Scholar] [CrossRef]
- Xue, Y.; Zhang, X.; Cui, Z.; Yu, B.; Gao, K. A platoon-based cooperative optimal control for connected autonomous vehicles at highway on-ramps under heavy traffic. Transp. Res. Part C Emerg. Technol. 2023, 150, 104083. [Google Scholar] [CrossRef]


| Parameter | Interchange 1 | |||||||||
|---|---|---|---|---|---|---|---|---|---|---|
| 1A | 2A | 3A | 4A | 5A | 6A | 1B | 2B | 3B | 4B | |
| Main roadway section width (m) | 12.00 | 12.00 | 11.00 | 11.00 | 11.00 | 10.5 | 17.00 | 15.00 | 22.00 | 19.00 |
| Main roadways length (km) | 0.75 | 0.69 | 0.61 | 0.56 | 0.690 | 0.635 | 1.15 | 1.130 | 2.135 | 0.74 |
| Main roadways lanes quantity | 2.00 | 2.00 | 2.00 | 2.00 | 2.00 | 2.00 | 3.00 | 3.00 | 4.00 | 4.00 |
| Entering ramps | 2.00 | 3.00 | 2.00 | 2.00 | 2.00 | 2.00 | 2.00 | 2.00 | 6.00 | 4.00 |
| Exit ramps | 2.00 | 5.00 | 2.00 | 2.00 | 2.00 | 2.00 | 4.00 | 2.00 | 6.00 | 6.00 |
| interchange land use (km2) | 0.25 | 0.12 | 0.14 | 0.16 | 0.26 | 0.27 | 0.52 | 0.27 | 0.55 | 0.53 |
| Bridges | 1.00 | 2.00 | 1.00 | 1.00 | 1.00 | 2.00 | 2.00 | 4.00 | 2.00 | 9.00 |
| Wiedemann’s 99 Parameters | Real Safe | Cautious | Normal | All Knowing | |
|---|---|---|---|---|---|
| CC0 | (standstill distance) (m) | 1.5 | 1.5 | 1.5 | 1 |
| CC1 | (mean headway time) (s) | 1.5 | 1.5 | 0.9 | 0.6 |
| CC2 | (following variation) (m) | 0 | 0 | 0 | 0 |
| CC3 | (threshold for entering following) (s) | −10 | −10 | −8 | −6 |
| CC4 | (negative following threshold) (m/s) | −0.1 | −0.1 | −0.1 | −0.1 |
| CC5 | (positive following threshold) (m/s) | 0.1 | 0.1 | 0.1 | 0.1 |
| CC6 | (speed dependency of oscillation) (1/ms) | 0 | 0 | 0 | 0 |
| CC7 | (oscillation acceleration) (m/s2) | 0.1 | 0.1 | 0.1 | 0.1 |
| CC8 | (standstill acceleration) (m/s2) | 2 | 3 | 3.5 | 4 |
| CC9 | (acceleration with 80 km/h) (m/s2) | 1.2 | 1.2 | 1.5 | 2 |
| Wiedemann’s 99 Parameters | Default Value | CAV Value | HdV Value | |
|---|---|---|---|---|
| CC0 | (standstill distance) (m) | 1.50 | 1.00 | 1.50 |
| CC1 | (mean headway time) (s) | 0.90 | 0.60 | 0.90 |
| CC2 | (following variation) (m) | 4.00 | 0.00 | 4.00 |
| CC3 | (threshold for entering following) (s) | −8.00 | −6.00 | −8.00 |
| CC4 | (negative following threshold) (m/s) | −0.35 | −0.10 | −0.35 |
| CC5 | (positive following threshold) (m/s) | 0.35 | 0.10 | 0.35 |
| CC6 | (speed dependency of oscillation) (1/ms) | 11.44 | 0.00 | 11.44 |
| CC7 | (oscillation acceleration) (m/s2) | 0.25 | 0.10 | 0.25 |
| CC8 | (standstill acceleration) (m/s2) | 3.50 | 4.00 | 3.50 |
| CC9 | (acceleration with 80 km/h) (m/s2) | 1.50 | 2.00 | 1.50 |
Disclaimer/Publisher’s Note: The statements, opinions and data contained in all publications are solely those of the individual author(s) and contributor(s) and not of MDPI and/or the editor(s). MDPI and/or the editor(s) disclaim responsibility for any injury to people or property resulting from any ideas, methods, instructions or products referred to in the content. |
© 2024 by the authors. Licensee MDPI, Basel, Switzerland. This article is an open access article distributed under the terms and conditions of the Creative Commons Attribution (CC BY) license (https://creativecommons.org/licenses/by/4.0/).
Share and Cite
Granà, A.; Curto, S.; Petralia, A.; Giuffrè, T. Connected Automated and Human-Driven Vehicle Mixed Traffic in Urban Freeway Interchanges: Safety Analysis and Design Assumptions. Vehicles 2024, 6, 693-710. https://doi.org/10.3390/vehicles6020032
Granà A, Curto S, Petralia A, Giuffrè T. Connected Automated and Human-Driven Vehicle Mixed Traffic in Urban Freeway Interchanges: Safety Analysis and Design Assumptions. Vehicles. 2024; 6(2):693-710. https://doi.org/10.3390/vehicles6020032
Chicago/Turabian StyleGranà, Anna, Salvatore Curto, Andrea Petralia, and Tullio Giuffrè. 2024. "Connected Automated and Human-Driven Vehicle Mixed Traffic in Urban Freeway Interchanges: Safety Analysis and Design Assumptions" Vehicles 6, no. 2: 693-710. https://doi.org/10.3390/vehicles6020032
APA StyleGranà, A., Curto, S., Petralia, A., & Giuffrè, T. (2024). Connected Automated and Human-Driven Vehicle Mixed Traffic in Urban Freeway Interchanges: Safety Analysis and Design Assumptions. Vehicles, 6(2), 693-710. https://doi.org/10.3390/vehicles6020032