Article

Virtual Plug-In Hybrid Concept Development and Optimization under Real-World Boundary Conditions

Chair of Thermodynamics of Mobile Energy Conversion Systems (TME), RWTH Aachen University, 52074 Aachen, Germany
*
Author to whom correspondence should be addressed.
Vehicles 2024, 6(3), 1216-1248; https://doi.org/10.3390/vehicles6030058
Submission received: 4 June 2024 / Revised: 8 July 2024 / Accepted: 9 July 2024 / Published: 15 July 2024
(This article belongs to the Special Issue Vehicle Design Processes, 2nd Edition)

Abstract

:
The automotive industry faces development challenges due to emerging technologies, regulatory demands, societal trends, and evolving customer mobility needs. These factors contribute to a wide range of vehicle variants and increasingly complex powertrains. The layout of a vehicle is usually based on standardized driving cycles such as WLTC, gradeability, acceleration test cases, and many more. In real-world driving cycles, however, this can lead to limitations under certain boundary conditions. To ensure that all customer requirements are met, vehicle testing is conducted under extreme environmental conditions, e.g., in Sweden or Spain. One way to reduce the development time while ensuring high product quality and cost-effectiveness is to use model-based methods for the comprehensive design of powertrains. This study presents a layout methodology using a top-down approach. Initially, powertrain-relevant requirements for an exemplary target customer are translated into a specification sheet with specific test cases. An overall vehicle model with detailed thermal sub-models is developed to evaluate the different requirements. A baseline design for a C-segment plug-in hybrid vehicle was developed as part of the FVV research project HyFlex-ICE using standardized test cases, highlighting the influence of customer profiles on the design outcome through varying weighting factors. The target customer’s design is analyzed in four real driving scenarios, considering variations in parameters such as the ambient temperature, traffic, driver type, trailer pulling, and battery state-of-charge, to assess their influence on the target variables. In the next step, the potential of hardware technologies and predictive driving functions is examined in selected driving scenarios based on the identified constraints of the baseline design. As a result, four application-specific technology packages (Cost neutral, Cold country, Hot country, and Premium) for different customer requirements and sales markets are defined, which, finally, demonstrates the applicability of the holistic methodology.

1. Introduction

The development challenges in the automotive industry are constantly increasing due to the large number of vehicle variants, the growing complexity of powertrains, and future regulatory requirements [1,2]. In addition, there is a growing demand for vehicles that do not have a negative impact on the environment over their entire life cycle. To further reduce development times while maintaining high product quality and cost-effectiveness, the use of new model-based methods in early development phases is necessary [3,4,5,6].
For organizational reasons, the optimization of the derived target variables is usually carried out in isolation between individual disciplines, so that possible interactions cannot be considered holistically [3]. The state of the art in powertrain design is described below. In [7], both an operating strategy and a component design of various hybrid drives in the NEDC were carried out using a statistical design of experiments (DoE). Based on this, the approach was extended in [8] to include more realistic driving cycles, taking into account driving performance requirements. In [9], the pollutant emissions, under the Euro 6 RDE boundary conditions, are also considered. Different optimization algorithms for the energy management of hybrid vehicles are discussed in [10,11,12,13], with a focus on energy consumption. Danzer and Teuschl also evaluate the differential costs of designing different powertrains compared to a reference vehicle [14,15]. In addition, [14] evaluates other customer requirements such as the acoustic driving comfort based on the noise in the engine compartment. The driving scenarios in which this evaluation was performed are not explained in detail. A rudimentary approach to evaluating noise-vibration-harshness (NVH) is used in [16], and is based on the number of engine starts and gear changes. For the optimal concept design of electrified powertrains, Weiß considers the driving performance, consumption, and economy as target variables while taking into account different boundary conditions, such as a minimum electric range or the reproducibility of acceleration in different driving cycles [17].
Temperatures are often considered only for single components (e.g., in [9,18] for the exhaust system or in [19] for the vehicle interior) or as simplified model (e.g., as a thermal network of combustion engine, transmission, and electric motor in [8,17] or as a time-dependent control function of the electric motor in [20]). Cooling systems have been designed with the help of simulations for decades. However, the focus was initially only on the dimensioning of the water pump and the radiator [21,22]. Eilemann shows that a holistically designed thermal management system can contribute to the reduction of CO2 emissions [23]. Therefore, several publications deal with the investigation of thermal management technologies such as electric water pumps or control valves [24,25,26,27,28,29]. They are limited to conventional combustion engine drives. However, according to [19,30,31,32], the thermal management requirements for electrified powertrains are higher due to the different temperature levels and vehicle operating modes.
In [19,31], a simulation approach is used that can consider system relationships between multiple target variables. Genender et al., investigate the influence of different heating measures on the thermal comfort in hybrid and electric vehicles [19]. Shutty et al., show the results of different case studies on the influence of temperatures on component losses, the thermal safety of electric motors, and the thermal coupling between a battery and the vehicle interior [31]. Beste limits her study to the high-voltage system [30].
From the state of the art, it can be deduced that, although the hybrid vehicle system design is continuously considered with an increasing number of different target variables, this has not yet been done completely or with a sufficient level of detail and consideration of interactions. As a result, unexpected deviations from defined specification targets can occur, especially in real driving scenarios of full vehicle tests, requiring repeated vehicle tests or mechanical adjustments. This can lead to an increase in development costs and a delay in the start of production [33]. This means, in detail, that it is necessary to take into account the interactions within powertrain systems and all their components at the earliest possible stage of development, including their mechanical as well as thermal boundary conditions. Consequently, the full potential for the targeted product over the whole field of application and range of use can be utilized. However, the early development stages have recently been characterized by CO2 emission optimization with simplified approaches and a focus on basic driving cycles such as the Worldwide harmonized Light vehicles Test Procedure (WLTP).
Against this background, we developed a holistic methodical approach in the FVV project HyFlex-ICE for the holistic designing and optimization of vehicles and powertrains [34]. This methodology was developed using an exemplary hybrid powertrain (combined hybrid) but is generally applicable and transferable to other transport applications. As a baseline for our in-depth investigation, an optimal propulsion system configuration and operating strategy was developed for this reference vehicle.
Building on that, this research investigates the impact of real-world driving scenarios on the optimal operation of a plug-in hybrid electric vehicle (PHEV) by addressing the following questions:
Which real-world driving scenarios can limit the optimal operation of a PHEV in terms of CO2, NVH, drivability, and pollutant emissions?
  • What is the impact of predictive controls on the powertrain limitations?
  • What is the impact of hardware technologies and rule-based control adaptations on the powertrain limitations?
  • By addressing these questions, this work aims to contribute to the development of future vehicles with optimized performance across real-world driving conditions.

2. Vehicle Requirements Management and Optimal Hybrid Powertrain System Design

For the identification of suitable technical solutions which enable the best implementation of operating modes, all boundary conditions and limitations regarding system operation must be considered. To address this objective, a systems-engineering framework was formulated and devised within the context of the Vehicle Requirements Management guidelines, ensuring that the relevant interests of all stakeholders are being taken into account.
Starting from a generic or specific product idea, such as a vehicle, a top-down approach as outlined in [35,36] is employed to gather all stakeholder requirements in an abstract and solution-neutral manner. These requirements are subsequently decomposed for subsystems, gradually transitioning into more specific technical descriptions [35,37]. Utilizing stakeholder- or customer-specific weighting factors, target values and constraints are assigned to the neutral attributes and, finally, merged into a comprehensive requirements catalogue [35,36].
For this research, corresponding features (functional requirements) and targets (non-functional requirements) are determined for all aspects of the vehicle and filtered with respect to powertrain-related requirements. On the basis of a pre-study analyzing powertrain limitations, the electrification level was defined as plug-in hybrid (PHEV), cf. [34,36]. In alignment with current market trends, the propulsion system was integrated into a c-segment sports utility vehicle (SUV), cf. [34,36].
This methodology offers flexibility in its initiation point and applicability across various propulsion systems and means of transportation, rendering it generic, scalable, and universally applicable. Furthermore, it extends to encompass multi-market, multi-derivative, and multi-platform strategies, thereby increasing its complexity with expanded steps [36].

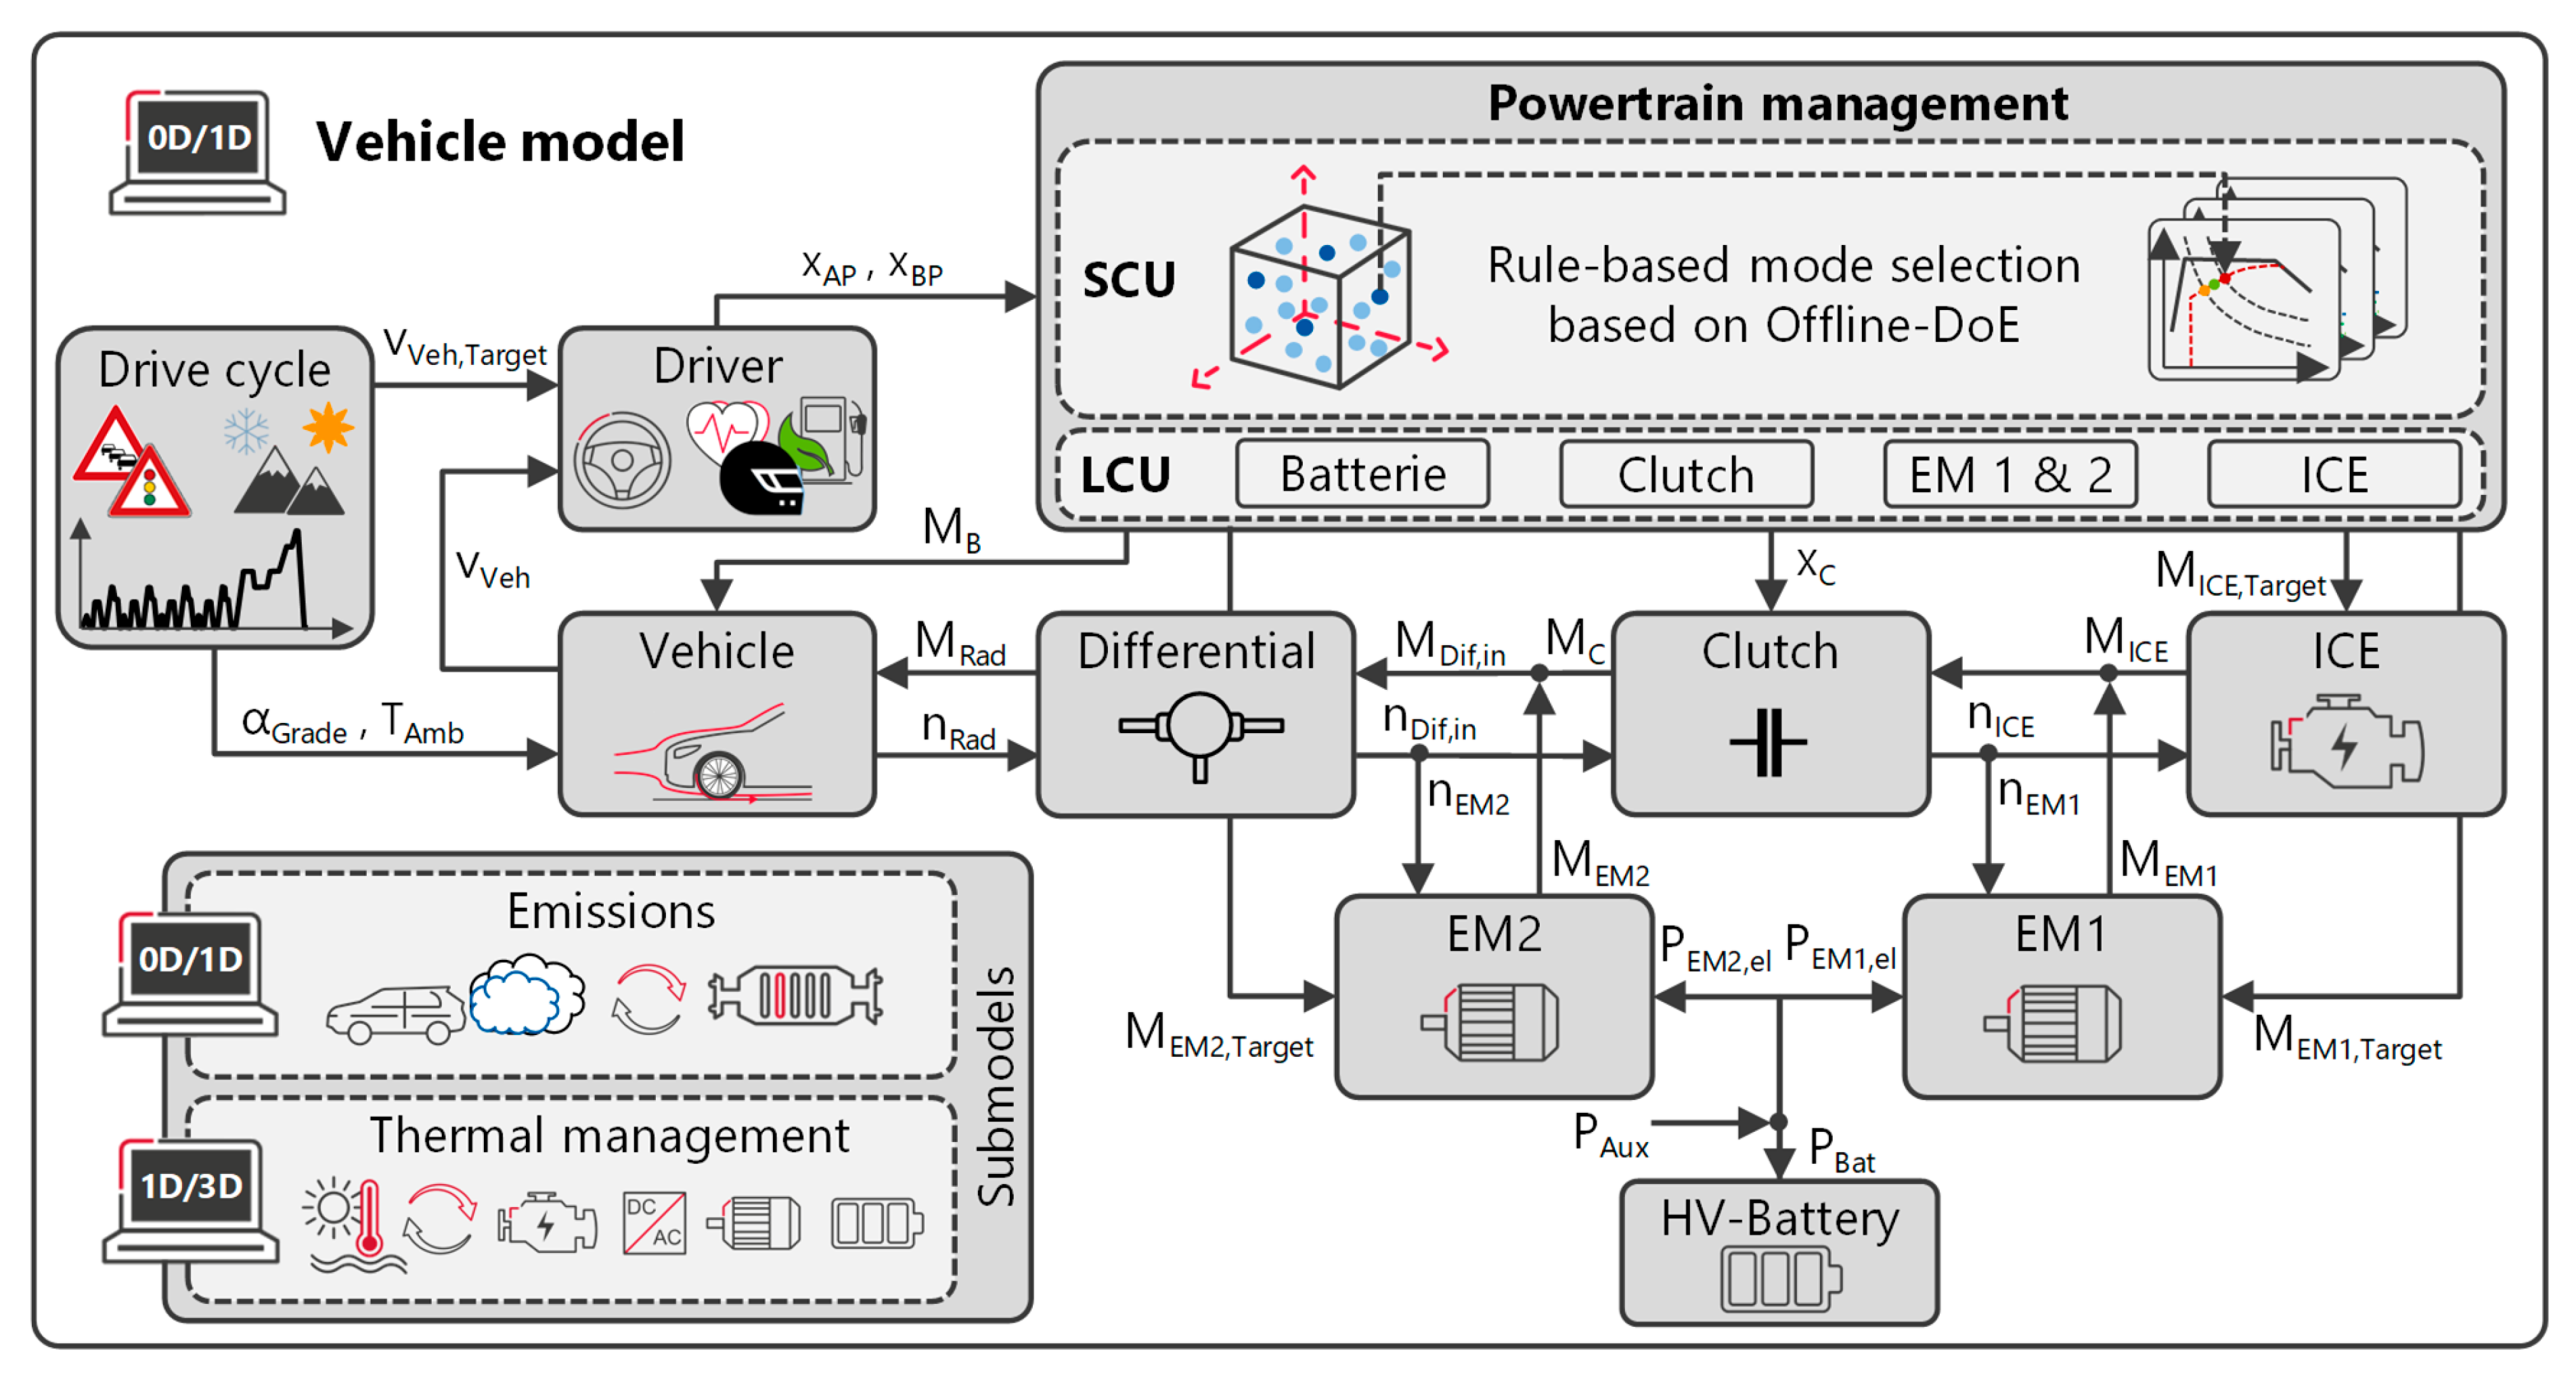
2.1. Pre-Dimensioning and Modeling of Vehicle and Operating Strategy

A preliminary powertrain design was established based on a comprehensive requirements catalog. This catalog prioritized vehicle performance and efficiency, while incorporating weighting factors specific to the target customer segment. To achieve this balance, a multi-objective optimization approach was implemented. This approach considered not only efficiency targets but also their trade-off with the system cost and customer-desired NVH characteristics.
To reduce the design space for subsequent statistical design of experiments (DoE) optimization, an analytical pre-dimensioning and conceptual design methodology was developed. This methodology employs a combined backward-forward simulation approach, utilizing analytical vehicle resistance equations and simplified component characteristics. The primary objective is to estimate the minimum, maximum, and overall orders of magnitude of the system components. This approach aligns with the principles of model-based systems engineering, as described in [38,39]. For pre-dimensioning, a dedicated standalone MATLAB application was developed, aiming for fast initial propulsion system integration. This application uses an analytical, iterative process to estimate component properties for a range of different propulsion system configurations, enabling the identification of effects of parameter variations on critical scenarios and component properties [34]. These results are subsequently used as the preliminary base design.
The analytical sizing and conceptual design process is illustrated schematically in Figure 1. It demonstrates the integration of requirements management with the analytical sizing of component dimensions. Unlike the approach presented in [40], our methodology enables the preliminary design of various powertrain types and configurations tailored to specific customer requirements. The technical details of the algorithms in the background and the extended application possibilities will be discussed in detail in a follow-up publication.
While the sizing of the components in hybrid propulsion systems is primarily defined by performance criteria, a comprehensive design approach must consider the intricate interactions between the operating strategy and system layout. These interactions encompass the delicate balance between the performance, efficiency, emissions, and NVH. Additionally, thermal system limitations and interactions between mechanical, thermal, and electrical boundary conditions must be carefully addressed. For this purpose, a physical-empirical simulation model based on a closed-loop forward simulation approach is used for the system optimization of the propulsion concepts with respect to the various target variables of the requirements catalog. This vehicle model and this operating strategy model are based on Seibel [7], Balazs [8], and Böhmer [9]. In the HyFlex-ICE [34,36] and ZITE [41] research projects, this model was further developed, especially regarding thermal, emission, and NVH modeling. The corresponding schematic illustration of the overall model is shown in Figure 2.
The integrated system simulation considers all powertrain components on the basis of data from benchmark validated models. Furthermore, different levels of complexity and detail of the subsystems can be selected depending on the specific development phase [34,36]. For the optimal base layout, simplified thermal and emission models were used to reduce the simulation time. Optimization of the powertrain involves scaling methods for all components, cf. [7,8]. Additionally, the heuristic operating strategy incorporates a parameter set for managing driving mode changes and battery recharging, and was developed by [42,43].

2.2. Optimized Combined Plug-In Hybrid Powertrain Design

Based on the defined catalog of requirements, the system components were designed and optimized with the help of the simulation models presented herein, considering the vehicle characteristics. For this purpose, extensive simulation studies were performed to verify that all requirements were at least met. Utilizing the described modeling approach, combining high accuracy with a low computational demand, multi-objective optimization via the DoE is conducted [44,45]. The left side of Figure 3 shows the schematic structure of the powertrain. The different colors represent the mechanical, electrical, and chemical energy flows. The modeling approaches used for the baseline design and the investigation of real driving scenarios are shown on the right side with the check mark. For the electrical components, the base design uses a time-dependent function for thermal derating to achieve realistic results in the performance test cases. Simplified thermal networks were also used for the combustion engine and high-voltage battery to provide temperatures as input variables for other sub-functions. The catalyst was not included in the base design as the concept had already been validated with a similar vehicle class in the WLTC [18]. In the real driving scenarios, detailed thermal models were used for all components, as the thermal effects increase significantly compared to the standardized tests.
For the DoE approach, a test plan of variable hardware and operating strategy parameters is generated within xCAL [45,46]. This includes a flexible combination of all parameters to quantify the effects of parameter changes and can be optimized by the results of the analytical pre-dimensioning approach. Subsequently, leveraging longitudinal dynamic simulation outcomes, a regression model is trained in xCAL utilizing a Gaussian process model [45,46].
The optimization process considers all requirements, such as performance, CO2 emissions, NVH, and costs, weighted in accordance with the target customer preferences. The state of charge (SOC) balance of the battery is a secondary condition for optimization. Finally, the mathematical optimization is validated using optimal parameter sets within the simulation model [34,36].
Table 1 briefly summarizes the resulting optimal base layout of the propulsion system. The main hardware design is primarily defined by the performance maneuvers. The detailed multidimensional, polynomial model and specifics regarding these critical maneuvers are elaborated in [34,36]. As a result, the hardware sizes and operating strategy parameters provide the best compromise with regard to a CO2- and cost-optimal powertrain layout. This configuration leads to the following optimal baseline results: the WLTC charge sustaining CO2 emissions of mBase,WLTC,CS = 109.1 gCO2/km, NVH-masking noise exceedance of NBase,WLTC = 0.028 mJ/m2, and delta costs compared to a reference powertrain of CBase = 1074€, cf. [34].
In general, it is essential to consider that the specific component characteristics are heavily influenced by the detailed maneuver definition. Therefore, a particularly high priority must be given to the definition process for these test cases.
These defined and optimized propulsion system characteristics, including the rule-based operating strategy, serve as a basis for the following in-depth analysis to identify possible limitations and violations of all of the defined requirements in Real-World Driving Scenarios. Based on this, both the optimization of the operating strategy, as well as hardware adaptions, and the implementation of technology packages is carried out.

2.3. Advanced Modeling Approach

In general, many propulsion system limitations are caused by emission limitations, thermal boundaries, and environmental conditions. For this reason, a detailed and advanced modeling approach for the NVH, determined mainly by the thermal and emission system, is introduced in the following to consider this in the early development stage. All relevant aspects were brought together and integrated into a uniform and holistic simulation toolchain, cf. [36].

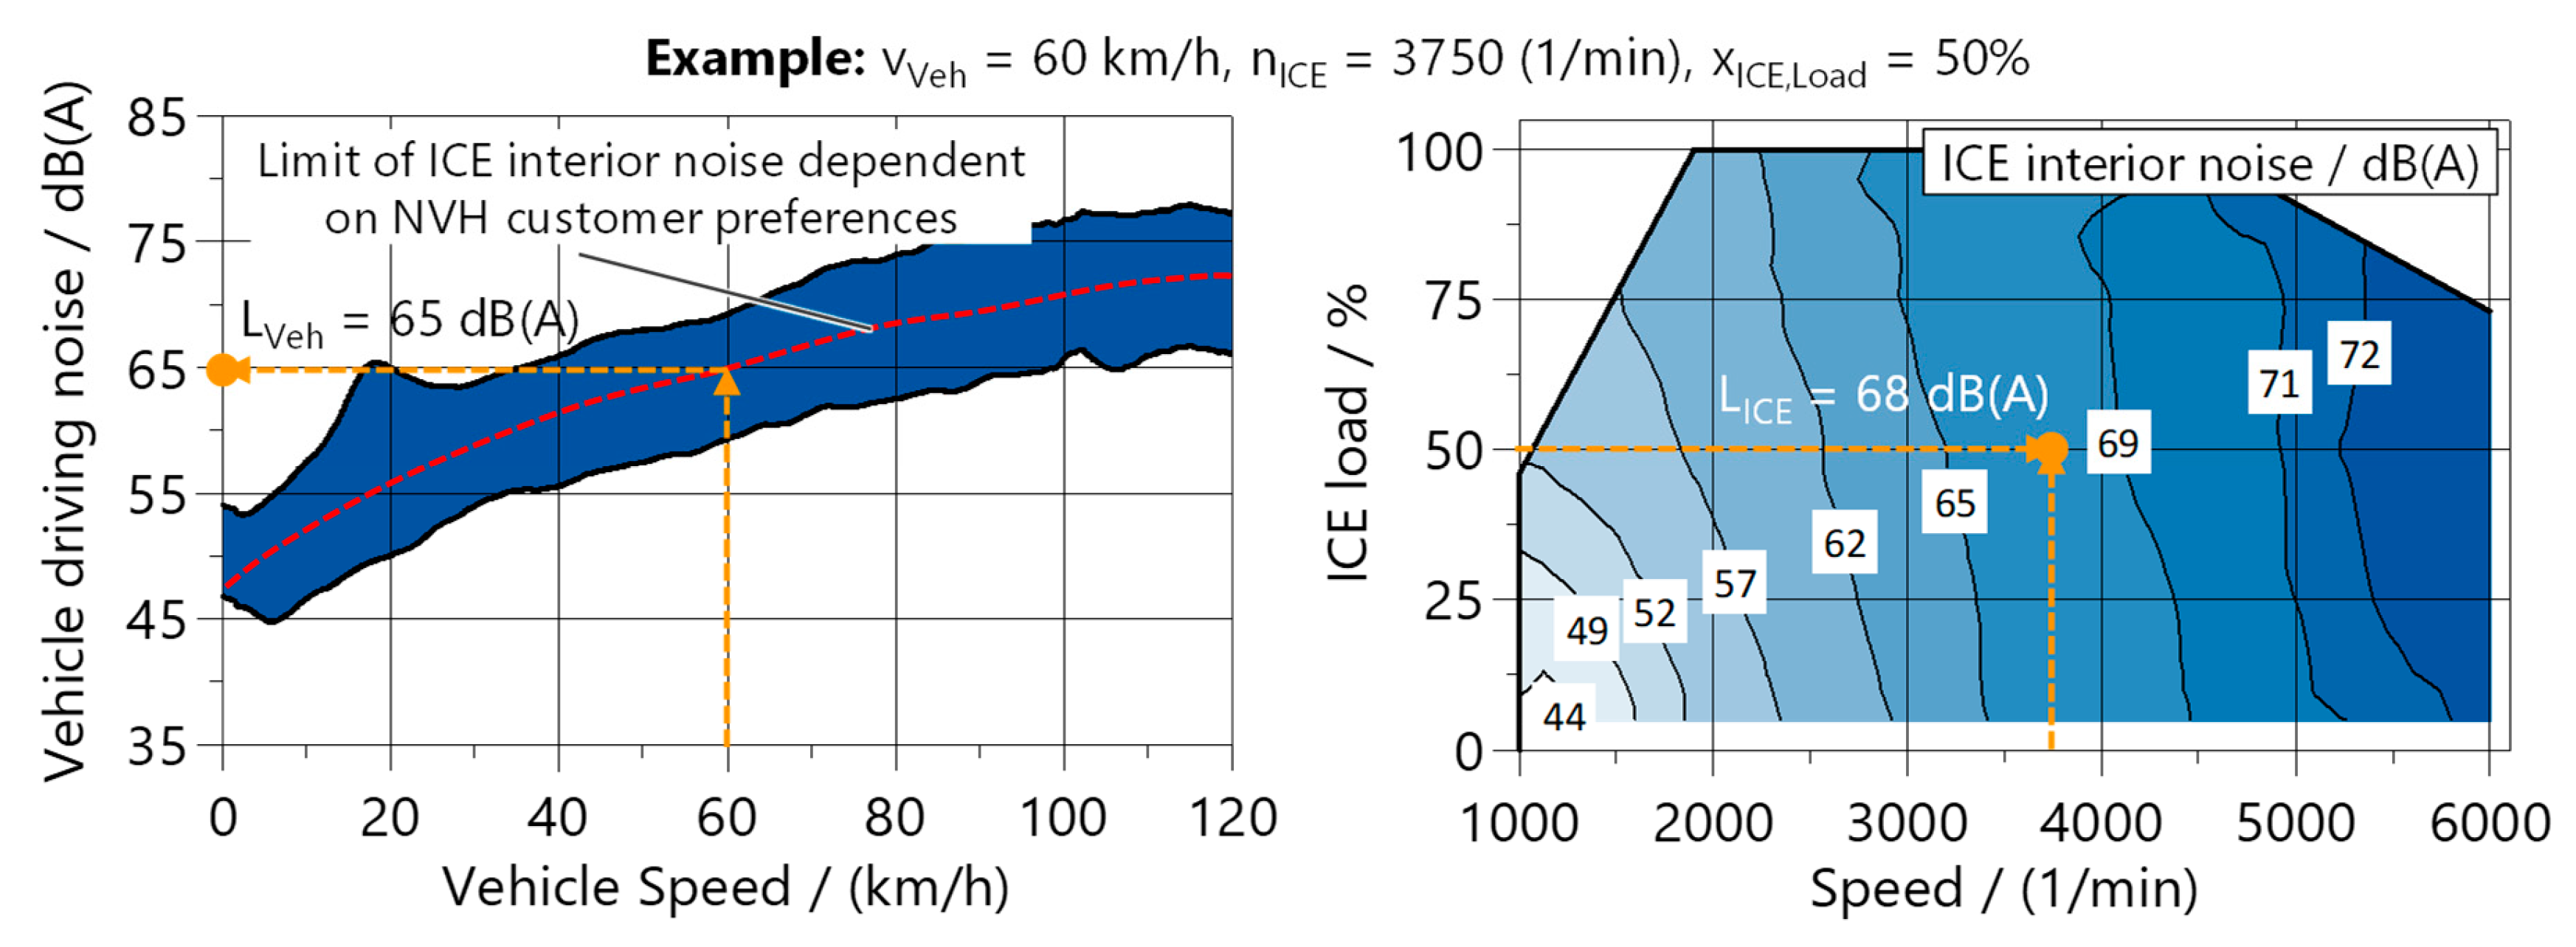
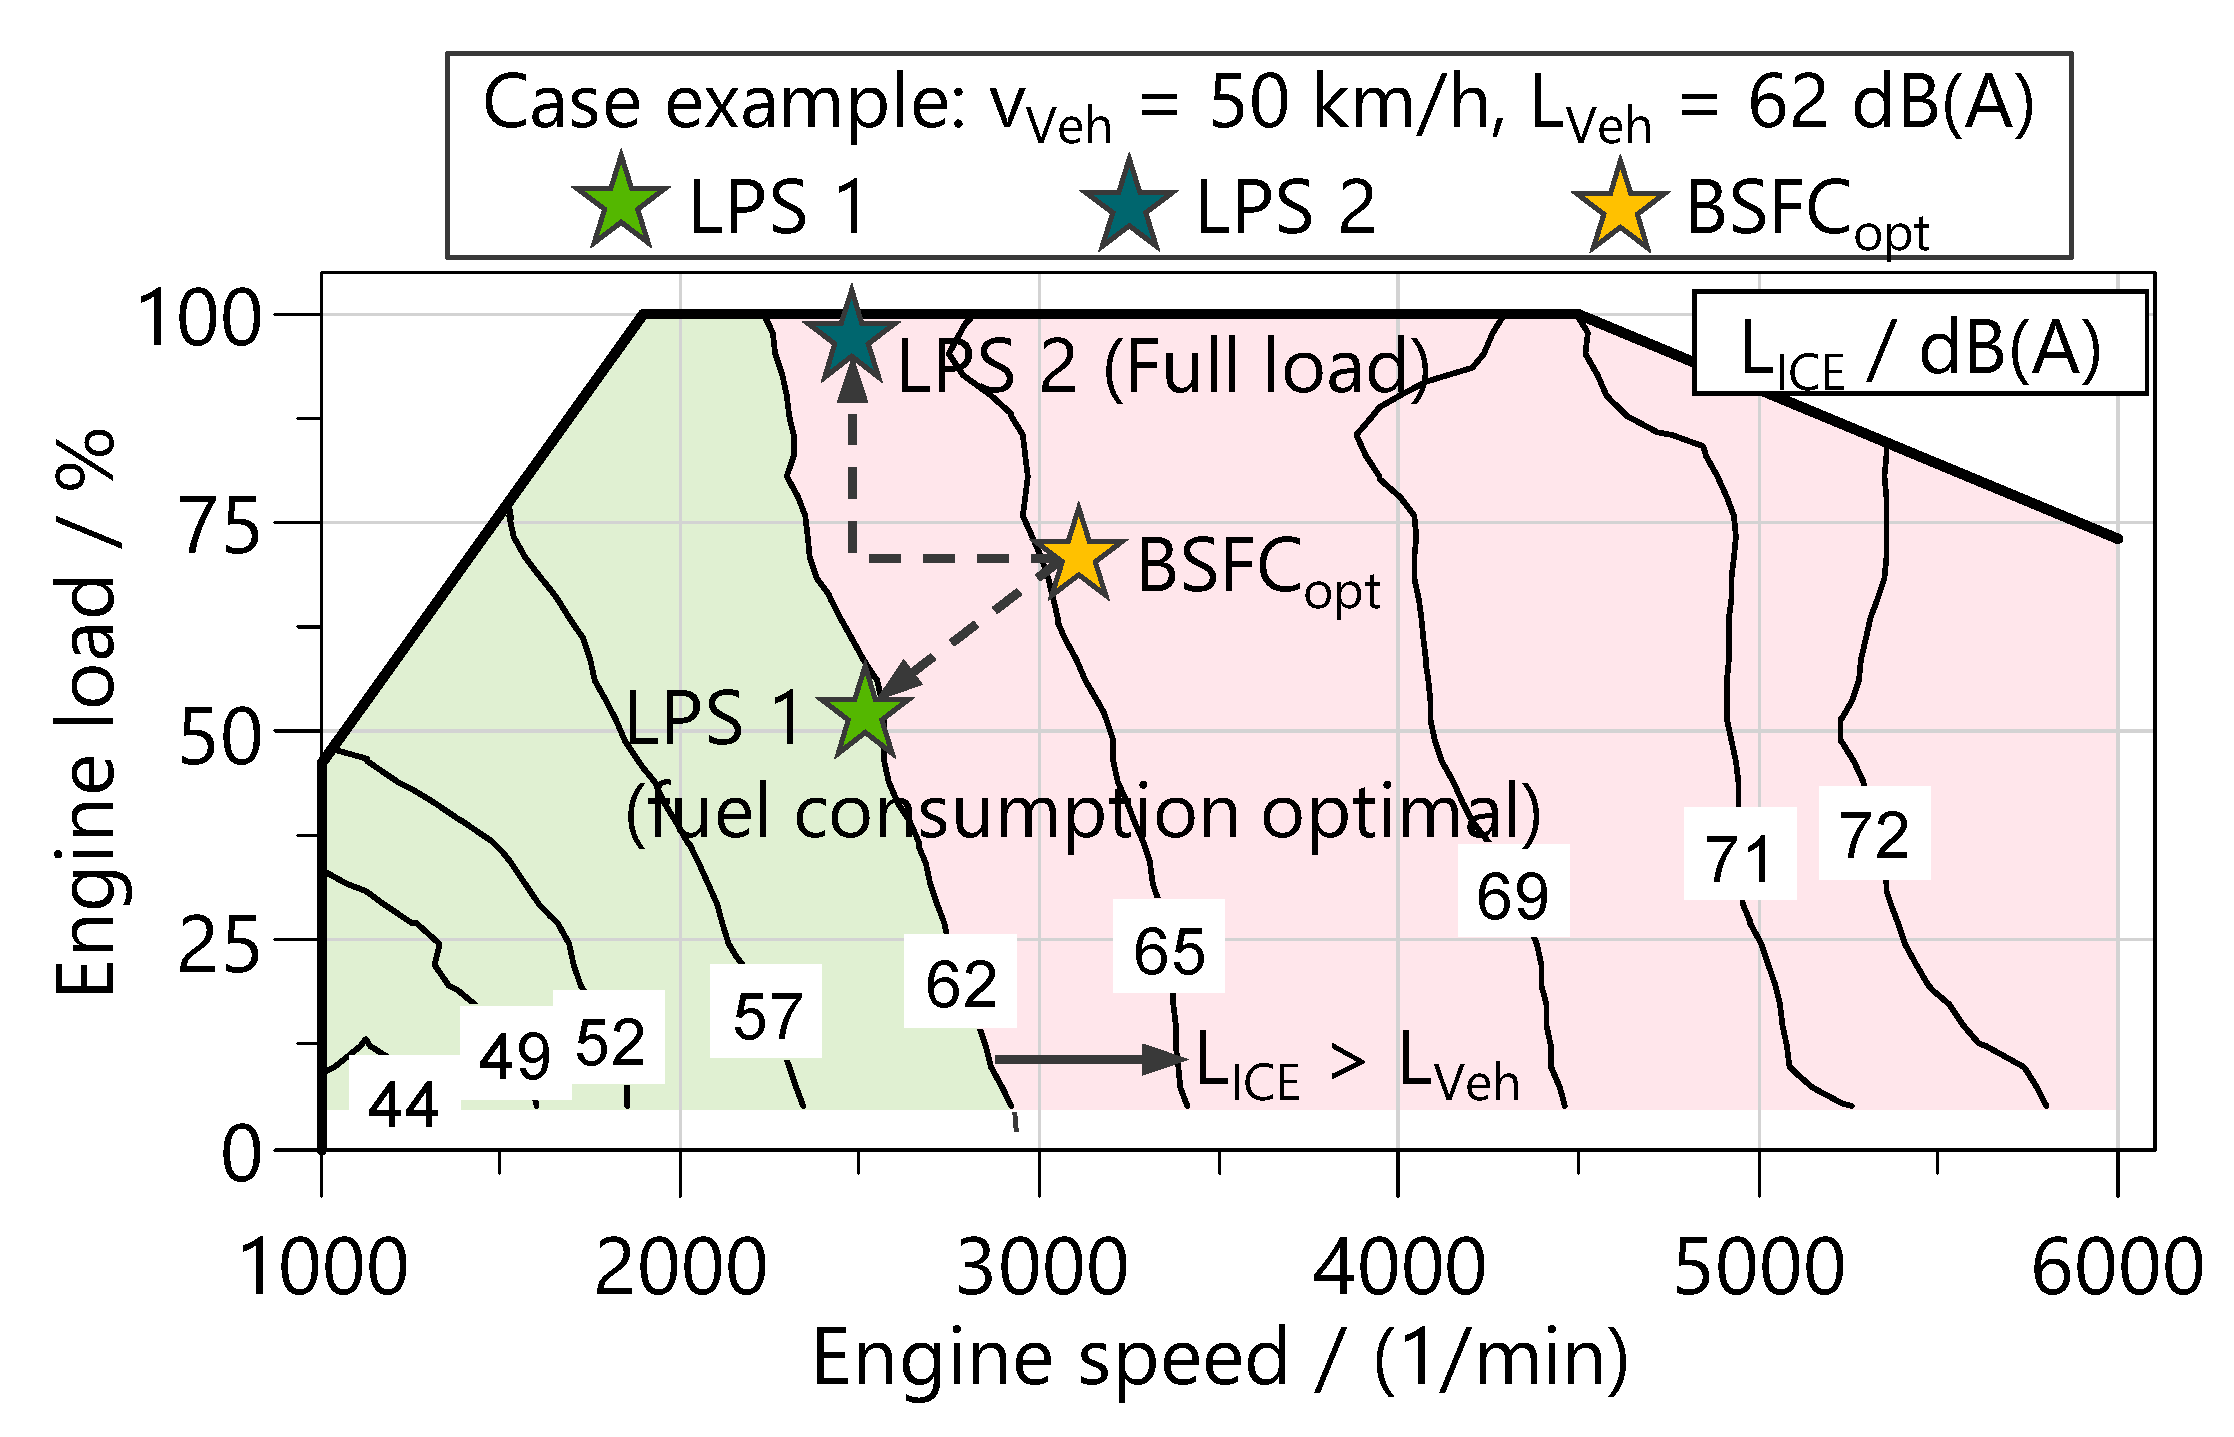
2.3.1. NVH Modeling Approach

The acoustic passenger comfort is assessed using a map-based approach that can be used in the early concept phase. The masking noise generated by rolling and aerodynamic drag is compared with the ICE noise, including airborne and structure-borne noise emissions at the position of the driver’s headrest. To determine a target value, a scatter band for the masking noise including a transfer function to the described position from the TME database and from the FVV project “Noise in the vehicle interior with electrified drives” [47,48] is used (see the left diagram in Figure 4).
Depending on the customer weighting of the NVH criterion, a corresponding curve can be inserted into this scatter band (cf. red line on the left side of Figure 4). The interior noise of an exemplary ICE is shown in the right diagram in Figure 4. In the example shown in the figure (see orange lines in Figure 4), a rolling and wind interior noise of LVeh = 65 dB(A) is generated at vVeh = 60 km/h. At the ICE operating point nICE = 3750 1/min and xICE,L = 50%, the interior noise is LICE = 68 dB(A). In a single timestep, the excess masking noise ΔLM can therefore be calculated according to Equation (1).
Δ L M = L V e h L I C E
This approach is extended to obtain a characteristic evaluation measure for the noise emissions over the entire driving cycle. For this purpose, the logarithmic sound intensity levels LVeh and LICE, with the reference sound intensity I0 = 10−12 W/m2, are first converted into intensities according to Equation (2).
I = I 0 · 10 L 10
From this, the integral of the deviation between IVeh and IICE is calculated according to Equation (3), if (IVehIICE) > 0. The ratio NVeh-ICE in J/m2 considers both the duration and the intensity of the masking noise overshoot.
N V e h I C E = t 0 t T r i p I V e h I I C E d t  

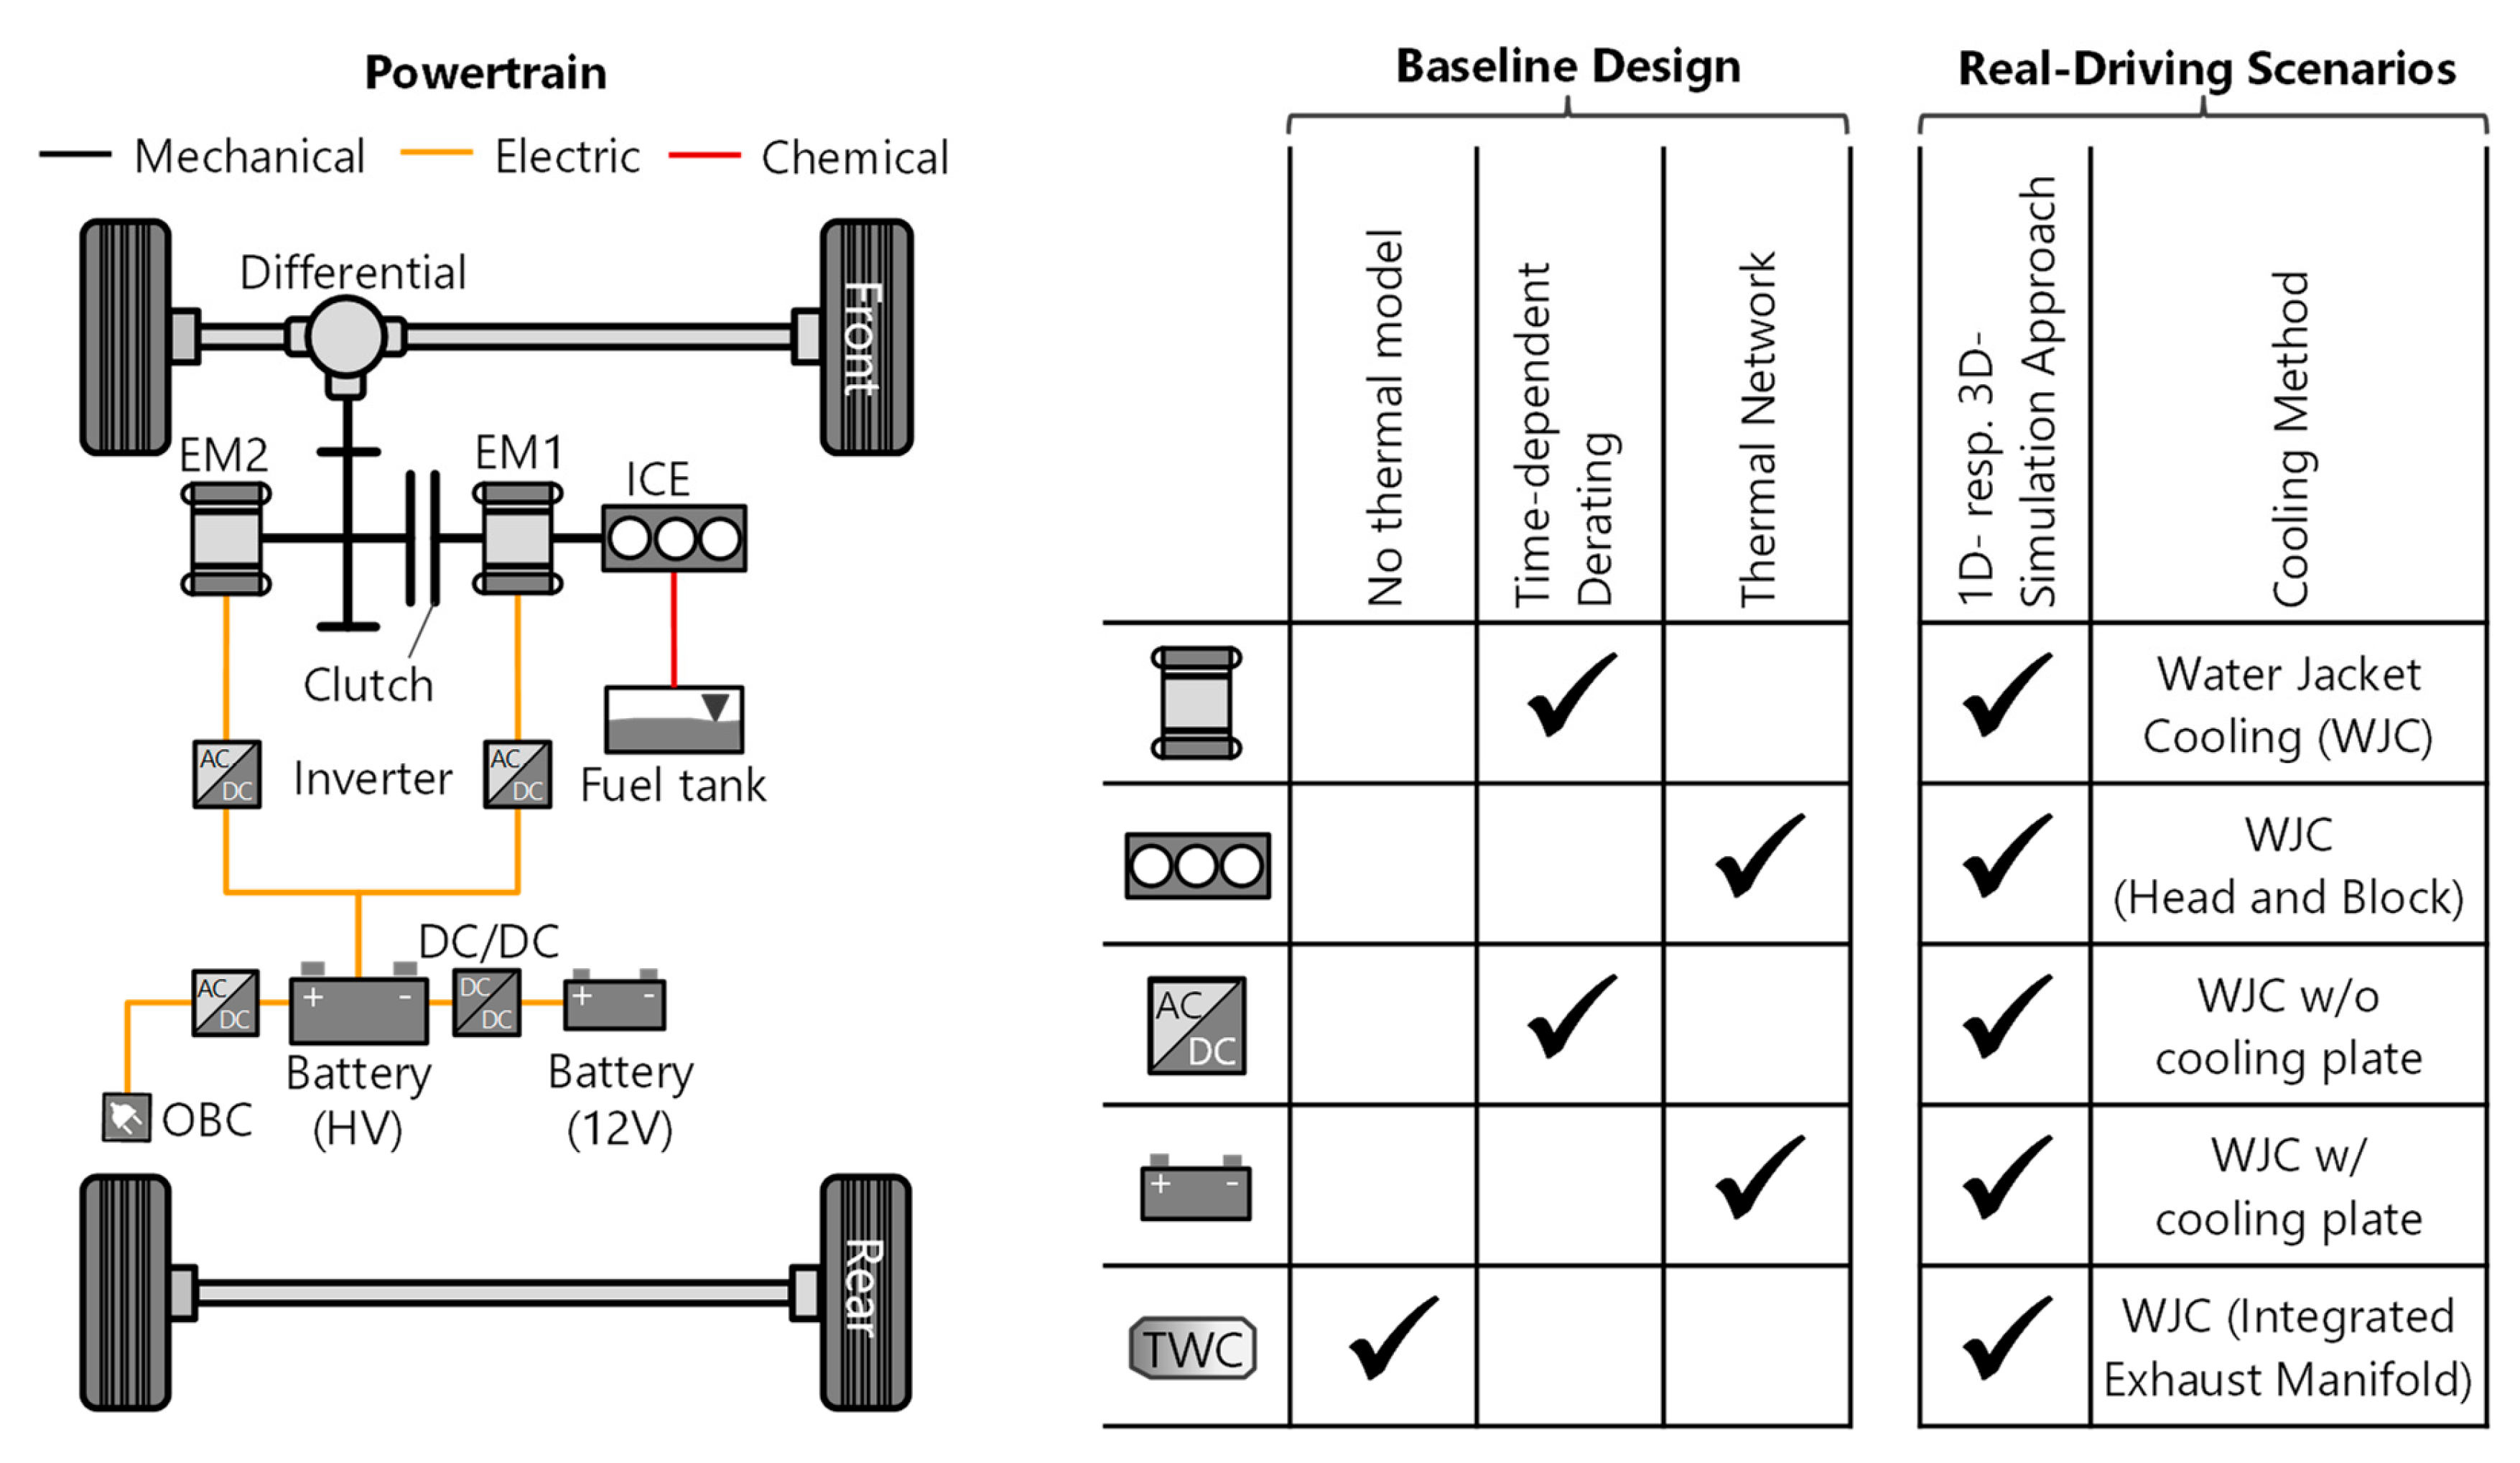
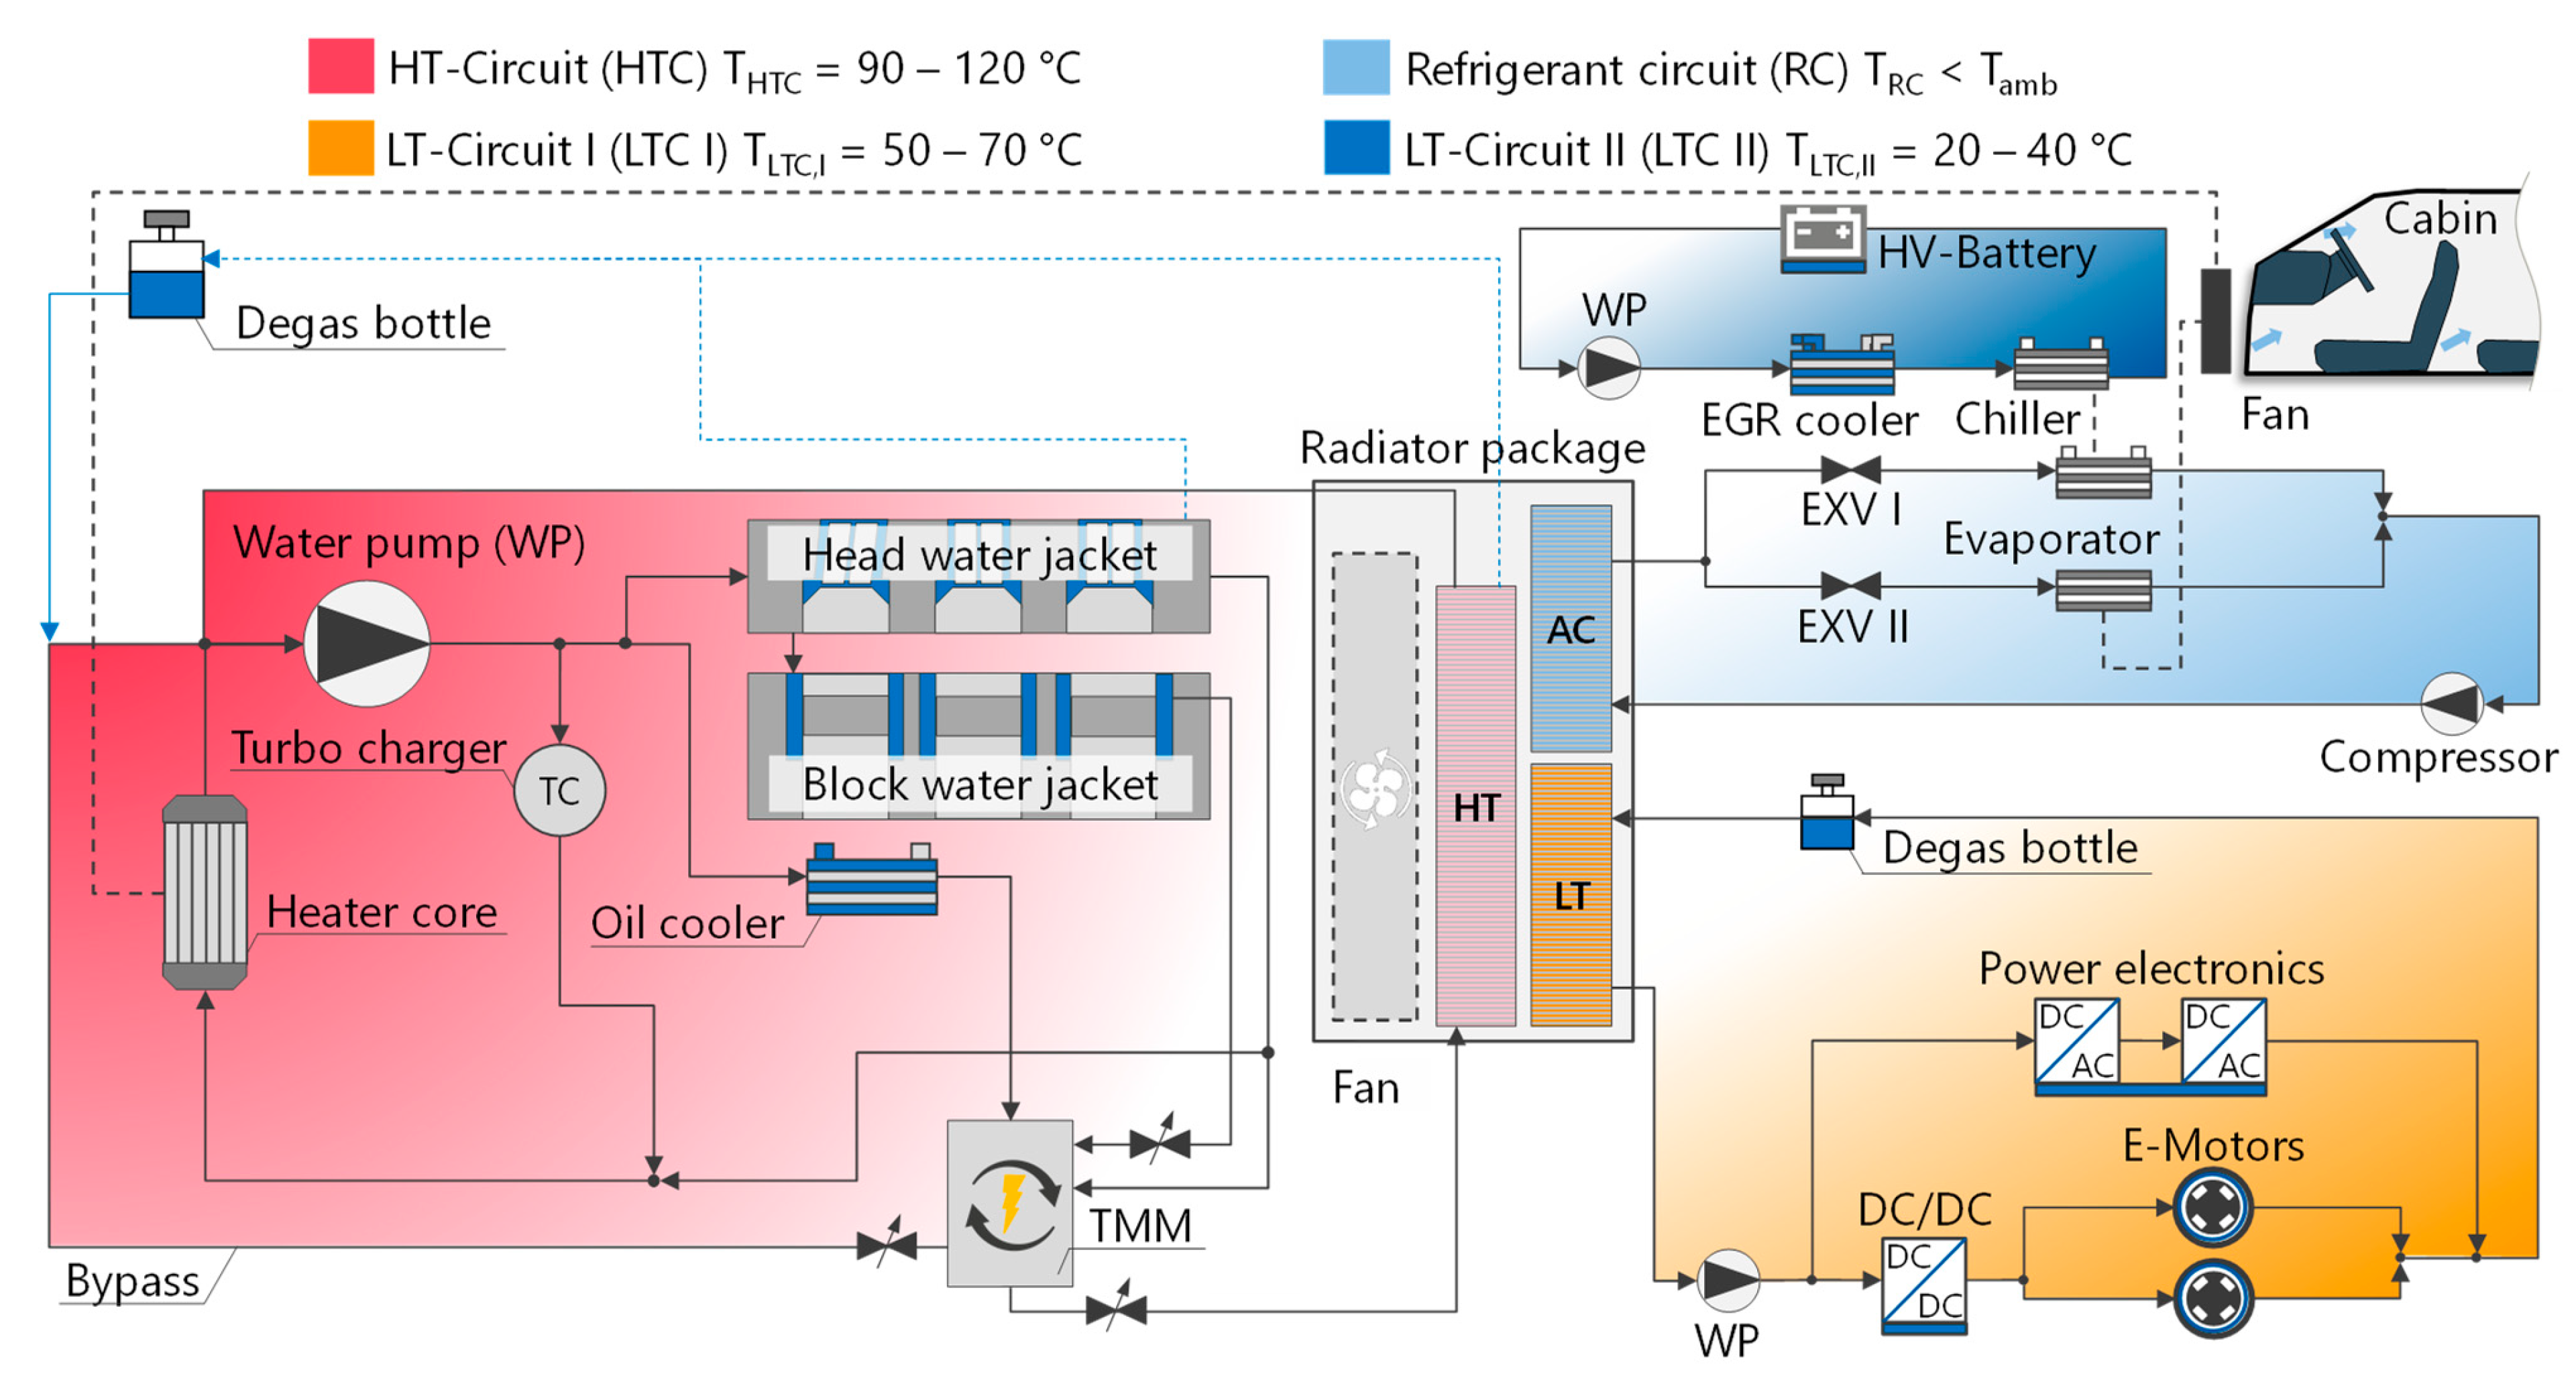
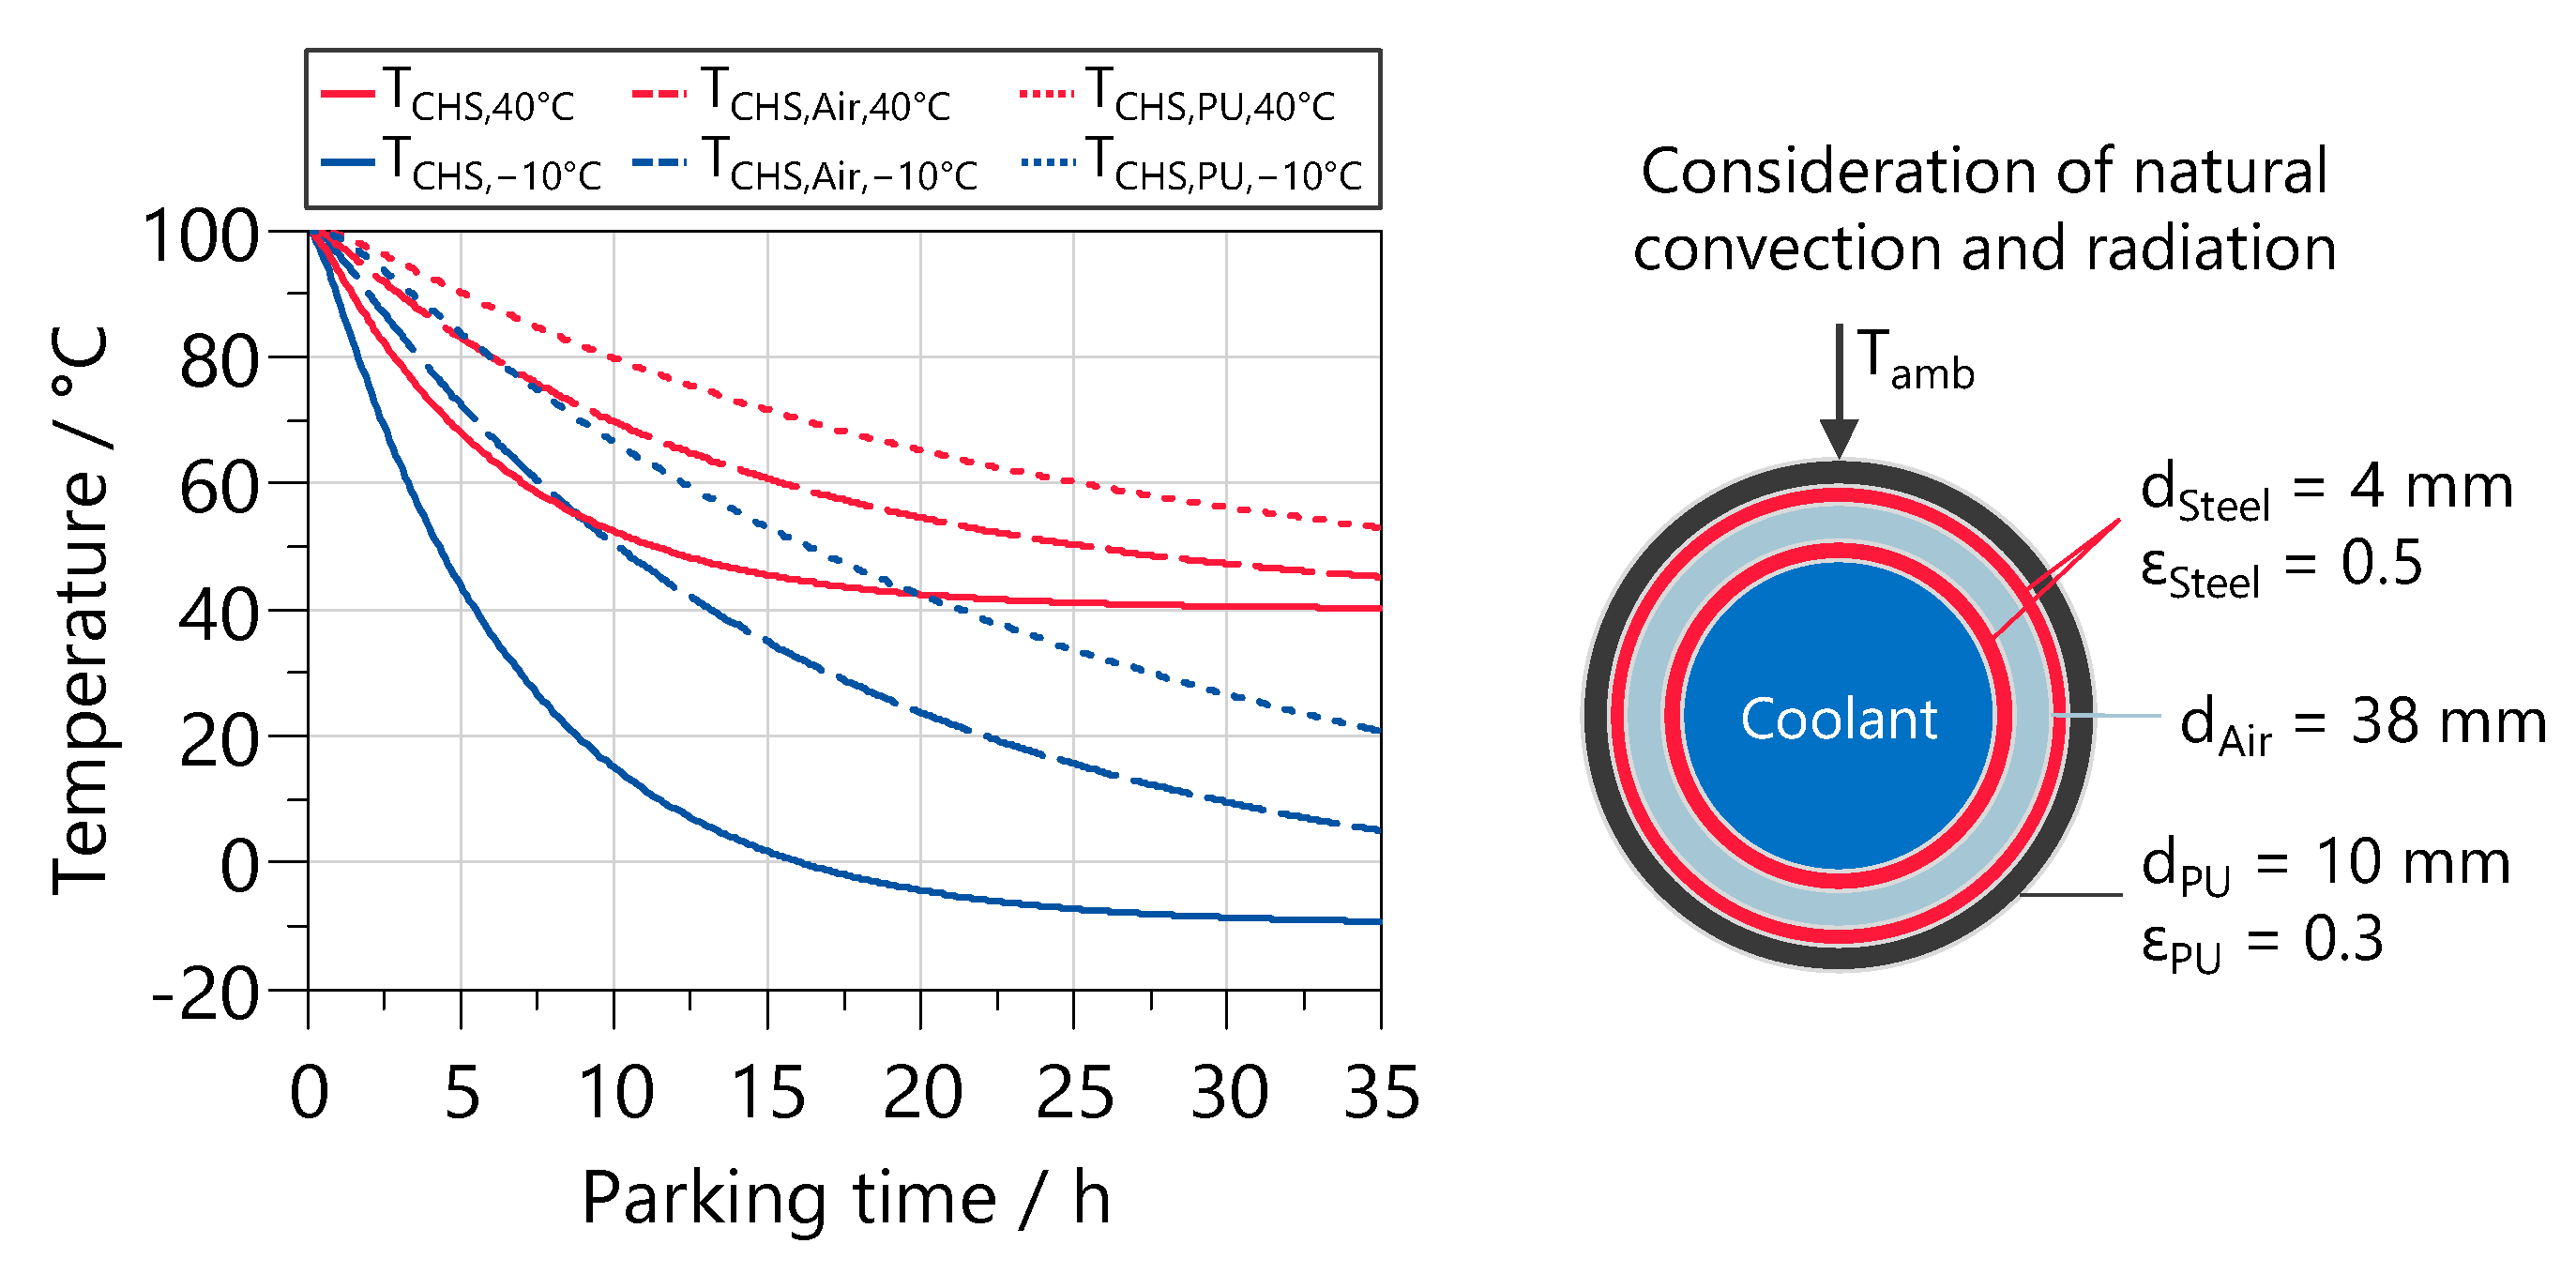
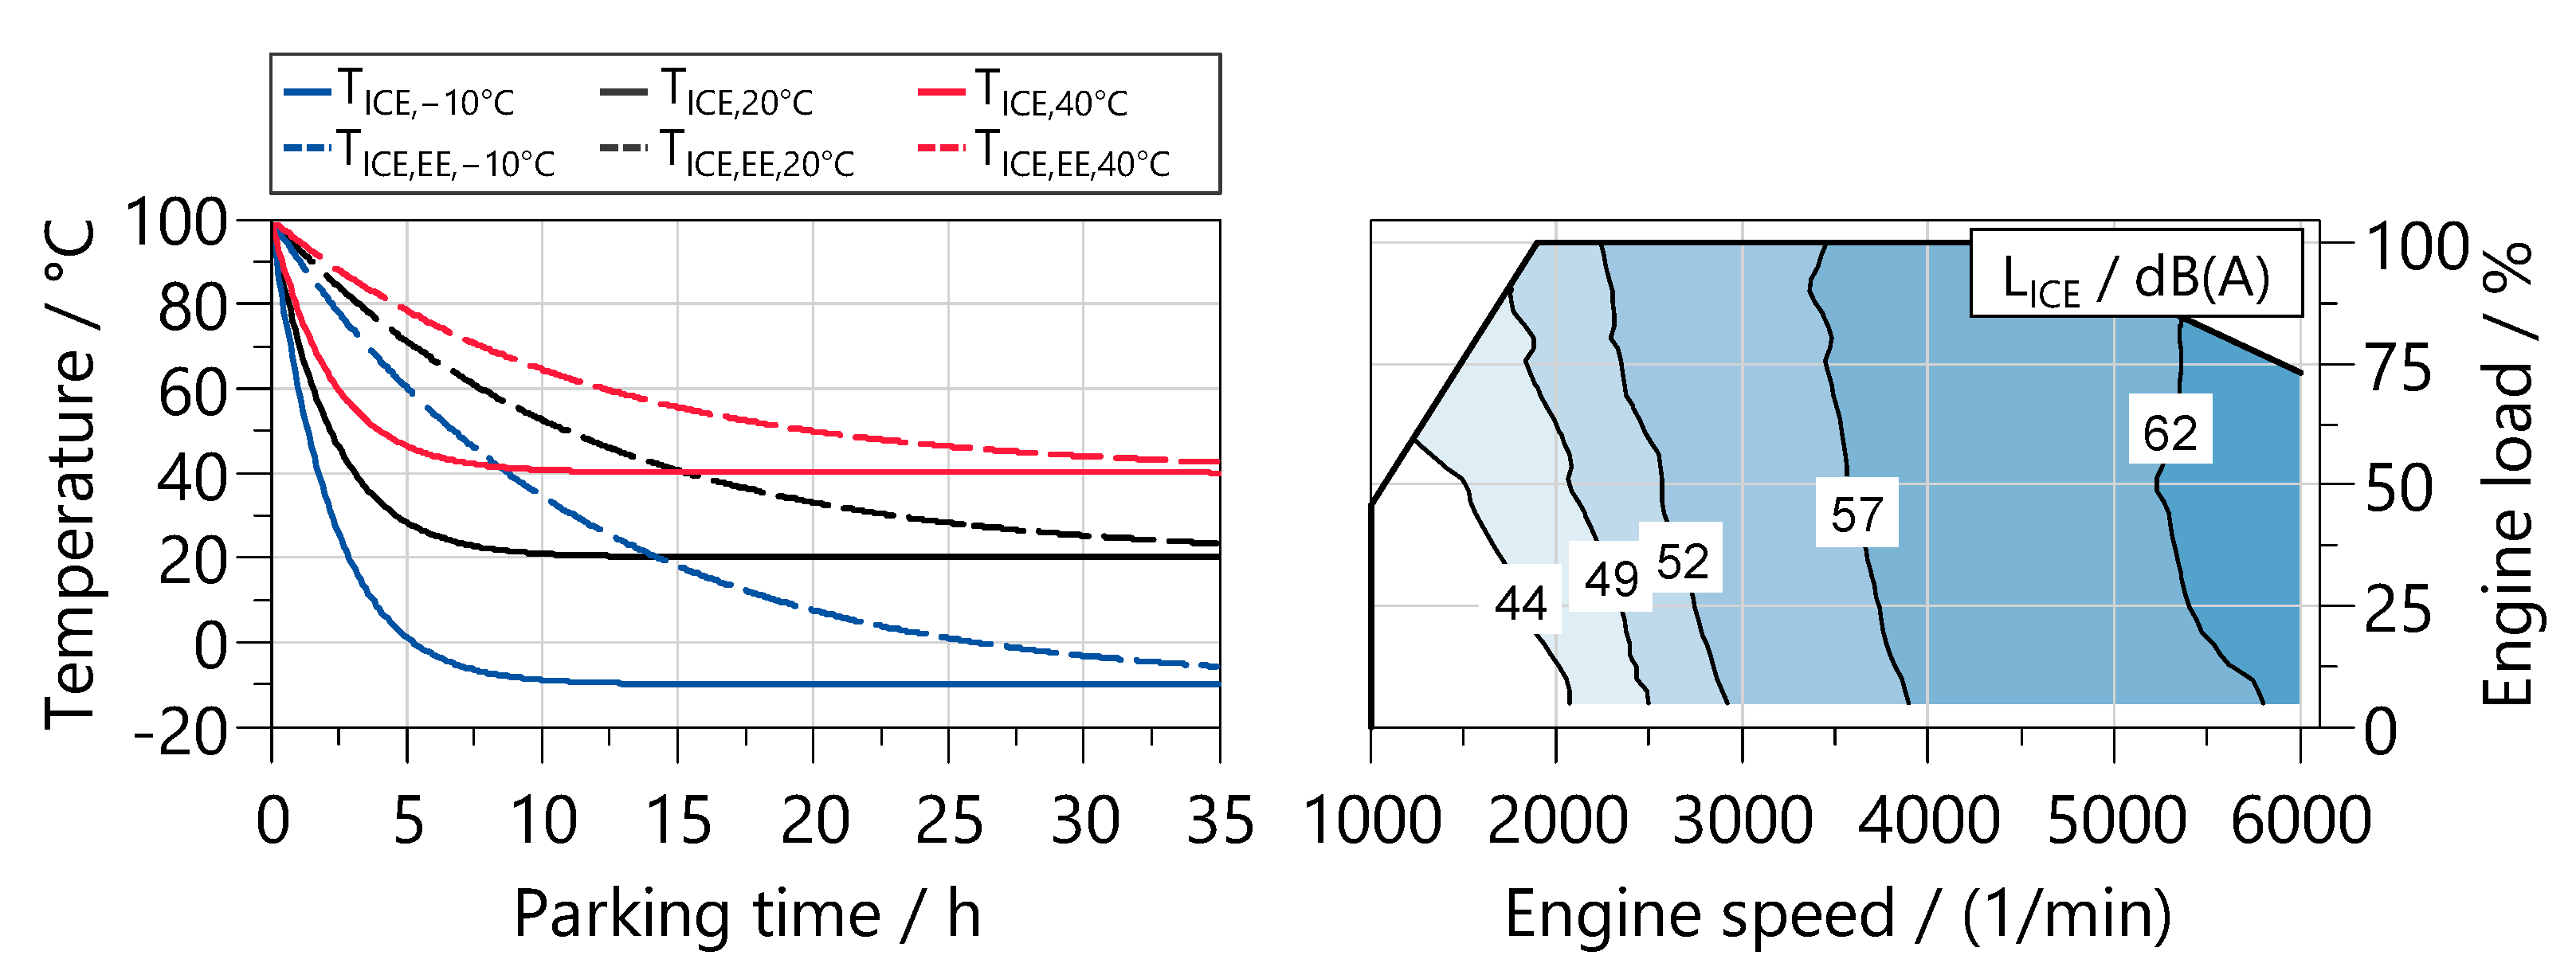
2.3.2. Thermal Modeling Approach

Limitations of propulsion systems can be caused by thermal constraints of the ICE, by the emission system, or by electrical components such as the HVB or EM. In addition, the interaction with the cabin climatization and passenger comfort must also be considered. Therefore, detailed thermal subsystems and determining their interactions are necessary for holistic powertrain and control strategy development [32,49,50]. Consequently, the vehicle model is coupled with advanced thermal management submodules based on a 1D–3D approach considering the powertrain’s components and its respective cooling systems. A physical-empirical calculation approach is used for the heat transfer calculations of the component structure, coolant, oil, and air. In addition, an FVV research project has investigated thermal cabin comfort based on the predicted mean vote (PMV) [34,51,52].
Compared to conventional powertrains, hybrid vehicles have additional low-temperature circuits due to the different optimum temperature levels of the electrical components. Lowering the fluid temperature while maintaining the same heat flow results in a lower component temperature. The schematic structure of the thermal management system is shown in Figure 5. The colors symbolize the different temperature levels of the high temperature circuit (HTC), low temperature circuits I and II (LTC), and the cooling circuit (RC). All cooling circuits have electric water pumps (see HTC, LTC I, and II) or an electric compressor (see RC) to regulate the heat flows on demand.
A variety of cooling approaches and media are available for the thermal management of individual components. Indirect cooling by means of a water jacket has proven successful for ICE as well as for electric powertrain components [53]. Therefore, water jacket cooling is used for the ICE, inverter, high-voltage battery (HVB), and electric motor (EM) in the baseline simulations. However, the trend towards more compact electric powertrain components with high power densities requires increasingly efficient cooling methods and higher cooling capacities. Direct cooling approaches are investigated in the technology assessment (see Section 5).

2.3.3. Emissions Modeling Approach

The emission modeling approach is based on [54] and has been continuously developed in the literature [9,41,55,56]. The raw emissions model includes stationary engine maps and empirical-physical correction functions for transient operating conditions. The thermal behaviors of the exhaust gas and the catalyst are represented by advanced thermal networks which allow the simulation of the local structure and gas temperatures. Based on that, the conversion efficiency of the catalyst can be calculated. Further corrections regarding the air–fuel ratio and the oxygen storage capacity are considered. A detailed description can be found in the above-mentioned publications.
Figure 6 shows the baseline setup of the exhaust aftertreatment system (EATS), which is designed to comply with the existing EU6 emissions standard. The basis for this is the ICE, which is operated by the Miller principle, with stochiometric operation (λ = 1) in the entire engine map. The EATS combines a close-coupled three-way catalyst and an uncoated underfloor gasoline particulate filter (GPF) of the first generation. In the new condition, the GPF has an average filtration efficiency of ηGPF = 70%, which is considered as the worst-case condition.

3. Results of the Most Challenging Real-World Driving Scenarios

The precise definition of the individual test cycles has a major influence on the development of a hybrid vehicle. In addition to the standardized test procedures, it is necessary to investigate real driving conditions, such as those in cold or hot countries. The selected scenarios cover a wide range of different requirements and, by using the tool chain, correspond to real route and gradient profiles as well as realistic speed profiles [34]. The following driving cycles are examined in this work:
  • Urban driving cycle (UDC) at low and high ambient temperatures [57];
  • Cross-country driving cycle (CCDC) at low and high ambient temperatures [57];
  • German highway driving cycle (GHDC) at moderate ambient temperatures [57];
  • Mountain driving cycle (MDC) at moderate ambient temperatures [57].
Since the first three driving cycles occur frequently in everyday life, they are particularly relevant to the design. Mountain driving, such as on the Großglockner High Alpine Pass [58], is rather rare but still important for the powertrain component layout. In addition to the climatic boundary conditions, such as the temperature, there are also other variation parameters such as the number of occupants, the traffic situation, the trailer load, and the battery charge level at the start of the trip. The weight of an additional passenger corresponds to the average weight (mPassenger = 76 kg) of the population in Germany [59]. This results in the test matrix in Table 2, which was simulated using the simulation model from Section 2. The vehicle control strategy is based on the target customer design for the WLTC. To identify the limitations, a statistical analysis is performed in Section 3.1.

3.1. Simulation Results of Real-World Driving Scenarios

3.1.1. Statistical Evaluation of Component Temperatures

In the following, the simulation results of the real driving scenarios are statistically evaluated and presented in box plots. First, the temperatures of the individual components are analyzed to identify the thermal influence on the drivetrain. Figure 7 shows the maximum temperatures of the HVB and the EM in the respective driving cycles. The power electronics do not exceed the maximum allowable temperature in any scenario and are not considered in the following analysis. In general, it should be noted that the median and the 25% or 75% quartile can be identical. This is especially true when driving in the pure electric operating mode.
The cells of the HVB as well as the windings and magnets of the EM only heat up slightly in the UDC at Tamb = −10 °C due to the reduced power availability [60,61] and the low vehicle power demand in the urban driving cycle. This means that all components remain within the permissible temperature range even at Tamb = 40 °C. In the CCDC, GHDC, and MDC, the HVB reaches higher temperatures due to self-heating by cell ohmic losses [62]. Demanding driving scenarios with a sporty driving style lead to a thermal derating of the HVB so that the maximum cell temperature of THVB,cell,max = 60 °C is not exceeded. Similarly, the maximum power of EM1 and EM2 is also limited by reaching critical temperature ranges. The magnet temperatures of EM1 have a wider range because, in the serial mode, different power outputs are required depending on the state-of-charge and the HVB temperature. At high EM speeds, the iron losses increase, resulting in higher magnet temperatures for EM1 than for EM2. As the EM2 can use the electrical energy of the battery and the generator (EM1) in the serial operating mode, the highest temperatures occur at the winding heads of EM2.

3.1.2. Statistical Evaluation of the Operating Modes

The resulting influences on the operating strategy are shown in Figure 8 based on the driving shares of the individual operating modes. In the UDC, due to the low vehicle speed, the vehicle is only operated in the electric and serial modes to increase the overall efficiency of the drive. The proportion of electric driving increases at higher ambient temperatures due to the higher battery power. The same trend can also be observed in OBVs. As the speed level on cross-country roads and highways increases, the proportion of driving in the parallel operating mode increases.
Due to the thermal derating of the HVB or EM during sporty driving and high traffic volumes in the CCDC at Tamb = 40 °C, the ICE is used for boosting, so that the minimum only changes slightly compared to Tamb = −10 °C. In the mountain driving cycle, the driving performance requirements increase due to the additional gradient. For this reason, the accelerations at low vehicle speeds are performed in the serial operating mode. Due to recuperation during downhill driving, the median proportion of electric driving is still over 50%. The effects of the large variance in component temperatures and driving modes on the individual target variables are explained in the following section.

3.1.3. Statistical Evaluation of CO2 and ICE Noise Emissions

The distribution of CO2 emissions on the left side of Figure 9 shows that the median for trips at high ambient temperatures is below the fleet limit value and the baseline reference due to the high proportion of electric trips (see Section 2: 109 gCO2/km). However, up to 421 gCO2/km are emitted on short trips in the UDC under demanding conditions, such as driving with a trailer, a fully loaded vehicle, and a sporty driving style. At low ambient temperatures, both the 25% quartile and the median are above the fleet limit. This is due to the higher proportion of parallel and series operation and the higher losses of the ICE. For the OBV, the median decreases at low ambient temperatures due to the longer driving distance compared to the UDC. At high ambient temperatures, the CO2 emissions are below the limit. Nevertheless, there is an increase compared to the UDC due to the higher performance requirements in the CCDC. In the CCDC, the engine speed is directly linked to the wheel speed at high speeds in parallel operation, which can lead to a less favorable operating point with higher engine friction and fuel consumption. In the MDC, the gradient leads to an additional increased power demand compared to the other driving cycles, so that the median is at a higher level.
Higher electric driving shares are also advantageous for low noise emissions (see right side of Figure 9), as high ICE speeds can be avoided. In contrast, the overruns are significantly higher at low ambient temperatures due to the low electrical battery power and the correspondingly decreased electrical driving share. In this case, the missing electrical power is usually provided in the serial operating mode, so that the noise emissions increase due to a high engine speed level at high driving performance requirements. Noise emissions in the GHDC are rather low at high vehicle speeds due to the sufficient masking noise, while in the MDC, high exceedances occur at lower vehicle speeds and higher power requirements.

3.1.4. Statistical Evaluation of Pollutant and Particulate Emissions

Figure 10 shows the statistical evaluation of the pollutant and particulate tailpipe emissions according to dEU7,Clove = 16 km. It should be noted that the distance of the urban driving cycle is only dUDC = 7.5 km. This means that longer distances can also lead to higher emissions. The emissions depend, among other things, on the combustion chamber wall temperature [49] and the catalyst temperature [63].
To initially minimize raw emissions during the TWC heating process, an ICE operating point with increased speed in the medium load range is suitable (cf. Section 5.1.1, Figure 11). When the battery state-of-charge is low, the TWC is preheated at the beginning of the driving cycle. If the driver has high performance requirements in heavy traffic with repeated hard accelerations, the engine may start unexpectedly even if the HVB is fully charged. This shifts the operating point to higher loads and possibly also to higher engine speeds, resulting in emission breakthrough if the TWC is not fully heated. This effect is reflected in the exceeding of the available emission budget in all driving cycles with cold ambient temperatures, as the HVB cannot be used for boosting.
In addition, low starting temperatures and high-load operating points lead to significantly higher particulate raw and tailpipe emissions. This is particularly evident in the MDC due to the high driving power in the serial operating mode. In addition to temperature, the filtration efficiency of the GPF (ηGPF,new = 70%) is crucial. Apart from the scenarios at Tamb = 40 °C, the 25% quartile of the remaining driving cycles already exceeds the available budget of PN = 1.6 × 10¹². Similar to the PN, the HC emissions also increase at low starting temperatures [64]. In addition, the control of the air–fuel ratio during catalyst heating has a major influence on the resulting raw emissions, so that scenario-specific modifications offer potential for optimizing tailpipe emissions.

3.1.5. Selection of Challenging Driving Scenarios

Statistical evaluation allowed the identification of powertrain limitations in real driving scenarios. The CCDC is suitable for demonstrating the optimization, as thermally relevant restrictions are caused by both poor heating behavior and the thermal derating of components at high ambient temperatures. These are much less severe in the UDC due to the lower driving performance requirements. The driving scenarios selected as examples are shown in Table 3. At cold ambient temperatures, low state-of-charge scenarios with a high traffic volume and dynamic driving behavior are particularly critical, as the ICE must provide the driving power for the EM. For high ambient temperatures, the focus is on high HVB charging levels, as the electric powertrain components are then subjected to high thermal loads.
Based on these elaborated limitations, with regard to several requirements in Real-World Driving Scenarios, in the following, the developed control and hardware measures are explained, aiming for a reduction in and optimization of these limitations. In detail, this comprises adjustments of the rule-based operating strategy, model predictive control (MPC) strategies, sophisticated hardware adaptations, and innovative technologies. Firstly, the technical background and algorithms are explained. Secondly, the results of the challenging scenarios including interdependencies and trade-offs are investigated.

4. Optimization-Based Control Approach

The investigated optimization-based control approach consists of two stages, the trip planning and the energy management stages [34]. The trip planning stage is used to provide an optimal target trajectory of the vehicle speed and the target state-of-charge (SoC) as inputs for the energy management. [65]. The energy management is referred to as predictive powertrain management (PPM) in the following.

4.1. Predictive Powertrain Management

The PPM was implemented in MATLAB/Simulink using a model predictive control approach. For the prediction trajectory, a horizon of 5 s was used for the vehicle velocity. The SoC trajectory was not considered in this work. Instead, a charge depletion charge sustaining (CS) strategy is pursued for this implementation, just how it is implemented in the deterministic approach that the PPM is compared to. Furthermore, a theoretical certification is possible. As part of the multi-objective optimization, the common objective of low CO2 is extended by the objective of positive NVH performance. This is done by the formulation of the cost function according to Equation (4):
J T o t a l = w Δ S O C   ·   J Δ S O C N H S   +   k = 0 N H S 1 w η S y s t e m   ·   J η S y s t e m k   +   w η I C E   ·   J η I C E k   +   w Δ N V H   ·   J Δ N V H k N H S +   k = 1 N H S 1 w Δ n I C E   ·   J Δ n I C E k   +   w Δ T I C E   ·   J Δ T I C E k   +   w Δ N V H   ·   J Δ N V H k N H S   +   1
where JTotal is the total cost for the entire horizon, JΔSOC, JηSystem, JηICE, JΔNVH, JΔnICE, and JΔT-ICE are the individual cost terms, and wΔSOC, wηSystem, wηICE, wΔNVH, wΔnICE, and wΔT-ICE are the corresponding weights. NHS is the number of horizon steps.
To evaluate the NVH criteria, the ICE interior noise was compared to the masking noise (cf. [34]). A genetic algorithm (GA) was used [66] as the optimization algorithm, and allowed the design of a flexible setup of the control, as well as parallelization and early termination, which can be beneficial for the computational time [67]. As mentioned above, the prediction horizon of thor = 5 s was used. This horizon was discretized by a step count of n = 10. This control parameterization was selected as a compromise between computational time on the one hand and result quality on the other hand. With this setup, a DoE approach was performed to estimate the optimal parameterization of the cost function weights. Fast-running reduced order models (ROMs) were built by using 0D map approaches for the battery, the combustion engine, and the electric machines. Due to the short prediction horizon and their thermal inertia, the component temperatures were simplified as constant. As a baseline comparison, the results of the rule-based (RB) energy management were compared to the PPM.

4.2. Results of Predictive Powertrain Management in Real-World Driving Scenarios

The comparison between the RB energy management and PPM was conducted in the UDC and CCDC real-world driving scenarios. Due to the low temperatures in the CCDC and the resulting low possible charge and discharge power rates, a thermally managed battery scenario is also considered. In addition to the CO2 and NVH behavior, the results of the NOx, CO, HC, and PN were evaluated. The RB results are used as a reference for each respective cycle and are shown in Table 4.
Overall, the MPC approach emitted fewer CO2 emissions compared to the rule-based strategy. Also, the total energy consumption in all three cycles is −1.6% in the UDC, −3.7% in the CCDC without thermal preconditioning of the battery, and −0.6% in the CCDC with thermal preconditioning of the battery. This is also explained by a system efficiency increase. In the UDC cycle, the CO2 emissions are −2.9% less, while the electrical consumption is +4.8% higher. This indicates that the use of electrical energy is favored more by the MPC in the case that the boundaries (UDC: high SOC) allow the usage of the battery in a wide operation range. This can also be derived from the comparison of the CCDCs. In the CCDC without thermal preconditioning, the increase in system efficiency is achieved through the choice of operating point in serial and parallel operation, whose time share increases by 3.6% and 1.4%, respectively; in the CCDC without thermal preconditioning of the battery, the efficiency gain is also achieved using electrical energy, which results in a delta SoC of −3.6%.
In terms of the reduction of the NVH exceedances a significant reduction can be detected in all three investigated cycles. While there is a reduction by −96% in the UDC, which is driven mostly in electric mode, the reductions in the CCDC cycles are −17.1% in case of low initial battery temperature and −29% in case of the CCDC with preconditioned battery compared to RB.
In UDC NOx (−14%), CO (−9.3%) and particle number (−64.3%) were reduced, while an increase of +25% can be seen for the HC emissions. For the CCDC with at least eight-times higher engine runtimes compared to the UDC, the NOX reductions are even more significant, with −28.4% and −31.5%, while the HC can be reduced by −5.8% and −2.9% and the particulate number by −12.3% and −7.7%. In the case of the cold battery cycle, the CO is reduced by −2.2%, and in the case of the preconditioned battery, the CO emission is marginally increased by 0.6%. Even though the emissions are mostly reduced by the MPC approach, neither pollutant emissions or particle emissions are optimization objectives of the current implementation. A more detailed analysis of emission reduction using MPC control approaches will be investigated in a following publication by the authors. However, in the significant NVH exceedance reduction, the potential of the multi-objective setup of the PPM is showcased.

5. Hardware Adjustments and Hardware Optimization

The simulation results indicate a significant discrepancy between standardized test procedures, such as the WLTC, and real-world driving conditions, particularly under extreme boundary conditions. To mitigate the adverse effects of personal transportation on various stakeholders, including drivers, the general population, and the environment, the following section examines technical solutions and deterministic control enhancements aimed at improving the performance of PHEVs.

5.1. Technical Measures and Rule-Based Controls Enhancement Approach

The investigated technologies are derived from an engineering assessment that evaluates the most challenging scenarios and aligns these with current development trends. This section first describes these technologies and their impacts on the propulsion system. The technologies were incorporated into the existing simulation model, which was used for the baseline simulations. Within the simulation study, technologies are individually analyzed for their potential to optimize the target parameters, see Section 5.2. Based on this, an initial technology assessment is performed, and appropriate packages are assembled, see Section 5.3. Finally, the technology packages are validated in the respective Real-World Driving Scenarios, see Section 5.4.

5.1.1. Engine Torque Limitation

An effective way to reduce cold start emissions is to limit the engine torque or engine power. This intervention in the engine control system is explained in Figure 11.
The maximum allowable engine power is limited until the TWC operating temperature is reached. Once the TWC has reached its light-off temperature in the range of approximately TTWC,LO = 350 °C, the maximum engine power can be released again. This may result in reduced drivability during heavy accelerations if the electrical system is unable to boost due to a low battery state-of-charge or thermal derating of the HVB. Depending on the application of the limitation, the impact on driving performance can range from barely noticeable restriction for the driver to significant.

5.1.2. Load Point Shifting

Another deterministic extension of the control strategy is load-point shifting (LPS) of the ICE. Notably, in the serial mode during the acceleration phases, LPS is well suited to reduce masking noise overshoots. The case example in Figure 12 shows the influence of two different LPS variants on the interior noise of the ICE and the resulting engine power.
LPS 1 shows the shift on the fuel-consumption-optimized curve, while LPS 2 shows a shift of the operating points on the full-load curve. Both variants reduce noise emissions but have different side effects on the battery state-of-charge, CO2, and pollutant emissions. In this case example, LPS 1 does not exceed the vehicle noise of 62 dB(A) (see green marked area in Figure 12). However, LPS1 is limited in power, which would require a shift into the red marked area for high vehicle power demands. Since only the operating strategy needs to be adjusted, this measure is cost neutral.

5.1.3. Coolant Heat Storage

When the ICE operating temperature has been reached, the coolant heat storage (CHS) stores hot coolant from the high-temperature cooling circuit (HTC). At the next vehicle start, the thermal energy in the CHS can be used for indirect heating of the ICE by convective heat transfer from the coolant to the combustion chamber walls. For thermal conditioning prior to engine start, an electric water pump in the HTC is required to pump high coolant flow rates of the CHS (VCHS = 5 L) through the engine water jackets for combustion chamber heating. A thermal simulation model, which considers the heat exchange with the environment, was used to analyze the cool-down behavior of the CHS in the parked state. The schematic structure of the model is shown in Figure 13 on the right with the characteristic values of the different insulation materials, air and polyurethane (PU). A heat transfer coefficient of αWWS,amb = 7 W/(m2K) is assumed for the convective heat transfer from the CHS to the environment. The simulation results on the left side of Figure 13 show the influence of different insulation layers on the cool-down of the coolant in the CHS at Tamb = −10 °C and Tamb = 40 °C.
According to [68], the average parking duration in Germany is tPark = 19 h/day. In this work, it is assumed that the vehicle is parked in the evening and used again the next morning, so that the flow temperatures are read for a parking period of tPark = 12 h. The HT incurs additional costs CHT = 56€ for the valves, pipes, and housing. Latent heat storage systems can additionally improve the cooling behavior and increase the amount of energy stored [69,70].

5.1.4. Engine Encapsulation

Underhood and underfloor insulation has long been state of the art for NVH reduction [3]. Engine encapsulation (EE) represents an extension which can be implemented as a system close to the engine (e.g., injector insulation) or as an engine-enclosing housing [71]. Röchling uses the composite material Al-Seeberlit for simultaneous thermal and engine noise insulation. The thermal and acoustic influence of the engine encapsulation was derived from vehicle measurements. The left side of Figure 14 shows the cool-down of the ICE at different ambient temperatures for the baseline variant and with EE during parking. The results at Tamb = 20 °C are from a measurement by Röchling and were used to calibrate a thermal model for the simulation of other ambient temperatures.
Analogous to the previous section, a parking duration of tPark = 12 h is also assumed for the definition of the coolant and oil temperatures. Röchling’s measurements also show that the interior noise of the ICE can be reduced by ΔLICE,EE = 10 dB(A) compared to the baseline (see right diagram in Figure 14) [72]. The additional costs amount to CEE = 70€ [73].

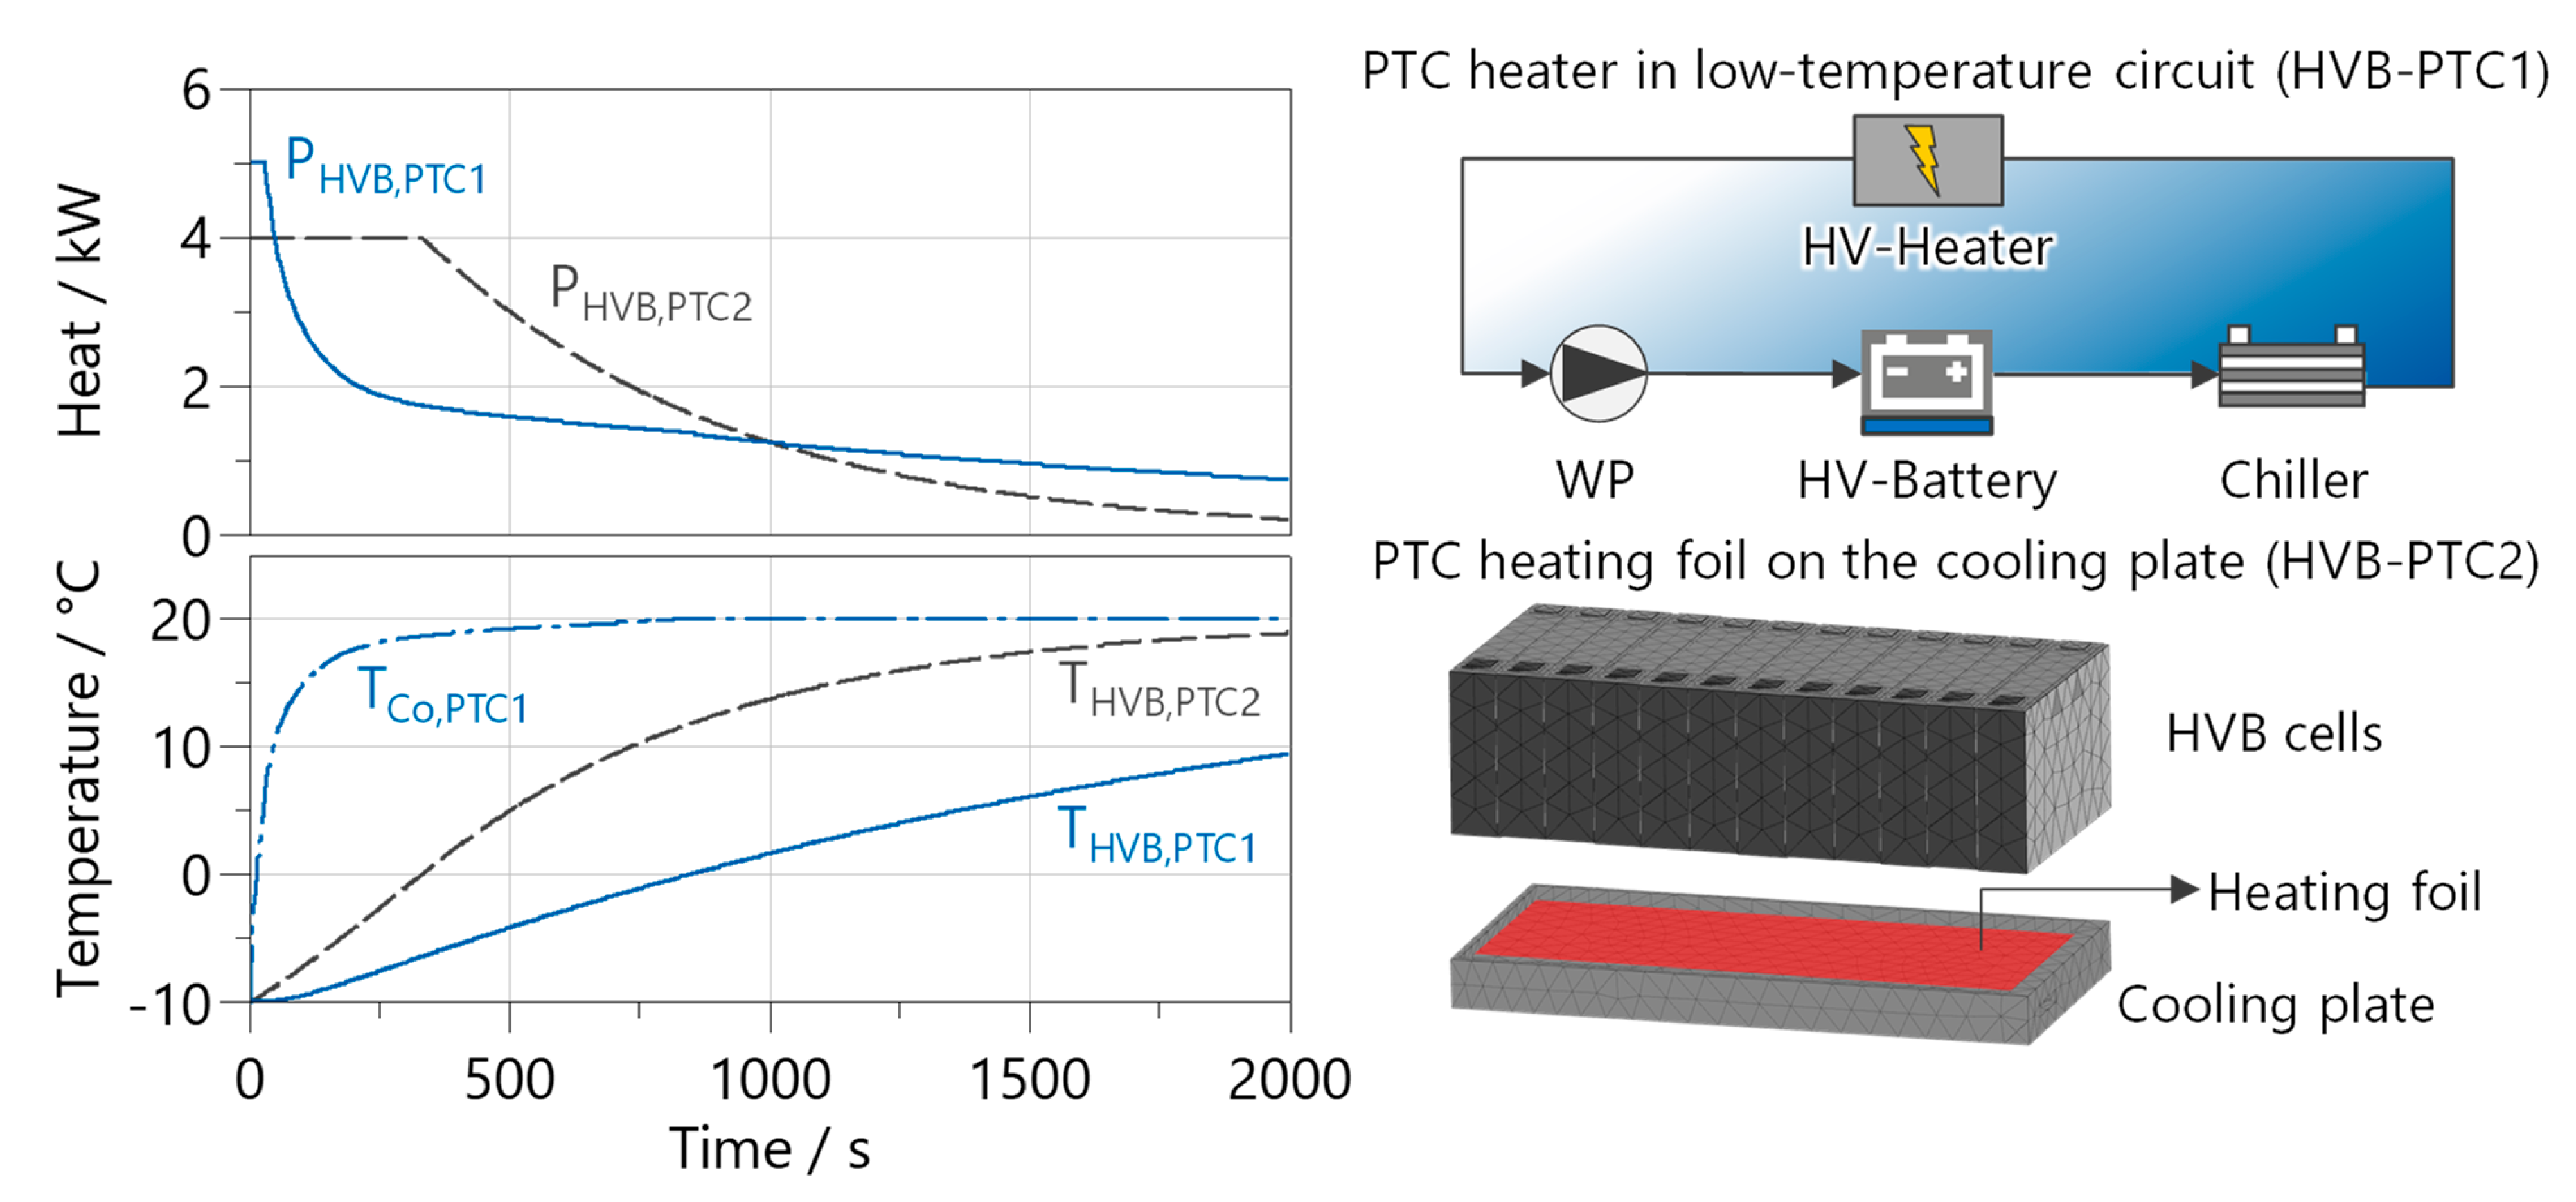
5.1.5. High-Voltage Battery Heater

To extend the application range of HVBs at low temperatures, there are several options for actively heating the cells. Some manufacturers take advantage of the poor cell efficiency at low temperatures to self-heat the cells (see GHDC and MDC driving scenarios at Tamb = 0 °C in Figure 7). However, for battery systems with high thermal inertia, this can require long heating times. For this reason, two technologies that generate heat via an electrical resistance, so-called PTC elements, are investigated. The heating performance is many times higher than that with self-heating of the cells. Indirect heating of the battery is possible with self-regulating PTC heating elements in the battery cooling circuit (see HV heater in Figure 15). When the electric water pump is activated, the heat from the PTC heater is dissipated convectively and transferred to the cells via the cooling plate. HV systems with heating capacities up to PHVB,PTC1 = 9 kW are available on the market [74].
The intelligent control considers a continuous reduction in heating power as the battery or coolant temperature rises. The HV heater is integrated into the simulation model of the cooling system and considers the thermal inertia and the additional hydraulic pressure loss. Costs of CHVB,PTC1 = 78€ are incurred for the PTC heater and the HV controller.
It is also possible to heat the cells directly. This is done by attaching a heating foil to the side or bottom of the cell. For ease of integration, the variant on the cooling plate or the underside of the cell is used here. Depending on the manufacturer, the heating elements enable a maximum heat flux of 20 kW/m2 < qHVB,PTC2,max < 350 kW/m2 [75,76,77]. As the battery power is limited during a cold start and excessive temperature differences within the cell must be avoided, the maximum heating power for the entire system is limited to PHVB,PTC2,max = 4 kW. This results in a heating power of PHVB,PTC2,cell = 41.7 W/cell for a single cell, corresponding to the number of cells NHVB,cell = 96. The costs of the heating foils and the controls are summarized as CHVB,PTC2 = 120€.
The diagram in Figure 15, on the left, shows the average cell temperature and heat dissipation over time for the two heating concepts. In the first concept, the coolant temperature initially rises sharply to allow heat transfer to the cells. After reaching TCo,HVB = 20 °C, the heating power is reduced to avoid wasting unnecessary energy on cooling later. Due to the lower thermal resistance, the cell heats up faster in the second concept. The power is adjusted according to the temperature difference within the cells. This results in higher electrical energy consumption for the second concept.

5.1.6. Exhaust Aftertreatment System Adaptions

An electrically heated catalyst (EHC) enables faster heating of the TWC, minimizing the drivability limitations associated with conventional TWC heating strategies. In combination with a secondary air pump (SAP), thermal conditioning is possible prior to engine start. Figure 16 shows a possible exhaust aftertreatment concept with SAP, EHC, and coated GPF. The current development trend promises filtration efficiencies of ηGPF,new > 90% in a new condition [78]. Despite the lack of thermal influence on the GPF filtration efficiency, this technology is helpful in reducing particulate emissions in cold regions.
For the the propulsion system in this study, a heating disk with a support catalyst and a preheating time of tEHC,VH = 30 s is implemented [79]. This ensures rapid conversion of the pollutant emissions due to the low thermal inertia of the support catalyst. Two heating disks can also be connected in series to increase the heating power (see Figure 16). The necessity of a 48 V on-board power supply requires at least an additional DCDC to achieve heating powers of PEHC,max = 4 kW per heating disk. This results in an additional cost of CEHC = 139€ for an EHC (4 kW) with SAP and a 48 V on-board power supply.

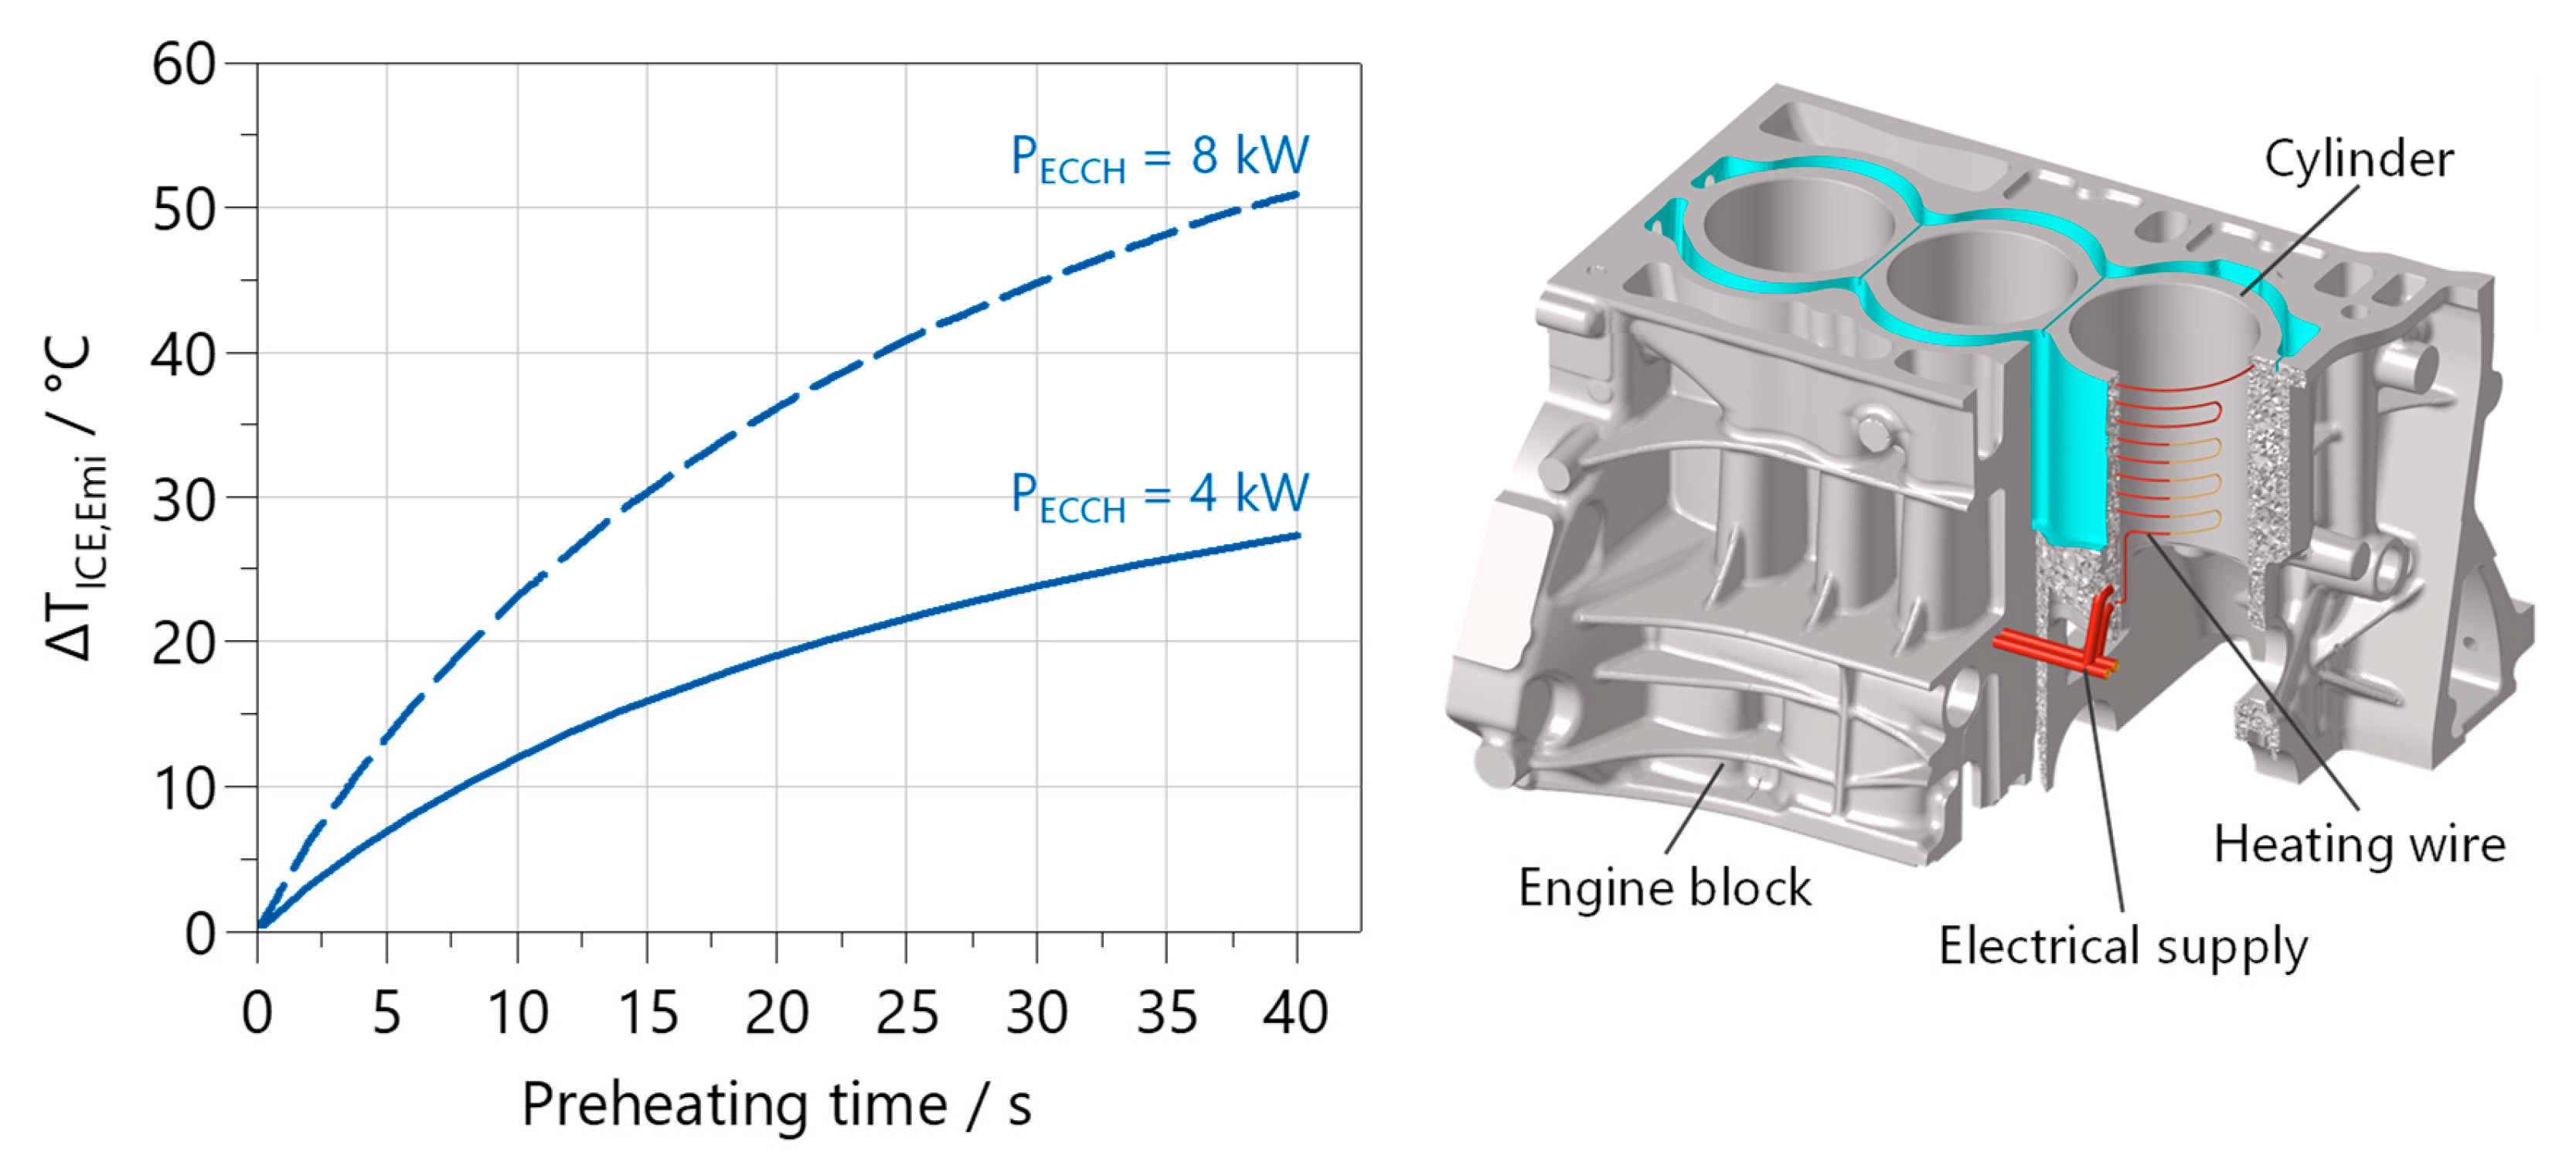
5.1.7. Electric Combustion Chamber Heater

The heat input through indirect heating measures such as the heat exchanger is limited by the heat transfer coefficient and the coolant temperature. Therefore, an electric combustion chamber heater (ECCH), in which heat is transferred directly from a heating wire to the liner, is investigated in this paper. Figure 17 shows the concept with cast-in round wire in the cylinder on the right.
Various concepts with different materials were investigated as part of a design phase. Detailed results will be published by the authors in the future with a focus on tailpipe emissions. The effects on the strength of the engine and the manufacturing process were not considered in this work. To analyze the heating behavior, the concept was implemented in the thermal simulation model of the ICE. The electrical equivalent model of the heating coils calculates the resulting heat as a function of the electrical resistance. For comparability with the EHC, the heating power is limited to PECCH,max = 8 kW.
The temperature differences for different preheating times and heating powers are shown in the diagram in Figure 17. The heating process can be accelerated by using higher heating powers. As with the EHC, a 48 V on-board power supply is used to minimize the cost of HV protection measures [80]. The cost for the integrated heater, 48 V system, and ECU function adaptations is estimated at CECCH = 125€.

5.1.8. EM and HVB Direct Cooling Approaches

The results of the real driving scenarios underline the limitations of indirect cooling approaches. To quantify the influence of direct cooling approaches, the existing jacket cooling of the electric motor (see Figure 5) is extended by oil spray cooling of the winding heads.
Figure 18 shows the concept on the right side. Direct cooling of the winding heads requires the use of a dielectric fluid, such as transmission oil, to prevent a short circuit. An oil pump supplies the distribution gallery and the cooling nozzles on top of the EM. Fundamental research by Bennion shows that the heat transfer coefficient (HTC) depends mainly on the flow velocity [81]. The oil temperature and the surface topology of the impact surface have only a minor influence and are not considered below. The left diagram in Figure 18 shows that the increase in HTC is degressive with an increasing flow velocity. In addition, under real conditions, not all surfaces of the winding head are reached directly by the cooling nozzles, so an HTC reduction is to be expected.
At low speeds, the proportion of wetted surfaces decreases further due to the lower centrifugal forces [82]. The energy consumption of the electric oil pump and the heat exchange of the oil with the low-temperature cooling circuit (see Figure 5) are considered in the simulation model. The cost of extending the EM cooling system for the additional components, such as the oil pump and oil cooler, is CEM,OC = 78€.
In battery systems, immersion cooling is used as a direct cooling method where the cells are in direct contact with the coolant. The concept used in this work is shown in Figure 19 on the right and uses a dielectric fluid analogous to EM direct cooling.
Heat is transferred through the side surfaces of the battery cells, increasing the heat flow significantly due to the surface area, which is more than five times larger than the bottom surface of the cell. Another advantage is the lower temperature gradient compared to the cooling plate in the baseline design, which can reduce aging effects. Deflections in the cooling channels are used to achieve a uniform heat transfer. The heat transfer coefficients were derived from CFD simulations and are shown in Figure 19 on the left. As expected, the heat transfer coefficient increases with an increasing volume flow. The change to immersion cooling is assumed to be cost neutral. The cost of integrating the cooling channels into the module housing is offset by the elimination of the cooling plate. Minor modifications to the existing cooling system result in costs of CHVB,IC = 30€.

5.1.9. Sodium-Ion Battery Technology

This study investigates sodium-ion (SiB) battery technology as a potential alternative to nickel–manganese–cobalt (NMC) cells. A key advantage of SiB battery technology lies in its significantly lower internal resistance at low temperatures compared to NMC cells. This translates to superior discharge capabilities at cold temperatures, as illustrated in Figure 20, which depicts the scaled maximum power achievable by a battery system employing SiB technology relative to a baseline NMC system. However, the implementation of SiB technology necessitates a significant revision of the existing hybrid control strategy. To fully exploit the potential of SiB technology, the control algorithms were specifically optimized for its unique characteristics. Derived from [83], the costs are estimated using fcost,SiB = 1.33 for a given battery size compared to NMC technology. In general, SiB battery technology exhibits a downward cost trend, with projections indicating a continued decrease in coming years. This cost reduction enhances the economic viability of SiB technology for diverse applications. A disadvantage is the additional mass of about madd,Bat,SiB = 80 kg compared to the base system, due to the low gravimetric energy density of wBat,SiB = 102 Wh/kg compared to wBat,NMC = 132 Wh/kg for the NMC cell technology [84].

5.2. Results and Conclusions for Single Technologies

Table 5 shows the results of the single hardware and control strategy adaptations in the selected real-world driving scenarios (see Section 3.1.5). The optimization potentials differ due to the different load profiles of the specific driving scenarios, but generally show the same tendencies. The effects are analyzed and explained using the results of the cross-country driving cycle in cold and hot conditions.
Limiting the maximum engine torque during the TWC heat-up phase reduces pollutant emissions. However, the HC limit is still not met due to the low starting temperature. The lower engine load slows down the engine warm-up, resulting in a slight increase in particulate emissions compared to the baseline. The driving time increases by only ΔtT,DB = 11 s, as the warm-up phase is a small part of the total trip. The impact on CO2 and noise emissions is correspondingly small.
By shifting the load point on the fuel consumption optimized curve (LPS1) to lower engine speeds and loads, the ICE completely prevents the masking noise from being exceeded. The disadvantage is an increase in the travel time by ΔtT,LPS1 = 211 s. The second variant (LPS2) shifts the operating point to the full load curve to continue to meet higher vehicle power requirements. This increases the driving time by only ΔtT,LPS2 = 17 s, but also reduces the NVH optimization potential. The higher CO emissions due to the higher engine load are a further drawback. Otherwise, all emissions can be reduced with both variants. However, this is accompanied by a lower SOC at the end of the trip, as less electrical energy is recharged into the HVB in series operation. Accordingly, this adaptation of the operating strategy must be suspended at a very low battery state-of-charge to avoid a complete discharge of the HVB.
The starting temperature of the engine with engine encapsulation (EE) is TICE,Start = 25 °C (see Figure 14). The fuel consumption is reduced due to lower engine friction and the earlier use of exhaust gas recirculation. In addition, the thermal energy of the coolant can be used for interior air conditioning, so that the electrical energy consumption of the auxiliary heater is reduced. Furthermore, particulate and HC emissions are reduced due to improved fuel mixture formation [64,85,86]. Since the heat storage must first transfer the thermal energy from the coolant to the combustion chamber and oil by convection, the potential is somewhat lower than with the EE. Pre-conditioning with the electric water pump can increase the potential of the heat storage.
The second-generation coated gasoline particulate filter enables significantly lower particulate emissions thanks to its higher filtration efficiency. The additional coating of the GPF makes it possible to reduce pollutant emissions without compromising the drivability, CO2, and noise emissions.
The use of battery heating increases the proportion of electric driving, which can reduce the CO2 and noise emissions of the ICE. In addition, the state-of-charge of the HVB increases at the end of the driving cycle, as the maximum charging power also increases due to the higher cell temperatures. The pollutant emissions decrease only slightly, as the HVB heating process is not yet completed during the cold start. The optimization potential of direct heating (variant 2) is higher, as the heating process can be carried out faster and the benefits of the higher battery power can be used earlier.
Without preheating, the electric heated catalyst shows only a slight improvement in pollutant emissions, with simultaneously higher CO2 emissions due to the electrical energy required. Pre-conditioning with the secondary air pump prior to the first engine start can significantly increase the potential to achieve the lowest pollutant emissions compared to the other technologies when using two heating disks. Compared to the EHC, the electric combustion chamber heating (ECCH) reduces HC and particulate emissions as soon as they are generated in the combustion chamber. The advantage is that the electrical energy can be partially compensated by reduced engine friction.
The SiB cell technology enables a strong reduction in tailpipe emissions due to reduced engine loads during the cold start and the catalyst heating phase. In addition, the increased battery power output can reduce the NVH emissions. A disadvantage is the increased CO2 emissions due to the increased battery system mass. This also results in longer travel times.
To quantify the influence of the HVB charging status and the driver type, the individual technologies are analyzed in the CCDC scenario ‘cold CCDC II.’ Only those technologies are considered that are also influenced by the above-mentioned variation parameters. The simulation results for defensive driving and a medium state-of-charge are shown in Table 6.
The high battery state-of-charge also increases the proportion of electric driving. In combination with the lower driving performance requirements due to the defensive driver, this leads to improved results for the target variables compared to the Cold CCDC I scenario. The potential for battery heating also increases as more electrical energy is available due to the higher state-of-charge.
In this scenario, the cold start of the ICE during the driving cycle leads to high raw emissions or to emission breakthrough in the cold TWC. Accordingly, pollutant emissions can be significantly reduced by using torque limitation, as in the previous scenario. In addition, a reduction in particulate emissions can also be observed here, underlining the high sensitivity of the boundary conditions to the results. A reduction in drivability can be avoided due to the higher battery charge level. This can also be seen from the slight increase in driving time (ΔtT,LPS1 = 8 s) for the first LPS variant.
The adaptation of the TWC heating strategy enables thermal preconditioning of the TWC directly at the beginning of the trip. This results in a significant reduction in pollutant emissions, as the TWC has already reached the light-off temperature when the engine starts unexpectedly. However, this is accompanied by an increase in CO2 emissions. Predictive control strategies offer a way to further optimize this interaction.
Thanks to the higher HVB state-of-charge, the SiB cell technology reaches its full optimization potential without an increase in travel time. A reduction in CO2 emissions is possible because more electrical energy is available to propel the vehicle. This also leads to a slight optimization of the NVH emissions. Except for the PN, an even higher reduction in tailpipe emissions is observed. The PN emissions increase due to non-optimal engine operating points, lower engine temperatures, and, thus, increased PN raw emissions.
In the previous chapter, the optimization measures for cold country driving scenarios were evaluated. This section analyzes individual technologies for the CCDC at Tamb = 40 °C. The focus is on the investigation of adjustments to the control-based operating strategy, as well as high-performance cooling methods to avoid thermal derating of the electrical components (HVB and EM). The results for the “hot country” CCDC scenario are shown in Table 7.
Similar to the Cold CCDC II scenario, unexpected engine starts, in this case triggered by thermal derating of the EM or HVB, lead to high tailpipe emissions. Therefore, as with torque limitation, an appropriate operating strategy adjustment is required to reduce fuel and particulate emissions. The first variant of the LPS also shows the same trend as the previous scenarios. The very low drivability restrictions of ΔtT,DB = 3 s and ΔtT,LPS1 = 4 s should be highlighted positively.
In this driving scenario, the HVB output power is thermally regulated so that direct cooling of the cells can reduce both CO2 and noise emissions. The reduction in pollutants is small, so the TWC heating strategy must be adjusted. In addition to the HVB, the EM also reaches limit temperatures, although the optimization potential of oil spray cooling as a single measure is low. A further reduction in CO2 emissions is possible by combining the two direct cooling methods.

5.3. Developed Technology Packages Based on Single Technology Evaluation

The previous analysis of the individual technologies shows that a combination of different technologies is necessary for an optimal overall vehicle design. Table 8 provides an overview of the selected technology packages and the associated total costs.
In addition to the legal requirements, the evaluation of these methods can also consider other constraints such as the manufacturer’s image, different customer segments, and the country of sale. The cost-neutral package aims to fulfill the minimum legal requirements. It is therefore suitable for low-end users (see target customer classification [87]), as only small additional costs are to be expected. According to Brokate et al. [88], the target customer defined here has a higher willingness to pay due to his social status and value orientation, which means that he is particularly open to new drive technologies. For this reason, the hot water tank, the electric heating disk with a secondary air pump, and the battery heating element (HVB-PTC 1) are also used in the cold country package. To avoid thermal shutdown of the electrical components, direct cooling of the battery and electric motor is part of the hot country package. Compared to the target customer, the willingness to pay increases again in the premium customer segment. This makes it possible to use the more expensive battery heater (HVB-PTC 2) and engine encapsulation. The SiB cell technology is not part of this package, due to its low benefit–cost ratio (delta costs of 2887€). Nevertheless, the use of SiB battery cells may be suitable for high-performance sports cars that do not allow any drivability restrictions.

5.4. Results and Conclusions for Technology Packages

The corresponding simulation results of the individual technology packages for the Cold CCDC I driving scenario are shown in Table 9. Together with an increase in travel time of ΔtT,CNP = 200 s, the cost-neutral package results in optimized CO2, noise, and pollutant emissions. Except for the HC emissions, the regulatory limits are met. It should be noted that no conformity factors for extended driving conditions, e.g., extreme ambient temperatures, were considered in this paper. In combination with the heat storage or engine encapsulation, the electric heating disk enables a further reduction in exhaust emissions. For the premium package, it should be emphasized that the torque limitation during cold starts can be reduced by a thermal preconditioning of the TWC. Furthermore, the additional use of the LPS leads to an optimization of the ICE operating range, whereby the drivability restrictions (see cost-neutral package) can be avoided by the battery heater.
Analogous to the results of the individual technologies, a higher optimization potential can be observed for the Cold CCDC II scenario due to the higher state-of-charge and the defensive driving style. The significant drivability restriction from the first scenario is only ΔtT,CNP = 6 s for the cost-neutral package. Otherwise, the packages show the same trend, as already explained for the Cold CCDC I scenario.
The results of the hot country driving scenario are shown in Table 10. The cost-neutral package shows a similar behavior to that in the Cold CCDC II scenario, as the ICE performance restriction can be compensated by the HVB if the state-of-charge is sufficiently high. Due to the already high starting temperatures of Tamb = 40 °C, all emissions are below the available budgets. A further improvement in CO2 emissions is possible through the combination of improved cooling and LPS compared to the consideration of individual technologies. The electric heating disk in the premium package is only activated when the engine is started for the first time. Preheating the TWC with a secondary air pump is only possible in this scenario if the engine start can be predicted. Although the pollutant emissions can be further reduced compared to the other packages, the general level was already very low beforehand. Therefore, it can be concluded that the benefit of the electric heating disk is not very high in hot regions.
In general, the methodology for virtually testing the real-world driving scenarios was successfully demonstrated in several scenarios for the combined hybrid and the described technical measures. The results indicate that the identified limitations can be mitigated by technical measures and controlled strategy adjustments. In general, the results show that a second generation GPF should always be used in the future to comply with emission limits, as the filtration efficiency increases significantly at the same cost. Concerning the other customer requirements, such as acoustic comfort, CO2, and pollutant emissions or drivability, a choice can be made between a cost-neutral adaptation of the operating strategy and the use of additional, cost-intensive technologies, depending on the target customer and sales market.
The flexibility of the hybrid powertrain has been optimized and adapted to the needs of the target customer. However, the optimization potential of technologies such as the hot water tank or the electric heated catalyst also depends on the preheating time. Without preheating, for example, the higher thermal inertia results in an emission disadvantage compared to the baseline exhaust aftertreatment system. Intelligent control strategies that, for example, initiate the heating process as soon as the vehicle is unlocked are therefore particularly important for these technologies. In addition, the use of predictive strategies for the thermal conditioning of the catalyst or the combustion engine makes sense when the ICE is switched on after a long electric drive.

6. Summary and Conclusions

To cope with the diversity of requirements in the automotive development landscape, a generic and holistic methodical systems engineering approach was developed in the FVV project HyFlex-ICE which can be used to derive a comprehensive catalog of requirements for vehicles. This methodology was demonstrated using the example of a combined plug-in hybrid powertrain. The detailed outcome of the requirement management and the test cases for the vehicle baseline design can be found in the final report of the research project [34]. Using these test cases and evaluation criteria, the baseline powertrain design and operating strategy were derived from the vehicle model developed using statistical test planning in terms of performance, efficiency, cost, and NVH.
The next step was to identify the limitations of the baseline design in real-world driving scenarios. Four real-world driving scenarios with different driving profiles and environmental conditions were derived. In addition, variation parameters such as load, air conditioning, traffic, battery charging state, and driver characteristics were considered. For the evaluation, detailed thermal management and emissions models were coupled with the vehicle model. From a thermal management perspective, driving scenarios with a sporty driving style, a high traffic volume, and extreme temperatures proved to be particularly challenging. In cold climates, a low battery and low engine start temperatures, as well as exhaust aftertreatment, resulted in exceeding the EU7 emission budget and high CO2 and noise emissions. At high ambient temperatures, the thermal control of electrical components resulted in undesired engine starts, which also led to a deterioration in target values. By identifying the thermal interactions and challenges, the first research question was answered.
Model predictive control (MPC) strategies coupled with advanced hardware adaptations were investigated to optimize and mitigate previously identified limitations. This approach successfully addressed research question two.
The MPC-based energy management system (EMS) offers an adaptable methodology for extending operational targets with minimal computational overhead, enabling the flexible integration of additional considerations. While data-driven prediction is currently envisioned as a prerequisite, the system has been demonstrably effective in multi-criteria optimization for at least two objectives. Beyond reductions in CO2 emissions and NVH, the MPC strategy achieved significant reductions in total energy consumption and pollutant emissions through operating mode adjustments.
These findings are generally extensible to non-design cycles. However, optimal performance was observed when the MPC operated in an unconstrained (“free oscillating”) state. When transitioning to a physical vehicle, the driver influence becomes a significant and inherently unpredictable disturbance factor. We posit that the combination of predictive operating strategies with automated driving holds promise for achieving synergistic effects.
For further optimization, adjustments to the rule-based operating strategy and additional technologies were first examined individually. The results showed significant improvements, but it was not possible to optimize all target variables simultaneously. As a result, four technology packages were defined for different target customers and markets. The Cost-neutral package makes it possible to meet all legal requirements simply by adjusting the operating strategy and using a latest-generation gasoline particulate filter. The Cold country package accelerates the warm-up of key powertrain components such as the HV battery, combustion engine, and catalyst. The Hot country package includes direct cooling for the electric motor and the HV battery to prevent thermal derating of these components through optimized cooling. The Premium package combines the technologies of the Cold and Hot country packages. Instead of the coolant heat storage, the more expensive engine encapsulation is suitable, as CO2, pollutant, and noise emissions can be optimized equally at a slightly higher cost.
This study presents a holistic methodology for optimal powertrain system design during the earliest development stages. This framework serves as a blueprint for future powertrain development, enabling the early identification and mitigation of limitations encountered in real-world driving scenarios.
The methodology incorporates a novel approach for elaborating limitations arising from real-world driving scenarios, as successfully demonstrated for the combined hybrid powertrain. This approach revealed discrepancies between standardized test procedures (e.g., WLTC) and real-world driving behavior, particularly under extreme operating conditions. Importantly, the methodology facilitates the development of universally applicable solutions through the implementation of targeted technical measures and control system adjustments. These solutions effectively address and mitigate the identified limitations, ultimately enhancing the flexibility of the hybrid powertrain and tailoring its performance to meet specific customer demands.

Author Contributions

Conceptualization, J.K. and J.M.; methodology, J.K. and J.M.; software, J.K., J.M., F.H. and P.H.; validation, J.K., J.M., F.H. and P.H.; formal analysis, J.K.; investigation, J.K., J.M., F.H. and P.H.; resources, M.G. and S.P.; data curation, J.M.; writing—original draft preparation, J.K., J.M. and F.H.; writing—review and editing, M.G. and S.P.; visualization, J.K., J.M., F.H. and P.H.; supervision, S.P.; project administration, M.G.; funding acquisition, M.G. and S.P. All authors have read and agreed to the published version of the manuscript.

Funding

Parts of this research were funded by FVV eV, project number 1433 “Highly-flexible internal combustion engines for hybrid vehicles” (HyFlex-ICE).

Data Availability Statement

Most relevant data generated or analyzed during this study are included in this published article. Additional data are partly available on request from the corresponding author with the permission of the FVV eV and their members.

Acknowledgments

We thank Martin Nitsche (FVV eV) and Marc Sens (IAV GmbH) as well as the FVV working group for the useful discussions, ideas, and support while conducting the corresponding research project.

Conflicts of Interest

The authors declare no conflicts of interest.

References

  1. Gottorf, S.; Fryjan, J.; Leyens, L.; Picerno, M.; Habermann, K.; Pischinger, S. Lean Approach for Virtual Calibration Using Hardware-in-the-Loop and Electronic Control Unit (ECU)-Capable Engine Simulation. SAE Int. J. Engines 2021, 14, 531–542. [Google Scholar] [CrossRef]
  2. Andert, J.; Xia, F.; Klein, S.; Savelsberg, R.; Guse, D.; Tharmakulasingam, R.; Thewes, M.; Scharf, J. Road-to-Rig-to-Desktop—Virtual Development Using Real-Time Engine Modeling and Powertrain-Co-Simulation. COMODIA 2017, 2017, A108. [Google Scholar] [CrossRef]
  3. Pischinger, S.; Seiffert, U. Vieweg Handbuch Kraftfahrzeugtechnik; Springer Fachmedien Wiesbaden: Wiesbaden, Germany, 2021; ISBN 978-3-658-25556-5. [Google Scholar]
  4. Schäfer, S. Modellbasierte Steuerung des Kühlkreislaufes einer Brennstoffzelle mit Automatisiertem Test der Software; VDI-Verlag: Düsseldorf, Germany, 2012. [Google Scholar]
  5. Platner, S.; Kordon, M.; Fakiolas, E.; Atzler, H. Modellbasierte Serien-kalibrierung—Der effiziente Weg für Variantenentwicklung. MTZ Mot. Z. 2013, 74, 754–761. [Google Scholar] [CrossRef]
  6. Basshuysen, R.; Schäfer, F. Handbuch Verbrennungsmotor: Grundlagen, Komponenten, Systeme, Perspektiven, 8th ed.; Springer Vieweg: Wiesbaden, Germany, 2017; ISBN 978-3-658-10902-8. [Google Scholar]
  7. Seibel, J. Optimierte Auslegung von Ottomotoren in Hybrid-Antriebsträngen. Ph.D. Thesis, RWTH Aachen University, Aachen, Germany, 2008. [Google Scholar]
  8. Balazs, A. Optimierte Auslegung von Ottomotorischen Hybridantriebssträngen unter Realen Fahrbedingungen. Ph.D. Thesis, RWTH Aachen University, Aachen, Germany, 2015. [Google Scholar]
  9. Böhmer, M. Simulation der Abgasemissionen von Hybridfahrzeugen für Reale Fahrbedingungen. Ph.D. Thesis, RWTH Aachen University, Aachen, Germany, 2017. [Google Scholar]
  10. Ao, G.-Q.; Qiang, J.-X.; Zhong, H.; Mao, X.-J.; Yang, L.; Zhuo, B. Fuel economy and NO x emission potential investigation and trade-off of a hybrid electric vehicle based on dynamic programming. Proc. Inst. Mech. Eng. Part D J. Automob. Eng. 2008, 222, 1851–1864. [Google Scholar] [CrossRef]
  11. Chen, Z.; Mi, C.C. An adaptive online energy management controller for power-split HEV based on Dynamic Programming and fuzzy logic. In Proceedings of the VPPC ’09, 2009 IEEE Vehicle Power and Propulsion Conference (VPPC), Dearborn, MI, USA, 7–10 September 2009; IEEE: Piscataway, NJ, USA, 2009; pp. 335–339, ISBN 978-1-4244-2600-3. [Google Scholar]
  12. Dextreit, C.; Assadian, F.; Kolmanovsky, I.V.; Mahtani, J.; Burnham, K. Hybrid Electric Vehicle Energy Management Using Game Theory. In Proceedings of the SAE Technical Paper Series, SAE World Congress & Exhibition, SAE International400 Commonwealth Drive, Warrendale, PA, USA, 14 April 2008. [Google Scholar]
  13. Jeon, S.; Jo, S.; Park, Y.; Lee, J. Multi-Mode Driving Control of a Parallel Hybrid Electric Vehicle Using Driving Pattern Recognition. J. Dyn. Syst. Meas. Control 2002, 124, 141–149. [Google Scholar] [CrossRef]
  14. Danzer, C.; Voigt, T.; Forell, A.; Schreiterer, E.; Kockisch, R.; Sens, M.; Schneider, E. System simulation and visualization of powertrain and mobility concepts. In Experten-Forum Powertrain: Simulation und Test 2020; Springer Vieweg: Berlin/Heidelberg, Germany, 2021; pp. 1–15. [Google Scholar]
  15. Teuschl, G.; Ebner, P.; Huss, A.; de Kerpel, N. Simulationsgestütze systemische Entwicklung hybrider Antriebssysteme. MTZ Mot. Z. 2021, 82, 78–83. [Google Scholar] [CrossRef]
  16. Häußler, L. Generisches Fahrzeug Energiemanagement. Ph.D. Thesis, RWTH Aachen University, Aachen, Germany, 2021. [Google Scholar]
  17. Weiß, F. Optimale Konzeptauslegung elektrifizierter Fahrzeugantriebsstränge. Ph.D. Thesis, Technische Universität Chemnitz, Chemnitz, Germany, 2017. [Google Scholar] [CrossRef]
  18. Maurer, R.; Kossioris, T.; Sterlepper, S.; Günther, M.; Pischinger, S. Zero-Impact Tailpipe Emission Powertrains: Identify Technical Solutions to Achieve Powertrains with Zero-Impact Tailpipe Emissions under Consideration of a 2030+ Legislative Vehicle and Air Pollutant Scenario; Final Report 1338; FVV e.V.: Frankfurt am Main, Germany, 2023. [Google Scholar]
  19. Pischinger, S.; Genender, P.; Klopstein, S.; Hemkemeyer, D. Aufgaben beim Thermomanagement von Hybrid- und Elektrofahrzeugen. ATZ Automob. Z. 2014, 116, 54–59. [Google Scholar] [CrossRef]
  20. Uhlmann, T.; Balazs, A.; Lückmann, D.; Müller, A.; Thewes, M.; Sahr, C.; Pischinger, J.; Hellenbroich, G.; Herold, K.L.; Lüdiger, T. High Efficient Gasoline HEV Meeting 2030 CO2 Targets—The Road towards 59 g/km Fleet CO2. In Proceedings of the 29th Aachen Colloquium Sustainable Mobility, Aachen, Germany, 5–7 October 2020; Aachener Kolloquium Fahrzeug- und Motorentechnik GbR: Aachen, Germany, 2020. ISBN 978-3-00-064871-7. [Google Scholar]
  21. Eichlseder, W.; Hager, J.; Raup, M.; Dietz, S. Auslegung von Kuehlsystemen Mittels Simulationsrechnung. Automob. Z. 1997, 99, 638–647. [Google Scholar]
  22. Knauf, B.; Pantow, E. Auslegung eines Kühlsystems mit elektrischer Kühlmittelpumpe. MTZ Mot. Z. 2005, 66, 878–884. [Google Scholar] [CrossRef]
  23. Eilemann, A. Thermomanagement—Eine Systemaufgabe. ATZ Automob. Z. 2015, 117, 86. [Google Scholar] [CrossRef]
  24. Banjac, T.; Wurzenberger, J.C.; Katrašnik, T. Assessment of engine thermal management through advanced system engineering modeling. Adv. Eng. Softw. 2014, 71, 19–33. [Google Scholar] [CrossRef]
  25. Setlur, P.; Wagner, J.R.; Dawson, D.M.; Marotta, E. An Advanced Engine Thermal Management System: Nonlinear Control and Test. IEEE/ASME Trans. Mechatron. 2005, 10, 210–220. [Google Scholar] [CrossRef]
  26. Lu, L.; Chen, H.; Hu, Y.; Gong, X.; Zhao, Z. Modeling and Optimization Control for an Engine Electrified Cooling System to Minimize Fuel Consumption. IEEE Access 2019, 7, 72914–72927. [Google Scholar] [CrossRef]
  27. Weiss, M.; Tuncay, V.; Richter, S.; Broz, J. Umfassende Simulation und vernetzte Intelligenz im Thermomanagement. MTZ Mot. Z. 2017, 78, 42–49. [Google Scholar] [CrossRef]
  28. Kang, H.; Ahn, H.; Min, K. Smart cooling system of the double loop coolant structure with engine thermal management modeling. Appl. Therm. Eng. 2015, 79, 124–131. [Google Scholar] [CrossRef]
  29. Appel, N.; Brinker, M.; Soetje, H.; Müller, T. Aktives Antriebsstrang-Thermomanagement beim Opel Insignia. MTZ Mot. Z. 2020, 81, 60–65. [Google Scholar] [CrossRef]
  30. Beste, F. Thermisch-Elektrische Analyse und Ableitung von Verbesserungsmaßnahmen für den Elektrischen Antrieb eines Plug-In-Hybridfahrzeugs, 1st ed.; Cuvillier Verlag: Göttingen, Germany, 2016; ISBN 9783736983021. [Google Scholar]
  31. Shutty, J.; Bongards, A.; Kondipati, N.; Ristevski, S. Thermomanagement bei elektrifizierten Antriebssystemen. ATZ Automob. Z. 2022, 124, 38–43. [Google Scholar] [CrossRef]
  32. Müller, J.; Maurer, R.; Achenbach, J.; Balazs, A.; Knauf, J. Antriebsstrangoptimierung von Hybridsystemen unter Berücksichtigung thermischer Einzelkomponentenwirkungsgrade. In Experten-Forum Powertrain: Reibung in Antrieb und Fahrzeug 2020; Liebl, J., Ed.; Springer Vieweg: Berlin/Heidelberg, Germany, 2020; pp. 179–201. [Google Scholar]
  33. Ernstberger, U.; Weissinger, J.; Frank, J. (Eds.) Mercedes-Benz SL: Entwicklung und Technik; Springer Fachmedien Wiesbaden: Wiesbaden, Germany, 2013; ISBN 978-3-658-00799-7. [Google Scholar]
  34. Kexel, J.; Müller, J. HyFlex-ICE: Highly Flexible Internal Combustion Engines for Hybrid Vehicles; Final Report 1338; FVV: Frankfurt am Main, Germany, 2023. [Google Scholar]
  35. Hick, H.; Küpper, K.; Sorger, H. Systems Engineering for Automotive Powertrain Development, 1st ed.; Springer International Publishing: Cham, Switzerland, 2021; ISBN 978-3-319-99628-8. [Google Scholar]
  36. Kexel, J.; Müller, J.; Günther, M.; Pischinger, S. HyFlex-ICE: Highly Flexible Internal Combustion Engines for Hybrid Vehicles. In Proceedings of the International Stuttgart Symposium, Stuttgart, Germany, 4–5 July 2023; Kulzer, A.-C., Reuss, H.-C., Wagner, A., Eds.; Springer Vieweg: Wiesbaden, Germany, 2023; pp. 243–272. [Google Scholar]
  37. Maiterth, J.M. Gesamtkosten- und Emissionsoptimierte Systemauslegung von Nutzfahrzeug-Hybridantriebssträngen. Ph.D. Thesis, RWTH Aachen University, Aachen, Germany, 2022. [Google Scholar]
  38. Granrath, C.; Kugler, C.; Silberg, S.; Meyer, M.-A.; Orth, P.; Richenhagen, J.; Andert, J. Feature-driven systems engineering procedure for standardized product-line development. Syst. Eng. 2021, 24, 456–479. [Google Scholar] [CrossRef]
  39. Gräßler, I.; Oleff, C. Systems Engineering: Verstehen und Industriell Umsetzen; Springer Vieweg: Berlin, Germany, 2022. [Google Scholar]
  40. Werra, M.; Sturm, A.; Küçükay, F. Optimal and prototype dimensioning of 48V P0+P4 hybrid drivetrains. Automot. Engine Technol. 2020, 5, 173–186. [Google Scholar] [CrossRef]
  41. Maurer, R.; Kossioris, T.; Sterlepper, S.; Günther, M.; Pischinger, S. Achieving Zero-Impact Emissions with a Gasoline Passenger Car. Atmosphere 2023, 14, 313. [Google Scholar] [CrossRef]
  42. Balazs, A. Untersuchung zur Optimierten Auslegung von Abschlussbericht Hybridantriebsträngen unter Realen Fahrbedingungen (F1011); FVV-Informationstagung: Frankfurt am Main, Germany, 2013. [Google Scholar]
  43. Seibel, J.; Pischinger, S. Abschlussbericht zum Vorhaben Untersuchung zur Optimierten Auslegung von Ottomotoren in Hybrid-Antriebsträngen (F863); Informationstagung Motoren, Heft R 537; FVV: Frankfurt am Main, Germany, 2007. [Google Scholar]
  44. Vaillant, M. Design Space Exploration zur Multikriteriellen Optimierung Elektrischer Sportwagenantriebsstränge; KIT Scientific Publishing: Karlsruhe, Germany, 2015; ISBN 978-3-7315-0452-8. [Google Scholar]
  45. Siebertz, K.; van Bebber, D.; Hochkirchen, T. Statistische Versuchsplanung; Springer: Berlin/Heidelberg, Germany, 2017; ISBN 978-3-662-55742-6. [Google Scholar]
  46. FEV Software and Testing Solutions. Doe Software with Global Map Optimization Gaussian Process Model. 2022. Available online: https://www.fev-sts.com/fileadmin/user_upload/STS/Brochure-Catalog_2022/FEV-STS_Brochure_xCAL_2022.pdf (accessed on 9 November 2022).
  47. Fröhlingsdorf, K.; Doleschal, F. Final Report: Characteristics for Quantifying the Annoyance of Interference Noise in the Compartment of Vehicles with an Electric Drive System (Interference Noise in the Vehicle Compartment with Electrified Drives), FVV 1369; FVV Transfer + Networking Event R603; FVV: Würzburg, Germany, 2022. [Google Scholar]
  48. Fröhlingsdorf, K.; Doleschal, F. Interference Noise in the Vehicle Compartment with Electrified Drives: Characteristics for Quantifying the Annoyance of Interference Noise in the Compartment of Vehicles with an Electric Drive System; Final Report 1327; FVV: Frankfurt am Main, Germany, 2023. [Google Scholar]
  49. Müller, J.; Besser, N.; Hermsen, P.; Pischinger, S.; Knauf, J.; Bagherzade, P.; Fryjan, J.; Balazs, A.; Gottorf, S. Virtual Development of Advanced Thermal Management Functions Using Model-in-the-Loop Applications. Energies 2023, 16, 3238. [Google Scholar] [CrossRef]
  50. Müller, J.; Balazs, A.; Knauf, J.; Gottorf, S.; Besser, N.; Fryjan, J. Advanced Thermal Management Models for X-in-the-Loop Applications—A Gamechanger for Control Unit Function Development; SAE Thermal Management Systems; SAE: Warrendale, PA, USA, 2021. [Google Scholar]
  51. Fanger, P.O. Thermal Comfort: Analysis and Applications in Environmental Engineering; Reprint; Krieger: Malabar, FL, USA, 1982; ISBN 0898744466. [Google Scholar]
  52. ASHRAE. ANSI/ASHRAE Addendum d to ANSI/ASHRAE Standard 55-2017: Thermal Environmental Conditions for Human Occupancy; ASHRAE: Peachtree Corners, GA, USA, 2017. [Google Scholar]
  53. Karrar, E. Untersuchungen zum Reibungsverhalten und Ölverbrauch der Kolbengruppe von Verbrennungsmotoren: Lehrstuhl für Verbrennungskraftmaschinen und Institut für Thermodynamik. Ph.D. Thesis, RWTH Aachen, Aachen, Germany, 2009. [Google Scholar]
  54. Baumgarten, H.; Scharf, J.; Thewes, M.; Uhlmann, T.; Balazs, A.; Böhmer, M. Simulation-Based Development Methodology for Future Emission Legislation. In Proceedings of the 37th International Vienna Motor Symposium, Vienna, Austria, 28–29 April 2016; Lenz, H.P., Ed.; Fortschritt-Berichte VDI: Düsseldorf, Germany, 2016. ISBN 978-3-18-379912-1. [Google Scholar]
  55. Maurer, R.; Yadla, S.K.; Balazs, A.; Thewes, M.; Walter, V.; Uhlmann, T. Designing Zero Impact Emission Vehicle Concepts. In Experten-Forum Powertrain: Reibung in Antrieb und Fahrzeug; Liebl, J., Ed.; Springer Vieweg: Berlin/Heidelberg, Germany, 2020; pp. 75–116. [Google Scholar]
  56. Thewes, M.; Balazs, A.; Yadla, S.K.; Walter, V.; Görgen, M.; Scharf, J.; Sterlepper, S.; Voßhall, T. Zero-Impact combustion engine. In Proceedings of the 28th Aachen Colloquium Sustainable Mobility, Aachen, Germany, 7–9 October 2019; Aachener Kolloquium Fahrzeug- und Motorentechnik GbR: Aachen, Germany, 2019. ISBN 978-3-00-060311-2. [Google Scholar]
  57. Kexel, J.; Müller, J.; Günther, M.; Pischinger, S. Real-World Driving Scenarios for Optimal System Design. Mendeley Data, 2024. [Google Scholar] [CrossRef]
  58. Schyr, C.; Spreitzer, H. Digitaler Streckenatlas für die alpine Antriebsstrangerprobung. Automot. Eng. Partn. 2004, 1, 44–47. [Google Scholar]
  59. Gesundheitsberichterstattung des Bundes. Körpermaße der Bevölkerung. Available online: https://www.gbe-bund.de/gbe/pkg_isgbe5.prc_menu_olap?p_uid=gast&p_aid=47463195&p_sprache=D&p_help=0&p_indnr=223&p_indsp=&p_ityp=H&p_fid= (accessed on 18 October 2023).
  60. Hopp. Thermomanagement von Hochleistungsfahrzeug-Traktionsbatterien anhand Gekoppelter Simulationsmodelle; Springer Fachmedien Wiesbaden: Wiesbaden, Germany, 2016; ISBN 978-3-658-14246-9. [Google Scholar]
  61. Korthauer, R. (Ed.) Handbuch Lithium-Ionen-Batterien; Springer: Berlin/Heidelberg, Germany, 2013; ISBN 978-3-642-30653-2. [Google Scholar]
  62. Küpfmüller, K.; Kohn, G. Theoretische Elektrotechnik und Elektronik: Eine Einführung, 15th ed.; Springer: Berlin/Heidelberg, Germany, 2000; ISBN 978-3-540-67794-9. [Google Scholar]
  63. Reif, K. Ottomotor-Management: Steuerung, Regelung und Überwachung, 4th ed.; Springer Vieweg: Wiesbaden, Germany, 2014; ISBN 978-3-8348-1416-6. [Google Scholar]
  64. Etikyala, S.; Dahlander, P. Soot Sources in Warm-Up Conditions in a GDI Engine. SAE Technical Paper 2021-01-0622. 2021. Available online: https://www.sae.org/publications/technical-papers/content/2021-01-0622/ (accessed on 25 October 2023).
  65. Sun, C.; Moura, S.J.; Hu, X.; Hedrick, J.K.; Sun, F. Dynamic Traffic Feedback Data Enabled Energy Management in Plug-in Hybrid Electric Vehicles. IEEE Trans. Contr. Syst. Technol. 2015, 23, 1075–1086. [Google Scholar] [CrossRef]
  66. Fleming, P.J.; Pursehouse, R.C. Genetic Algorithms in Control Systems Engineering. IFAC Proc. Vol. 1993, 26, 605–612. [Google Scholar] [CrossRef]
  67. Du, X.; Htet, K.K.K.; Tan, K.K. Development of a Genetic-Algorithm-Based Nonlinear Model Predictive Control Scheme on Velocity and Steering of Autonomous Vehicles. IEEE Trans. Ind. Electron. 2016, 63, 6970–6977. [Google Scholar] [CrossRef]
  68. Nobis, C.; Kuhnimhof, T. Mobilität in Deutschland—MiD. Ergebnisbericht: Eine Studie von Infas, DLR, IVT und Infas 360 im Auftrag des Bundesministers für Verkehr und Digitale Infrastruktur (FE-Nr. 70.904/15); Bundesministerium für Verkehr und digitale Infrastruktur: Bonn, Berlin, 2018. [Google Scholar]
  69. Kraft, W.; Altstedde, M.K. Use of metallic Phase Change Materials (mPCM) for heat storage in Electric- and Hybrid Vehicles. In Proceedings of the 6th Hybrid and Electric Vehicles Conference (HEVC 2016), London, UK, 2–3 November 2016; Institution of Engineering and Technology: London, UK, 2016. ISBN 978-1-78561-294-7. [Google Scholar]
  70. Lichius, T. Latentwärmespeicher in PlugIn-Hybridfahrzeugen. Ph.D. Thesis, RWTH Aachen University, Aachen, Germany, 2017. [Google Scholar]
  71. Spengler, R.; Essers, U. Einsatzmöglichkeiten von Kunststoff-Teilkapseln an Verbrennungsmotoren. MTZ Mot. Z. 1999, 60, 164–170. [Google Scholar] [CrossRef]
  72. Röchling Automotive SE & Co. KG. Leichte Kapselung hält Motor länger auf Betriebstemperatur. Lightweight Des. 2013, 6, 8. [CrossRef]
  73. Moos, E. Kostenabschätzung für eine Motorkapselung der Firma Röchling. E-Mail. 2022. [Google Scholar]
  74. Warner, B. High Voltage Coolant Heater.
  75. ATT Advanced Thermal Technologies. Battery Heating Solutions. Available online: https://www.thermaltech.at/battery-heating/ (accessed on 25 October 2023).
  76. Frenzelit GmbH. Revolutionäre Heizfolien und Heizsysteme aus Innovativem Verbundmaterial. Available online: https://www.frenzelit.com/produkte/hicotec/hicotec-tp-thermal-power (accessed on 25 October 2023).
  77. Flextem GmbH. PTC—Heiztechnologie. Available online: https://www.flextem.de/de/folienheizungen/ptc-heizfolien.html (accessed on 25 October 2023).
  78. Rose, D.; Boger, T.; Wu, H.; Ingram-Ogunwumi, R. Neue Generation Otto-Partikelfilter. MTZ Mot. Z. 2021, 82, 60–64. [Google Scholar] [CrossRef]
  79. Rolf Brück. Niedrigstemissionen im Realbetrieb: Lösungen für elektrifizierte Ottomotoren. In Proceedings of the 28th Aachen Colloquium Sustainable Mobility, Aachen, Germany, 7–9 October 2019; Aachener Kolloquium Fahrzeug- und Motorentechnik GbR: Aachen, Germany, 2019. [Google Scholar]
  80. ZVEI-Task Force Spannungsklassen. Spannungsklassen in der Elektromobilität. Available online: https://www.zvei.org/fileadmin/user_upload/Presse_und_Medien/Publikationen/2014/januar/Spannungsklassen_in_der_Elektromobilitaet/Spannungsklassen-Elektromobilitaet.pdf (accessed on 19 October 2023).
  81. Kevin Bennion and Gilberto Moreno: NREL. Convective Heat Transfer Coefficients of Automatic Transmission Fluid Jets with Implications for Electric Machine Thermal Management: Preprint. Available online: https://www.nrel.gov/docs/fy15osti/63969.pdf (accessed on 26 October 2023).
  82. Shams Ghahfarokhi, P.; Podgornovs, A.; Kallaste, A.; Marques Cardoso, A.J.; Belahcen, A.; Vaimann, T. The Oil Spray Cooling System of Automotive Traction Motors: The State of the Art. IEEE Trans. Transp. Electrific. 2023, 9, 428–451. [Google Scholar] [CrossRef]
  83. Peters, J.; Peña Cruz, A.; Weil, M. Exploring the Economic Potential of Sodium-Ion Batteries. Batteries 2019, 5, 10. [Google Scholar] [CrossRef]
  84. Dhaussy, F.; Truong Canh, J.; Raynaud, Y.; El Mejdoubi, A. High Power Battery Systems for Mild-Hybrid with Sodium-ion cobalt free technology. In Proceedings of the 31st Aachen Colloquium Sustainable Mobility, Aachen, Germany, 10–12 October 2022; Aachener Kolloquium Fahrzeug- und Motorentechnik GbR: Aachen, Germany, 2022. Paper No. 05. ISBN 978-3-00-072524-1. [Google Scholar]
  85. Stalp, A.; Heinz, A. Partikelbildung bei DI-Ottomotoren: Systemische Analyse der Partikelbildung an Ottomotoren, FF 1223. 2020. [Google Scholar]
  86. Günter Fischer, P. Betriebspunktorientierte Analyse und Optimierung der Partikelrohemissionen an einem Turboaufgeladenen Ottomotor. Ph.D. Thesis, Otto-von-Guericke-Universität Magdeburg, Magdeburg, Germany, 2020. [Google Scholar]
  87. Ascheberg, C. Die Sigma Milieus®, das Globale Zielgruppen und Trend System; Unveröffentlichtes Textmanuskript; Sigma: Mannheim, Germany, 2005. [Google Scholar]
  88. Brokate, J.; Özdemir, E.D.; Kugler, U. Der Pkw-Markt bis 2040: Was das Auto von Morgen Antreibt: Szenario-Analyse im Auftrag des Mineralölwirtschaftsverbandes. Available online: https://www.dlr.de/dlr/Portaldata/1/Resources/documents/2013/DLR-Studie_Pkw-Markt_2040_MQPBDJRL7FdcF45_(1).pdf (accessed on 12 October 2023).
Figure 1. Pre-dimensioning tool for analytical propulsion system conceptualization and model-based vehicle requirements management.
Vehicles 06 00058 g001
Figure 2. Schematic illustration of the closed-loop forward simulation model for a combined hybrid electric vehicle with no transmission.
Vehicles 06 00058 g002
Figure 3. Schematic powertrain architecture of the combined PHEV and thermal simulation approach for the baseline design and the real-driving scenarios.
Vehicles 06 00058 g003
Figure 4. Overview of the rolling and wind noise as a function of the vehicle speed (left) and the ICE interior noise as a function of the engine operating point (right).
Vehicles 06 00058 g004
Figure 5. Schematic layout of the different cooling circuits in a hybrid electric vehicle.
Vehicles 06 00058 g005
Figure 6. Setup of EU6 base exhaust aftertreatment system used for the simulation study.
Vehicles 06 00058 g006
Figure 7. Statistical evaluation of the maximum temperatures occurring in the battery cells, the EM windings, and the EM magnets (UDC: urban driving cycle, CCDC: cross-country driving cycle, GHDC: German highway driving cycle, MDC: mountain driving cycle).
Vehicles 06 00058 g007
Figure 8. Statistical evaluation of the time-based operating strategy driving shares (UDC: urban driving cycle, CCDC: cross-country driving cycle, GHDC: German highway driving cycle, MDC: mountain driving cycle).
Vehicles 06 00058 g008
Figure 9. Statistical evaluation of CO2 and ICE noise emissions (UDC: urban driving cycle, CCDC: cross-country driving cycle, GHDC: German highway driving cycle, MDC: mountain driving cycle).
Vehicles 06 00058 g009
Figure 10. Statistical evaluation of pollutant and particulate tailpipe emissions according to dEU7,Clove = 16 km. (UDC: urban driving cycle, CCDC: cross-country driving cycle, GHDC: German highway driving cycle, MDC: mountain driving cycle).
Vehicles 06 00058 g010
Figure 11. Exemplary engine torque limitation control dependent on the catalyst temperature.
Vehicles 06 00058 g011
Figure 12. Influence of different variants of load-point shifting on the interior noise of the ICE.
Vehicles 06 00058 g012
Figure 13. Influence of different insulation concepts on the cool-down of the coolant in the heat storage at Tamb = −10 °C and Tamb = 40 °C (left), and schematic layout of the thermal simulation model (right).
Vehicles 06 00058 g013
Figure 14. Influence of the engine encapsulation on the ICE cool-down at Tamb = −10 °C, Tamb = 20 °C, and Tamb = 40 °C (left) and on the interior noise of the ICE (right) based on the measurement results from [72].
Vehicles 06 00058 g014
Figure 15. Heating performance (left) and structure (right) of the two battery heating concepts.
Vehicles 06 00058 g015
Figure 16. Exhaust aftertreatment concept with optional secondary air pump, electric heating disks, and coated gasoline particulate filter.
Vehicles 06 00058 g016
Figure 17. Electric combustion chamber heater and its heating behavior with different preheating times and heating outputs.
Vehicles 06 00058 g017
Figure 18. Heat transfer coefficients of the oil spray cooling according to [81] (left) and schematic overview of the oil spray cooling of the winding head (right).
Vehicles 06 00058 g018
Figure 19. CFD simulation results for determining the water-side heat transfer coefficients (left) and structure of the HVB immersion cooling system (right).
Vehicles 06 00058 g019
Figure 20. Comparison of maximum available battery system discharging power between SiB and NMC battery cell technology at low ambient and thus cell temperatures.
Vehicles 06 00058 g020
Table 1. Vehicle and propulsion system characteristic for the optimized C-segment SUV PHEV (combined hybrid).
ParameterValueUnit
Vehicle,
C-Segment SUV
Mass1.84t
Drag coefficient0.75m2
Rolling resistance8.1kg/t
ICE,
3-Cyl. DI TC
Displacement1.4L
Rated power105kW
Generator (EM2),
PMSM
Max. power115 kW
Torque-to-Power ratio2.0Nm/kW
E-Motor (EM2),
PMSM
Max. power246 kW
Torque-to-Power ratio3.8Nm/kW
BatteryEnergy (NMC cell)14.7kWh
Final DriveGear ratio3.71
Table 2. Vehicle and propulsion system characteristics for the optimized C-segment SUV PHEV (combined hybrid). (UDC: urban driving cycle, CCDC: cross-country driving cycle, GHDC: German highway driving cycle, MDC: mountain driving cycle).
ParameterUDCCCDCGHDCMDC
Ambient temperature−10 °C−10 °C0 °C0 °C
40 °C40 °C
State-of-charge17%17%17%17%
50%50%50%50%
95%95%95%95%
Vehicle payload76 kg76 kg76 kg76 kg
349 kg349 kg349 kg349 kg
Trailer750 kg750 kg750 kg750 kg
TrafficNo trafficNo trafficNo trafficNo traffic
Low trafficLow trafficLow trafficLow traffic
High trafficHigh trafficHigh trafficHigh traffic
Driver typeDefensiveDefensiveDefensiveDefensive
DynamicDynamicDynamicDynamic
Table 3. Overview of selected challenging real-world driving scenarios for further investigations in Section 4.
Driving ScenarioCO2
g/km
SOC
%
Duration
s
NVH
mJ/m2
CO 1
mg
HC 1
mg
NOx 1
mg
PN 1
1 × 10¹²
Baseline WLTC/Legal limits109/95--0.028/--/6400-/720-/480-/1.60
Cold CCDC I 2298.515.528282.6793140182592510.6
Cold CCDC II 3138.824.441610.368655318727301.72
Hot UDC I 4128.828.27540.33617891081792.30
Hot CCDC I 554.834.827890.630849413282877.42
1 Evaluation after dEmi,Clove = 16 km. 2 Tambient = −10 °C, SOCinital = 17%, mPayload = 76 kg, heavy traffic and dynamic driver. 3 Tambient = −10 °C, SOCinital = 50%, mPayload = 76 kg, heavy traffic and defensive driver. 4 Tambient = 40 °C, SOCinital = 50%, mPayload = 826 kg, heavy traffic and dynamic driver. 5 Tambient = 40 °C, SOCinital = 95%, mPayload = 349 kg, heavy traffic and dynamic driver.
Table 4. Simulation results of (1) UDC (Tamb = 40 °C, TCabin = 50 °C, mTrailer = 750 kg, SOCinit = 50%, dynamic driver and high traffic); (2) CCDC (Tamb = −10 °C, THVB,init = −10 °C, TCabin = −10 °C, mTrailer = 0 kg, SOCinit = 17%, dynamic driver and high traffic); (3) CCDC, warm battery (Tamb = −10 °C, THVB,init = 30 °C, TCabin = −10 °C, mTrailer = 0 kg, SOCinit = 17%, dynamic driver and high traffic). Potential analysis of the MPC approach compared to a rule-based EMS.
Relative Difference
MPC–RB EMS
Hot UDC I
Tamb = 40 °C
THVB,init = 40 °C
Cold CCDC I
Tamb = −10 °C
THVB,init = −10 °C
Cold CCDC I
Tamb = −10 °C
THVB,init = 30 °C
CO2 emissions−12.9%−3.0%−4.6%
Electric energy consumption4.8%−103.6%131.4%
Total energy consumption−1.6%−3.7%−0.6%
HVB state-of-charge−1.1%2.3%−3.6%
NOx tailpipe emissions 1−14.0%−28.4%−31.5%
HC tailpipe emissions 125.0%−5.8%−2.9%
CO tailpipe emissions 1−9.3%−2.2%0.6%
PN tailpipe emissions 1−64.1%−12.3%−17.7%
Time share electric mode−3.0%−5.0%−2.5%
Time share serial mode4.6%3.6%6.6%
Time share parallel mode−1.6%1.4%4.1%
NVH—exceedance of masking noise−96.2%−17.1%−29.0%
1 Evaluation after dEmi,Clove = 16 km.
Table 5. Simulation results of the individual technologies in the overland driving scenario Cold CCDC I (red: worst value of the target variable, green: best value of the target variable).
Driving ScenarioCO2
g/km
SOC
%
Duration
s
NVH
mJ/m2
CO 1
mg
HC 1
mg
NOx 1
mg
PN 1
1 × 10¹²
Baseline WLTC/Legal limits109/95--0.028/--/6400-/720-/480-/1.60
Cold CCDC I293.615.528333.79134631608103714.3
ICE torque limitation292.915.528443.7982199105043914.5
Load point shiftingVariant 1244.312.830440164711717603.44
Variant 2298.815.328503.6196048133979214.1
Coolant
heat storage
w/o pre-heating291.415.528333.78128241071101013.7
with pre-heating291.315.528573.779321690795013.6
ICE encapsulation288.015.528330.004198713291512.9
GPF 2nd generation293.615.628333.790242613297723.16
HVB PTC heaterVariant 1274.118.328333.47133611645103414.3
Variant 2252.019.628333.08837081645100713.6
Electric heated
catalyst (EHC)
4 kW w/o pre-heating294.115.628333.7843770152568314.3
8 kW w/o pre-heating294.615.528333.7903439147258414.4
EHC & secondary air pump4 kW w/pre-heating293.815.628333.791328881755014.3
8 kW w/pre-heating293.915.628333.789193633615814.4
Electric combustion chamber heater294.615.028333.791305136888713.5
Sodium-ion battery technology296.414.228542.7792480144712499.88
1 Evaluation after dEmi,Clove = 16 km.
Table 6. Simulation results of the individual technologies in the overland driving scenario Cold CCDC II (red: worst value of the target variable, green: best value of the target variable).
Driving ScenarioCO2
g/km
SOC
%
Duration
s
NVH
mJ/m2
CO 1
mg
HC 1
mg
NOx 1
mg
PN 1
1 × 10¹²
Baseline WLTC/Legal limits109/95--0.028/--/6400-/720-/480-/1.60
Cold CCDC II136.824.541600.529731817758292.07
ICE torque limitation135.324.241600.52516299152322.00
Load point shiftingVariant 1125.620.741680441715576701.61
Variant 2151.225.741600.062974613804495.26
TWC heating strategy139.124.541600.368224815217801.66
HVB heaterVariant 1106.815.741600.4477354182010191.91
Variant 299.515.441600.376764318198961.82
Sodium-ion cell technology134.117.441580.471238613251242.32
1 Evaluation after dEmi,Clove = 16 km.
Table 7. Simulation results of the individual technologies in the cross-country driving scenario Hot Country (red: worst value of the target variable, green: best value of the target variable).
Driving ScenarioCO2
g/km
SOC
%
Duration
s
NVH
mJ/m2
CO 1
mg
HC 1
mg
NOx 1
mg
PN 1
1 × 10¹²
Baseline WLTC/Legal limits109/95--0.028/--/6400-/720-/480-/1.60
Hot Country II54.834.827890.630849413282877.42
ICE torque limitation56.435.527920.53116021631005.44
TWC heating strategy47.433.22793072179172465.94
HVB direct cooling47.428.627840.303774913092804.61
EM direct cooling54.835.527880.614861813292867.38
HVB and EM direct cooling44.628.527840.363774913092804.61
1 Evaluation after dEmi,Clove = 16 km.
Table 8. Overview of technology packages and the differential costs compared to the baseline powertrain for different customer preferences.
Cost NeutralCold CountryHot CountryPremium
  • GPF 2nd generation
  • Load point shifting
  • ICE torque limitation
  • GPF 2nd generation
  • Load point shifting
  • ICE torque limitation
  • Coolant heat storage
  • Secondary air pump & electric heated catalyst (4 kW)
  • HVB heater (PTC 1)
  • GPF 2nd generation
  • Load point shifting
  • ICE torque limitation
  • EM and HVB direct cooling
  • GPF 2nd generation
  • Load point shifting
  • ICE torque limitation
  • Engine encapsulation
  • Secondary air pump & electric heated catalyst (4 kW)
  • HVB heater (PTC 2)
  • EM and HVB direct cooling
0€273€108€437€
Table 9. Simulation results of the technology packages for the overland driving scenarios Cold CCDC I & II (red: worst value of the target variable, green: best value of the target variable).
Driving ScenarioCO2
g/km
SOC
%
Duration
s
NVH
mJ/m2
CO 1
mg
HC 1
mg
NOx 1
mg
PN 1
1 × 10¹²
Baseline WLTC/Legal limits109/95--0.028/--/6400-/720-/480-/1.60
Cold CCDC I293.615.528333.79134631608103714.33
Cost neutral243.412.83053011639601870.96
Cold country with 30 s pre-heating229.413.82833010824481690.91
Premium with 30 s pre-heating210.115.3283309571341580.81
Cold CCDC II136.824.541600.529731817758292.07
Cost neutral125.220.64168011308971090.40
Cold country with 30 s pre-heating100.813.741610754270330.34
Premium with 30 s pre-heating93.313.94161074552220.22
1 Evaluation after dEmi,Clove = 16 km.
Table 10. Simulation results of the technology packages for the overland driving scenario Hot Country (red: worst value of the target variable, green: best value of the target variable).
Driving ScenarioCO2
g/km
SOC
%
Duration
s
NVH
mJ/m2
CO 1
mg
HC 1
mg
NOx 1
mg
PN 1
1 × 10¹²
Baseline WLTC/Legal limits109/95--0.028/--/6400-/720-/480-/1.60
Hot Country54.834.827890.630849413282877.42
Cost neutral48.733.5279301825146971.07
Hot country with 30 s pre-heating38.126.5278501070135910.41
Premium with 30 s pre-heating37.026.1278506044430.27
1 Evaluation after dEmi,Clove = 16 km.
Disclaimer/Publisher’s Note: The statements, opinions and data contained in all publications are solely those of the individual author(s) and contributor(s) and not of MDPI and/or the editor(s). MDPI and/or the editor(s) disclaim responsibility for any injury to people or property resulting from any ideas, methods, instructions or products referred to in the content.

