Influence of ADAS on Driver Distraction
Abstract
1. Introduction
1.1. Background
1.2. Literature Review
1.3. Research Gap
2. Methodology
- -
- Variable Numbers: A driving simulator can accurately and efficiently measure driver performance. In a real vehicle, very bulky equipment is required to obtain complete, synchronized and accurate measurements.
- -
- Safety for the user against driving errors: driving simulators allow the study of hazard perception and anticipation, exposing the driver to dangerous driving activities that cannot be tested in a real vehicle.
2.1. The Alignment
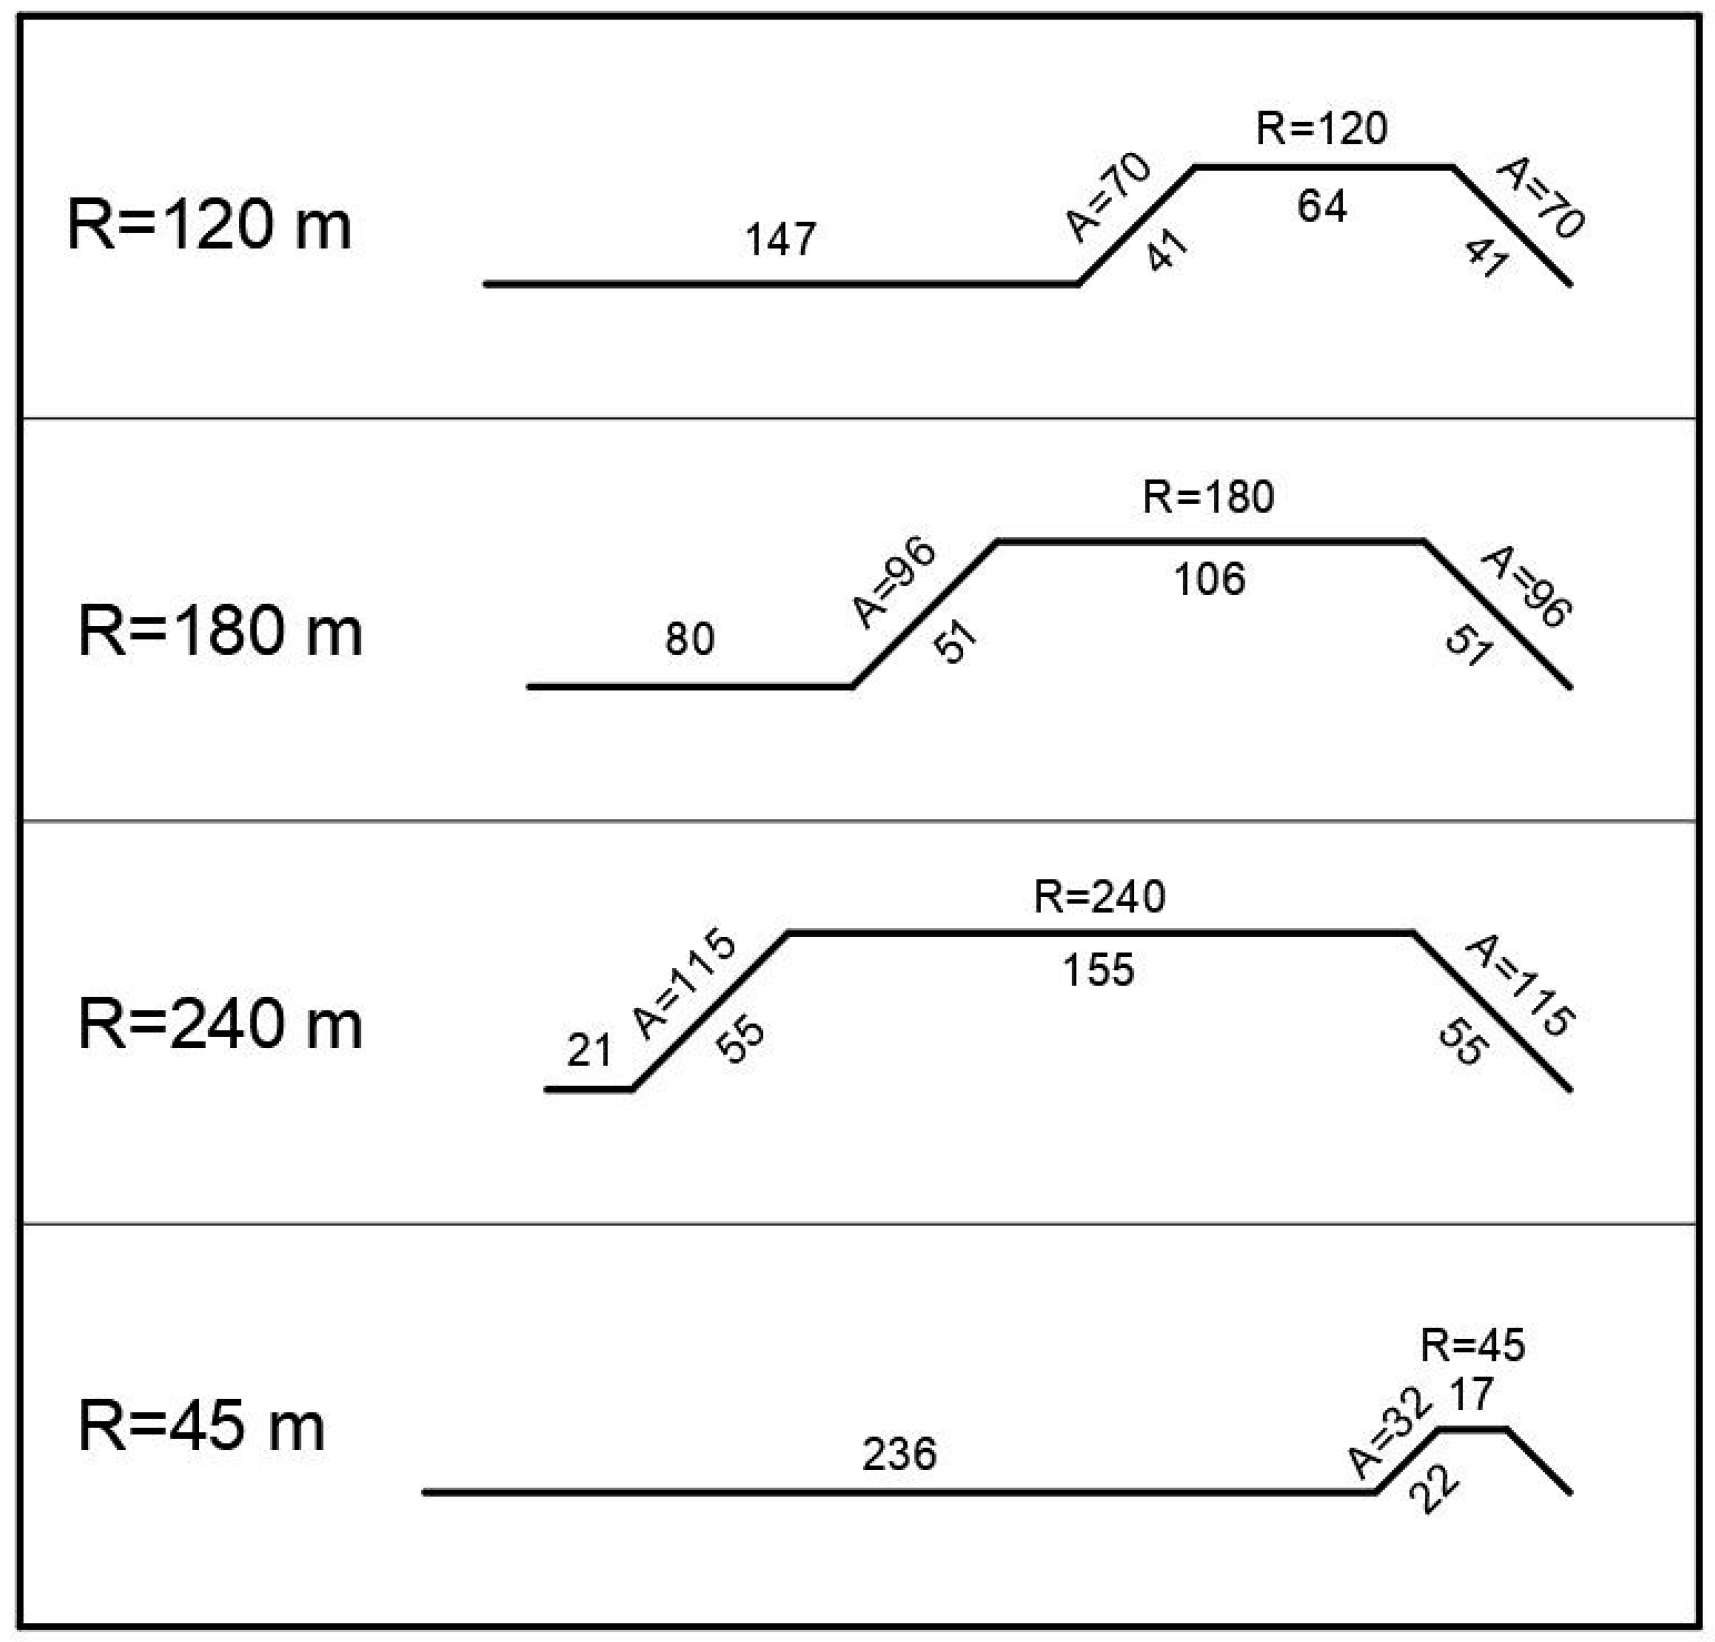
- Two-way road with one lane in each direction.
- Total width of carriageway and shoulders: 4.5 m.
- Cross-slope along tangents: 2.5%.
- Cross-slope along bends: 7%.
- 2 very small radius bends (R = 45 m) following 2 larger radius bends (R = 240 m) and a 236 m long tangent.
- A work zone of about 500 m in length.
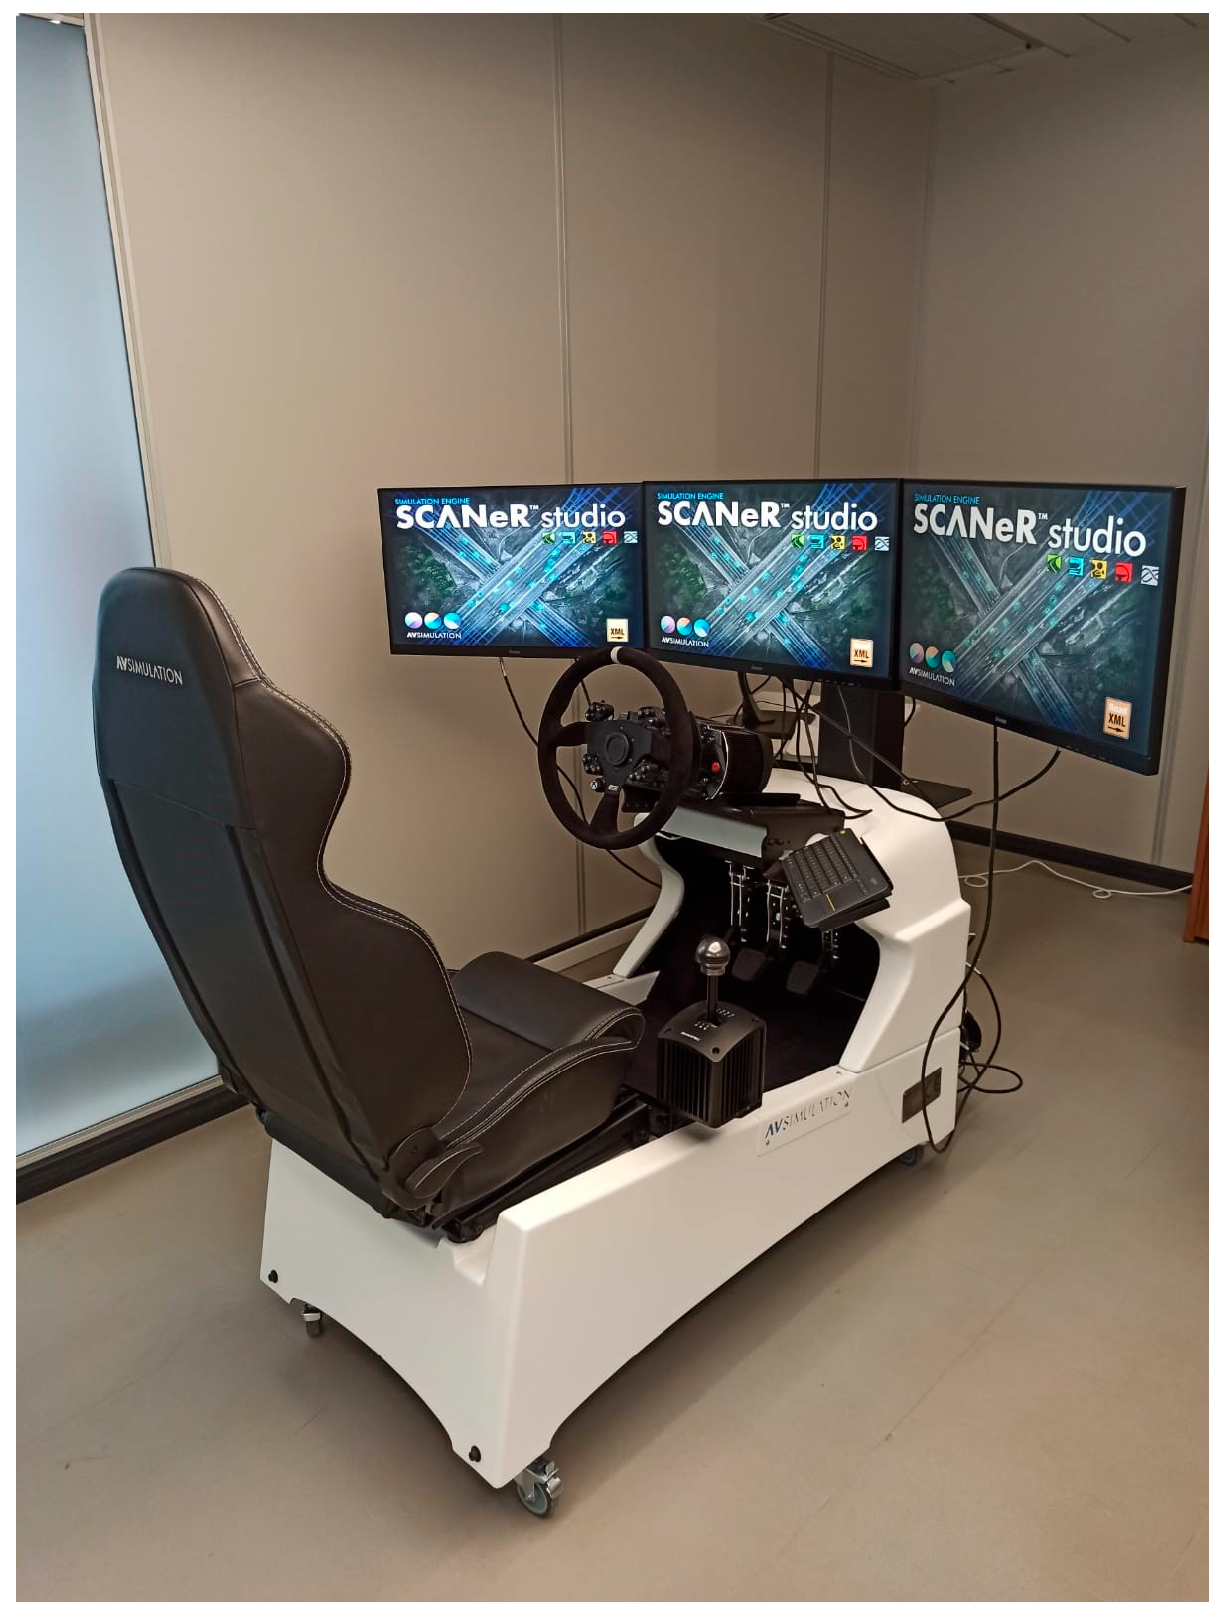
2.2. The Driving Simulator
- In the absence of any route criticism or incorrect behavior, the OBU screen remains blank (white).
- Otherwise, a number of messages are displayed on the screen. These remain valid until the criticism is over.
- Frame 1: The vehicle speed exceeds the legal limit.
- Frame 2: The accelerator pedal is depressed excessively.
- Frame 3: The vehicle is drifting out of the lane.
- Frame 4, on the other hand, is designed to provide some informative feedback on specific driving errors. Unlike the former, the latter disappears after a fixed time.
- The time of appearance of each warning with reference to the critical element of the alignment.
- The duration of the warning (in seconds).
- Threshold values of the variables beyond which the alert is provided.
- Optimal positioning of the single alert or the whole OBU on the screen (driver’s field of view).
- Size of the single warning or of the OBU.
- Possibility to switch between textual warnings and alert icons.
- Possibility to integrate (or replace) the visual warning with audible feedback.
2.3. Sample Users’ Definition
2.4. Experimental Procedure
- Introduction to the experiments (2 min): each participant was given some preliminary information about the experiments.
- Calibration of the eye tracker (5 min), which was necessary to obtain sufficient accuracy in tracking eye movements.
- Driving practice (3 min): before the actual tests, each driver performed a practice drive along a section different from the test alignment in order to become familiar with the driving instruments (wheel, pedals, gears), lane change, brake and accelerator modulation.
- Driving under “control” conditions (5 min).
- Driving in “smart” conditions (5 min).
2.5. Measures and Indicators
- Driving Condition (2 levels: Control and Smart).
- On-board warning (7 levels: Roadworks, Speed Limit 50, Speed Limit 90, End of Roadworks, Dangerous Corner, Excess CO2, Lane Departure).
- The response variable (or dependent variable DV) is always represented by the following alternative values:
- Number of fixations.
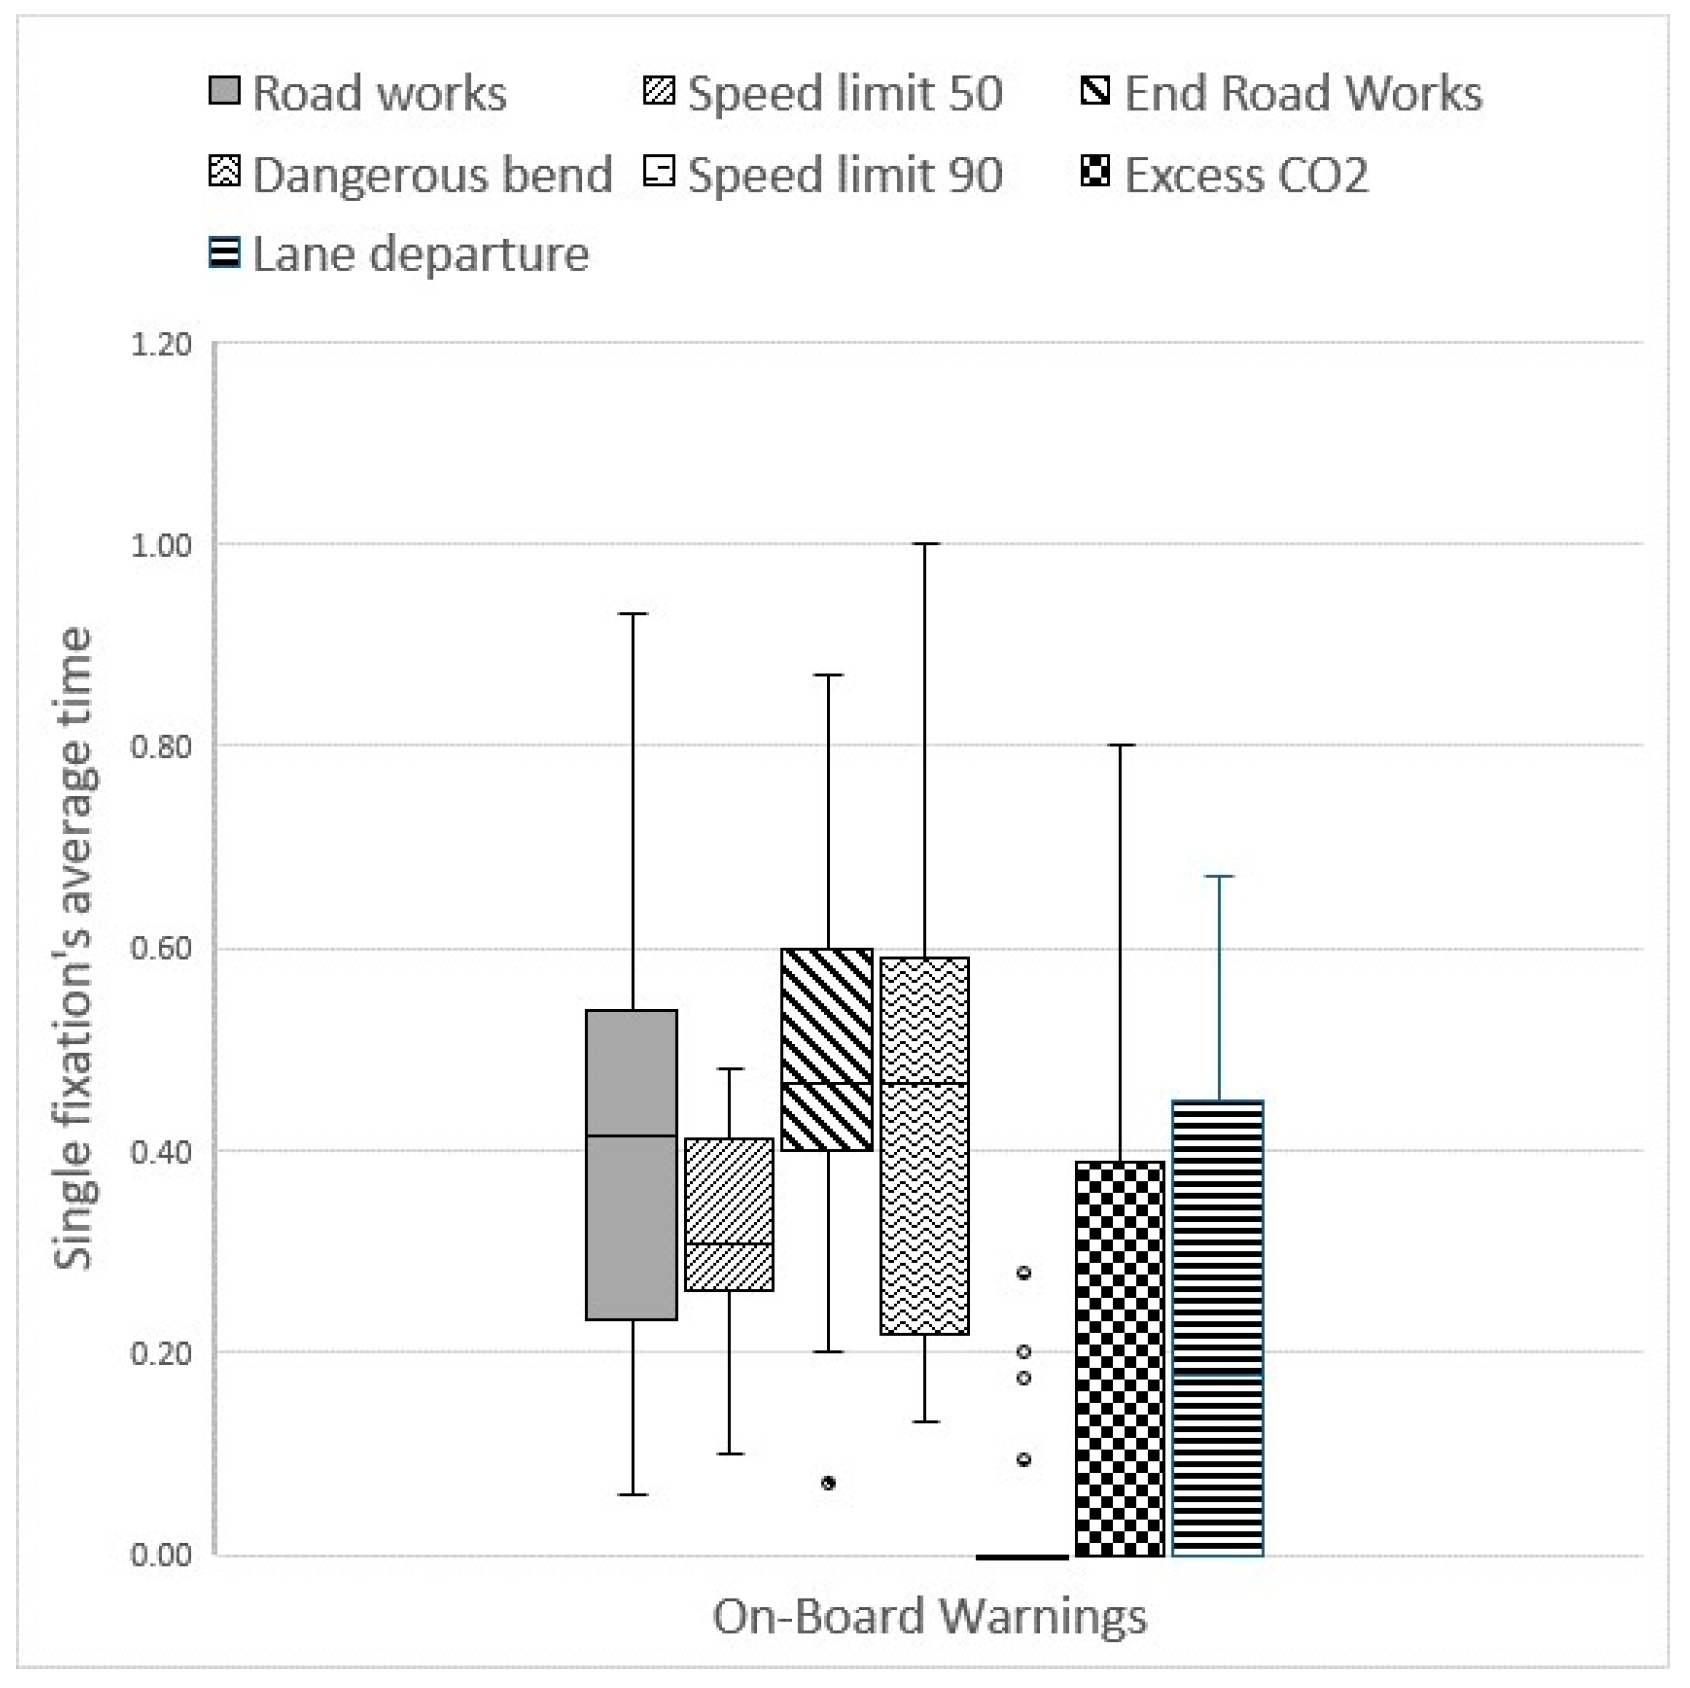
- Average duration of a single fixation.
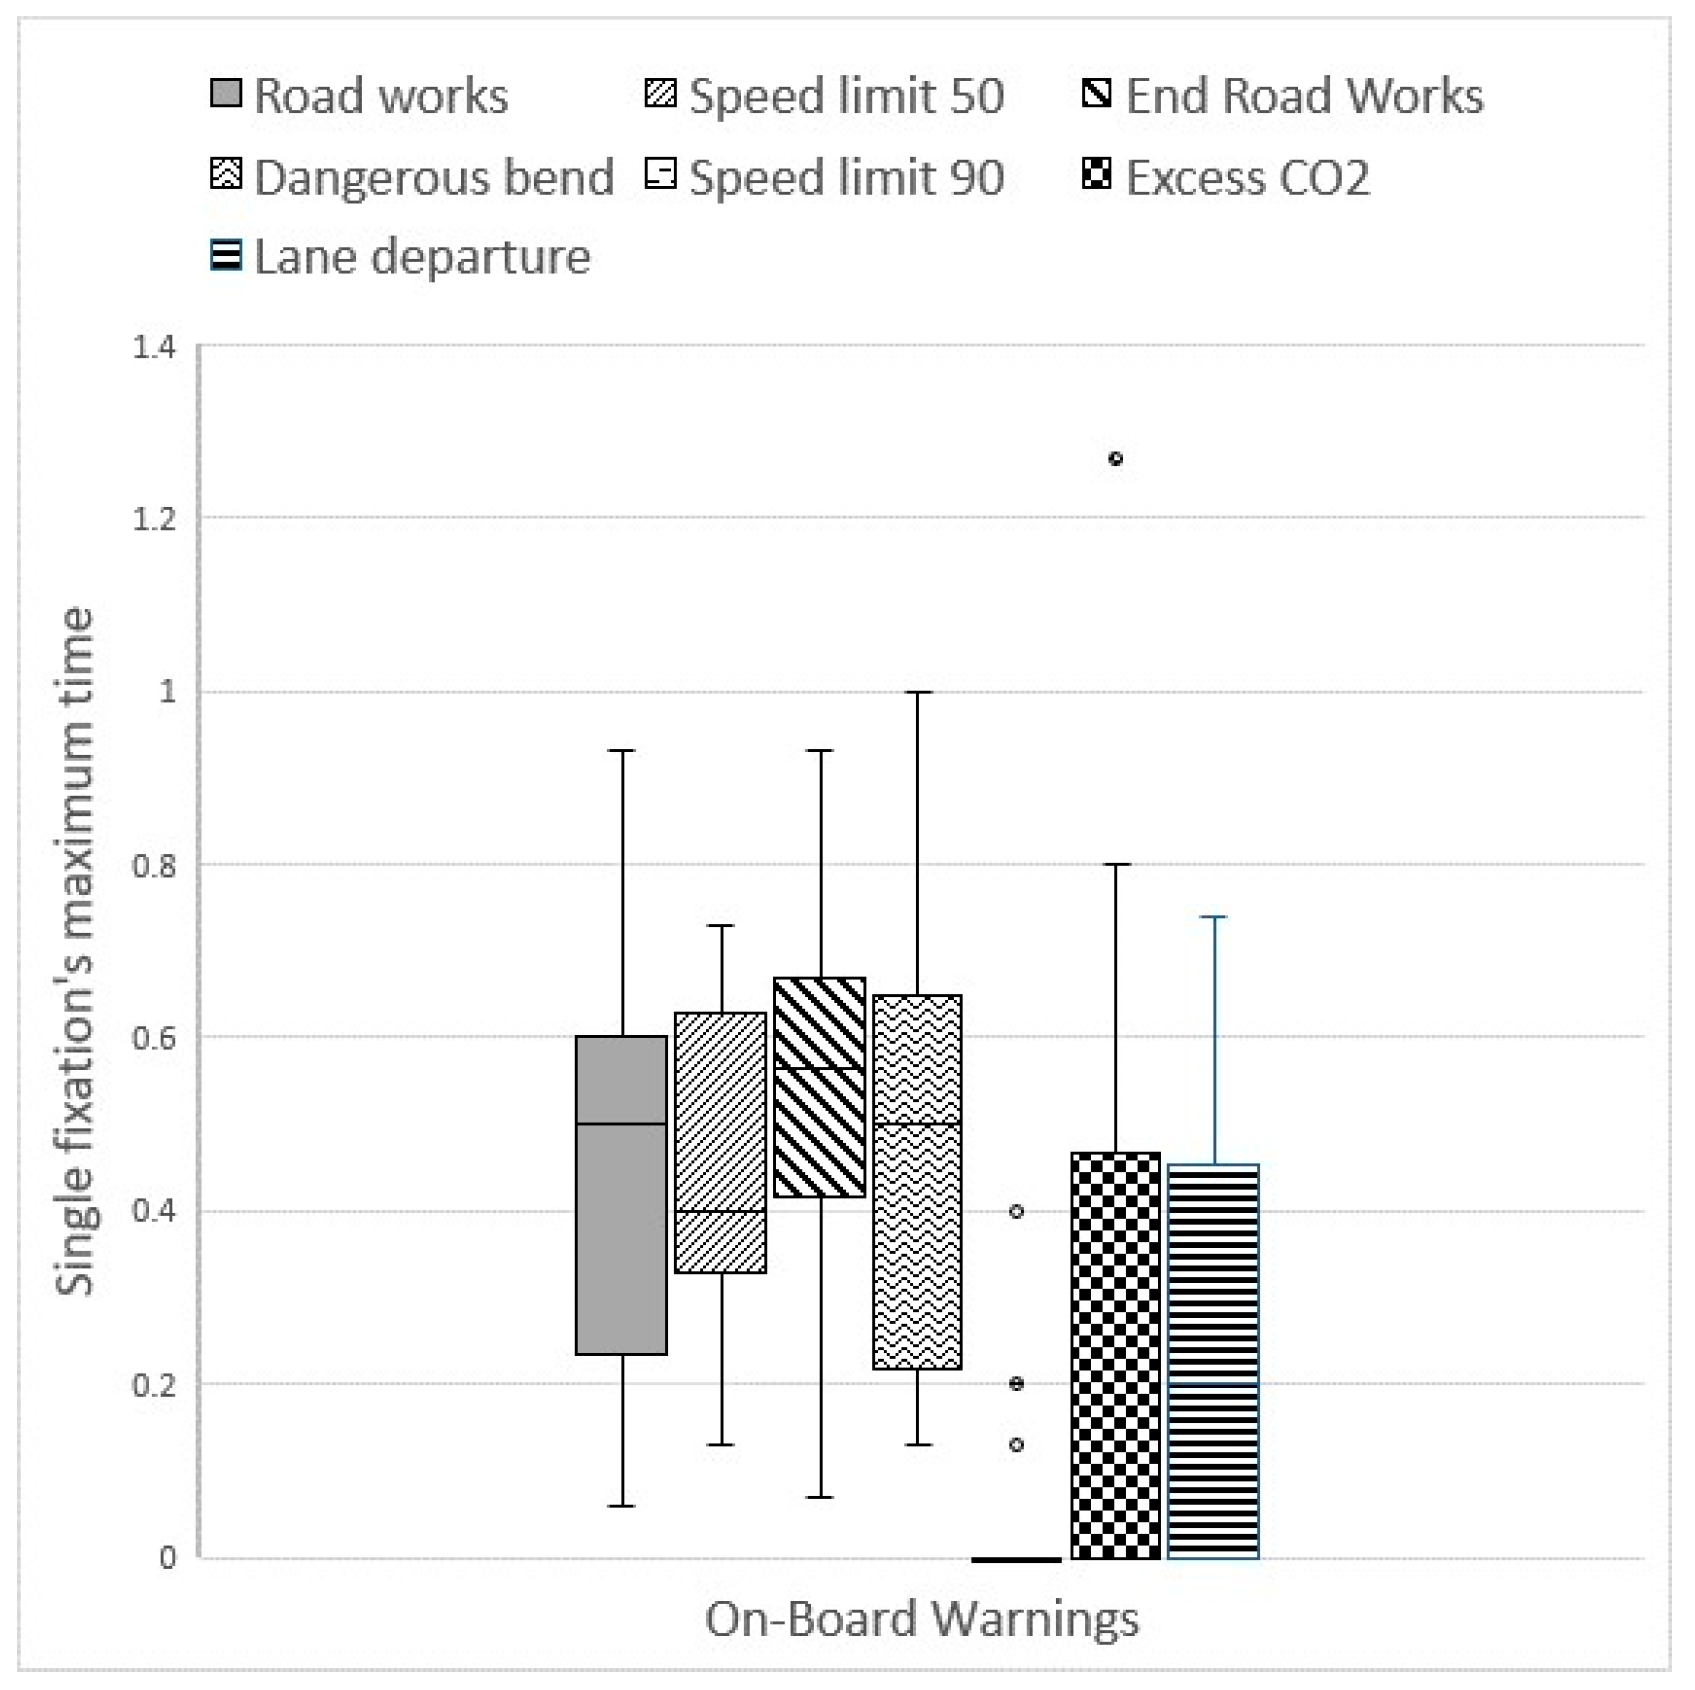
- Maximum duration of a single fixation.
- Number of unseen traffic signs.
- The dependent variable must be measured at the continuous level.
- The within-subjects factors (i.e., the independent variables) should consist of at least two related groups, indicating that the same subjects are present in all groups.
- The observations are independent, with no relationship between the observations in each group.
- No significant outliers.
- Normal tests using residuals.
- H0: The means of all driving conditions or on-board warnings are equal.
- H1: The means of at least one driving condition or on-board warning group (Control or Smart) are different.
3. Results
3.1. Total Number of Fixations and Average Fixation Time
- The vertical sign (the only “information” element in the control condition) during the first trials.
- The same signal displayed on the OBU during the second experiment (smart condition).
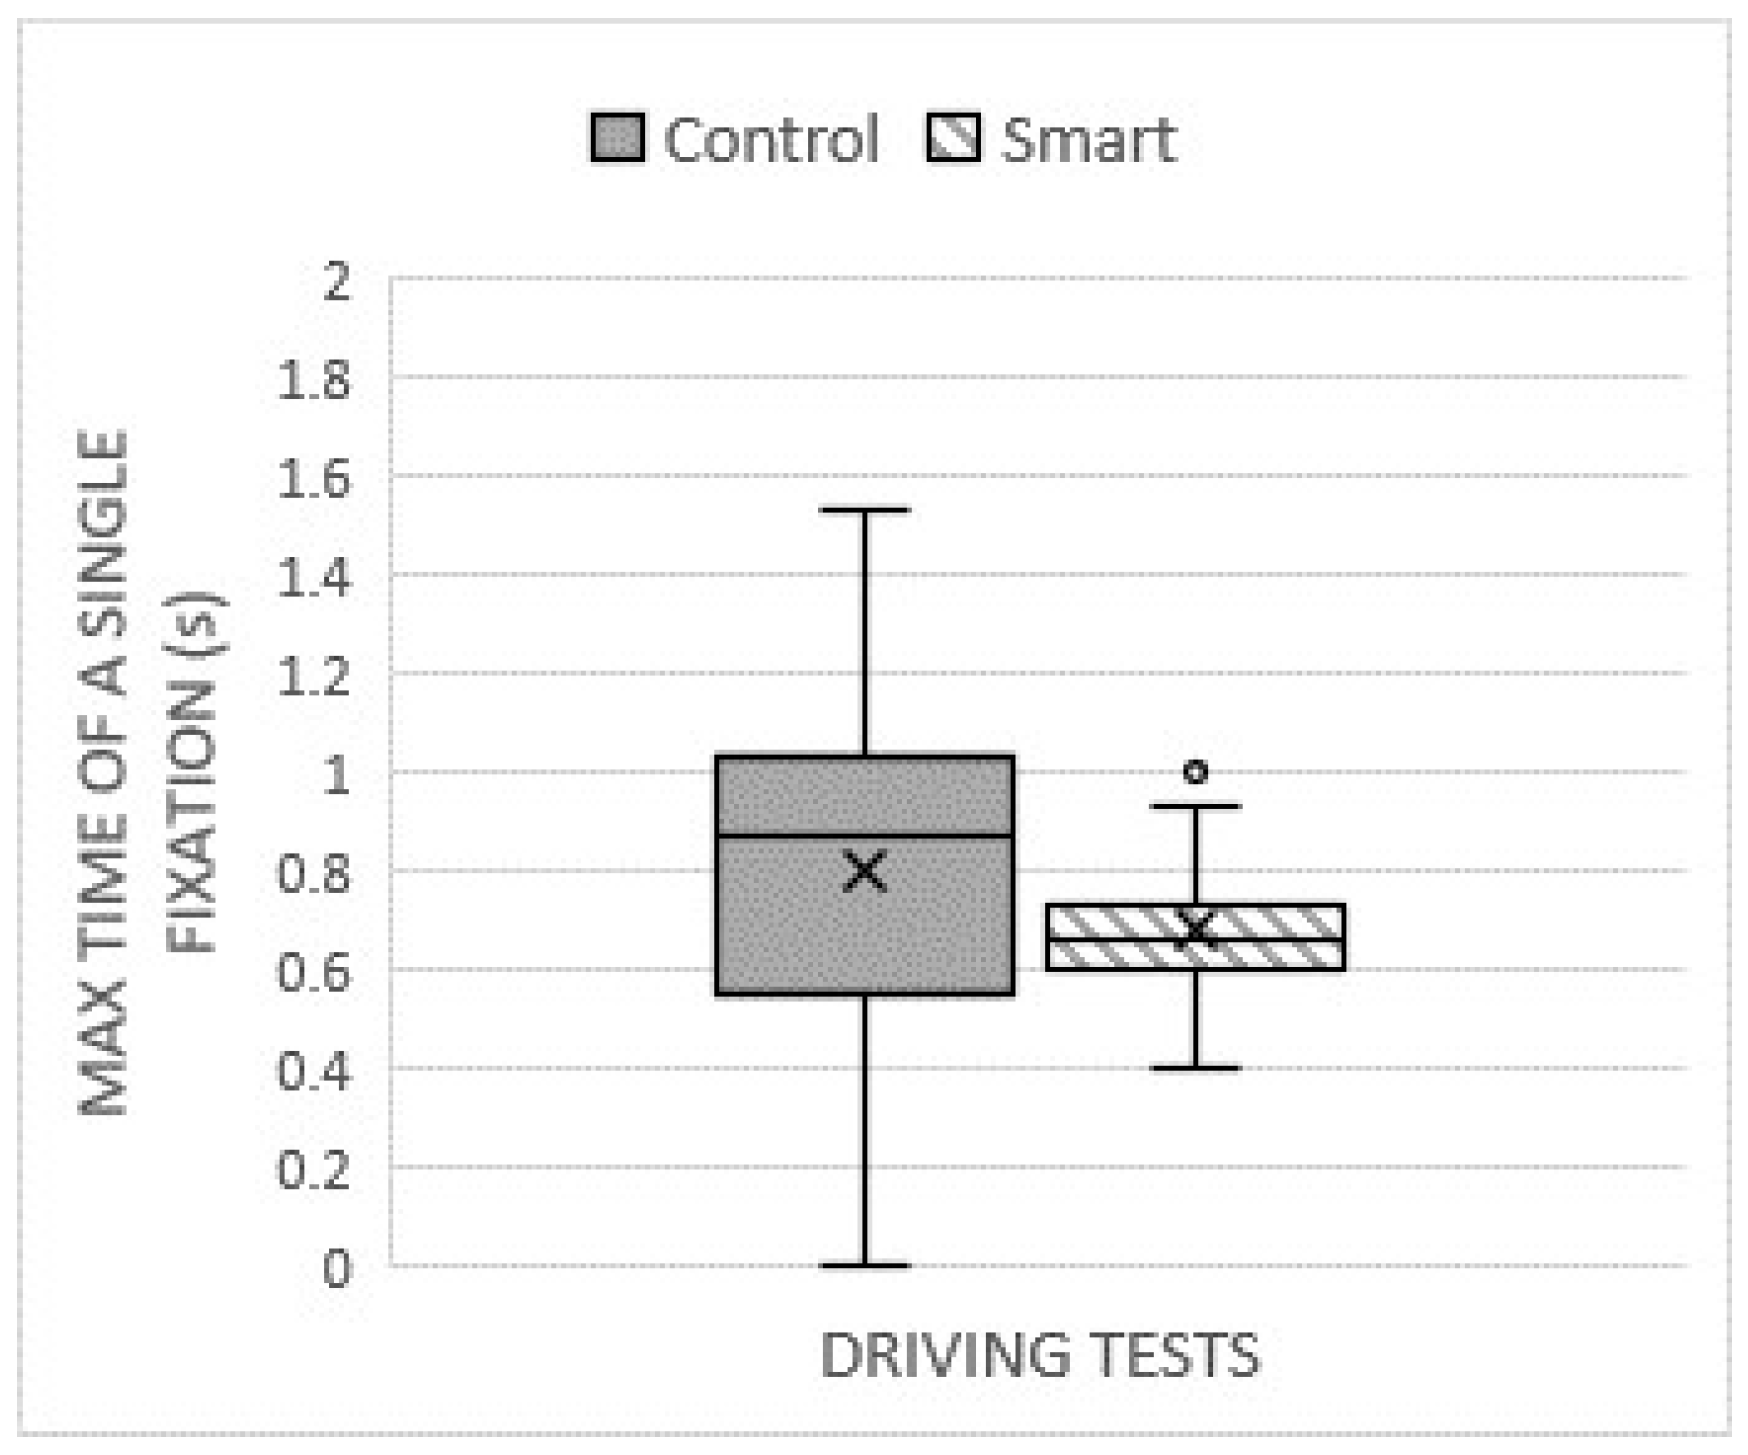
3.2. Maximum Time per Fixation
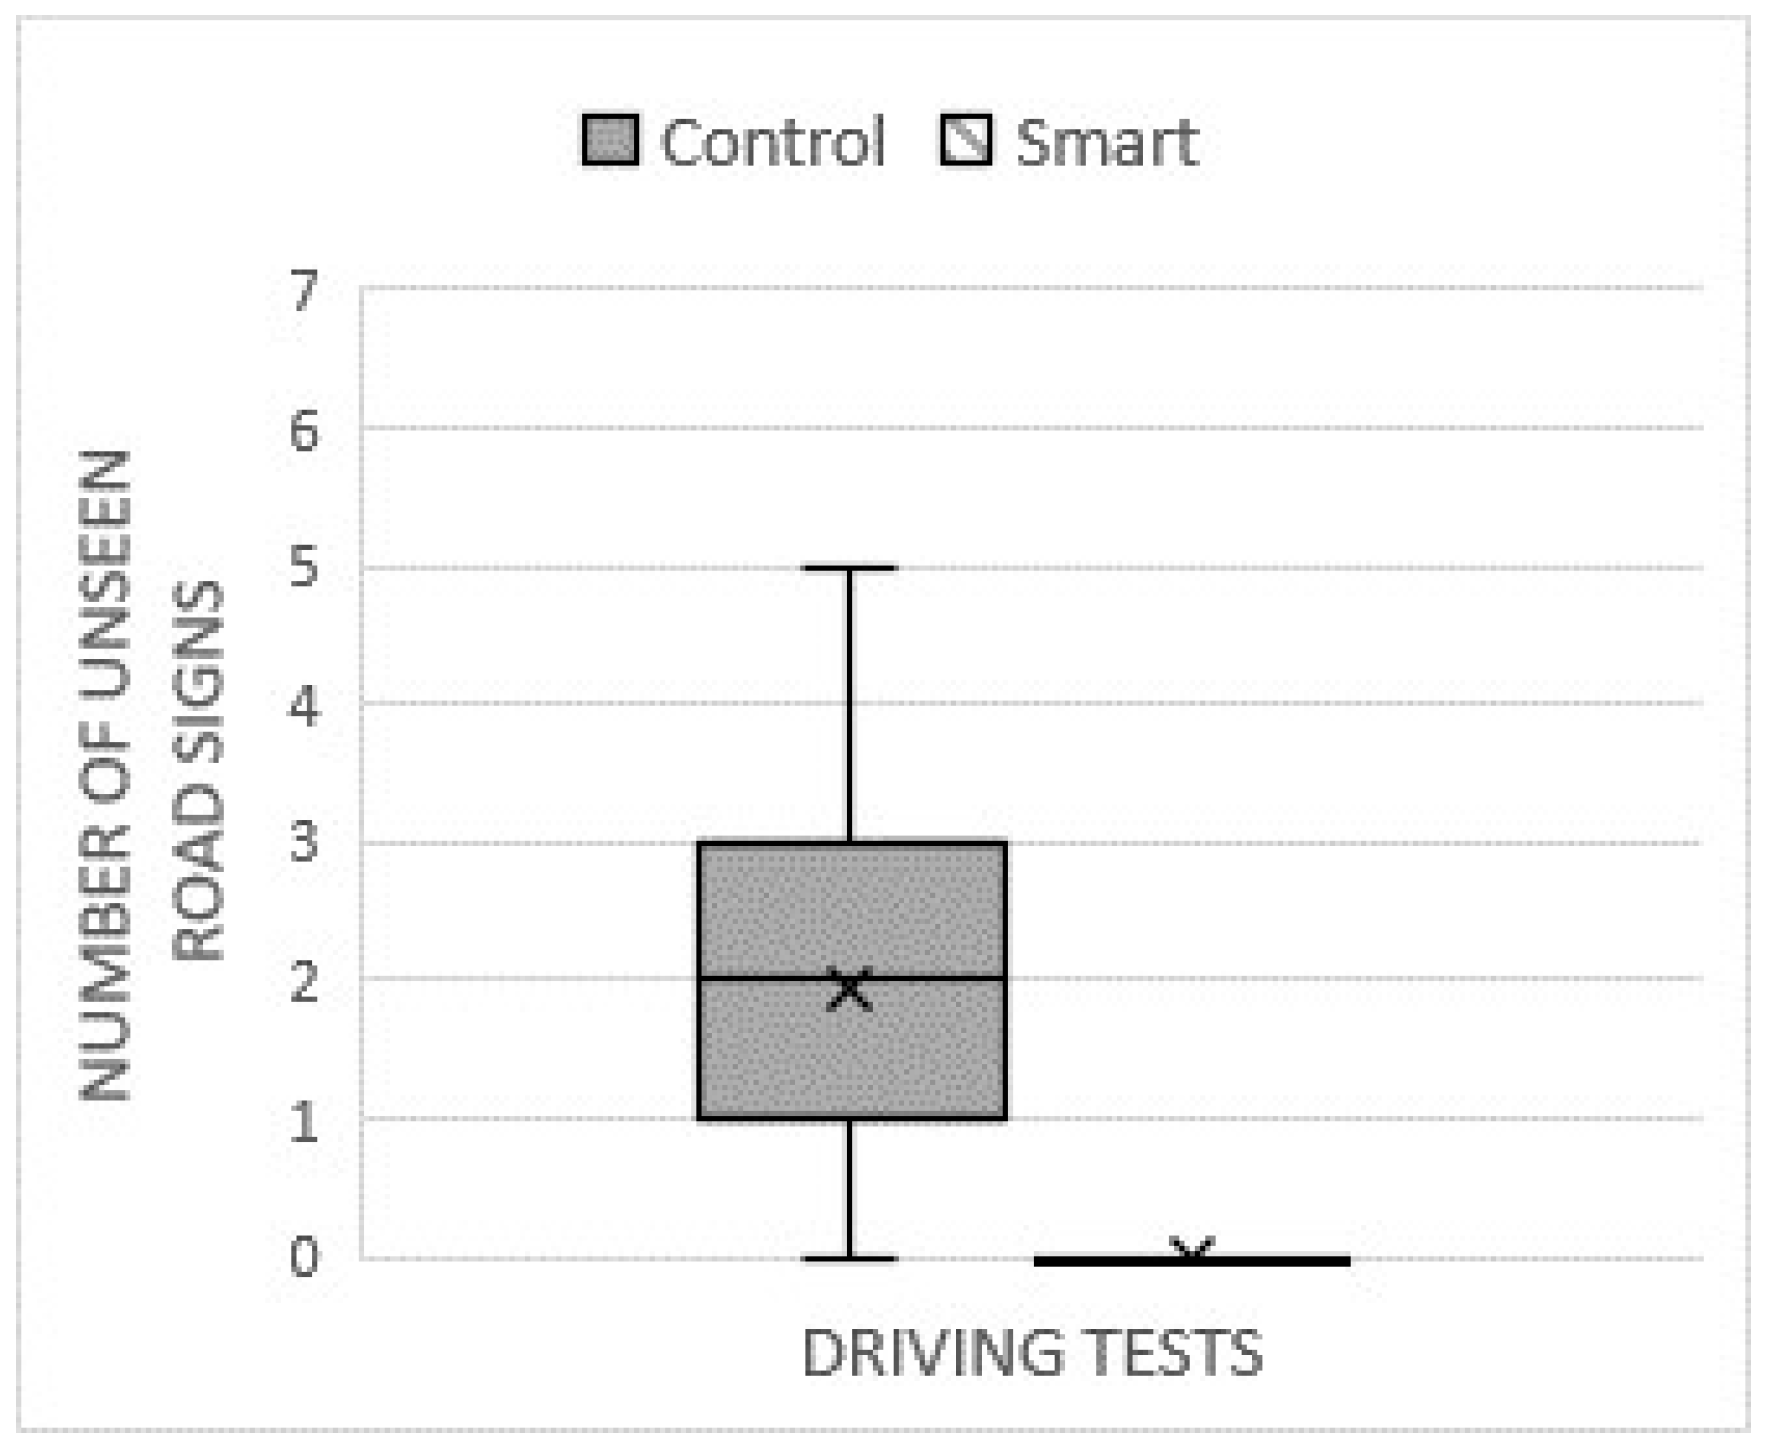
3.3. Number of Missed Signals
3.4. Specific Intake of the Single OBU Warnings
- -
- Total Number of Fixations: RM-ANOVA: F(1, 20) = 126.52, p < 0.001
- -
- Average Fixation Time: RM-ANOVA: F(1, 20) = 10.43, p = 0.015
- -
- Number of Missed Signals: RM-ANOVA: F(1, 20) = 76.025, p < 0.001
4. Discussion
- Total number of fixations and average time for fixation
- Maximum time per fixation
- Number of missed signals
- Better awareness of the route and the limits imposed: the driver avoids losing information and can regulate himself in advance to react to possible dangers (lane restrictions, deviations, dangerous bends, etc.).
- Permanent and uninterrupted: with respect to the control conditions, in the smart one, the information appears on the screen and remains active until the driver fully understands it (by correcting the incorrect driving behavior) or until this information requires attention.
- Better economy: in smart conditions, when a problem related to a driver’s incorrect behavior occurs on a specific section of road, it would be sufficient for road managers to code the appearance of novel feedback to correct it through the road control system in a smart road environment. Conversely, in a traditional driving environment, they would have to plan the installation of novel signals—with the associated costs—but these cannot always warn the driver in real time of possible dangers (e.g., the sudden presence of a stationary vehicle on the road).
- Specific intake of the single OBU warnings
- The speed limit warning (90 km/h) is activated 0.65 times and remains on the screen for 2.64 s before being corrected.
- The CO2 emission warning is activated 1.45 times and remains for 1.10 s before being corrected.
- The Lane Departure Warning is activated once and remains on the screen for 1.35 s before being corrected.
5. Conclusions
- A comparison between the condition of traditional driving and the condition of driving assisted by a suitable digital device, in extremely homogeneous conditions provided by the driving simulator.
- The proposed procedure is not aimed at choosing between traditional and smart conditions, but at optimizing warning signals and possibly correcting specific elements of the road infrastructure.
- The final results may concern not only the overall efficiency of the OBU, but also the refinement of a single considered signal.
- There is no separate monitoring between the driver and the road, but the study focused on the way the former is influenced by the permanent or temporary conditions of the infrastructure.
Author Contributions
Funding
Institutional Review Board Statement
Informed Consent Statement
Data Availability Statement
Conflicts of Interest
References
- Jazayeri, A.; Martinez, J.R.B.; Loeb, H.S.; Yang, C.C. The Impact of driver distraction and secondary tasks with and without other co-occurring driving behaviors on the level of road traffic crashes. Accid. Anal. Prev. 2021, 153, 106010. [Google Scholar] [CrossRef] [PubMed]
- Bowden, V.K.; Loft, S.; Wilson, M.D.; Howard, J.; Visser, T.A.W. The long road home from distraction: Investigating the time-course of distraction recovery in driving. Accid. Anal. Prev. 2019, 124, 23–32. [Google Scholar] [CrossRef]
- Lansdown, T.C.; Kovanda, E.J.; Spence, L. Student driver propensity to engage with distractions—A self-report survey. Transp. Res. Part F Traffic Psychol. Behav. 2021, 81, 650–660. [Google Scholar] [CrossRef]
- NHTSA. Distracted Driving in Fatal Crashes, 2017; DOT HS 812 700; NHTSA’s National Center for Statistics and Analysis: Washington, DC, USA, 2019.
- NHTSA. Distracted Driving 2020; DOT HS 813 309; NHTSA’s National Center for Statistics and Analysis: Washington, DC, USA, 2022. Available online: https://www.nhtsa.gov/risky-driving/distracted-driving (accessed on 1 July 2025).
- Klauer, S.; Dingus, D.; Neale, T.; Sudweeks, J.; Ramset, D. The Impact of Driver Inattention on Near-Crash/Crash Risk: An Analysis Using the 100-Car Naturalistic Study Data; DOT HS 810 594; National Highway Traffic Safety Administration (NHTSA): Washington, DC, USA, 2006. [Google Scholar]
- Lee, J.D. Technology and Teen Drivers. J. Saf. Res. 2007, 38, 203–213. [Google Scholar] [CrossRef] [PubMed]
- Stutts, J.; Reinfurt, D.; Staplin, L.; Rodgman, E. The Role of Driver Distraction in Traffic Crashes; University of North Carolina Highway Safety Research Center: Chapell Hill, NC, USA, 2001. [Google Scholar]
- Ali, Y.; Sharma, A.; Haque, M.M.; Zheng, Z.; Saifuzzaman, M. The impact of the connected environment on driving behavior and safety: A driving simulator study. Accid. Anal. Prev. 2020, 144, 105643. [Google Scholar] [CrossRef]
- Fernández-Isabel, A.; Fuentes-Fernández, R.; de Diego, I.M. Modeling multi-agent systems to simulate sensor-based Smart Roads. Simul. Model. Pract. Theory 2020, 99, 101994. [Google Scholar] [CrossRef]
- Birrell, S.; Young, M. The impact of smart driving aids on driving performance and driver distraction. Transp. Res. Part F Traffic Psychol. Behav. 2011, 14, 484–493. [Google Scholar] [CrossRef]
- Ma, J.; Gong, Z.; Tan, J.; Zhang, Q.; Zuo, Y. Assessing the driving distraction effect of vehicle HMI displays using data mining techniques. Transp. Res. Part F Traffic Psychol. Behav. 2020, 69, 235–250. [Google Scholar] [CrossRef]
- Pellegrino, O. An analysis of the effect of roadway design on driver’s workload. Balt. J. Road Bridg. Eng. 2009, 4, 45–53. [Google Scholar] [CrossRef]
- Pellegrino, O. Prediction of driver’s workload by means of fuzzy techniques. Balt. J. Road Bridg. Eng. 2012, 7, 120–128. [Google Scholar] [CrossRef]
- Bosurgi, G.; D’Andrea, A.; Pellegrino, O. What variables affect to a greater extent the driver’s vision while driving? Transport 2013, 28, 331–340. [Google Scholar] [CrossRef]
- Kircher, K.; Fors, C.; Ahlstrom, C. Continuous versus intermittent presentation of visual eco-driving advice. Transp. Res. Part F Traffic Psychol. Behav. 2014, 24, 27–38. [Google Scholar] [CrossRef]
- Bosurgi, G.; D’Andrea, A.; Pellegrino, O. Prediction of Drivers’ Visual Strategy Using an Analytical Model. J. Transp. Saf. Secur. 2015, 7, 153–173. [Google Scholar] [CrossRef]
- Bongiorno, N.; Bosurgi, G.; Pellegrino, O.; Sollazzo, G. Analysis of Different Visual Strategies of ‘Isolated Vehicle’ and ‘Disturbed Vehicle’. Transport 2017, 33, 853–860. [Google Scholar] [CrossRef]
- Risteska, M.; Kanaan, D.; Donmez, B.; Chen, H.Y.W. The effect of driving demands on distraction engagement and glance behaviors: Results from naturalistic data. Saf. Sci. 2021, 136, 105123. [Google Scholar] [CrossRef]
- Dumitru, A.I.; Girbacia, T.; Boboc, R.G.; Postelnicu, C.C.; Mogan, G.L. Effects of smartphone based advanced driver assistance system on distracted driving behavior: A simulator study. Comput. Hum. Behav. 2018, 83, 1–7. [Google Scholar] [CrossRef]
- Gazder, U.; Al-Malki, Y.; Alam, M.S. Risk of Using Smart Devices for Drivers. In proceeding of 2nd Smart Cities Symposium; Univerisity of Bahrain, Zallaq, Bahrain, 24–26 March 2019. [Google Scholar]
- Zhang, S.; Zhao, C.; Zhang, Z.; Lv, Y. Driving simulator validation studies: A systematic review. Simul. Model. Pr. Theory 2025, 138, 103020. [Google Scholar] [CrossRef]
- Underwood, G.; Crundall, D.; Chapman, P. Driving simulator validation with hazard perception. Transp. Res. Part F Traffic Psychol. Behav. 2011, 14, 435–446. [Google Scholar] [CrossRef]
- Hussain, Q.; Alhajyaseen, W.K.M.; Pirdavani, A.; Reinolsmann, N.; Brijs, K.; Brijs, T. Speed perception and actual speed in a driving simulator and real-world: A validation study. Transp. Res. Part F Traffic Psychol. Behav. 2019, 62, 637–650. [Google Scholar] [CrossRef]
- Himmels, C.; Venrooij, J.; Parduzi, A.; Peller, M.; Riener, A. The bigger the better? Investigating the effects of driving simulator fidelity on driving behavior and perception. Transp. Res. Part F Traffic Psychol. Behav. 2024, 101, 250–266. [Google Scholar] [CrossRef]
- Wang, C.; Ren, W.; Xu, C.; Zheng, N.; Peng, C.; Tong, H. Exploring the Impact of Conditionally Automated Driving Vehicles Transferring Control to Human Drivers on the Stability of Heterogeneous Traffic Flow. IEEE Trans. Intell. Veh. 2025, 10, 912–928. [Google Scholar] [CrossRef]
- D’Addario, P.; Donmez, B. The effect of cognitive distraction on perception-response time to unexpected abrupt and gradually onset roadway hazards. Accid. Anal. Prev. 2019, 127, 177–185. [Google Scholar] [CrossRef]
- Chen, H.Y.W.; Hoekstra-Atwood, L.; Donmez, B. Voluntary- and involuntary distraction engagement: An exploratory study of individual differences. Hum. Factors 2018, 60, 575–588. [Google Scholar] [CrossRef]
- Engström, J.; Johansson, E.; Östlund, J. Effects of visual and cognitive load in real and simulated motorway driving. Transp. Res. Part F Traffic Psychol. Behav. 2005, 8, 97–120. [Google Scholar] [CrossRef]
- Boer, E.R.; Rakauskas, M.E.; Ward, N.J.; Goodrich, M.A. Steering entropy revisited. In Proceedings of the Third International Driving Symposium on Human Factors in Driver Assessment, Training and Vehicle Design, Rockport, Maine, 27–30 June 2005. [Google Scholar]
- Briggs, G.F.; Hole, G.J.; Land, M.F. Emotionally involving telephone conversations lead to driver error and visual tunnelling. Transp. Res. Part F Traffic Psychol. Behav. 2011, 14, 313–323. [Google Scholar] [CrossRef]
- Chen, H.; Chiuhsiang, J. The effects of various naturalistic conversations on driving performances during simulated driving. In Ergonomics for All: Celebrating PPCOE’s 20 Years of Excellence; Wang, A., Ed.; CRC Press: Kaohsiung, Taiwan, 2011. [Google Scholar]
- Horberry, T.; Anderson, J.; Regan, M.A.; Triggs, T.J.; Brown, J. Driver distraction: The effects of concurrent in-vehicle tasks, road environment complexity and age on driving performance. Accid. Anal. Prev. 2006, 38, 185–191. [Google Scholar] [CrossRef] [PubMed]
- Kuo, J.; Lenné, M.G.; Mulhall, M.; Sletten, T.; Anderson, C.; Howard, M.; Rajaratnam, S.; Magee, M.; Collins, A. Continuous monitoring of visual distraction and drowsiness in shift-workers during naturalistic driving. Saf. Sci. 2019, 119, 112–116. [Google Scholar] [CrossRef]
- Dingus, T.A.; Guo, F.; Lee, S.; Antin, J.F.; Perez, M.; Buchanan-King, M.; Hankey, J. Driver crash risk factors and prevalence evaluation using naturalistic driving data. Proc. Natl. Acad. Sci. USA 2016, 113, 2636–2641. [Google Scholar] [CrossRef]
- Angell, L.; Auflick, J.; Austria, P.; Kochhar, D.; Tijerina, L.; Biever, W.; Diptiman, T.; Hogsett, J.; Kiger, S. Driver Workload Metrics Project: Task 2 Final Report; DOT HS 810 635; Crash Avoidance Metrics Partnership (CAMP): Farmington Hills, MI, USA, 2006. [Google Scholar]
- Bosurgi, G.; Marra, S.; Pellegrino, O.; Villari, M. Drivers’ Workload Measures to Verify Functionality of Ferry Boats Boarding Area. Arch. Transp. 2020, 56, 7–17. [Google Scholar] [CrossRef]
- Gaspar, J.G.; Ward, N.; Neider, M.B.; Crowell, J.; Carbonari, R.; Kaczmarski, H.; Ringer, R.V.; Johnson, A.P.; Kramer, A.F.; Loschky, L.C. Measuring the useful field of view during simulated driving with gaze-contingent displays. Hum. Factors 2016, 58, 630–641. [Google Scholar] [CrossRef]
- Li, P.; Merat, N.; Zheng, Z.; Markkula, G.; Li, Y.; Wang, Y. Does cognitive distraction improve or degrade lane keeping performance? Analysis of time-to-line crossing safety margins. Transp. Res. Part F Traffic Psychol. Behav. 2018, 57, 48–58. [Google Scholar] [CrossRef]
- Simons-Morton, B.G.; Guo, F.; Klauer, S.G.; Ehsani, J.P.; Pradhan, A.K. Keep Your Eyes on the Road: Young Driver Crash Risk Increases According to Duration of Distraction. J. Adolesc. Health 2014, 54, S61–S67. [Google Scholar] [CrossRef]
- Birrel, S.; Fowkes, M. Glance behaviours when using an in-vehicle smart driving aid: A real-world, on-road driving study. Transp. Res. Part F Traffic Psychol. Behav. 2014, 22, 113–125. [Google Scholar] [CrossRef]
- Starkey, N.J.; Charlton, S.G.; Malhotra, N.; Lehtonen, E. Drivers’ response to speed warnings provided by a smart phone app. Transp. Res. Part C Emerg. Technol. 2020, 110, 209–221. [Google Scholar] [CrossRef]
- NHTSA. Visual-Manual Nhtsa Driver Distraction Guidelines for in-Vehicle Electronic Devices; NHTSA-2010-0053; National Highway Traffic Safety Administration: Washington, DC, USA, 2012; pp. 1–117.
- Cummings, M.L.; Bauchwitz, B. Safety Implications of Variability in Autonomous Driving Assist Alerting. IEEE Trans. Intell. Transp. Syst. 2022, 23, 12039. [Google Scholar] [CrossRef]
- Schreier, M.; Willert, V.; Adamy, J. Compact Representation of Dynamic Driving Environments for ADAS by Parametric Free Space and Dynamic Object Maps. IEEE Trans. Intell. Transp. Syst. 2016, 17, 367–384. [Google Scholar] [CrossRef]
- Bosetti, P.; Da Lio, M.; Saroldi, A. On Curve Negotiation: From Driver Support to Automation. IEEE Trans. Intell. Transp. Syst. 2015, 16, 2082–2093. [Google Scholar] [CrossRef]
- Li, X.; Lin, K.-Y.; Meng, M.; Li, X.; Li, L.; Hong, Y.; Chen, J. A Survey of ADAS Perceptions with Development in China. IEEE Trans. Intell. Transp. Syst. 2022, 23, 14188. [Google Scholar] [CrossRef]
- D.M. No. 6792, Norme Funzionali e Geometriche per la Costruzione Delle Strade (in Italian). Ministero Delle Infrastrutture e dei Trasporti: Rome, Italy, 2011.
- Kaber, D.B.; Liang, Y.; Zhang, Y.; Rogers, M.L.; Gangakhedkar, S. Driver performance effects of simultaneous visual and cognitive distraction and adaptation behaviour. Transp. Res. Part F Traffic Psychol. Behav. 2012, 15, 491–501. [Google Scholar] [CrossRef]
- Johansson, G.; Rumar, K. Drivers and road signs: A preliminary investigation of the capacity of car drivers to get information from road signs. Ergonomics 1966, 9, 57–62. [Google Scholar] [CrossRef] [PubMed]
- Johansson, G.; Backlund, F. Drivers and road signs. Ergonomics 1970, 13, 749–759. [Google Scholar] [CrossRef] [PubMed]
- Milosevic, S.; Gajic, R. Presentation factors and driver characteristics affecting road sign registration. Ergonomics 1986, 29, 807–815. [Google Scholar] [CrossRef]
- Shinar, D.; Drory, A. Sign Registration in Daytime and Nighttime Driving. Hum. Factors J. Hum. Factors Ergon. Soc. 1983, 25, 117–122. [Google Scholar] [CrossRef] [PubMed]
- Macdonald, W.A.; Hoffmann, E.R. Drivers’ awareness of traffic sign information. Ergonomics 1991, 34, 585–612. [Google Scholar] [CrossRef]
- Costa, M.; Simone, A.; Vignali, V.; Lantieri, C.; Bucchi, A.; Dondi, G. Looking behavior for vertical road signs. Transp. Res. Part F Traffic Psychol. Behav. 2014, 23, 147–155. [Google Scholar] [CrossRef]
- Shoman, M.; Simone, A.; Vignali, V. Looking behavior to vertical road signs on rural roads. MOJ Civ. Eng. 2018, 4, 75–79. [Google Scholar] [CrossRef]




| Driver | Age | Accidents | License | Myopia | Car Sickness |
|---|---|---|---|---|---|
| 1 | 29 | 1 | 11 | 1 | 0 |
| 2 | 29 | 0 | 10 | 0 | 1 |
| 3 | 21 | 0 | 4 | 0 | 0 |
| 4 | 28 | 0 | 10 | 0 | 0 |
| 5 | 21 | 0 | 3 | 0 | 0 |
| 6 | 21 | 0 | 3 | 0 | 0 |
| 7 | 21 | 0 | 3 | 0 | 0 |
| 8 | 25 | 0 | 7 | 1 | 0 |
| 9 | 21 | 0 | 3 | 0 | 0 |
| 10 | 27 | 0 | 8 | 0 | 0 |
| 11 | 27 | 0 | 9 | 0 | 0 |
| 12 | 25 | 0 | 7 | 0 | 0 |
| 13 | 22 | 0 | 4 | 0 | 0 |
| 14 | 20 | 0 | 2 | 0 | 0 |
| 15 | 20 | 0 | 2 | 0 | 0 |
| 16 | 28 | 0 | 10 | 0 | 0 |
| 17 | 25 | 1 | 7 | 0 | 0 |
| 18 | 29 | 1 | 10 | 0 | 0 |
| 19 | 24 | 0 | 5 | 0 | 0 |
| 20 | 27 | 0 | 9 | 0 | 0 |
| 21 | 27 | 0 | 9 | 0 | 0 |
| std dev | 3.31 | 0.36 | 3.12 | 0.30 | 0.22 |
| Warnings | Average Number of Fixations | Average Time per Single Fixation (s) | Maximum Time per Single Fixation (s) |
|---|---|---|---|
| Start Work zone | 1.45 | 0.41 | 0.44 |
| Speed Limit Work zone | 4.55 | 0.32 | 0.45 |
| End Work zone | 1.75 | 0.46 | 0.53 |
| Dangerous curve | 1.30 | 0.44 | 0.47 |
| Speeding (90 km/h) | 0.70 | 0.03 | 0.05 |
| High CO2 | 1.40 | 0.18 | 0.26 |
| Lane departure | 0.95 | 0.22 | 0.25 |
Disclaimer/Publisher’s Note: The statements, opinions and data contained in all publications are solely those of the individual author(s) and contributor(s) and not of MDPI and/or the editor(s). MDPI and/or the editor(s) disclaim responsibility for any injury to people or property resulting from any ideas, methods, instructions or products referred to in the content. |
© 2025 by the authors. Licensee MDPI, Basel, Switzerland. This article is an open access article distributed under the terms and conditions of the Creative Commons Attribution (CC BY) license (https://creativecommons.org/licenses/by/4.0/).
Share and Cite
Bosurgi, G.; Marra, S.; Pellegrino, O.; Sollazzo, G.; Ruggeri, A. Influence of ADAS on Driver Distraction. Vehicles 2025, 7, 103. https://doi.org/10.3390/vehicles7030103
Bosurgi G, Marra S, Pellegrino O, Sollazzo G, Ruggeri A. Influence of ADAS on Driver Distraction. Vehicles. 2025; 7(3):103. https://doi.org/10.3390/vehicles7030103
Chicago/Turabian StyleBosurgi, Gaetano, Stellario Marra, Orazio Pellegrino, Giuseppe Sollazzo, and Alessia Ruggeri. 2025. "Influence of ADAS on Driver Distraction" Vehicles 7, no. 3: 103. https://doi.org/10.3390/vehicles7030103
APA StyleBosurgi, G., Marra, S., Pellegrino, O., Sollazzo, G., & Ruggeri, A. (2025). Influence of ADAS on Driver Distraction. Vehicles, 7(3), 103. https://doi.org/10.3390/vehicles7030103


