Abstract
This research paper describes a new method to measure the groove wander effect on real concrete road surfaces using an Internal Drum Test Bench. Groove wander describes lateral forces resulting from interactions between a tire and the road surface texture. To create these lateral forces, the test bench induces a continuous lateral displacement of the tire on a textured road surface. It was found that the groove wander effect could be reproduced on a test bench. The presented method was shown to provide reproducible results that meet the expectations from previous studies. The overall findings of the measurements were that smaller tires and tires with longitudinally aligned profile show higher susceptibility to the groove wander effect.
1. Introduction
1.1. Road Surface Texturing in Germany
The importance of the federal highways for mobility and the economy in Germany is significant. Although highways currently account for only 6% of the entire German road network, at approx. 13,170 km, about 32% of traffic is carried on these roads [1]. Both asphalt and concrete construction methods are used on the highway network, with concrete accounting for approx. 28% [2]. Concrete road surfaces are particularly suitable for routes with a high proportion of heavy traffic, as the high material stiffness results in high deformation stability and load-bearing capacity. This results in constant material and service properties.
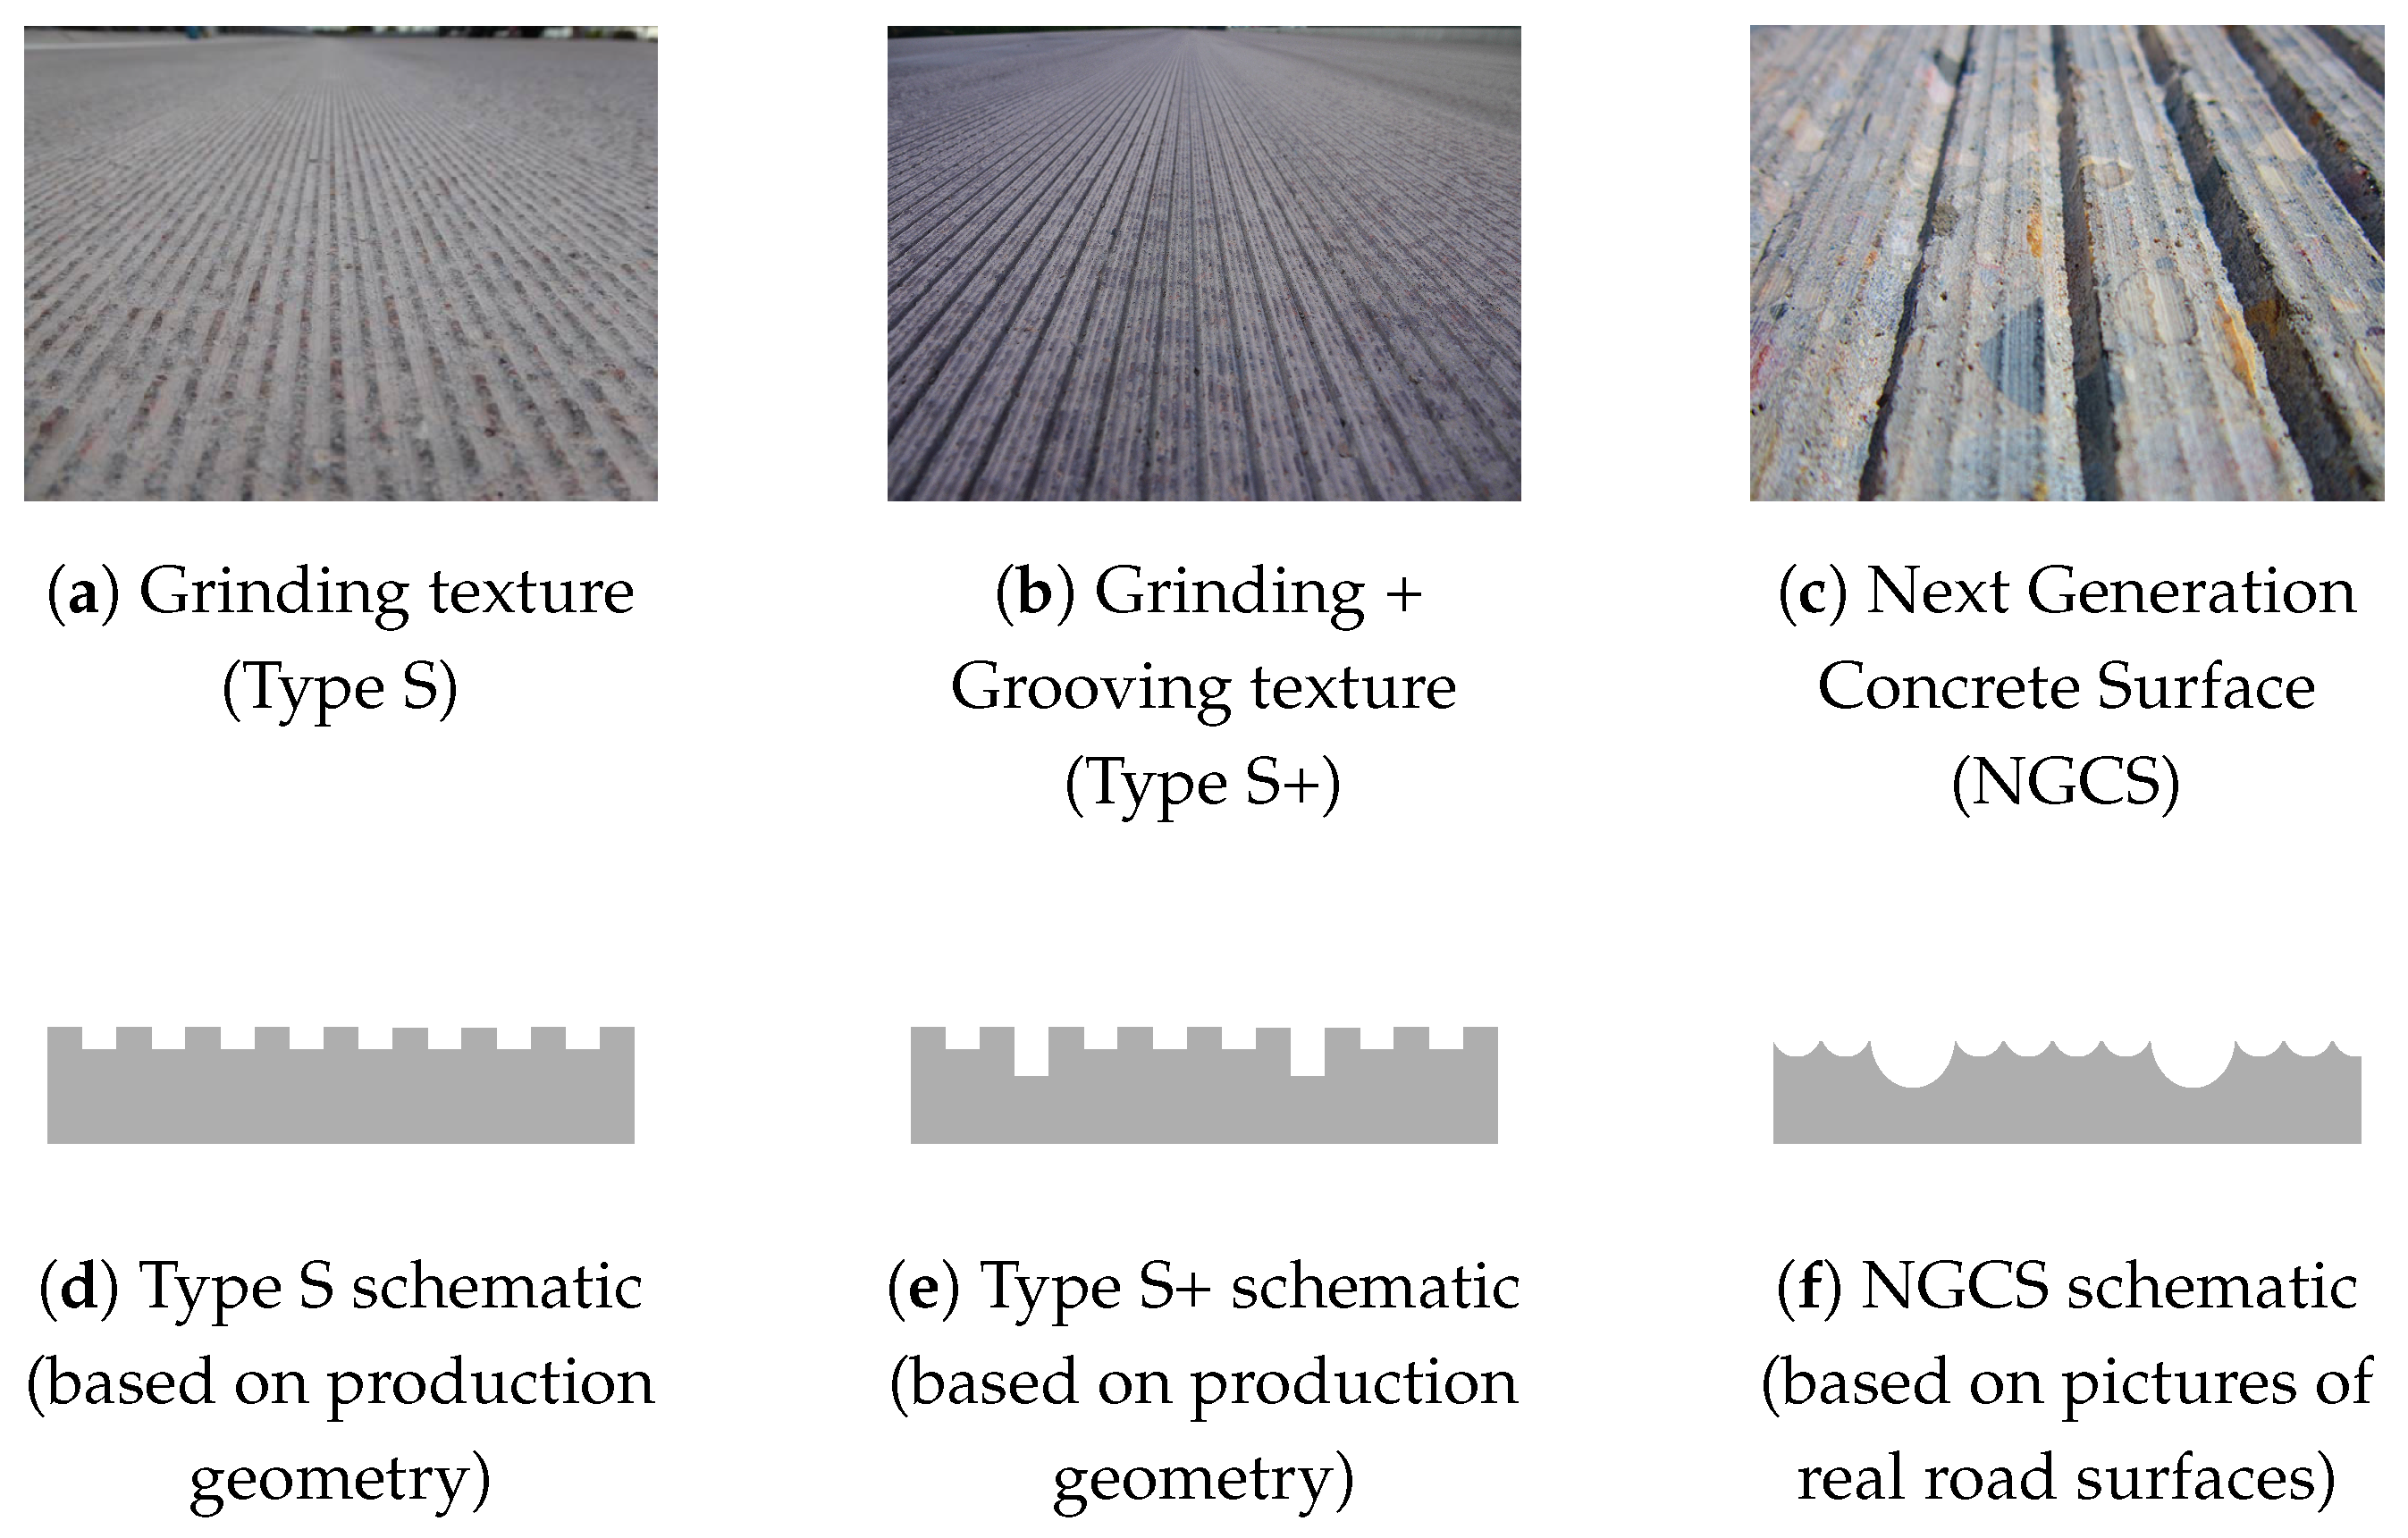
Since 2006, exposed aggregate concrete has been used as the standard construction method in concrete road construction. With the increasing importance of noise protection on roads, the production of low-noise surfaces using texture grinding Type Standard (Type S, Figure 1a) was developed as an alternative to exposed aggregate concrete construction. The reliable surface texturing process for producing parallel, longitudinally aligned grooves in hardened concrete produces concrete road surfaces with a durable grip and low rolling noise. Additional grooving Standard Plus (Type S+, Figure 1b) increases the drainage volume to reduce the risk of aquaplaning and optimize grip under wet conditions. Texture grinding can also be used to achieve an increased longitudinal evenness, which improves ride comfort for the driver on the one hand and reduces the dynamic impact factor on the other hand [3]. This reduces the load transfer into the road structure and thus protects the structure. Texture grinding for new concrete pavements was introduced in German regulations in 2023 and will be made a standard construction method by early 2026 [4].
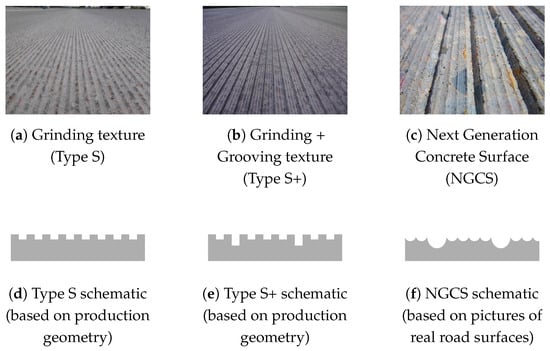
Figure 1.
Different road surface textures. The schematic illustrations (lower row) show the ideal texture without breakouts (images created by the authors). (a,d): Grinding texture Standard (Type S) [4], (b,e): Grinding + Grooving texture Standard Plus (Type S+), (c,f): Next Generation Concrete Surface (NGCS) [5].
With regard to the further development of the noise-reducing properties of longitudinally textured road surfaces, the focus is increasingly shifting to tire–road surface interactions. This requires a complex consideration of all road surface properties (including skid resistance, drainage capacity, tire abrasion, durability) in order to avoid conflicting objectives during optimization.
In the USA, very finely textured surfaces with grinding and grooving structure and increased noise reduction potential have been developed under the name Next Generation Concrete Surface (NGCS) (Figure 1c) [5,6]. This surface is also produced by diamond grinding and grooving, but with smaller ridges between the grooves than for the European surface Type S+ (see Figure 1). The texture developed in the USA has so far only been investigated in Germany in slightly adapted textures on short test sections, but has not been pursued further.
The tire–road interaction called “groove wander” can occur on surfaces with deeper (rain) grooves, such as NGCS or Type S+. The phenomenon is known in the US and South Korea, but has not been studied in detail yet.
1.2. State of Research
This section provides a broad review of literature on groove wander. The articles presented are listed chronologically by publication date.
Farnsworth (1969) states that in the USA, longitudinal grooving was used from the beginning of the 1960s to improve the properties of concrete pavements on highways. While it was meant to improve the coefficient of friction in the longitudinal direction and improve the drainage capacity, drivers reported complaints on these road sections already in the same decade. The complaints came from drivers of light vehicles or motorcycles. They had the feeling their tires ran as if they were on tracks. These complaints resulted from a phenomenon called groove wander effect. Farnsworth found that the strength of the effect is related to the groove width. Narrower grooves lead to less interactions [7]. Here, the tire tread interacts with the longitudinal grooves in the road surface. The vehicle experiences lateral acceleration and yaw moments if this interaction is strong enough. The driver perceives this movement as disruptive to steering precision [8].
Tarpinian and Culp (1977) investigated the influence of the tire tread pattern on the groove wander effect. They hypothesize that the profile edges drop into the road grooves and generate a lateral force before jumping out due to lateral movement causing groove wander. Furthermore, they came to the conclusion that the outer tire tread grooves have a higher impact on the resulting disturbance (=groove wander) than the inner grooves of the tread. In these experiments, they filled certain parts (inner/outer grooves) of the tire tread with self-curing rubber. Additionally, they developed a method called Coincidence Analysis which compares the lateral road surface texture with the tire tread pattern. Potential interactions between tread ribs and road grooves are marked and summed up to get a comparable value [9].
Oblizajek and Lauer (1984) presented an indoor test procedure to evaluate the groove wander performance of different tires. Therefore, they use a complete vehicle on a chassis dynamometer setup with an outer drum under the rear axis. One side of this drum is smooth, and the other side is grooved. So the rear right tire interacts with the grooved surface. The vehicle is slowly moved laterally on the drum, and the corresponding yaw attitude is measured. The measured yaw attitude shows a periodic behavior, as the authors had expected due to the regular groove spacing. In a second step, they perform measurements on a surface with a single groove. With this data, a diagnostic tool is developed to predict tire–road interactions for simple tire tread patterns. All results are validated through subjective road testing on grooved highways with the same vehicle [10].
Doi and Ikeda (1985) placed accelerometers on the rear frame of different motorcycles to measure the lateral acceleration due to groove wander. Interestingly, they discovered that tread grooves at the center of the tire have a stronger impact on groove wander than outer grooves, due to higher contact pressure in the middle, conflicting with the findings of Tarpinian and Culp. However, since the tires of motorcycles and cars are differently shaped, the coexistence of both theories still seems plausible. As a result, Doi and Ikeda developed a new tread pattern design for motorcycles with minimal groove wander and a calculation tool for screening new tread designs for groove wander sensitivity [11].
Peters (2001) gives a brief literature review of Tarpinian and Culp and Doi and Ikeda. He shows the limitations and the lack of explanation of the existing theories on groove wander, especially on how a tire tread with complex patterns, including minimal longitudinal grooves, impacts the interaction with road grooves. To address this, he introduces a method that emphasizes the lateral stress distribution within individual rubber blocks. When a tread block is compressed into a groove, it generates lateral stress, which subsequently produces a lateral force. Peters employs this lateral force to evaluate the tire tread’s performance concerning groove wander. To validate his approach, Peters utilizes a Flat Surface Tire Dynamics Machine (FSTDM) equipped with a grooved aluminum plank. In this test setup, the tire remains stationary while the plank is moved longitudinally. The lateral displacement of the test tires is achieved by inserting spacers of varying widths between the rim and the hub. For each lateral position, one tire revolution is completed. Then, the average lateral force is measured. The groove wander effect is quantified by comparing the peak-to-peak lateral force in a plot of the average lateral force over the lateral tire position on the plank. Peters’ findings are further confirmed through subjective tests. Afterwards, he applies his lateral stress theory to an FEA-based (Finite Element Analysis) model [8].
Nakajima (2003) gives a review of the work of Doi and Ikeda. He proposes a new theory for predicting groove wander using the calculation of lateral shear stress in the tire road contact. He also focuses on complicated practical tread pattern. To rate the groove wander effect, he uses the peak-to-peak value of the residual lateral force. The article examines several factors influencing this interaction, including the distance between tire and road grooves, tread pattern geometry, road groove distance, sipes, and rubber compound. The study finds that larger road groove distance improves performance (less groove wander). Zigzag tread patterns show better performance compared to straight groove patterns. It also indicates that sipes reduce the interaction and softer rubber compounds are found to perform better. The results were confirmed by subjective measurements [12].
Jeong et al. (2016) test different tires on different grooving geometries in subjective testing at 80km/h. They focus on tires with a pronounced longitudinal profile and corresponding longitudinal road grooves and consider constant wheel loads or free rolling. In the next step, they develop an FE model (Finite Element) to investigate the susceptibility of tire profiles and grooving geometries to the groove wander effect. Similar to Nakajima they use a peak-to-peak lateral force as a value for groove wander. With two tires, a parametric study is performed. As a result, they state that the groove width has bigger influence on groove wander than the groove distance [13].
Ryu et al. (2022) investigate the influence of different sets, consisting of road grooving geometry, vehicle and tire, on lateral vibrations of the vehicle. These accelerations result from the interaction between the tires and the road texture. In their investigation, they carried out road driving tests, test bench tests, and FE simulations. In preliminary tests, they defined a set of eight tires and six road grooving geometries for further investigations. In the driving tests, the accelerations in the vehicle were measured at various positions. At parallel, the subjective impression of the passengers was recorded. In addition, tests were carried out on a self-developed tire outer drum test rig. Steel rings corresponding to the tested texture were applied to the outer surface of the steel drum. The tests were carried out at 80km/h. The tire was moved laterally in increments of 1mm up to twice the groove distance. The same tests were simulated and evaluated in a FEM simulation. The study found that grooving textures with dimensions of (width × depth × distance) mm and cause minimal lateral vibrations (=groove wander) [14].
Table 1 provides an overview of the texture geometries examined in the literature listed above. If several textures were examined, the texture that was the focus of the research or the texture that showed the lowest susceptibility to groove wander was selected. For better comparability, specifications in inches have been converted to millimeters. The meaning of the given distances is explained in Section 2.2 below. The theoretical and practical approaches used have been summarized to provide a complete overview.

Table 1.
Overview of state-of-the-art research on groove wander (unit: ).
Note: In German regulations or publications, the groove distance is defined from inner edge to inner edge (edge-to-edge) [4]. To obtain the center-to-center distance, which is used internationally, one groove width must be added. For better international comparability, the center-to-center distance is used in this paper. This is described in Section 2.2.
1.3. Aim of This Article
This work provides a summary of relevant publications on the subject of the groove wander effect. The most important limitation that emerges from the literature described above is that no publication reports indoor test bench measurements on real road surfaces. Testing with vehicles or tires on steel outer drum test benches [10,14] and tire measurements on grooved aluminum planks [8] are known. The use of metal surfaces instead of concrete surfaces can influence tire–road interaction. On this basis, a method is to be presented for reproducing the groove wander effect on an Internal Drum Test Bench using concrete tracks. Furthermore, it aims to establish a metrological connection between a real road surface with a grinding and grooving texture in a test bench and the resulting dynamic lateral forces acting on the tire. As the tire is shifted laterally at a constant speed, the frequency of the grooves interacting with the tire is expected to be constant. This effect is to be worked out in this paper as well.
2. Test Setup and Methods
2.1. Internal Drum Test Bench
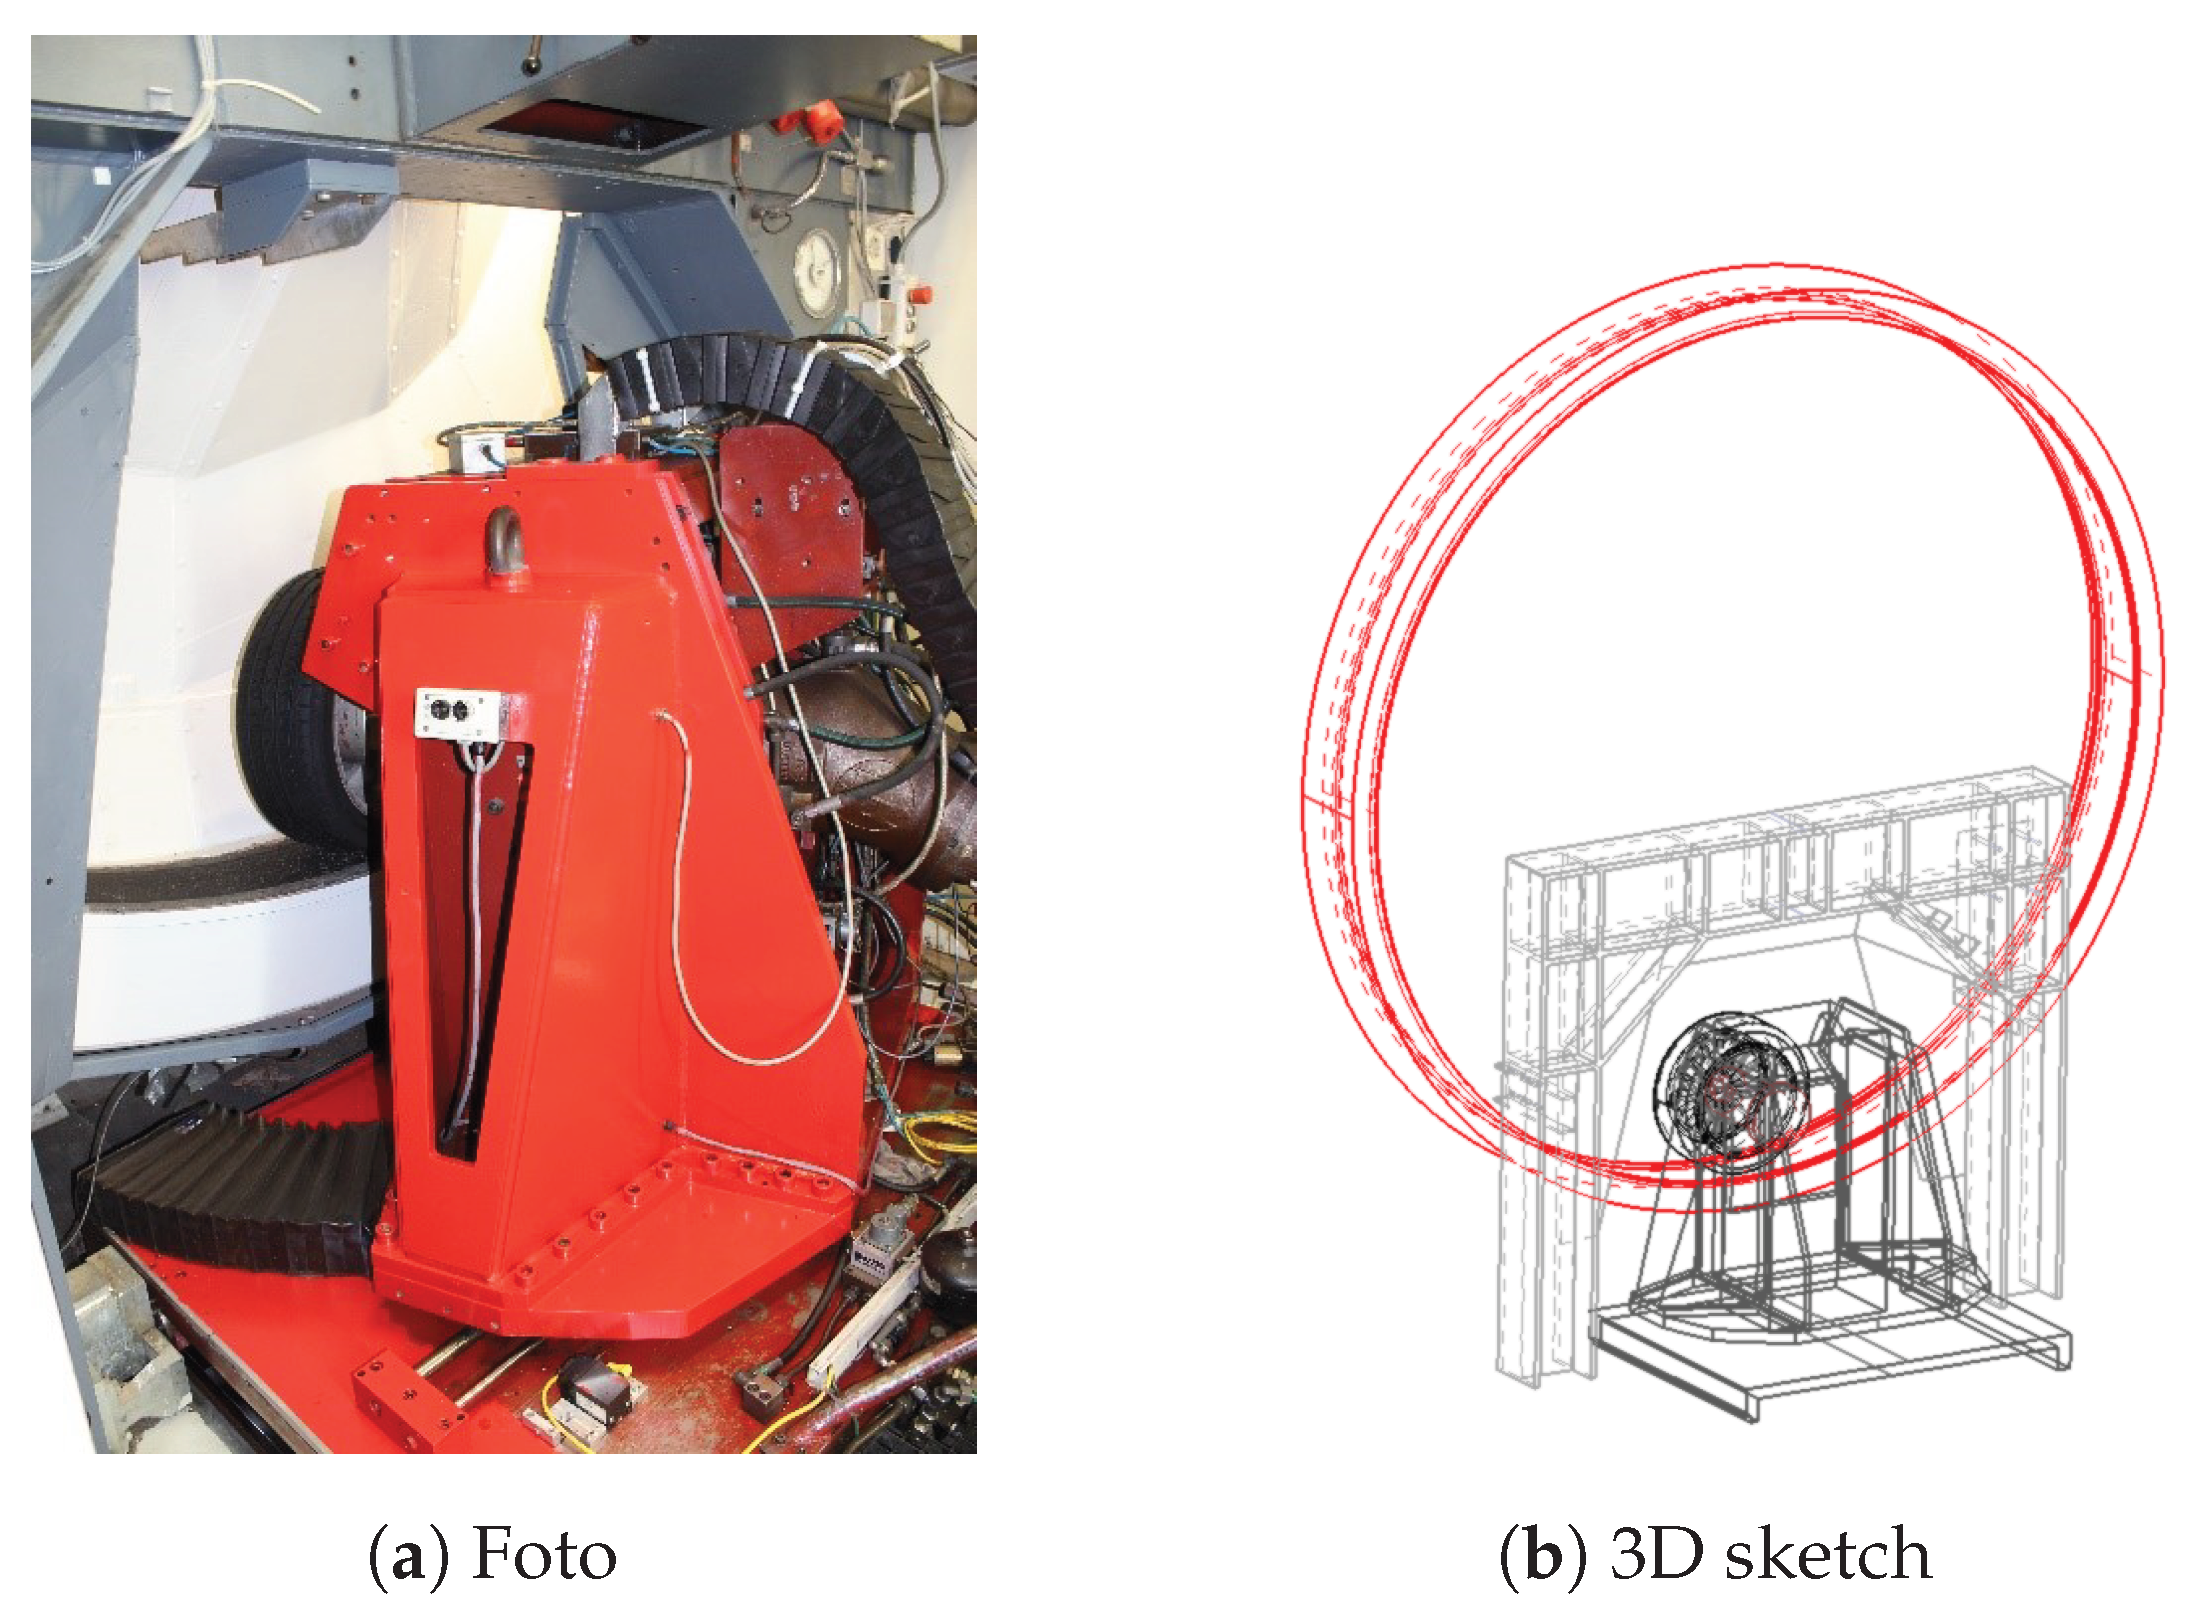
The testing setup utilized for all experiments was the Internal Drum Test Bench, as shown in Figure 2, situated at the Institute of Vehicle System Technology (FAST) within the Karlsruhe Institute of Technology (KIT). Only the inner drum principle is suitable for test benches with real road surfaces such as concrete or asphalt. When using an inner drum, the centrifugal forces generated at higher rotating speeds do not cause any damage to the road surface (e.g., chipping). The drum has an inner diameter of 3.80 m which results in a track length of 11.3 m. This large diameter ensures that the influence of the road curvature on the driving characteristics is very low and negligible. In addition, the tire and drum can be driven and braked separately, allowing driving and braking forces to be applied. Also, wheel load, slip angle, and camber angle can be applied. The forces and torques acting on the wheel are acquired through rotating measuring bolts in the measuring hub in the wheel suspension by a six-component measuring hub and are therefore free of frictional influences from the powertrain.
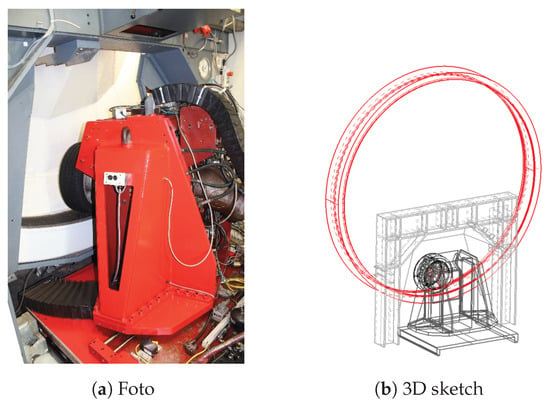
Figure 2.
Internal Drum Test Bench at KIT-FAST. (a): Photo of the Internal Drum Test Bench [15]. Background: inner drum (white) with mounted road (black). Foreground: test bench sled (red) with mounted tire. (b): 3D sketch of the Internal Drum Test Bench [16]. Red: inner drum; grey: portal which holds drum bearing; black: test bench sled with mounted tire (movable in lateral direction).
For standard measurements, the position of the test bench sled (colored black in Figure 2) is locked, so the lateral position of the tire on the road track is fixed. The Internal Drum Test Bench underwent modifications as part of this project to investigate the groove wander effect. In addition to the original manual control option of lateral displacement using one hydraulic cylinder, a second identical hydraulic cylinder, a precision servo valve, and a digitally controllable controller were added to the test bench setup. The hydraulic cylinders move the test bench sled relatively to the internal drum to induce lateral displacement of the tire on the road surface. With this new setup, the test bench computer can control the lateral displacement of the tire with a precision <1 mm. With this modification, the oscillation of a driver within their lane can be simulated. For this purpose, the driving profile presented in Section 2.4 is driven by the test bench computer.
2.2. Road Surface Textures
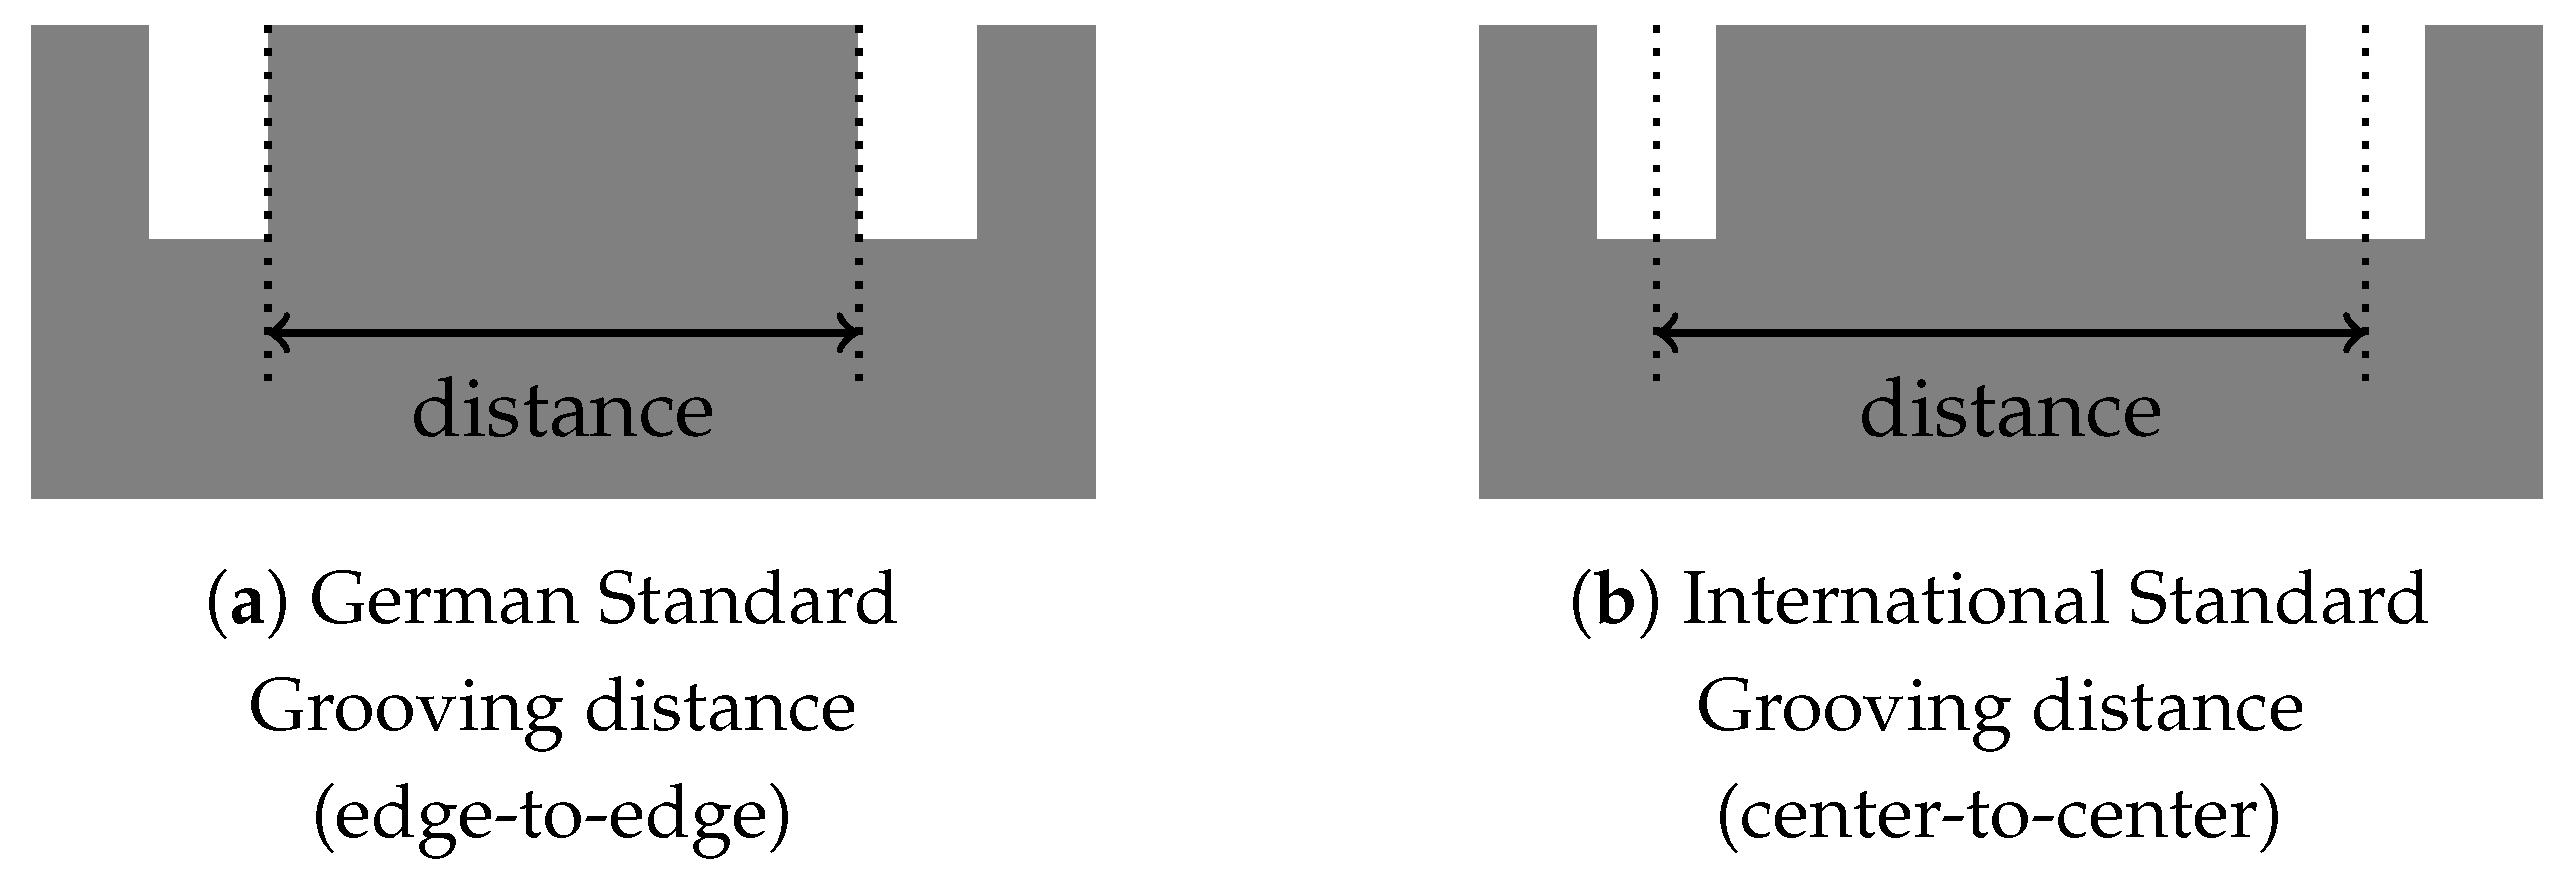
First, the basic geometries of a textured road are defined for the textures used. Figure 3 shows the difference between the German and the international definition of the groove distance.
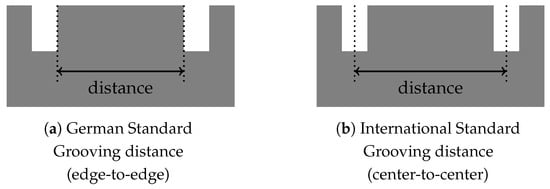
Figure 3.
Difference between grooving distance definition.
In Germany, the distance from inner edge to inner edge is specified [4], whereas internationally the center-to-center distance is used [7,8,11,13,14]. To obtain the international distance, the length of one groove width is added to the German edge-to-edge distance so that a direct comparison to international standardized dimensions is possible. Only the international distance is used throughout this paper (refer to Figure 4 and Figure 5).

Figure 4.
Grinding texture, schematic (German Type S (2,4/2,2)). 1: Width, 2: Distance, 3: Depth.

Figure 5.
Grinding with Grooving texture, schematic (German Type S+ (2,4/2,2; 2,4/16)). 1: Width, 2: Distance, 3: Depth.
Another difference between the textures from literature and the textures used in Germany is that a pure (rain) grooving texture is rarely used in Germany. On German highways, a grooving texture is almost always combined with a grinding texture (see Figure 5).
For the test setup presented in this paper, concrete surfaces were manufactured for the Internal Drum Test Bench. Initially, an exposed aggregate concrete (EAC) surface with a maximum grain size of 8mm was chosen (MPD value 0.79 mm). This surface was tested as a non-textured reference surface. For comparison of the road surfaces, the MPD value was measured at 12 positions within the internal drum using a laser-based texture depth measurement device.
For further testing, a grinding structure was applied (see Figure 4). The chosen geometry was based on manufacturing parameters of real road surfaces applied on the German highway (texture named Type S). The measured MPD value is 0.93 mm.
In the next step, a grinding with grooving texture (texture named Type S+) was examined (see Figure 5). The geometry was also based on a real road surface used on German highways. The grinding parameters are the same as mentioned above for Type S (see Figure 4). For the (rain) grooving structure, the width of the grooves (1) is also 2.4 mm with a distance (2) of 18.4 mm. This means every fourth groove is deeper. The measured MPD value for this texture was 1.62 mm.
2.3. Tires
Figure 6 shows the footprints of the tires used in the first test bench trials. Three standard tires were selected that were available in the same dimension (16″). There are two winter tires: Tire 1 with a longitudinally aligned tread and Tire 2 with a V-shaped pattern. Additionally, there is one summer tire, Tire 3, with a longitudinal tread pattern. In addition, Tire 4 was identified in prior subjective tests as being particularly susceptible to groove wander. This winter tire is smaller and narrower (13″) and has also a longitudinally aligned tread pattern.

Figure 6.
Footprints of the tires used on the Internal Drum Test Bench. The footprints were made on a flat surface. The wheel load was set to 60% of the respective tire load index at an inflation pressure of 2.5 bar.
During the tests, all tires are tested at an inflation pressure of 2.5 bar (standard reference). The wheel load is selected based on the effective wheel load on a rear axle as 60% of the respective load index (LI) of the tire.
2.4. Method
In order to measure the tire–road interaction on the Internal Drum Test Bench, which is obtained, for example, during lane oscillation and which causes the groove wander effect, the tire must move laterally to the road surface texture while driving. When driving on real roads, a driver can never align the tires perfectly parallel to the road surface texture. A regulation for the lateral displacement of the tire was created for this purpose. This control moves the tire laterally to the direction of speed using a triangular function (see Figure 7). The triangular function was chosen because it achieves a constant lateral speed, so that there is no dynamic influence of the lateral speed change. This makes it easier to compare the set lateral speeds in further research. The amplitude was set to 50 mm in consideration of the track width constraints in the Internal Drum Test Bench.

Figure 7.
Lateral displacement of the tire during test procedure.
The methodology used to quantify the intensity of the groove wander effect is derived from the research conducted by Peters, Nakajima, and Jeong et al. [8,12,13]. In their investigations, the “Peak-to-Peak Lateral Force” () was utilized as a metric to assess the groove wander effect. A substantial disparity between the maximum and minimum lateral forces indicates an inconsistent tire behavior across the grooves, thereby signifying a pronounced influence of groove patterns on driver perception.
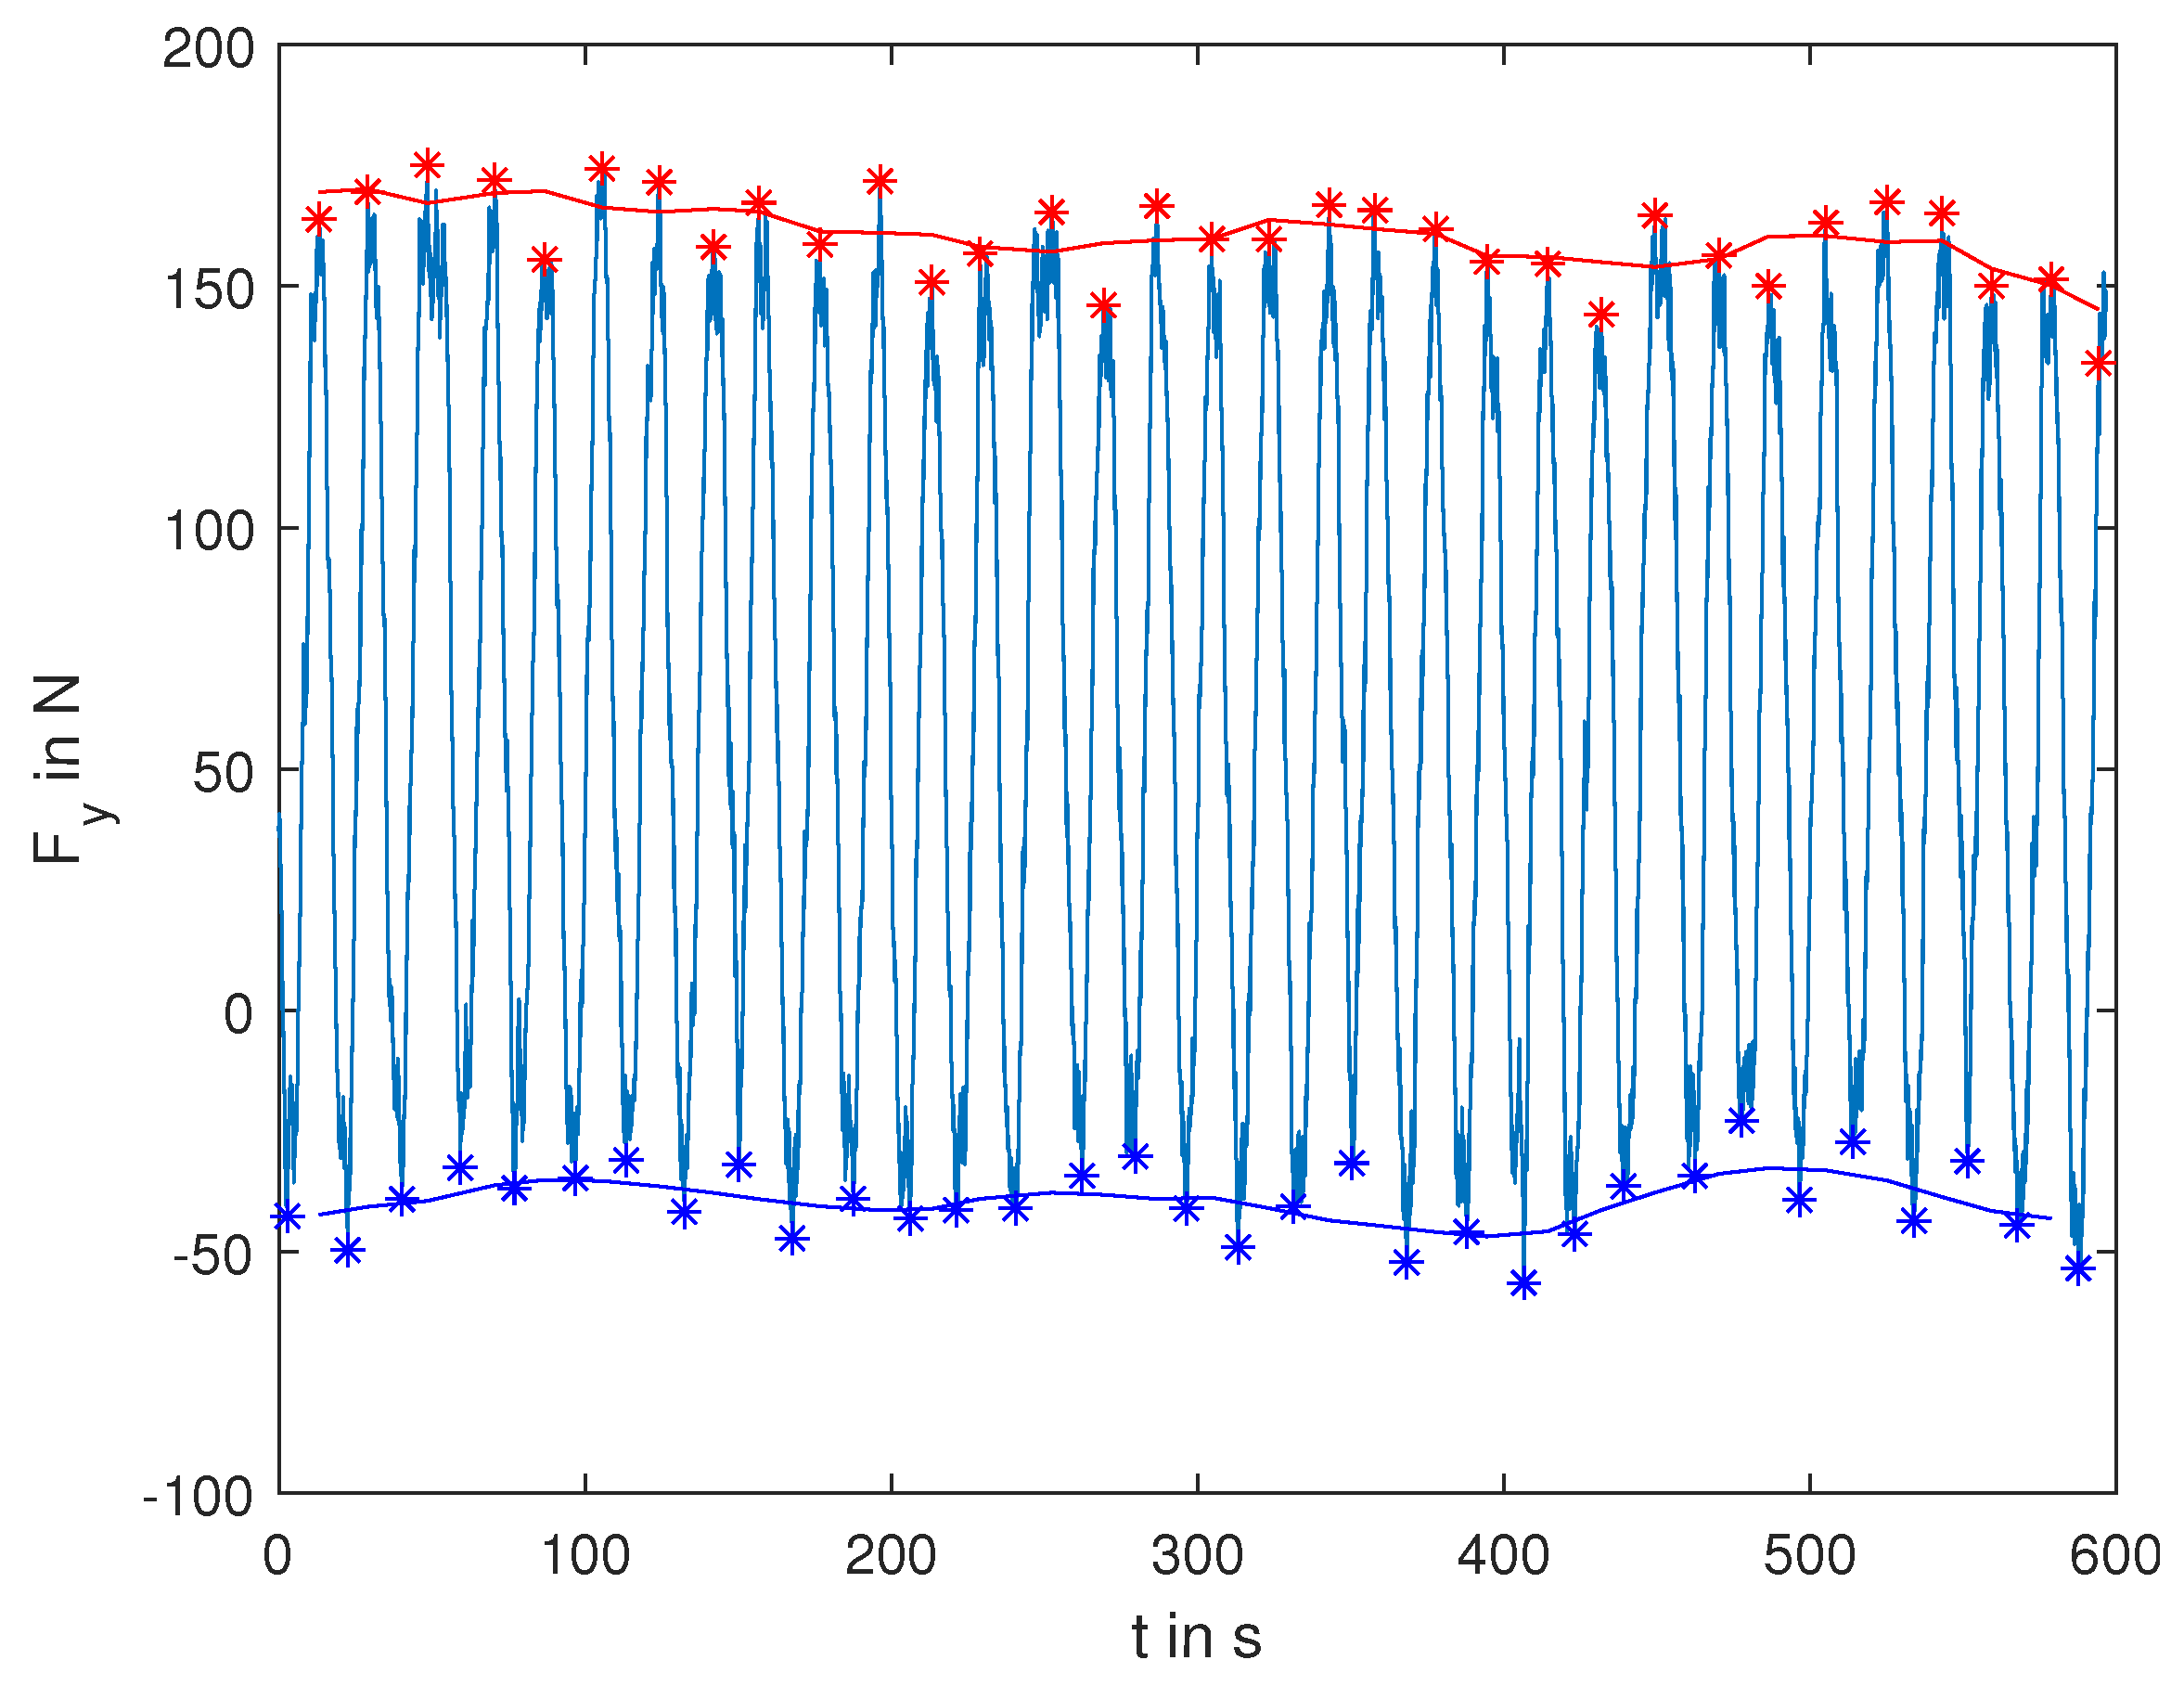
In the presented evaluation, all local minimum and maximum points were identified. The resultant points were then utilized to compute the moving mean values of each maximum and minimum lateral forces. This procedure is depicted in Figure 8.
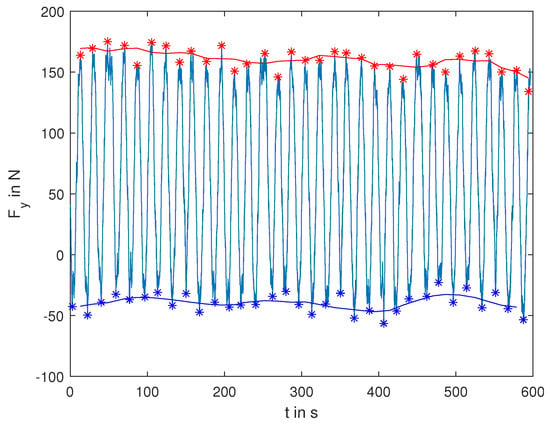
Figure 8.
Exemplary measurement of Tire 4 on the Internal Drum Test Bench with a Type S+ texture installed. Lateral force over time. Minima (blue) and Maxima (red) and their respective moving mean marked. The test was run at , and of tire’s LI.
The mean distance between these moving mean curves over time of measurement is denoted as the groove wander parameter , which serves as a central metric in the next chapters of this work. For the given example measurement, the groove wander parameter is calculated as the difference between the mean value of the maxima and the mean value of the minima as follows: .
3. Results
3.1. Frequency of Interaction
Since the tire is expected to interact with the deeper (rain) grooves of the grinding and grooving texture, a repeating pattern in the lateral force should be visible. The period of this oscillation must coincide with the time between two adjacent grooves interacting with the tires tread. This correlation has already been observed in prior experimental studies conducted by Oblizajek and Lauer and Peters [8,10].
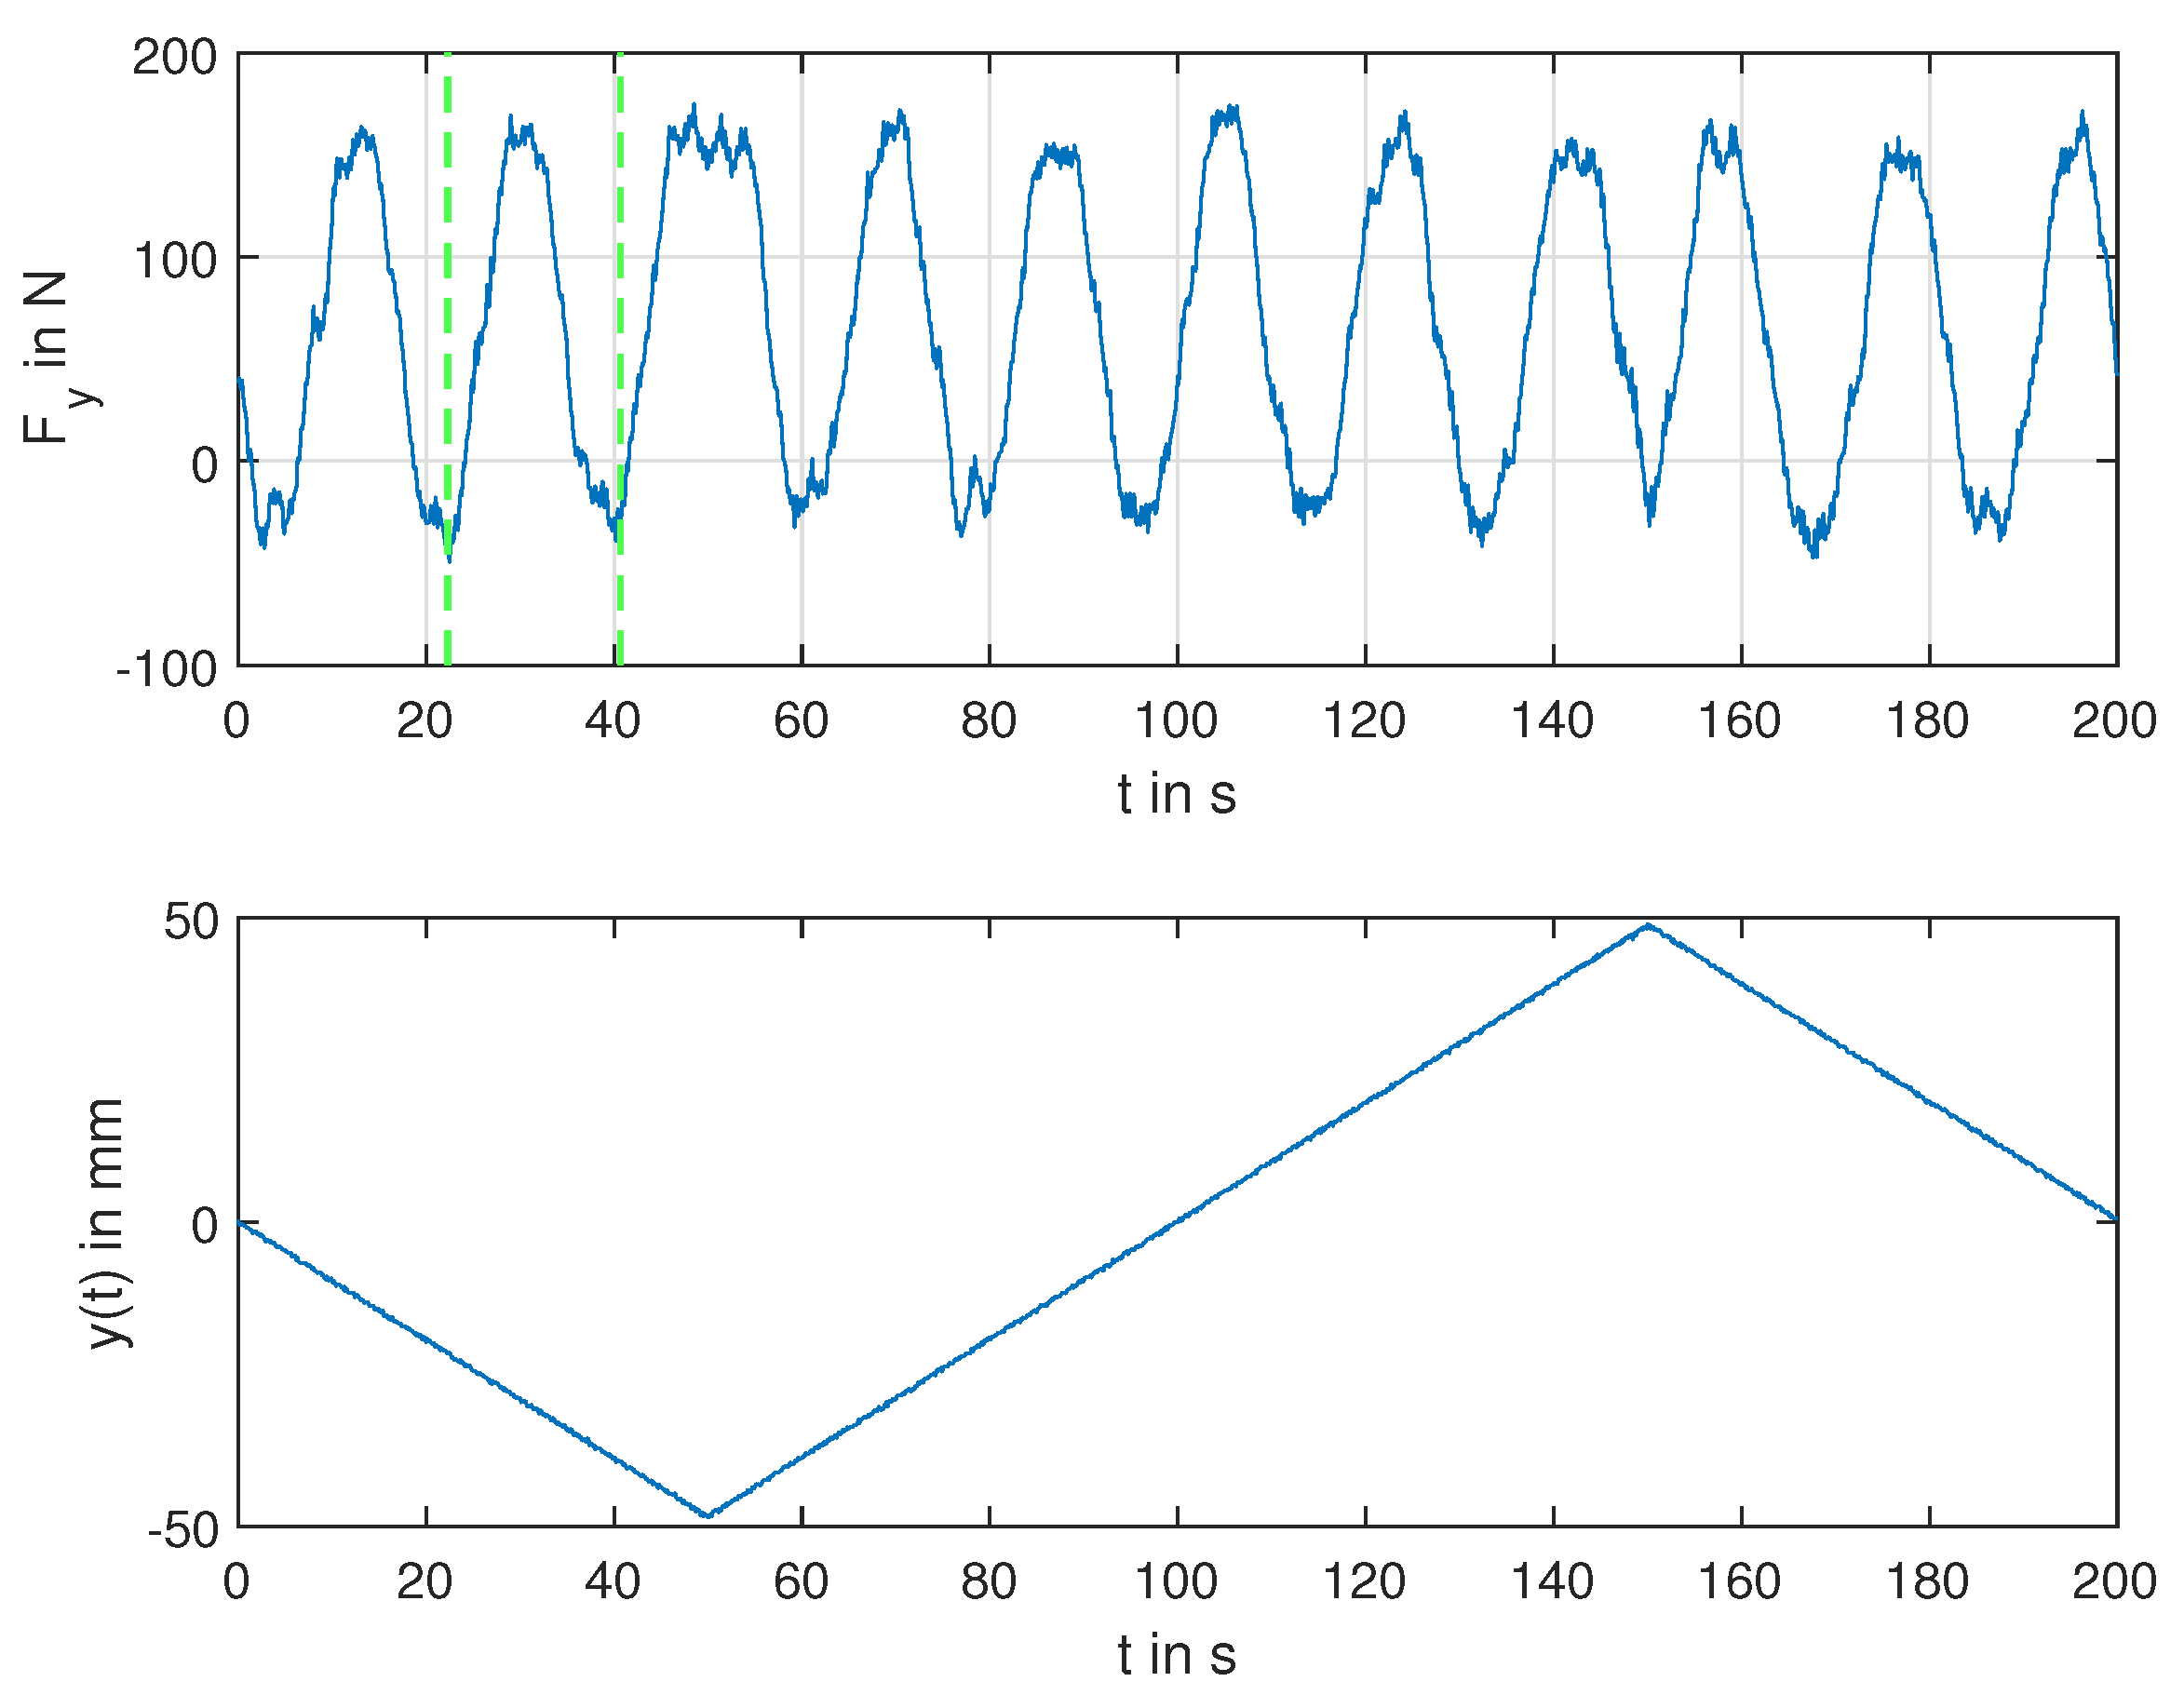
The period duration T is calculated using the distance between the grooves and the speed in lateral direction according to the following formula: . For a groove distance of mm and a speed of the lateral displacement of , T equals to s. As displayed in the upper graph of Figure 9, the calculated period duration T is equivalent to the measured period of s (green lines).
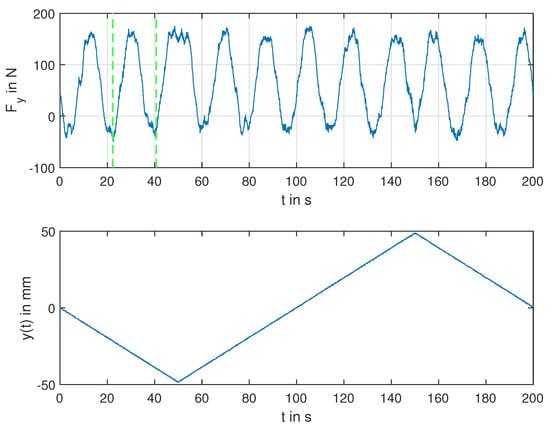
Figure 9.
Lateral force (upper) and lateral position (lower) of an exemplary measurement (extract) of Tire 4 measured on the Internal Drum Test Bench with a Type S+ (grinding with grooving) texture installed. The groove distance is reflected in the peaks of the lateral force (green lines). The test was run at , and of tire’s LI.
3.2. Reproducibility
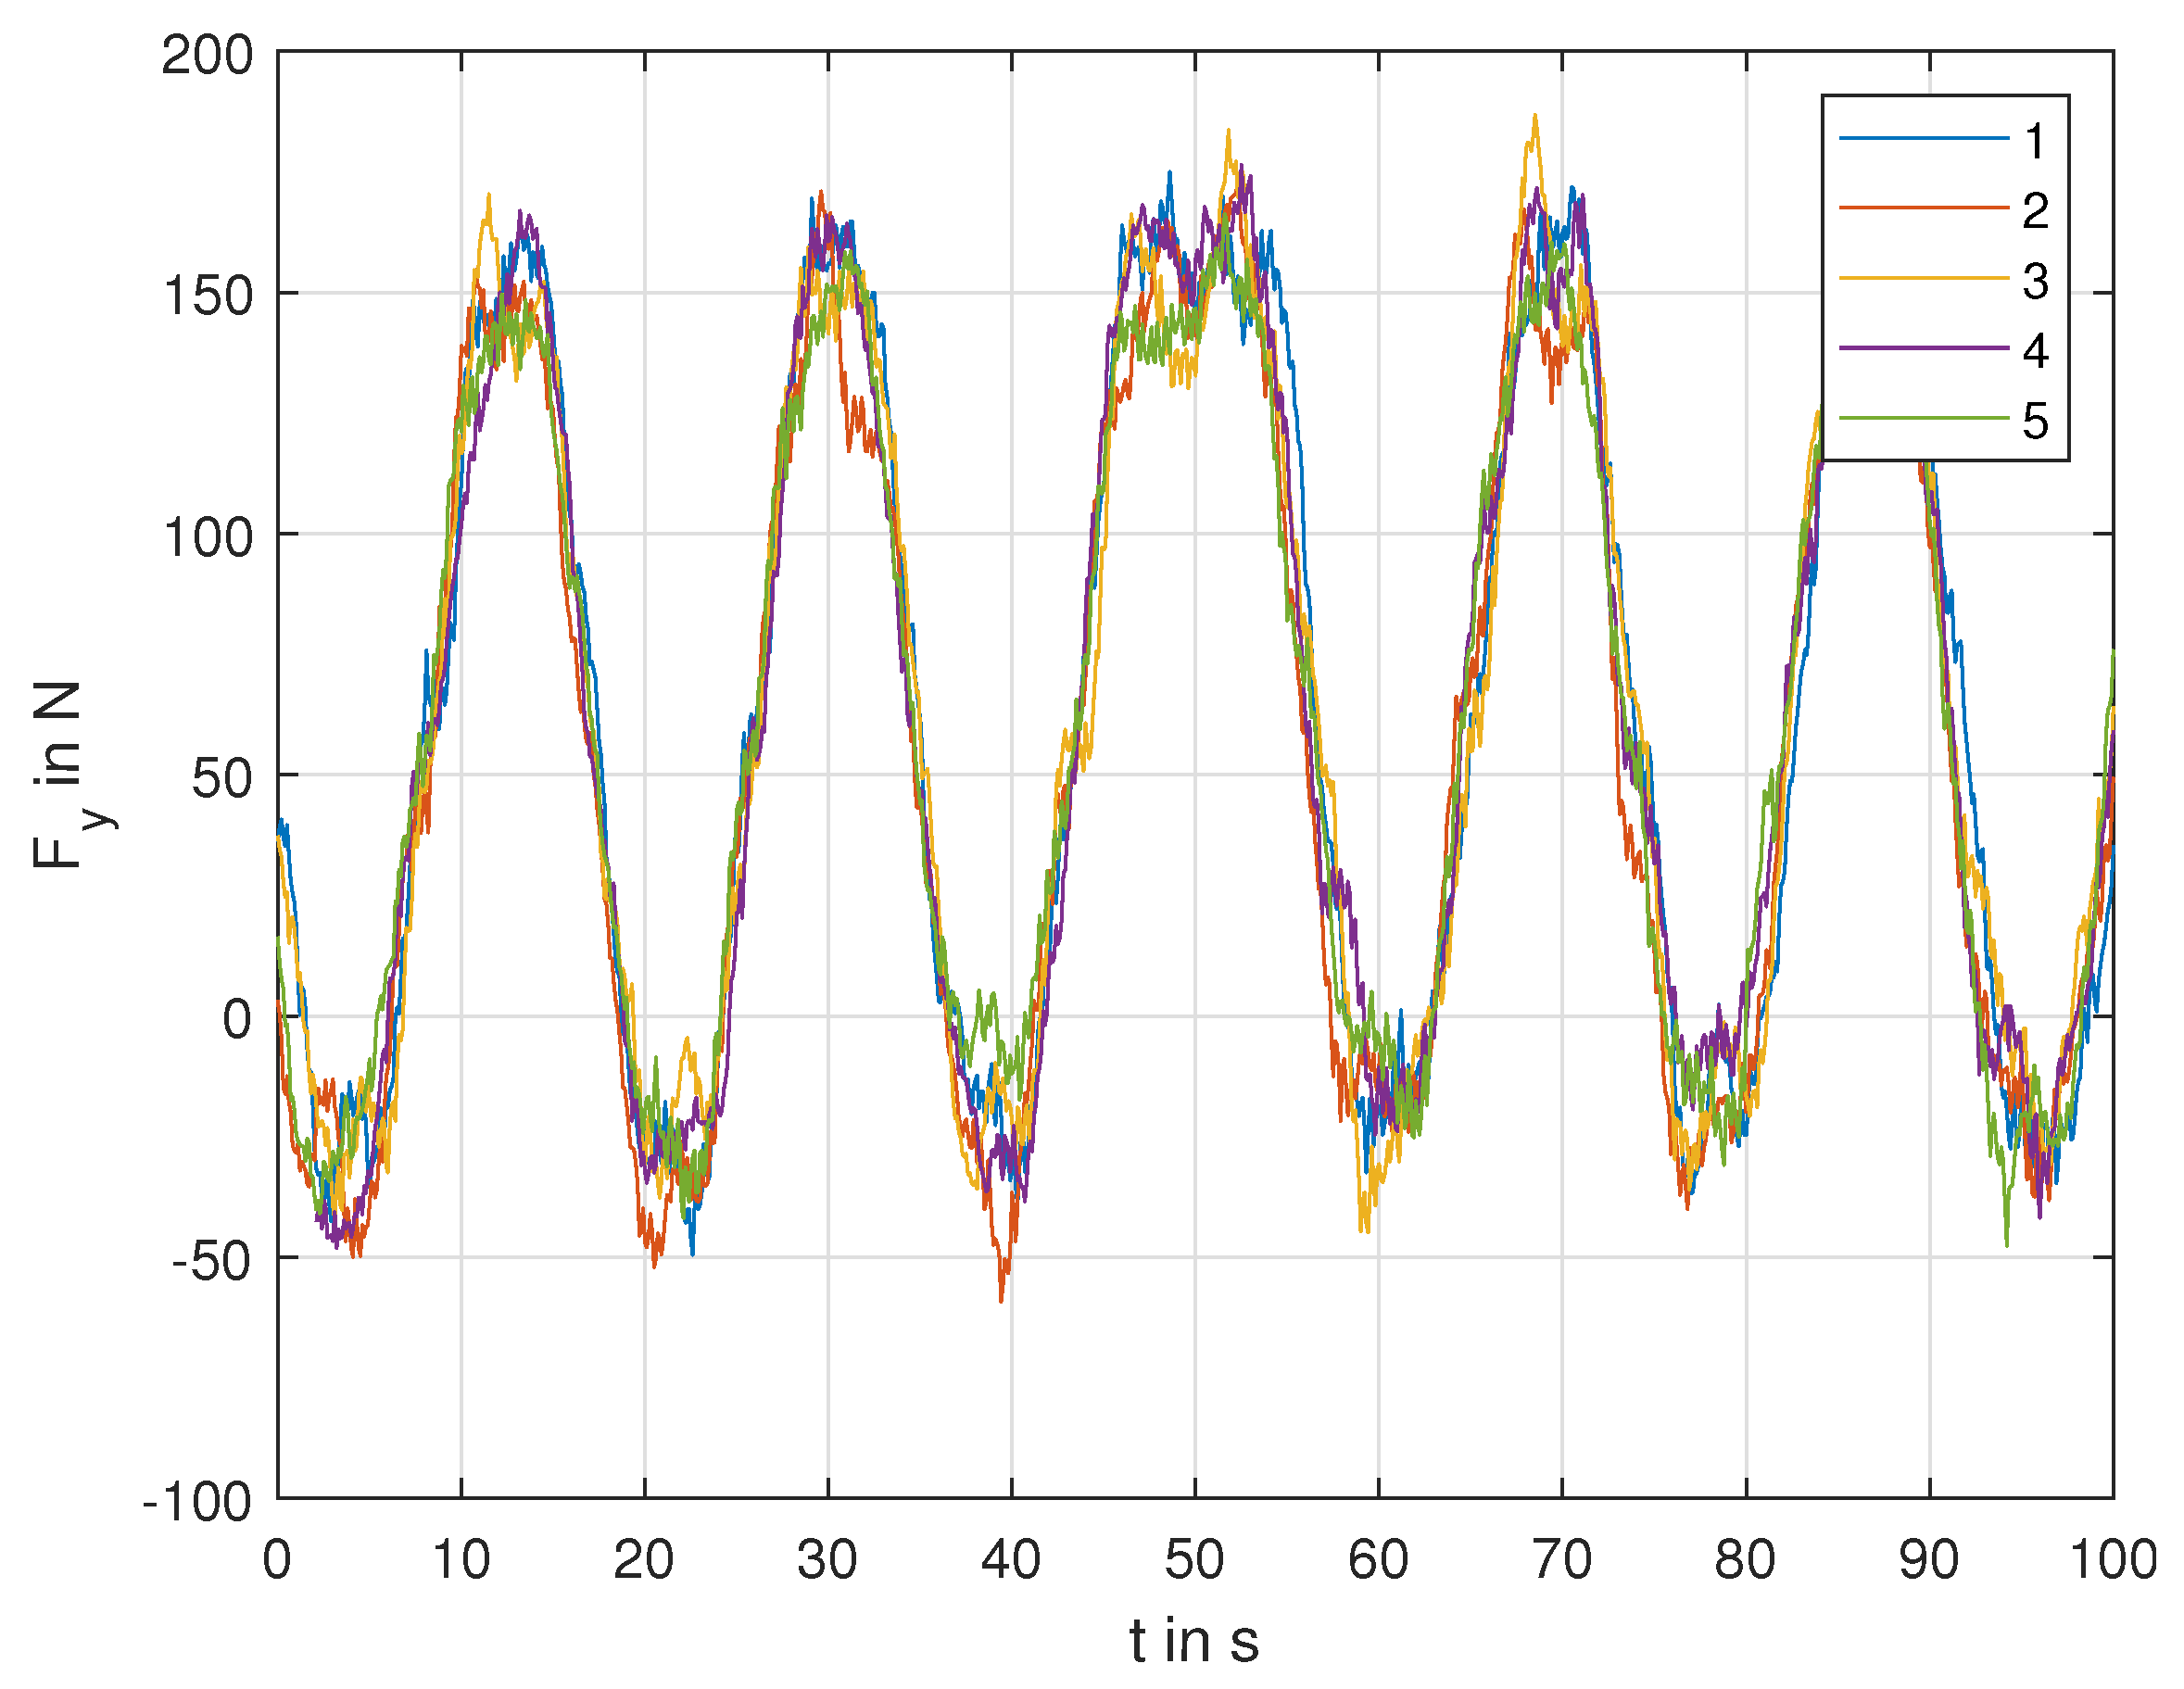
To test the robustness of the method and the test setup on the Internal Drum Test Bench, the experiments were repeated five times with the same parameters. Measurement 1 equals the results already shown in Figure 8 and Figure 9. A part of the measurement series is shown in Figure 10. It can be seen that the curves are very well aligned and the interaction of the different measurements has the same frequency. The results are only slightly unequal at the peaks. This can be caused by minor breakouts in the road texture. At the turning points of the lateral movement (around , see lower graph of Figure 9), the peaks are somewhat broader and noisy. This is caused by the change in lateral direction.
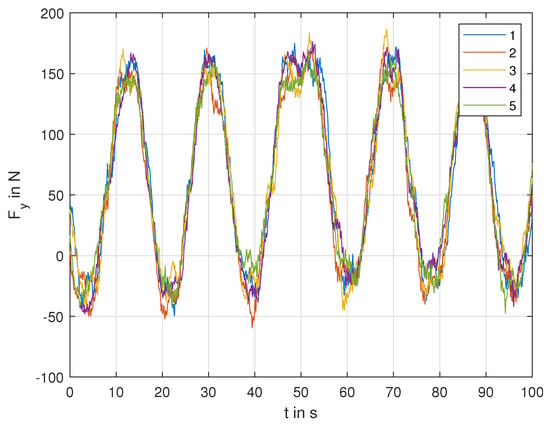
Figure 10.
Reproducibility of experiments on the Internal Drum Test Bench. Five test runs were performed with Tire 4 with the same test settings. Measurement 1 equals the one shown before. All tests were run with Tire 4 at , and of tire’s LI.
The calculated error is less than 2% over the entire measurement period with a groove wander parameter of . It was thus demonstrated that the measurement method is robust and provides reproducible results.
3.3. Influence of Surface Textures
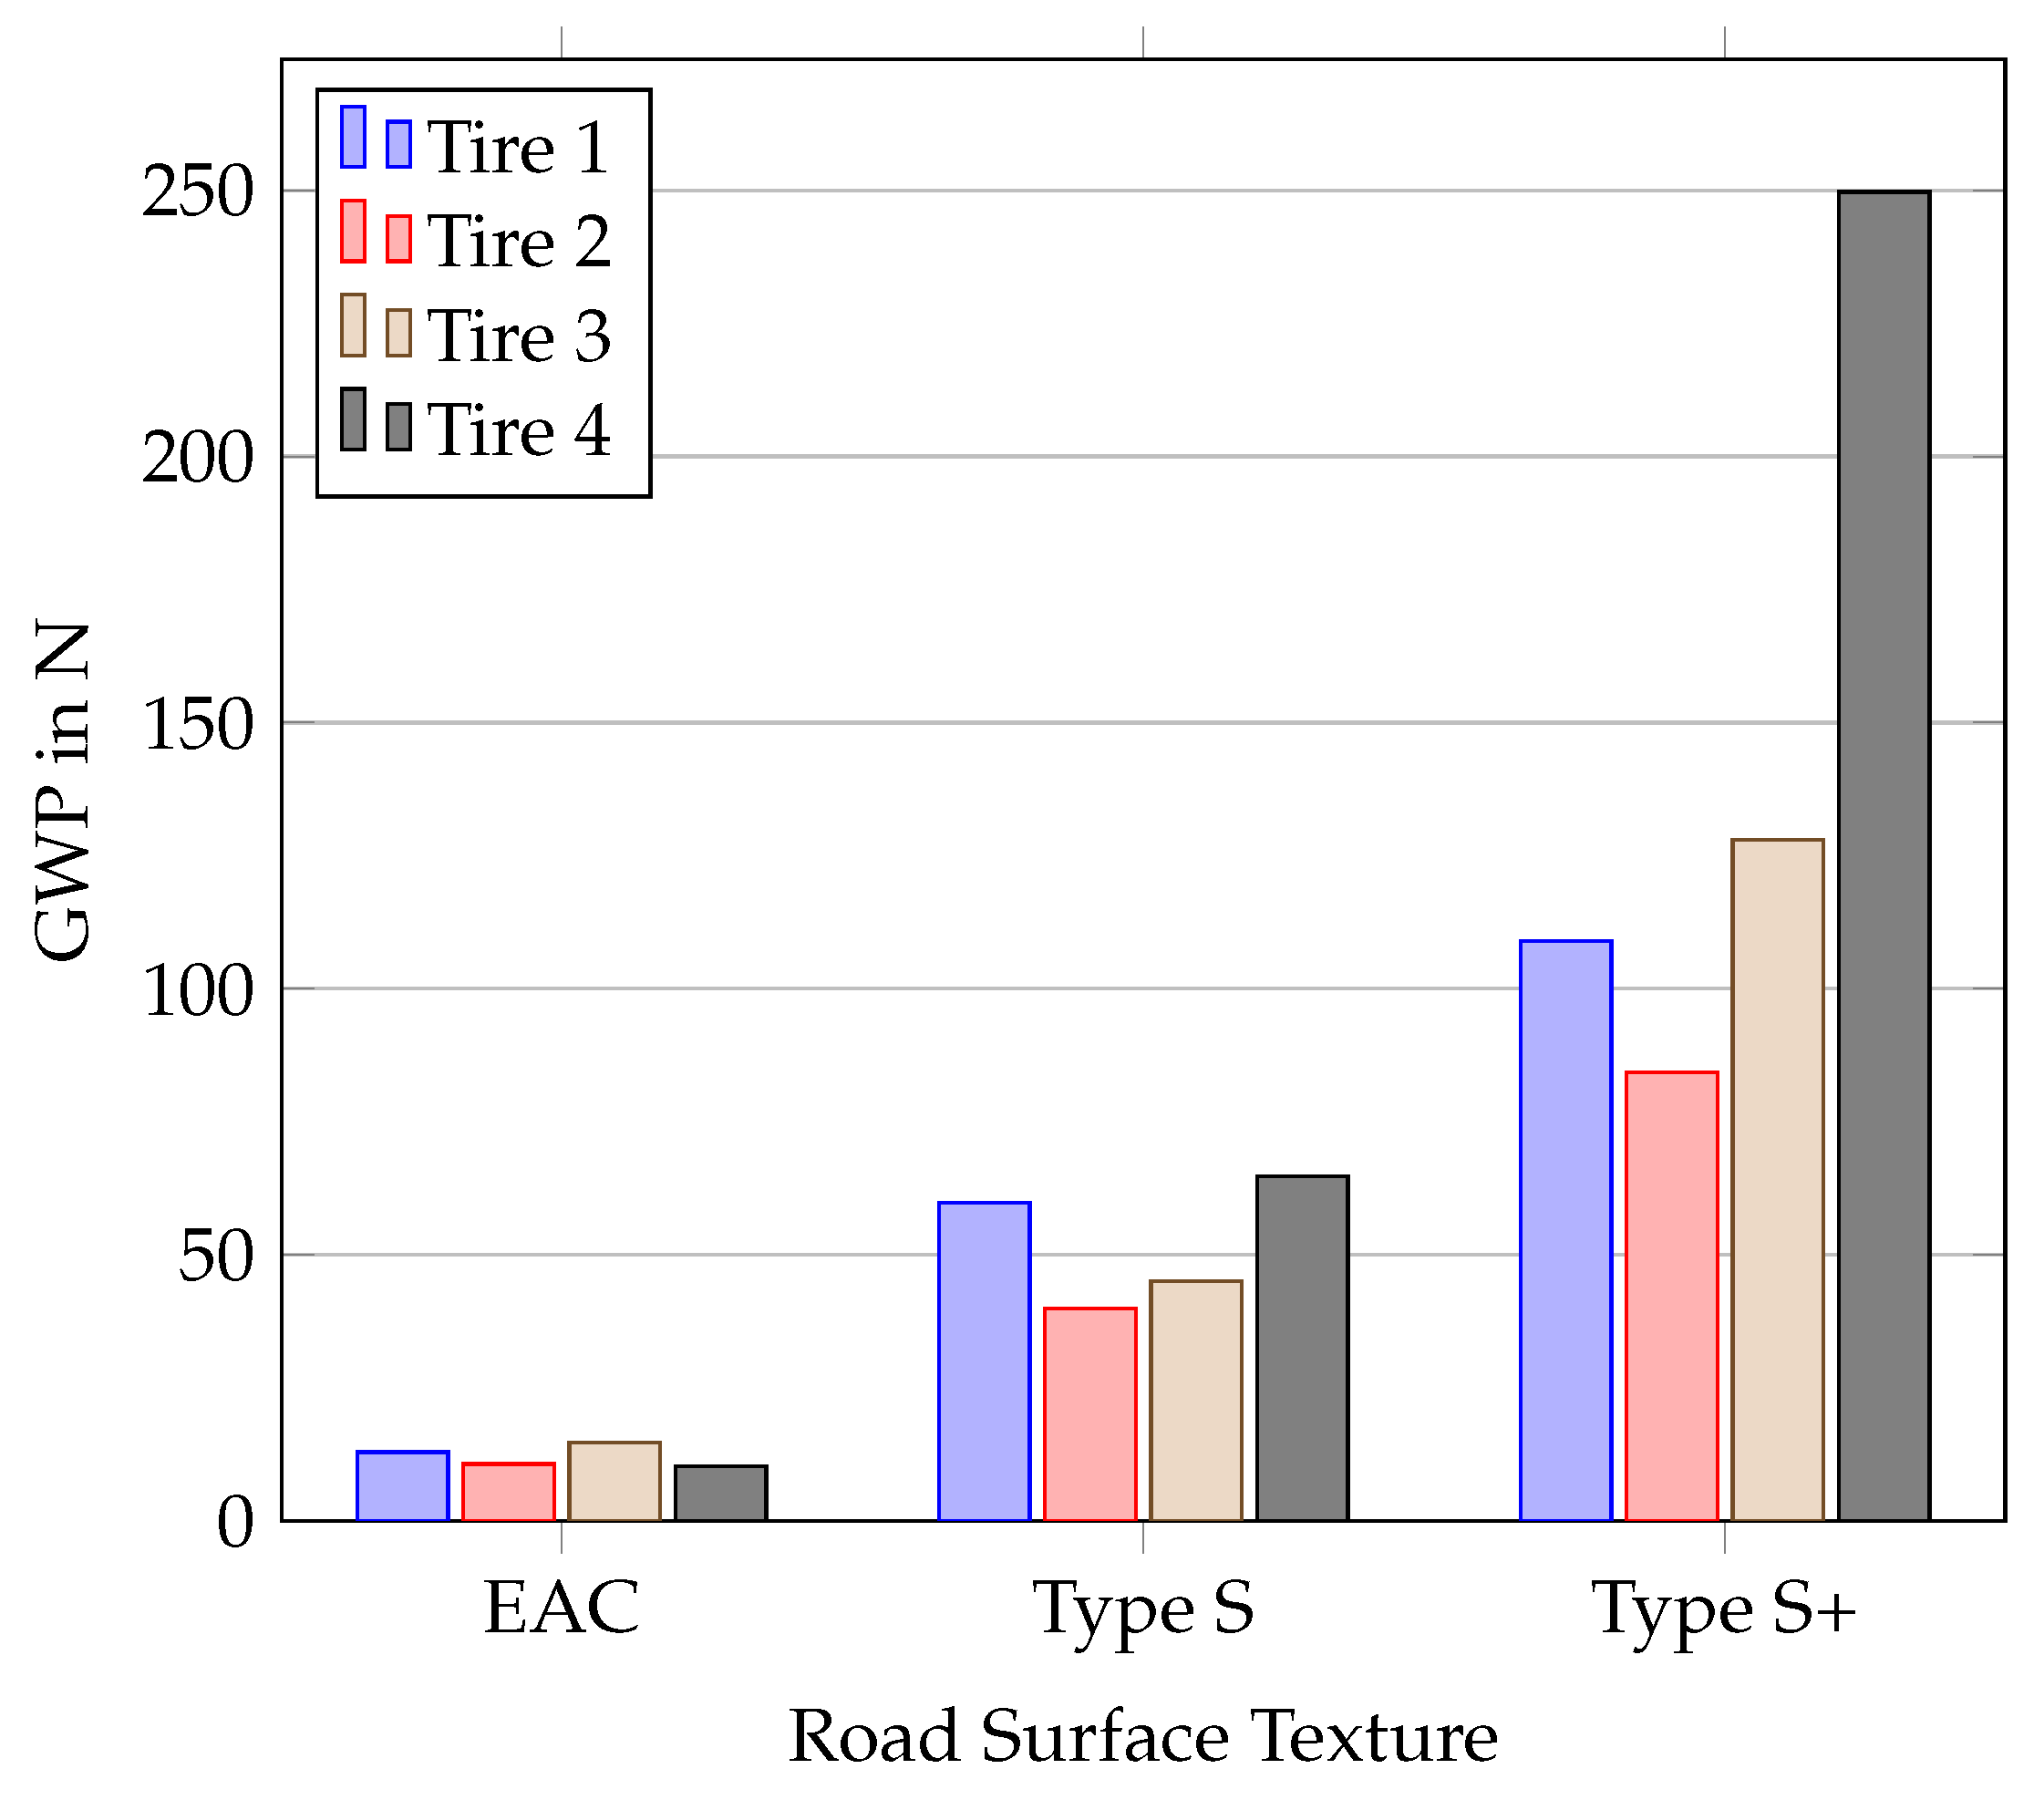
In order to evaluate the groove wander effect, exposed aggregate concrete (EAC) was used as an untextured reference. Here, no significant interaction between the tire and the road surface is expected. For the four tires used in this study, the groove wander parameter for different road surface textures was measured. The resulting GWP are displayed in Figure 11 for the three road surfaces.
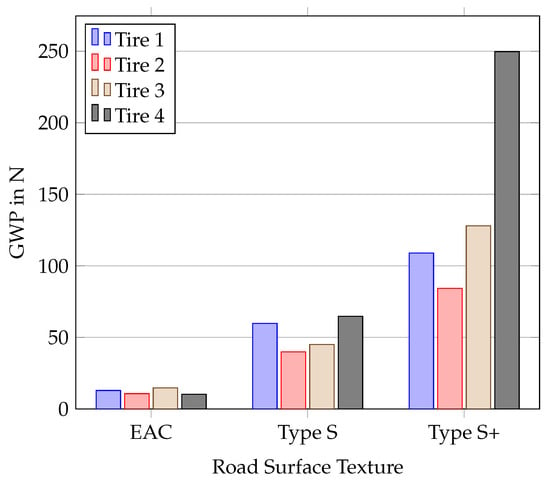
Figure 11.
Groove wander parameter for the given tires on three different road surfaces. All tests were run at , and of tire’s respective LI.
As anticipated, the interaction between the tire and the EAC road surface is minimal, resulting in small measured groove wander parameter (around 10N) across all four tires. This influence is caused by the resulting small slip angle.
On the grinding surface (Type S), a low interaction of the tire profiles with the grinding structure is expected. This also results in higher groove wander parameter than measured on EAC. The measured GWP is in a range of 40 N to 60 N.
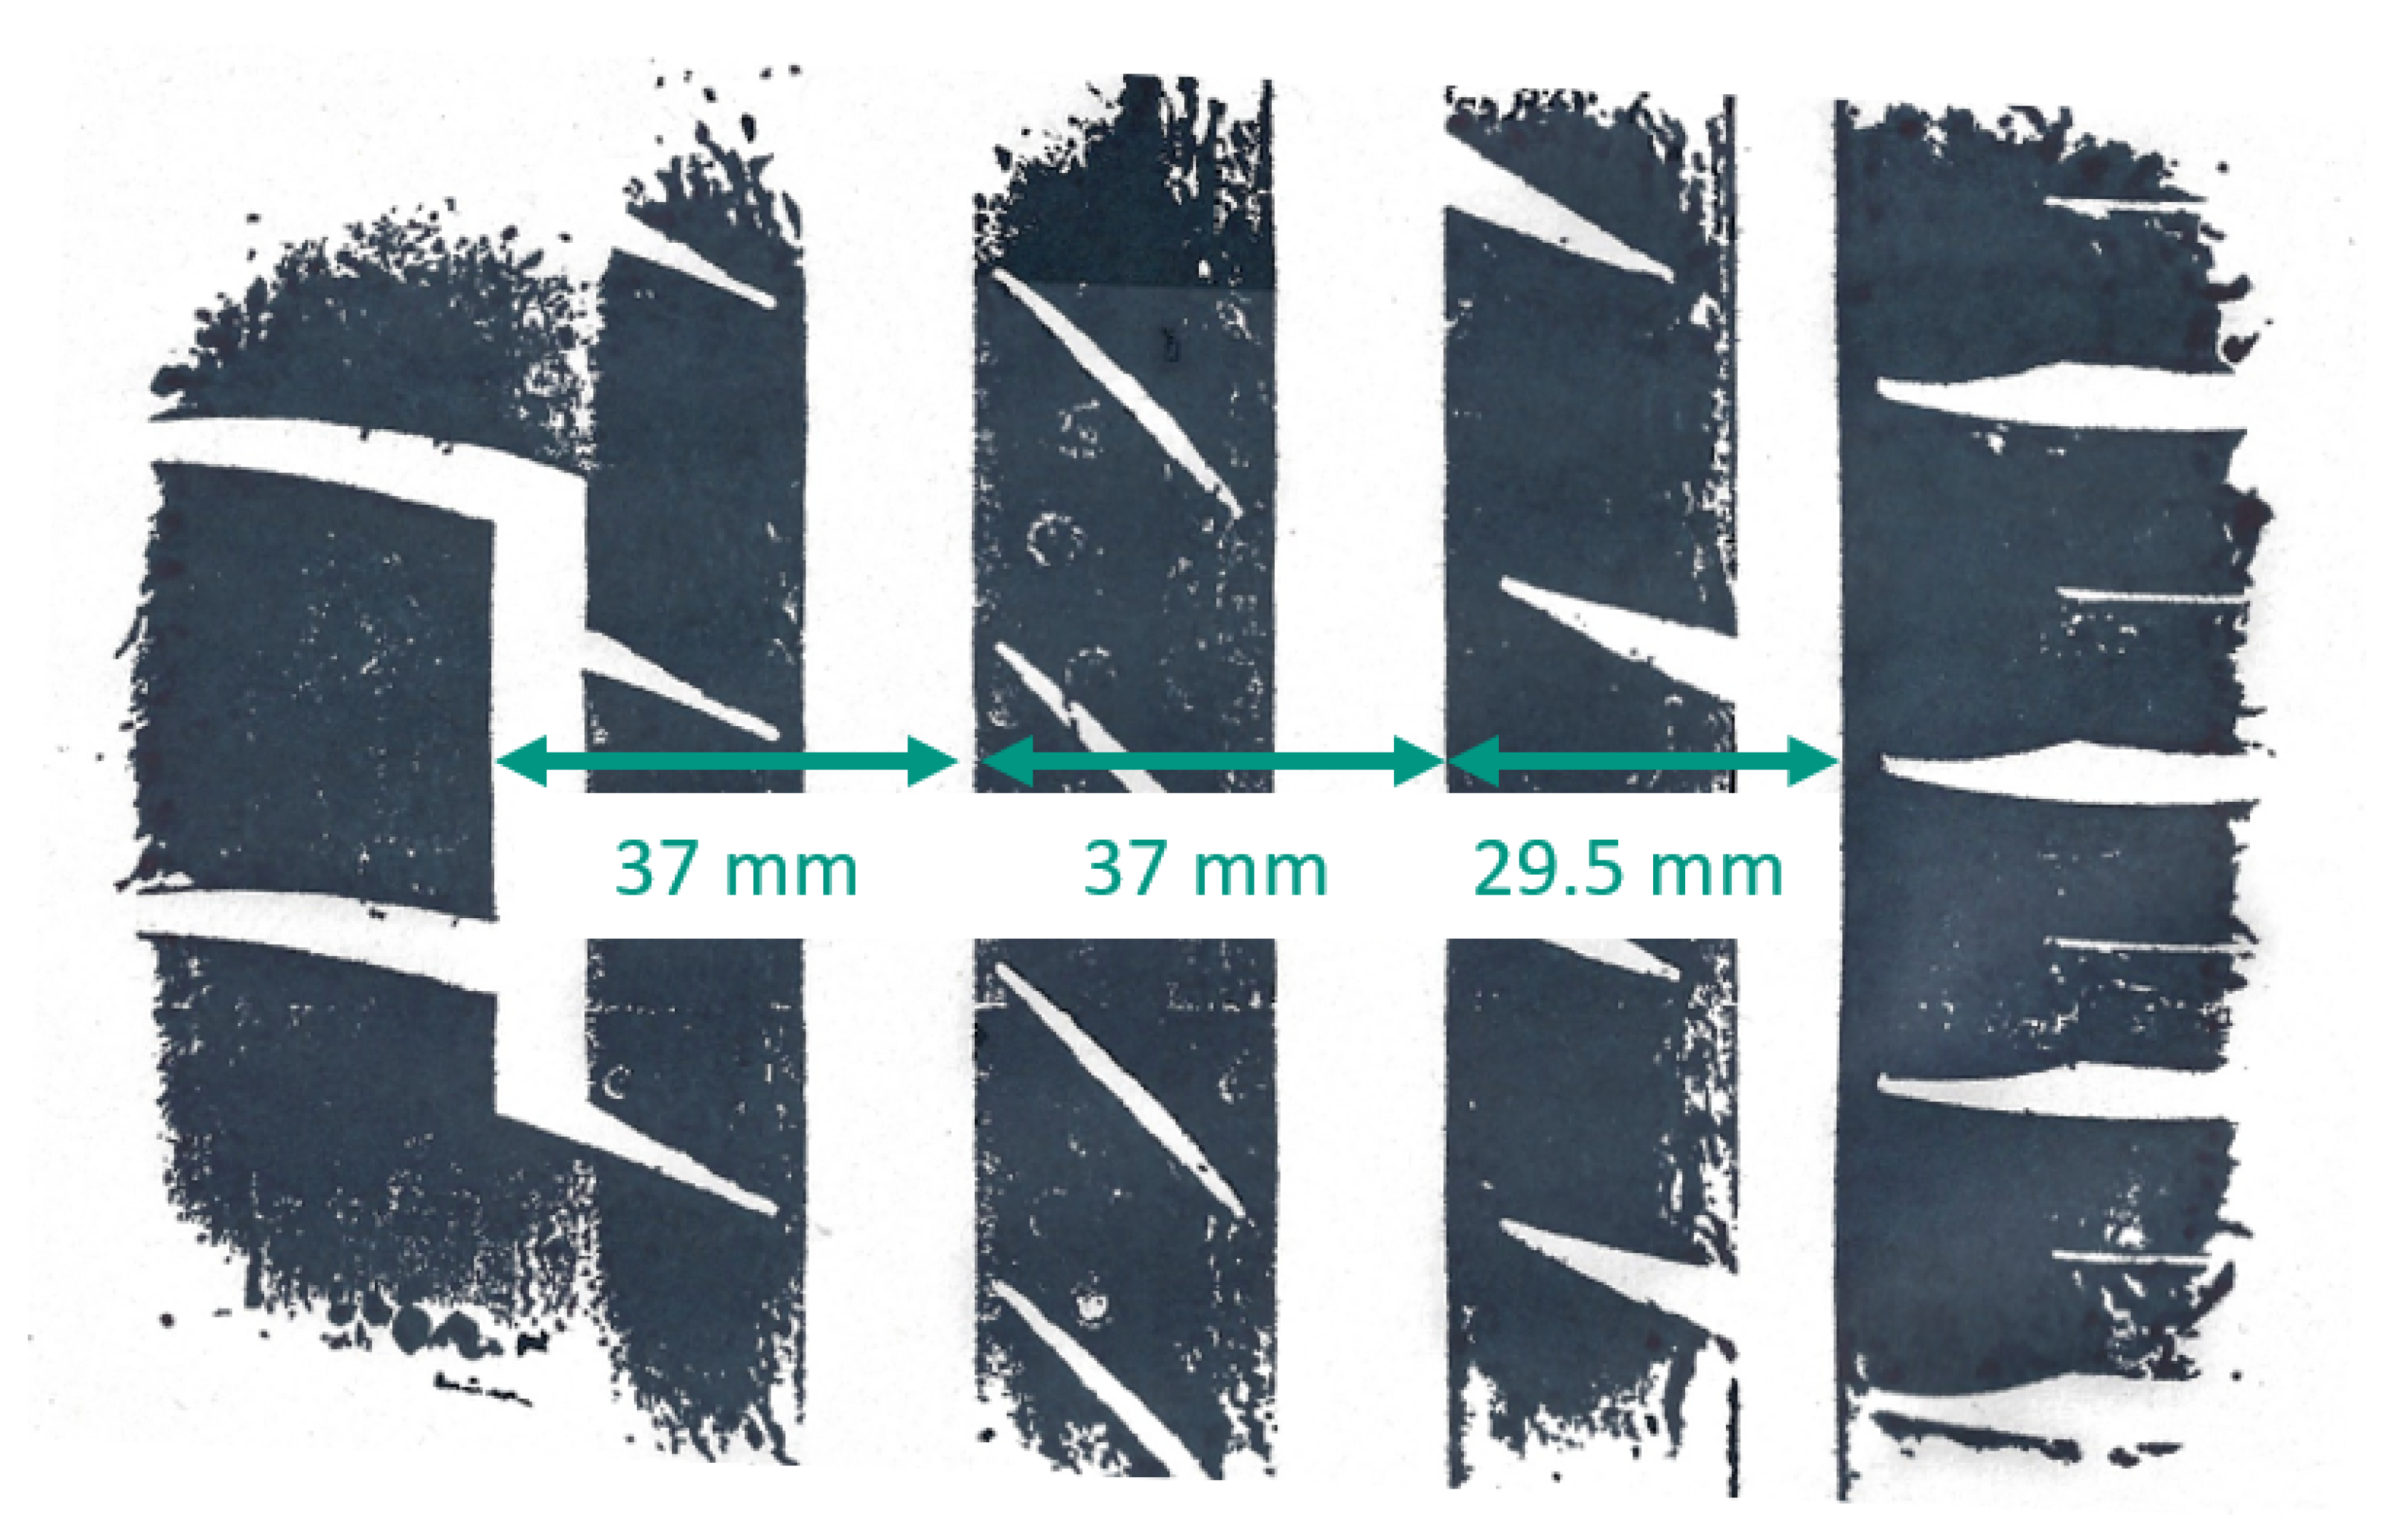
The highest groove wander parameter is expected on the grinding with grooving texture (Type S+). The tires can interact most strongly with this texture. For the bigger tires (Tires 1–3), the GWPs are in a range of 85 N to 130 N. For the winter tires (Tires 1 and 2), the groove wander parameter roughly doubles. Tire 2 shows the smallest interaction, as its tread is not longitudinally aligned. The V-shaped tread seems less susceptible to the interaction (=groove wander). The summer tire (Tire 3) shows an almost threefold increase of the groove wander parameter, compared to Type S. The smaller winter tire (Tire 4) shows a very high susceptibility to groove wander on this road surface texture. The groove wander parameter is about four times as high as on Type S texture. This high level of interaction is a result of matching distances in the tire’s profile and the road texture. The spacing between the tread edges of the tire corresponds to two groove distances in the road surface texture ( mm ≈ mm). Since this distance occurs twice, this means that three edges can always interact with the texture at the same time (see Figure A1 in Appendix A). This results in a higher GWP.
4. Discussion
The method presented in this paper is a new approach to measure groove wander on an indoor test bench. In contrast to previous approaches, a real road surface can be installed in the Internal Drum Test Bench. This means that the measurements are as close to reality as possible.
Several series of groove wander measurements were carried out. The results match the expectations based on previous investigations presented. The measurement method developed appears to be robust and reproducible. Four tires were tested on three different road surface textures.
The following conclusions can be gained from the measurements taken: small tires are more susceptible to groove wander. A longitudinally aligned tire profile is significantly more susceptible to groove wander than one with a V-shaped pattern.
The developed method can be used to further investigate the groove wander effect and improve understanding the phenomenon. Further road textures can be manufactured to investigate the influence of the road surface texture geometries. Other tire models (profiles) and sizes can also be tested. A variation in the operating parameters (velocity, wheel load, etc.) rounds off the possibilities.
This method can be used in the development of new road surface textures or in tire development.
Author Contributions
Conceptualization, M.S., M.G. and F.G.; methodology, M.S.; validation, M.S., M.G. and B.J.; investigation, M.S.; resources, F.G.; data curation, M.S.; writing—original draft preparation, M.S. and B.J.; writing—review and editing, M.S., M.G.; visualization, M.S.; supervision, M.S.; funding acquisition, F.G. All authors have read and agreed to the published version of the manuscript.
Funding
This paper is based on parts of the research project carried out at the request of the Federal Ministry of Transport, represented by the Federal Highway and Transport Research Institute, under research project No. 08.0260/2018/ORB. The author is solely responsible for the content.
Institutional Review Board Statement
Not applicable.
Data Availability Statement
The Federal Highway and Transport Research Institute shall decide on the publication of the findings developed within the scope of the project and the availability of the data in consultation with the Federal Ministry of Transport after obtaining the author’s prior written consent.
Acknowledgments
The authors would like to thank H.-J. Unrau for his advice and support and wish him all the best for his retirement.
Conflicts of Interest
The authors declare no conflicts of interest.
Abbreviations
The following abbreviations are used in this manuscript:
| EAC | Exposed aggregate concrete |
| FE | Finite Element |
| FSTDM | Flat Surface Tire Dynamics Machine (used by Peters [8]) |
| GWP | Groove wander parameter (see Section 2.4) |
| LI | Load Index (of the tire) |
| NGCS | Next Generation Concrete Surface |
| Type S | Road with Grinding texture |
| Type S+ | Road with Grinding and Grooving texture |
Appendix A
The appendix contains a larger image of the footprint of Tire 3 (Figure 6c). The distances between the tread edges are also marked. The tire size is 205/55 R16.
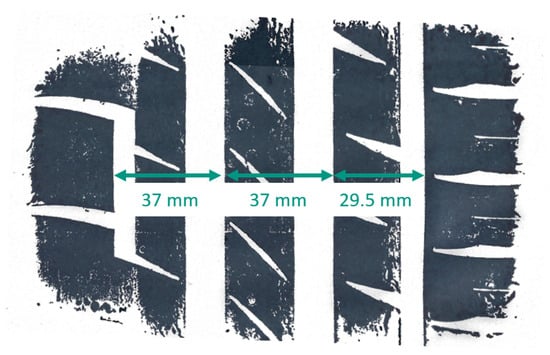
Figure A1.
Footprint of Tire 3. The distances between the tread edges are marked.
Figure A1.
Footprint of Tire 3. The distances between the tread edges are marked.
References
- Bundesministerium für Digitales und Verkehr (BMDV). Aus- und Neubau von Straßen. Available online: https://bmdv.bund.de/SharedDocs/DE/Artikel/StB/aus-und-neubau-von-strassen.html (accessed on 16 May 2024).
- InformationsZentrum Beton GmbH. Bundesfernstraßen: Dauerhafte Betondecken—Störungsfreier Fernverkehr. Available online: https://www.beton.org/betonbau/beton-und-bautechnik/infrastruktur/bundesfernstrasse/ (accessed on 16 May 2024).
- AIT Austrian Institute of Technology GmbH. Texturgrinding Plus (TexPlus) Ergebnisbericht. Available online: https://projekte.ffg.at/anhang/659c0198a158c_TexPlus_Ergebnisbericht.pdf (accessed on 17 May 2024).
- Forschungsgesellschaft für Straßen- und Verkehrswesen e.V. Merkblatt Texturgrinding (M TG), 2023rd ed.; FGSV: Cologne, Germany, 2023. [Google Scholar]
- Diamond Surface Inc. Next Generation Concrete Surface. Available online: https://www.diamondsurfaceinc.com/services/next-generation-concrete-surface (accessed on 23 May 2024).
- Scofield, L. Performance of Field Installations of Next-Generation Concrete Surface. Transp. Res. Rec. 2012, 2306, 180–187. [Google Scholar] [CrossRef]
- Farnsworth, E.E. Pavement Grooving on Highways. Pavement Grooving Tract. Stud. 1969, 5073, 411. [Google Scholar]
- Peters, J.M. Application of the Lateral Stress Theory for Groove Wander Prediction Using Finite Element Analysis. Tire Sci. Technol. 2001, 29, 244–257. [Google Scholar] [CrossRef]
- Tarpinian, H.D.; Culp, E.H. The Effect of Pavement Grooves on the Ride of Passenger Cars — The Role of Tires. SAE Trans. 1977, 86, 2977–2985. [Google Scholar] [CrossRef]
- Oblizajek, K.L.; Lauer, N. A Laboratory Procedure for Evaluation and Diagnosis of the interaction of Tires with Longitudinally Grooved Pavement. SAE Trans. 1984, 93, 393–407. [Google Scholar] [CrossRef]
- Doi, T.; Ikeda, K. Effect of Tire Tread Pattern on Groove Wander of Motorcycles. Tire Sci. Technol. 1985, 13, 147–153. [Google Scholar] [CrossRef]
- Nakajima, Y. Prediction of Rain Groove Wandering. Veh. Syst. Dyn. 2003, 40, 401–418. [Google Scholar] [CrossRef]
- Jeong, K.M.; Kang, S.J.; Kim, H.S.; Kim, K.W. Finite Element Analysis for Groove Wander Prediction of Passenger Car Tires with the Longitudinal Tread Grooves. Engineering 2016, 8, 11–20. [Google Scholar] [CrossRef]
- Ryu, S.; Kim, J.; Sohn, D.; Bae, S. Optimal Longitudinal Texture on Concrete Pavement to Reduce Lateral Vibration of Vehicles. Appl. Sci. 2022, 12, 9661. [Google Scholar] [CrossRef]
- Institut für Fahrzeugsystemtechnik, Karlsruher Institut für Technologie (KIT-FAST). Reifen-Innentrommel-Prüfstand. Available online: https://www.fast.kit.edu/lff/IPS.php (accessed on 12 April 2024).
- Schläfle, S.; Unrau, H.J.; Gauterin, F. Influence of Load Condition, Tire Type, and Ambient Temperature on the Emission of Tire–Road Particulate Matter. Atmosphere 2023, 14, 1095. [Google Scholar] [CrossRef]
Disclaimer/Publisher’s Note: The statements, opinions and data contained in all publications are solely those of the individual author(s) and contributor(s) and not of MDPI and/or the editor(s). MDPI and/or the editor(s) disclaim responsibility for any injury to people or property resulting from any ideas, methods, instructions or products referred to in the content. |
© 2025 by the authors. Licensee MDPI, Basel, Switzerland. This article is an open access article distributed under the terms and conditions of the Creative Commons Attribution (CC BY) license (https://creativecommons.org/licenses/by/4.0/).

