Article

The Effect of the Incorporation of a 3D-Printed Titanium Framework on the Mechanical Properties CAD/CAM Denture Base Materials

1
School of Dental Medicine, Stony Brook University, Stony Brook, NY 11733, USA
2
Department of Materials Science and Chemical Engineering, Stony Brook University, Stony Brook, NY 11733, USA
*
Author to whom correspondence should be addressed.
Prosthesis 2024, 6(4), 753-766; https://doi.org/10.3390/prosthesis6040053
Submission received: 28 May 2024 / Revised: 6 July 2024 / Accepted: 8 July 2024 / Published: 10 July 2024

Abstract

:
Background: Complete dentures should withstand occlusal forces and wear. However, over time, dentures can suffer fatigue and develop cracks, chipping, and fractures. Conventional methods for the fabrication of complete dentures involve injection molding, thermal curing, and the use of microwaves with polymethyl methacrylate (PMMA)-based materials. These methods have served well for many years. More recently, the incorporation of computer-aided design and computer-aided manufacturing (CAD/CAM) to fabricate complete dentures has been shown to enhance the dentures’ mechanical properties, including resistance to wear and impact strength. This study aims to investigate the mechanical properties and fracture types of CAD/CAM denture base materials (both milled and printed) as compared to a novel proprietary method that embeds a 3D-printed framework within PMMA-milled blocks. The null hypothesis is that incorporating a 3D-printed framework does not affect the mechanical properties of milled PMMA blocks. Methods: Three groups of bars were fabricated using CAD/CAM methods: printed (P), milled (M), and milled with a 3D-printed metallic framework reinforcement (M + F). A three-point bending test evaluated deformation, followed by an impact fracture test for fracture toughness. A descriptive fractographic analysis assessed the fracture characteristics. A statistical analysis using a paired t-test compared the differences between the groups. Results: The P group showed more elastic deformation than the M and M + F groups (p < 0.05). The M + F group achieved a higher fracture toughness as compared to the M and P groups (p < 0.05). Conclusions: Within the limitations of this experimental study, the null hypothesis can be rejected. Milled samples with an embedded 3D-printed titanium framework possess higher resistance to impact than milled samples without frameworks, and printed samples and milled samples with embedded 3d-printed titanium frameworks present increased flexural strength and lower elastic deformation as compared to milled samples without frameworks and printed samples.

1. Introduction

Denture base resins should exhibit the necessary strength, fracture toughness, and dimensional stability to endure forces during function over many years [1,2]. Although there are different materials for denture base fabrication, PMMA (polymethyl methacrylate) remains the primary choice due to its aesthetics, ease of processing, cost-effectiveness, and easiness to repair [3]. However, PMMA based materials also present shortcomings including the presence of residual monomer, the tendency to exacerbate allergies, variable mechanical properties resulting from the method of fabrication, and shrinkage during setting [4].
A common concern associated with PMMA denture-based prostheses is the fracture of the denture base or denture teeth, which can result from fabrication defects, improper design, inadequate fit, bruxism, and the relatively low fracture resistance of the acrylic resins [5]. Specifically, maxillary fractures result from a combination of fatigue due to occlusal forces and impact, such as accidental drops on hard surfaces, while around 80% of mandibular fractures are primarily caused by impact [6]. Regarding the location of the fractures, maxillary dentures are more susceptible to midline fractures [7,8,9,10].
To increase the fracture resistance and flexural strength of denture bases, different approaches are used, including impact-resistant polymers (by chemical modification) and reinforcement of the PMMA (nanoparticles/nanotubes, fibers, and metal reinforcements) [11,12,13,14,15,16,17,18]. The use of nanoparticles aims to improve the mechanical properties of the denture base polymer (specifically resin hardness); however, if the nanoparticles are non-homogeneously distributed and produce nanoparticles agglomerates, the toughness, flexural strength, and tensile strength are impaired given their uneven dispersion within the polymer matrix [12,13]. Furthermore, the properties of nanoparticle-reinforced polymers are influenced by factors such as nanoparticle geometry, form, orientation, surface treatment, and interfacial adhesion with the polymer matrix, which are difficult to control [14,15]. Additionally, variations in standardization, polymerization cycles, and manipulation methods can further impair the flexural strength of the nanoparticle-reinforced polymer [16].
Another option is reinforcing the PMMA with different fibers, such as nylon, polyethylene, polyamide, and glass fibers, which in the laboratory show enhanced flexural strength, impact strength, and fatigue resistance of the denture bases [17]. However, the literature indicates that this method is technique-sensitive and presents inconsistent values in its reinforcing effects [17].
Metal framework reinforcements can be added to complete or partial dentures, offering certain advantages such as light weight (compared with thick denture bases), increased patient comfort (due to minimal thickness of the metal framework and less invasion of the intraoral spaces), high strength, excellent biocompatibility, and increased fracture toughness [18,19]; in addition, metal frameworks can be casted or digitally manufactured [20]. In general, frameworks can be fabricated by casting methods that use different metallic alloys, including cobalt–chromium (Co–Cr), titanium (Ti), and gold (Au) [21].
Computer-aided design/computer-assisted manufacturing (CAD/CAM) can be used for the fabrication of dentures, denture bases, and denture teeth, offering advantages like simplified workflows, improved patient experiences, and improved mechanical properties as compared to the conventional fabrication methods [11]. Two CAD/CAM manufacturing methods are available for fabricating denture bases and denture teeth: 3-D printing and milling. When comparing printed versus milled CAD/CAM denture base materials, the 3D-printed materials show lower flexural strength [22]. CAD/CAM milled materials possess better mechanical properties as compared to printed and conventional materials because their fabrication results in less internal porosity, minimal free monomers, and higher density per volume area. However, they are exposed to the same risks of fatigue and impacts experienced by conventional denture materials [22].
Furthermore, CAD/CAM denture materials (3D-printed or milled) exposed to thermocycling have shown impaired hardness, reduced fracture strength, and changes in surface roughness, thus demonstrating that the material can degrade over time [23], and if the CAD/CAM materials are exposed to denture cleansers, hardness and fracture toughness also decrease [24].
Furthermore, in patients with implant overdentures, the thickness of the denture base over the implants is thinner, and fractures are most found in those areas [25]. Thus, the insertion of metal frameworks in the denture base could decrease the stress concentration around the portion of the denture base that surrounds the implant housing [25].
Recently, AvaDent Digital Denture Solutions (AvaDent®, Scottsdale, AZ, USA) developed a proprietary method to embed inside the CAD/CAM resin a titanium 3D-printed framework before the resin is processed and milled. This method combines the possibility of customizing the 3D-printed framework to almost any ridge configuration. While metal reinforcement is a recognized strategy for enhancing the fracture toughness of conventional denture bases [18,19,20], the benefits of integrating a 3D-printed metal framework into CAD/CAM denture base materials remain unknown. The present study aimed to evaluate the deformation under the three-point bending test and determine the elastic portion of the stress/strain curves and the fracture toughness of three denture base materials: 3D-printed denture base, milled denture base, and milled denture base with an embedded 3D-printed titanium framework.

2. Materials and Methods

2.1. Experimental Design

This was an experimental, exploratory in vitro study. The sample size was calculated using the Statsmodels library in Python (ChatGPT4.0). The calculations were based on a significance level of 0.05, a power of 70%, and an effect size of 0.35. The sample size was determined as n = 22 samples per group for three experimental groups (Printed, Milled, and Milled + Reinforcement) for a total of N = 66 samples (Figure 1).

2.2. Sample Design

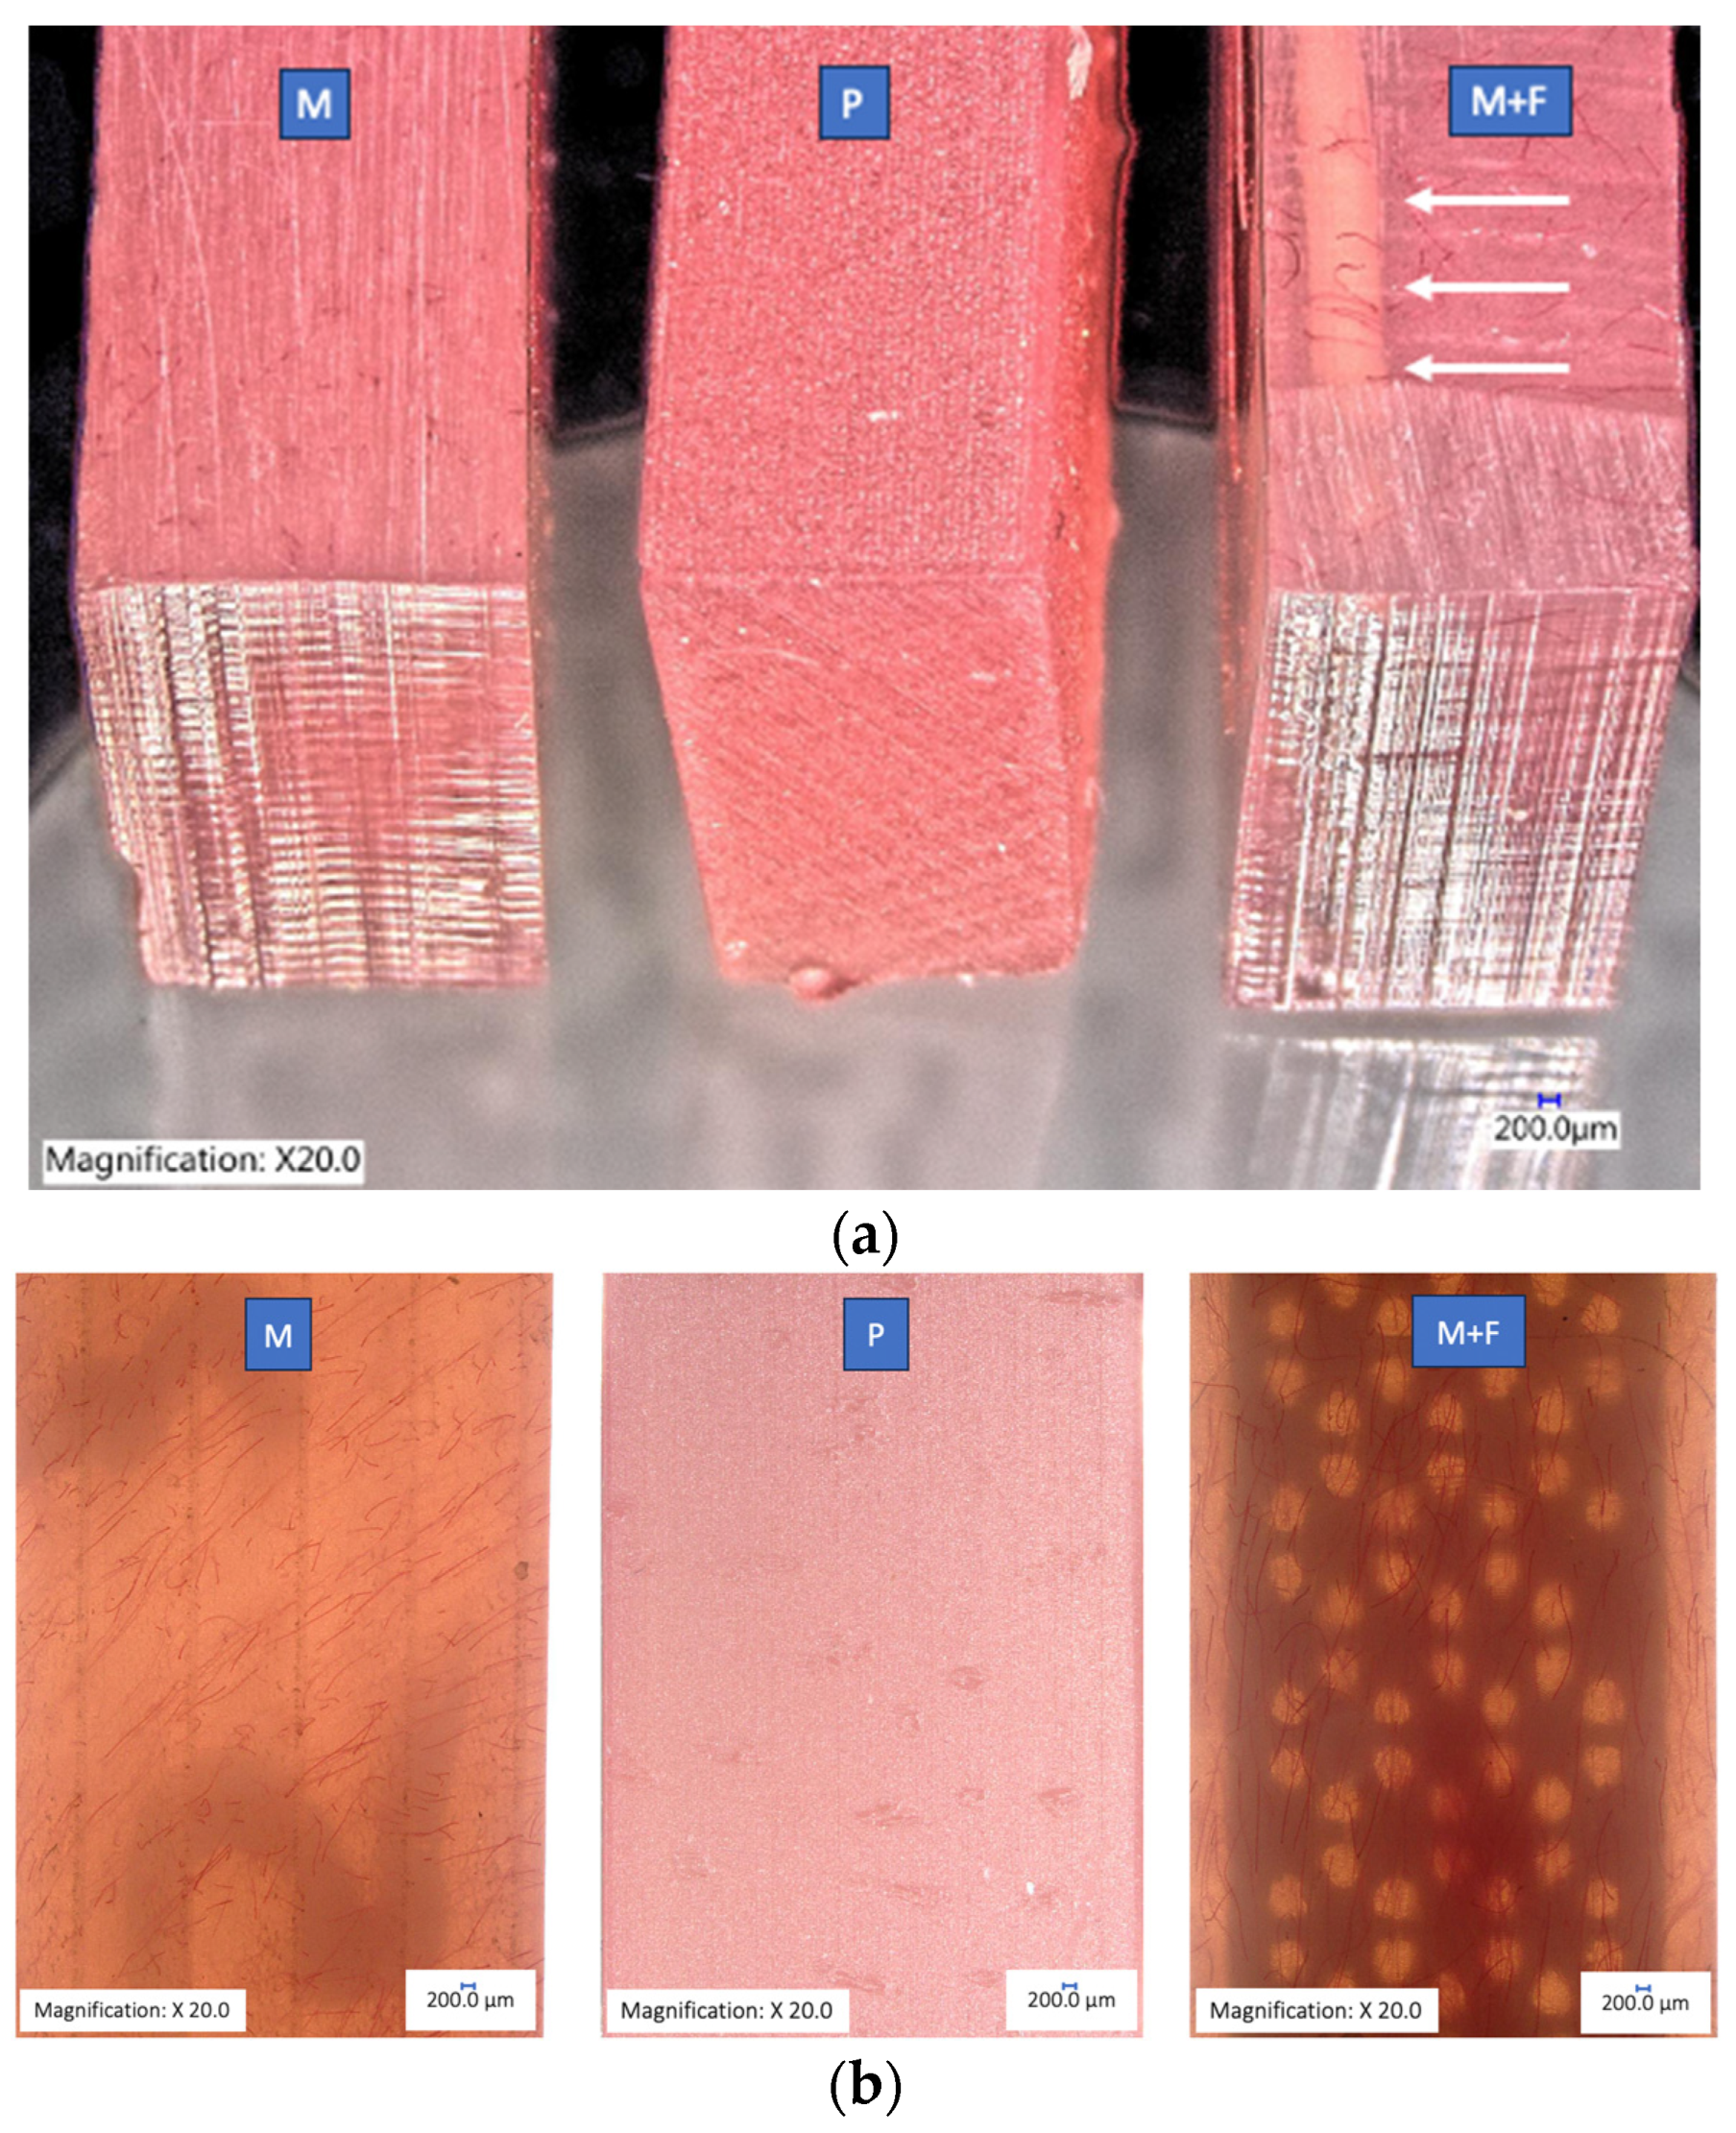
A bar design was created using Tinker CAD (Autodesk Inc., San Rafael, CA, USA) with the following dimensions: 60 mm-length, 10 mm-width, and 4 mm-thickness. The CAD file was exported as standard tessellation language (STL) to fabricate the three experimental groups of samples: Group 1: Milled; Group 2: Printed; and Group 3: Milled + Titanium framework reinforcement (Figure 2a,b).
To fabricate the milled samples (without and with reinforcement), the STL file was sent to Avadent (AvaDent®: Scottsdale, AZ, USA), who applied our design to mill the samples using their proprietary technology. A brief description was provided by the manufacturer as follows: a 3D-printed framework was designed to the desired geometry and fabricated by the laser printing of titanium powders. Afterward, the framework was embedded into liquid resin, and the resin was processed by heat and pressure, which resulted in the incorporation of the framework into the denture base material pucks. Afterward, the samples were milled to their final dimensions. Meanwhile, the printed samples were fabricated on-site using a Form3 3D-printer (Formlabs, Somerville, MA, USA) using OP (Original Pink) denture base material (Ref. PKG-RS-F2-DB) from Formlabs (Formlabs, Somerville, MA, USA). The samples were printed with a horizontal orientation of 0° parallel to the printing surface. After printing, the supports were removed and the samples were washed in isopropyl alcohol for 15 min (Form Wash, Formlabs, Somerville, MA, USA), and post-cured with UV light at 45 °C for 30 min (Form Cure, Formlabs, Somerville, MA, USA). The samples were maintained in a controlled environment at 21 degrees Celsius with a relative humidity of 30%. To preserve the materials’ maximum strength prior to any aging or thermocycling, no immersion in water or conditioning was performed before the mechanical tests.

2.3. Deformation (Displacement) and Stress/Strain Curves within the Elastic Area

To evaluate the amount of deformation (displacement) under a standardized compressive force, a three point-bending test was completed using a Dynamic Mechanical Analysis (DMA-850) from TA Instruments (New Castle, DE, USA). A strain ramp from 0.1% as a constant rate was applied until the axial force reached the instrument limits of 18 N. The test was completed at a temperature of 37 °C.
The deformation (displacement under the compressive force) was measured in microns. In addition, the stress/strain curves for the elastic portion were recorded for all the groups. Each group consisted of 11 samples, for a total of 33 samples. One sample from each group was used for calibration purposes. The calibration sample was set in the testing area, and a repeated axial force of 18 N was applied to verify the reliability of the 0.1% strain ramp.

2.4. Impact Fracture Test

After the bending tests and stress/strain curves were completed, the remaining 33 samples were tested using a Tinius Olsen IT-503/504 impact tester machine (Tinius Olsen Testing Machine Co., Horsham, PA, USA) equipped with a 5.5 J pendulum. Un-notched impact tests were performed on all the samples to evaluate the energy required to fracture them. Initially, calibration was necessary to ensure the stabilization of the samples in the sample holder and to verify that the centers of the samples were aligned with the tip of the pendulum. The center was identified using a digital caliper, and the location was marked with a pen. Calibration confirmed that 30 mm was the center of the samples, coinciding with the pendulum tip. Finally, impact tests were conducted using samples with the following dimensions: width 10 mm, thickness 4 mm, and length 60 mm. The impact fracture values were recorded in kJ/m2 (kilojoules per square meter of cross-section)

2.5. Fracture Analysis

To evaluate qualitatively the fracture characteristics of the samples, a digital microscope (Keyence VHX-6000, Keyence, Itasca, MN, USA) and a 3D-laser confocal microscope (Keyence VK-250, Keyence, Itasca, MN, USA) were used. A fractography analysis was completed, including the analysis of the impact zone, middle zone, and the side opposite to the impact, which were evaluated with the digital microscope at different magnifications. Three different types of fractures (clean, shattered, bent) were observed. A clean fracture resulted in two fragments that could be matched. A shattered fracture resulted in multiple fragments that were impossible to match. A bent fracture resulted in two fragments still connected by the framework.

3. Results

3.1. Stress/Strain Curves within the Elastic Area

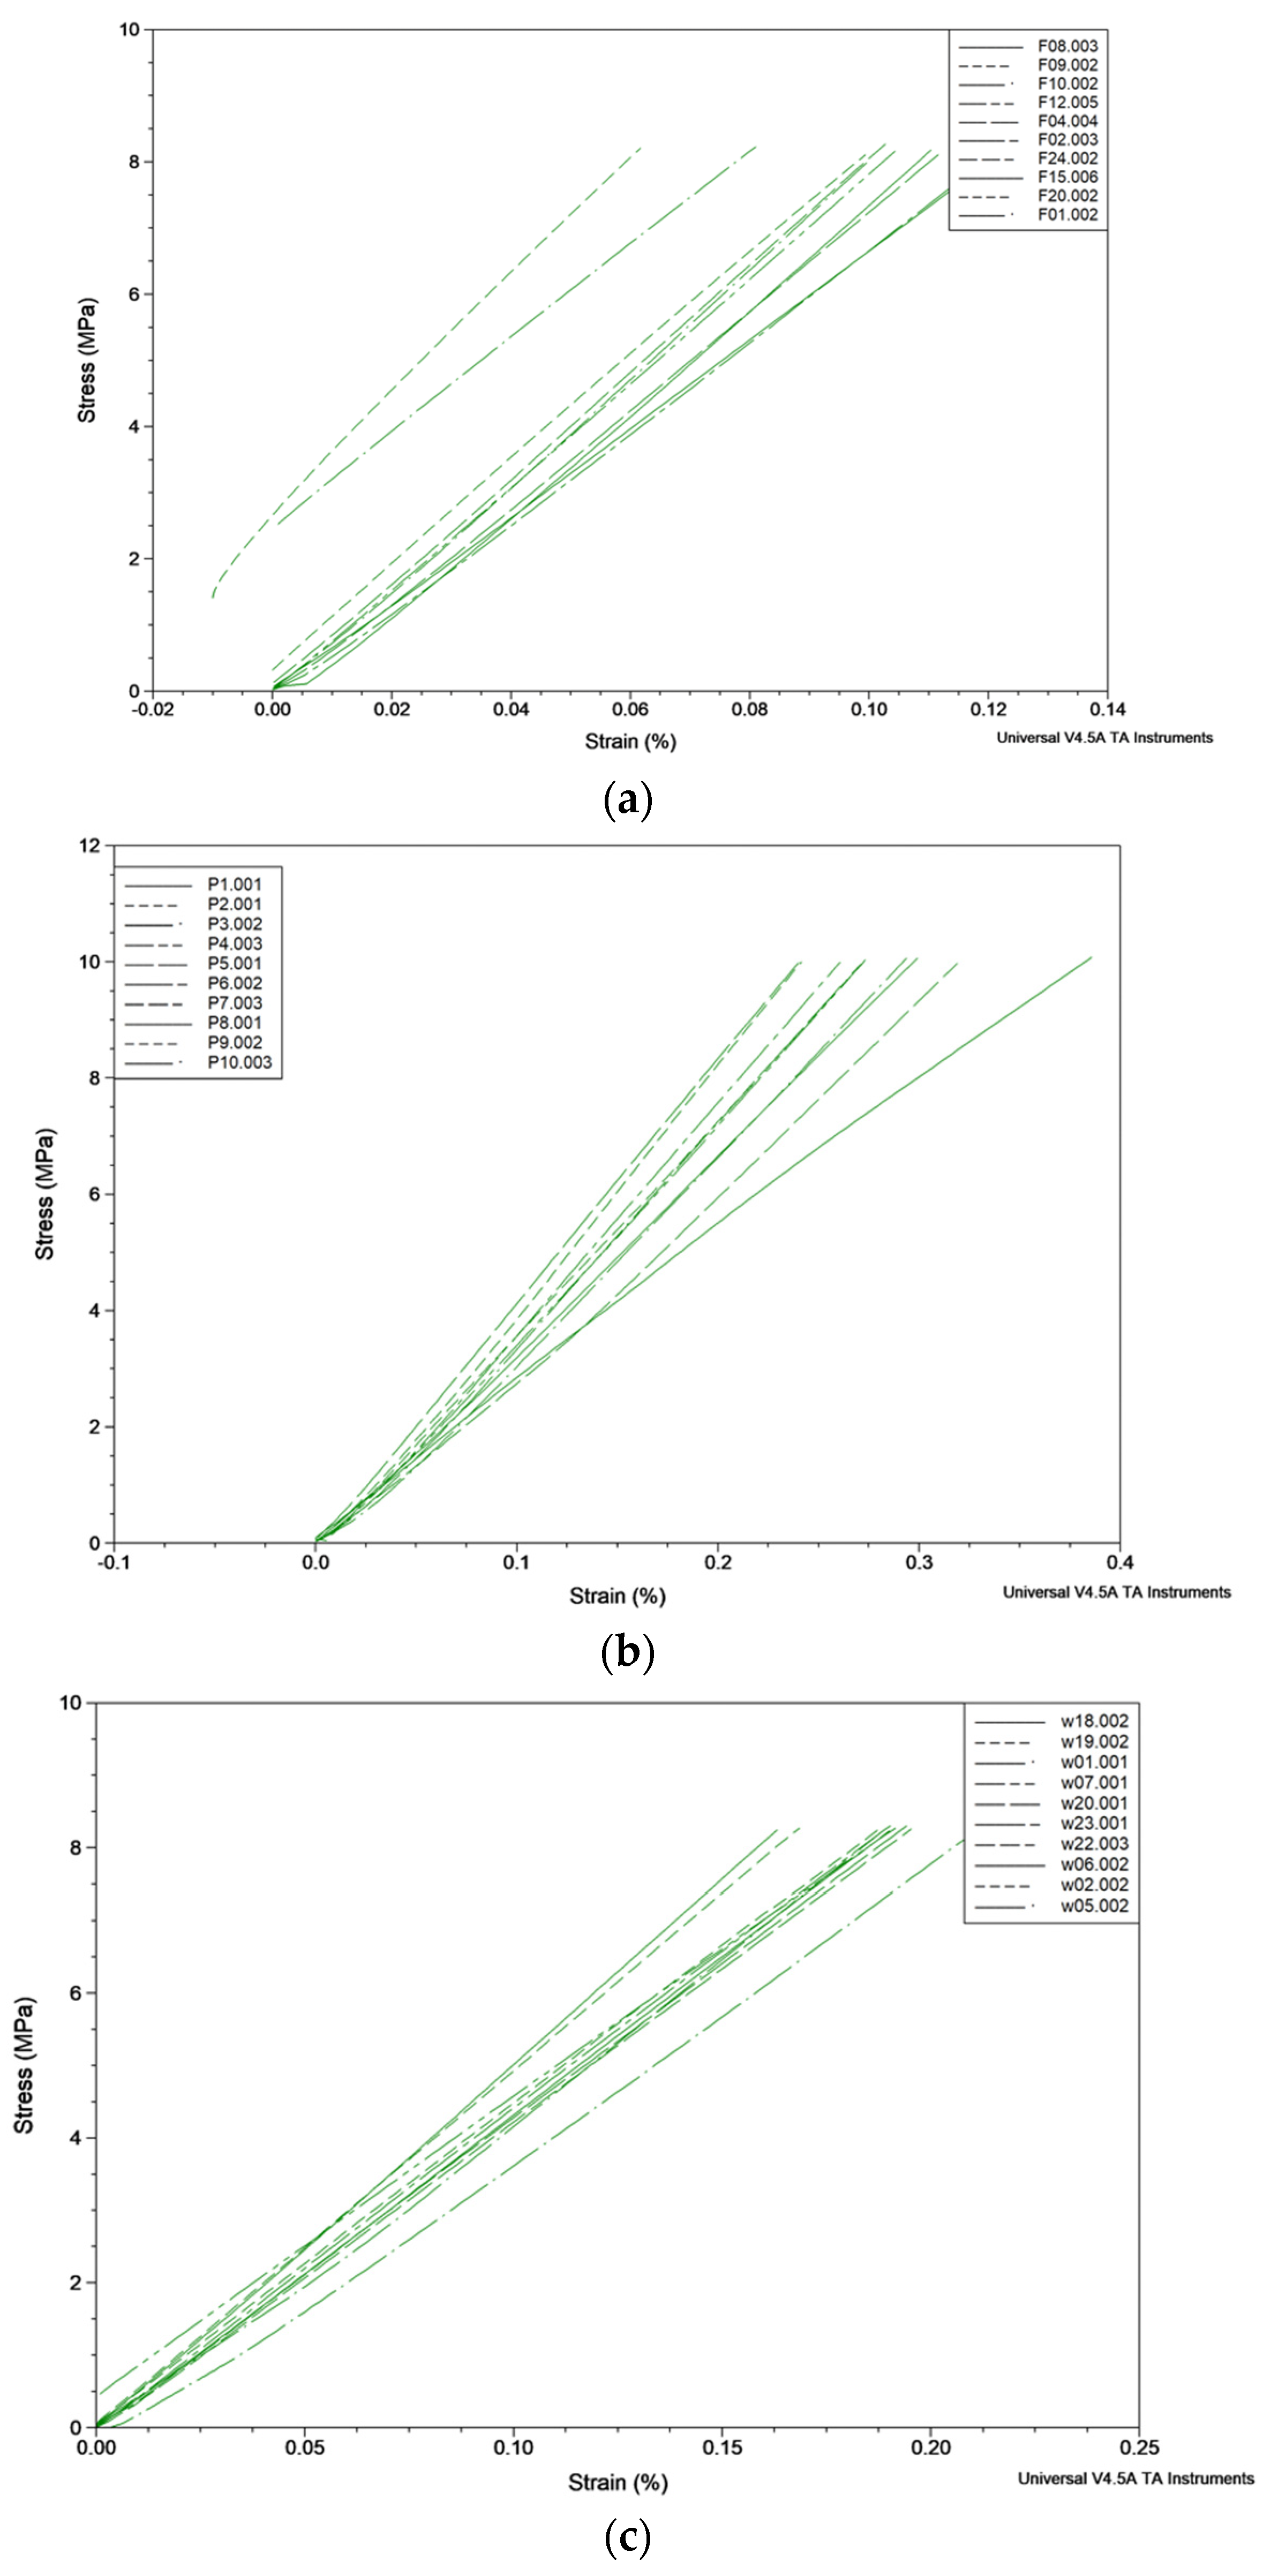
A maximum standardized force of 18 N was applied to all the samples. The three-point bending test showed higher elastic deformation for the printed group as compared to the other groups (milled and milled with titanium reinforcement). The lowest deformation occurred in the metal-reinforced milled samples.
Figure 3a shows ten stress/strain curves obtained with the three-point bending test for the printed (P) group. Initially, the stress increased linearly with the strain, indicating elastic behavior where the material returns to its original shape when the stress is removed. The slopes of the curves appear smaller than the milled and milled and reinforced samples. Some samples of the printed group showed outlier behavior.
Figure 2b shows ten stress/strain curves obtained with the three-point bending test for the milled (M) group. The curves were linear, demonstrating an elastic behavior, and the slopes were higher than the printed group.
Figure 3c shows ten stress/strain curves obtained with the three-point bending test for the milled and reinforced group (M + F). The lowest strain was observed in this group, in addition, indicating a stiffer group.

3.2. Deformation

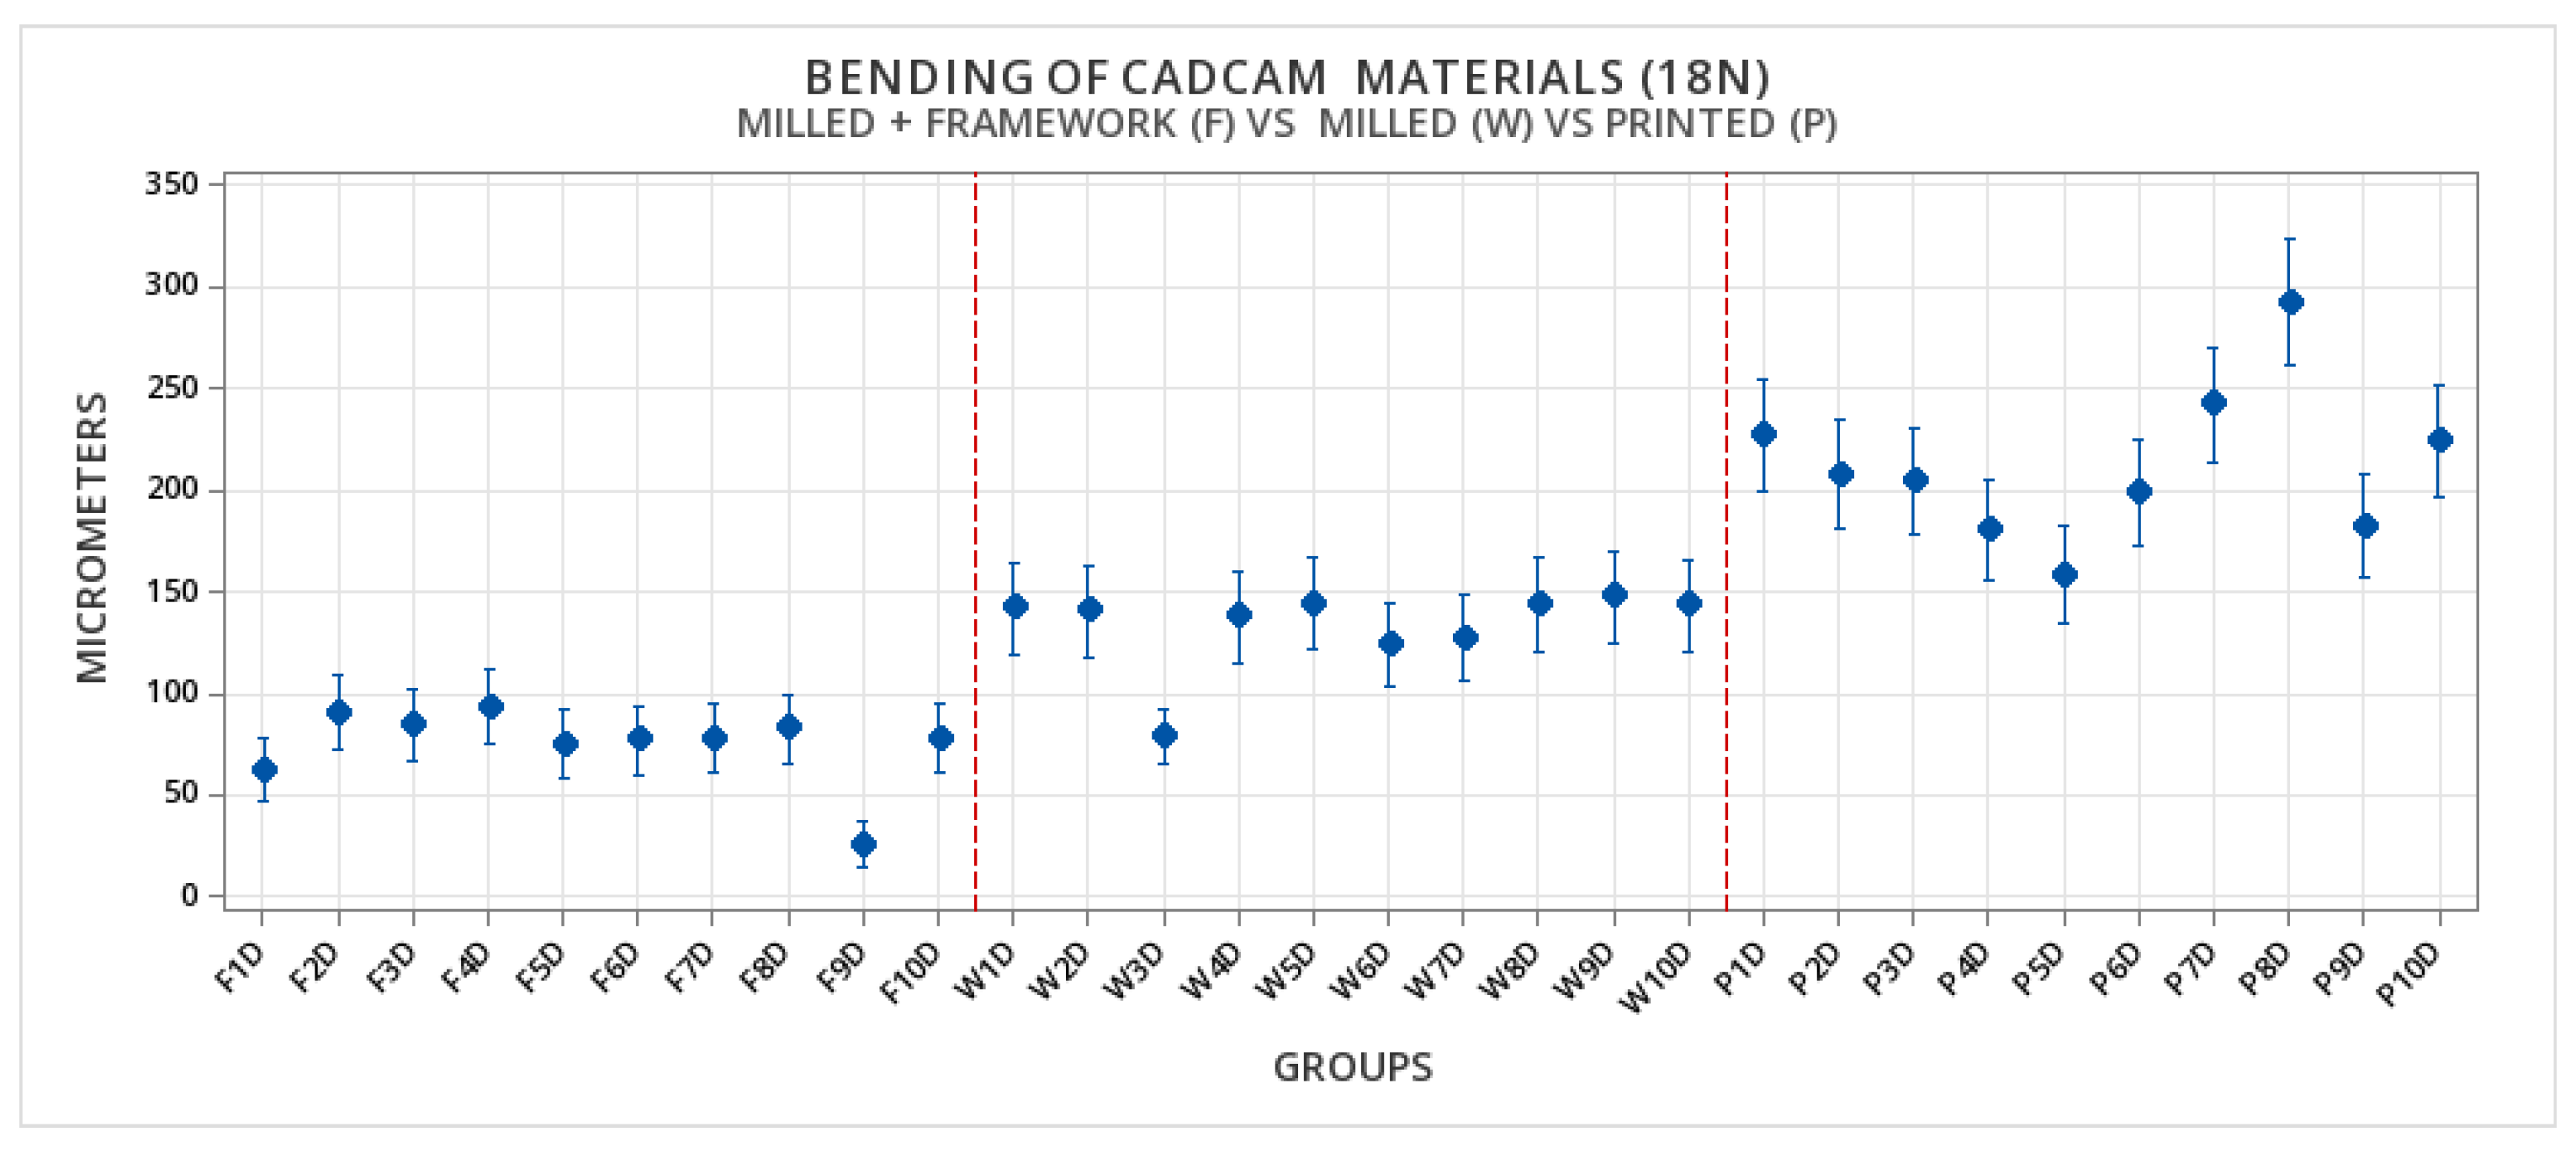
All the samples experienced some elastic deformation under vertical load (displacement). The printed group suffered more elastic deformation than the other groups (milled and milled with reinforcement). Typically, the printed samples suffered elastic deformations in the range of 160 µm to 300 µm. The milled samples showed elastic deformations in the range of 75 µm to 140 µm. The smallest deformation was observed in the milled samples with reinforcement, with a range of 40 µm to 90 µm. Furthermore, the values were highly variable for the printed group and homogeneous for the milled groups (Figure 4 and Table 1).

Statistical Comparisons of the Elastic Deformation

The statistical comparisons showed that milled-with-reinforcement materials were superior as compared to the milled and printed materials and confirmed that the milled material is superior to the printed material (Table 2).

3.3. Fracture Toughness Analysis

The impact fracture test showed higher fracture toughness for the milled samples reinforced with metallic frameworks, followed by the milled samples. The lowest values were observed in the printed group (Table 3).

Statistical Comparisons of the Fracture Toughness of CAD/CAM Materials

Statistical analysis showed higher fracture toughness in the milled and reinforced group as compared to the other groups (milled and printed) (Table 4).

3.4. Fractographic Analysis

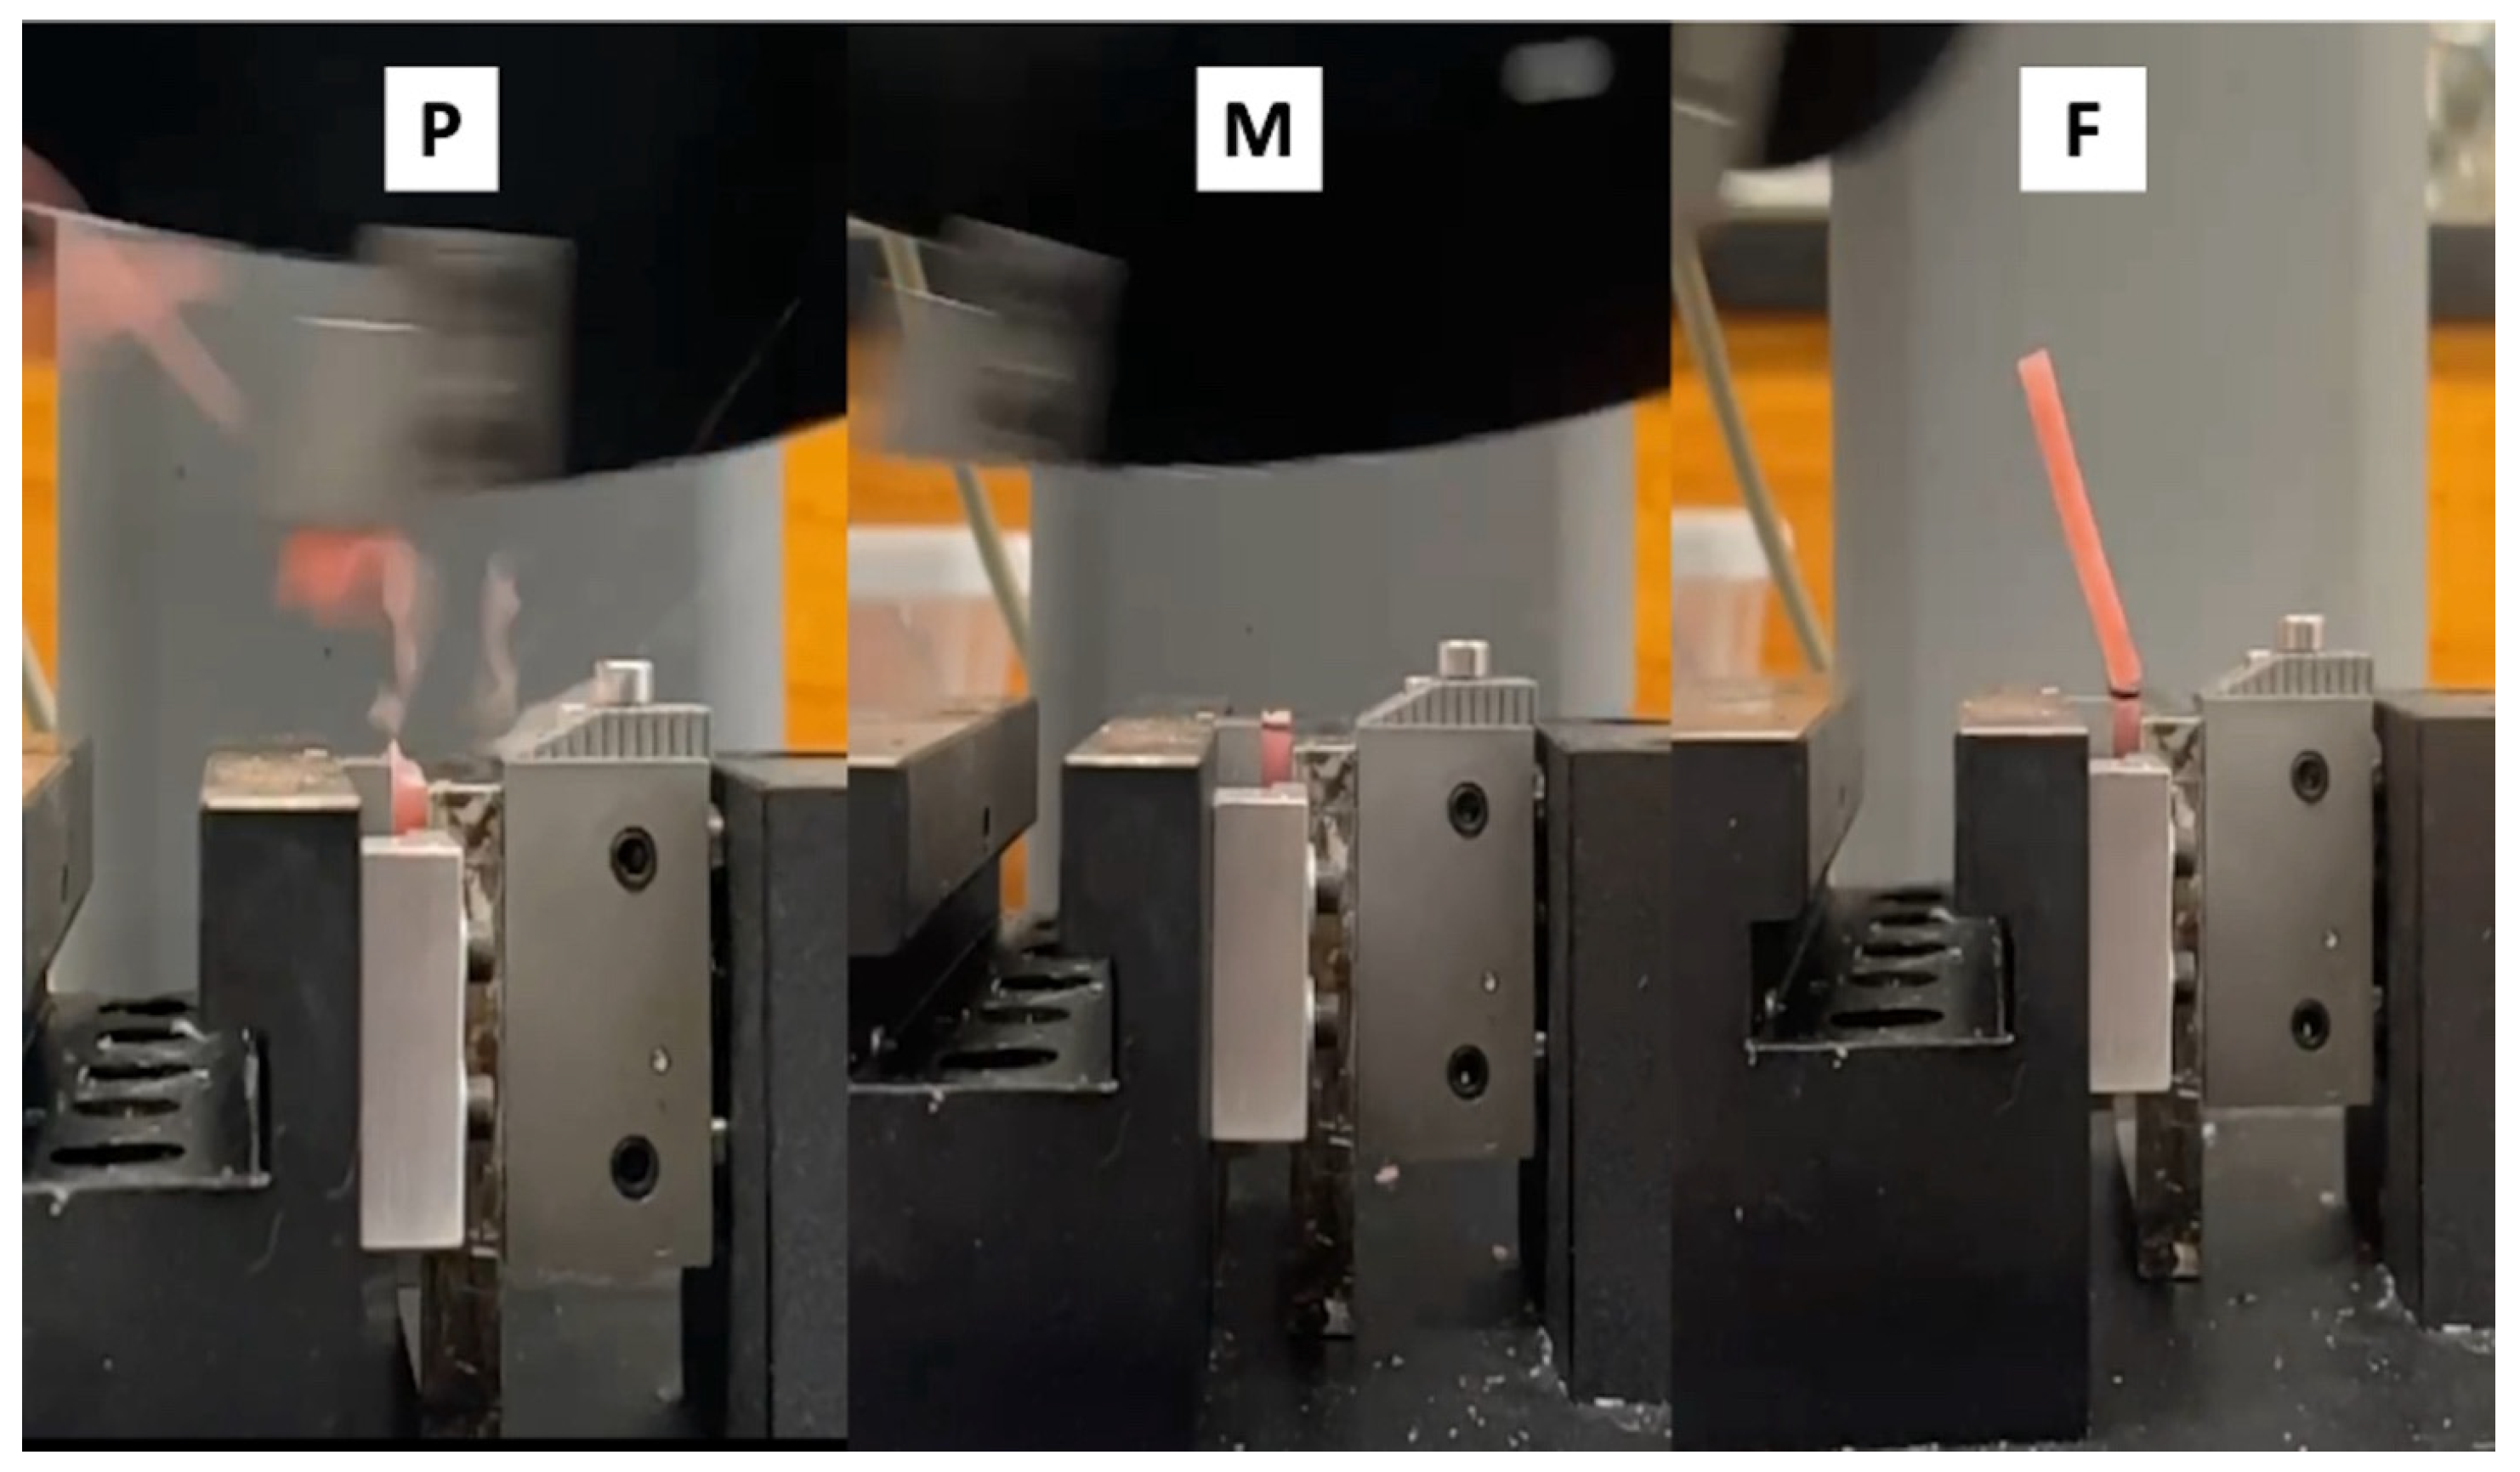
The type of fracture, the fracture propagation characteristics, and the fracture lines were different in the milled and in the printed groups. Figure 5 shows samples of each group immediately after the impact test.

3.4.1. Fracture Analysis Printed Group

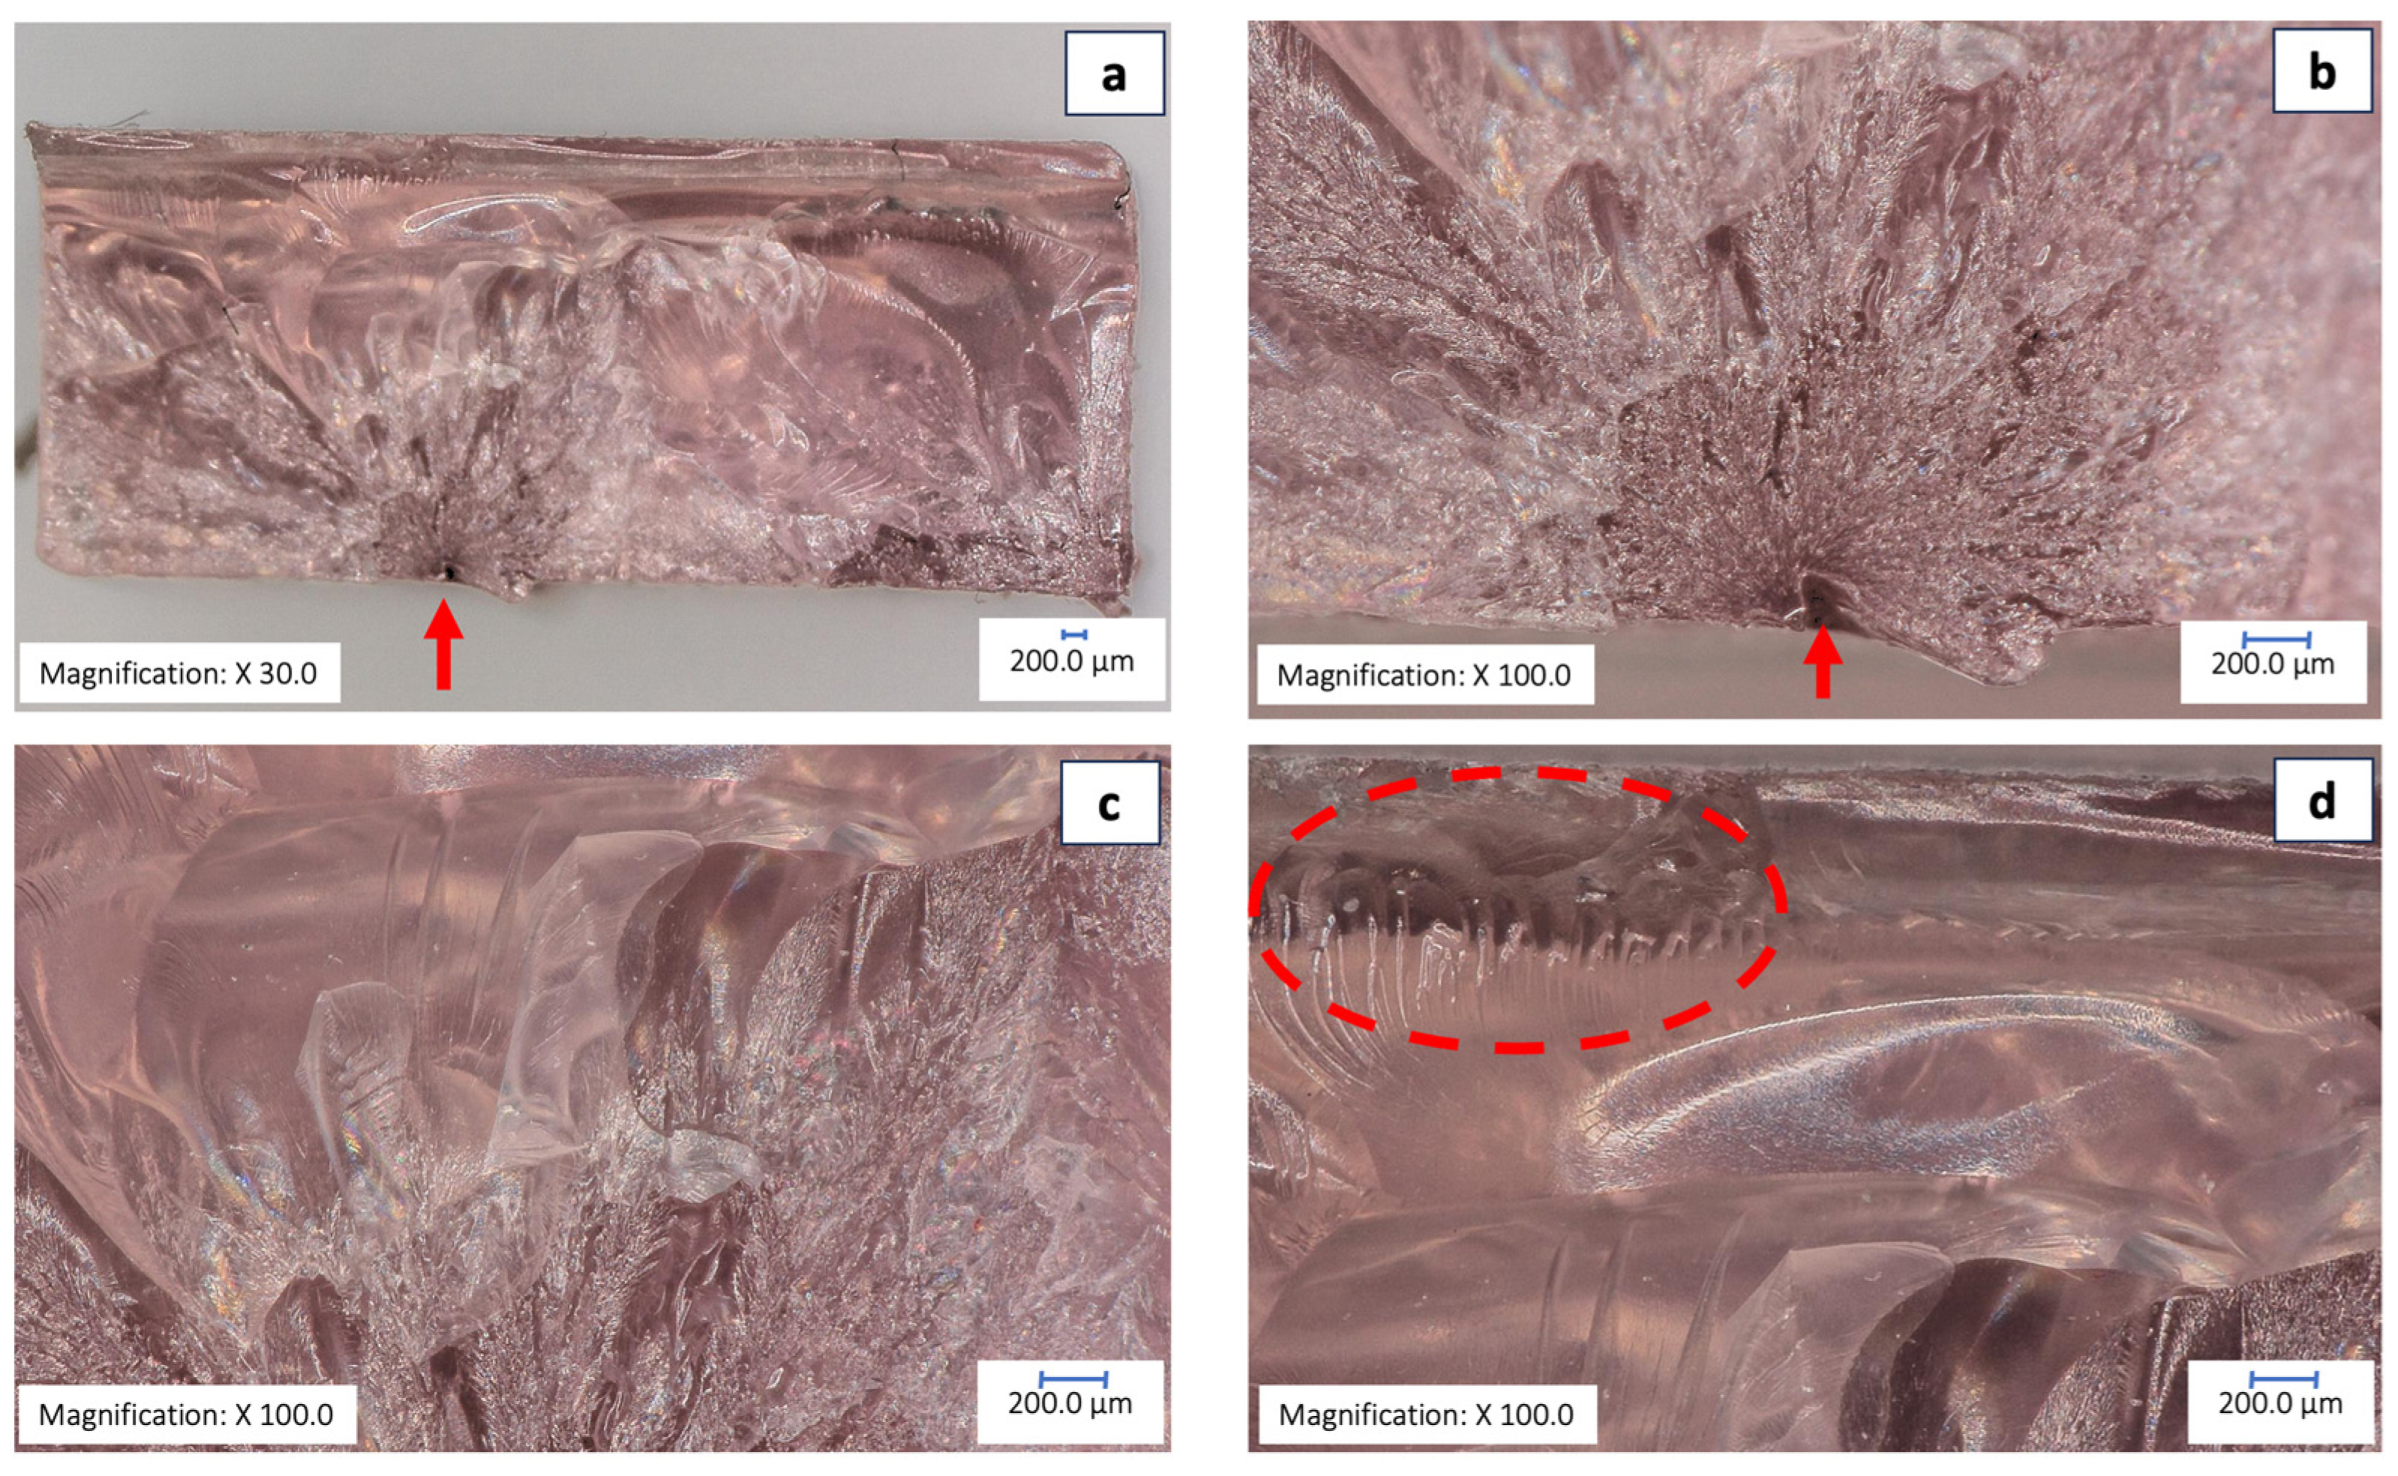
The samples exposed to the impact test fractured in multiple pieces, and the fragments showed multiple fracture lines extending from the impact areas in random directions along the samples. In addition, multiple sharp edges with different heights were appreciated. At the area of impact, a dark zone indicated the compression produced by the impact, and multiple microfractures extended toward the middle zone. The middle zone was less rough; different fracture faces could be observed that resulted in multiple chipped parts. The zone opposite to the impact also showed multiple facets in multiple directions; small and parallel microfracture lines were observed near the surface (Figure 6).

3.4.2. Fracture Analysis Milled Group

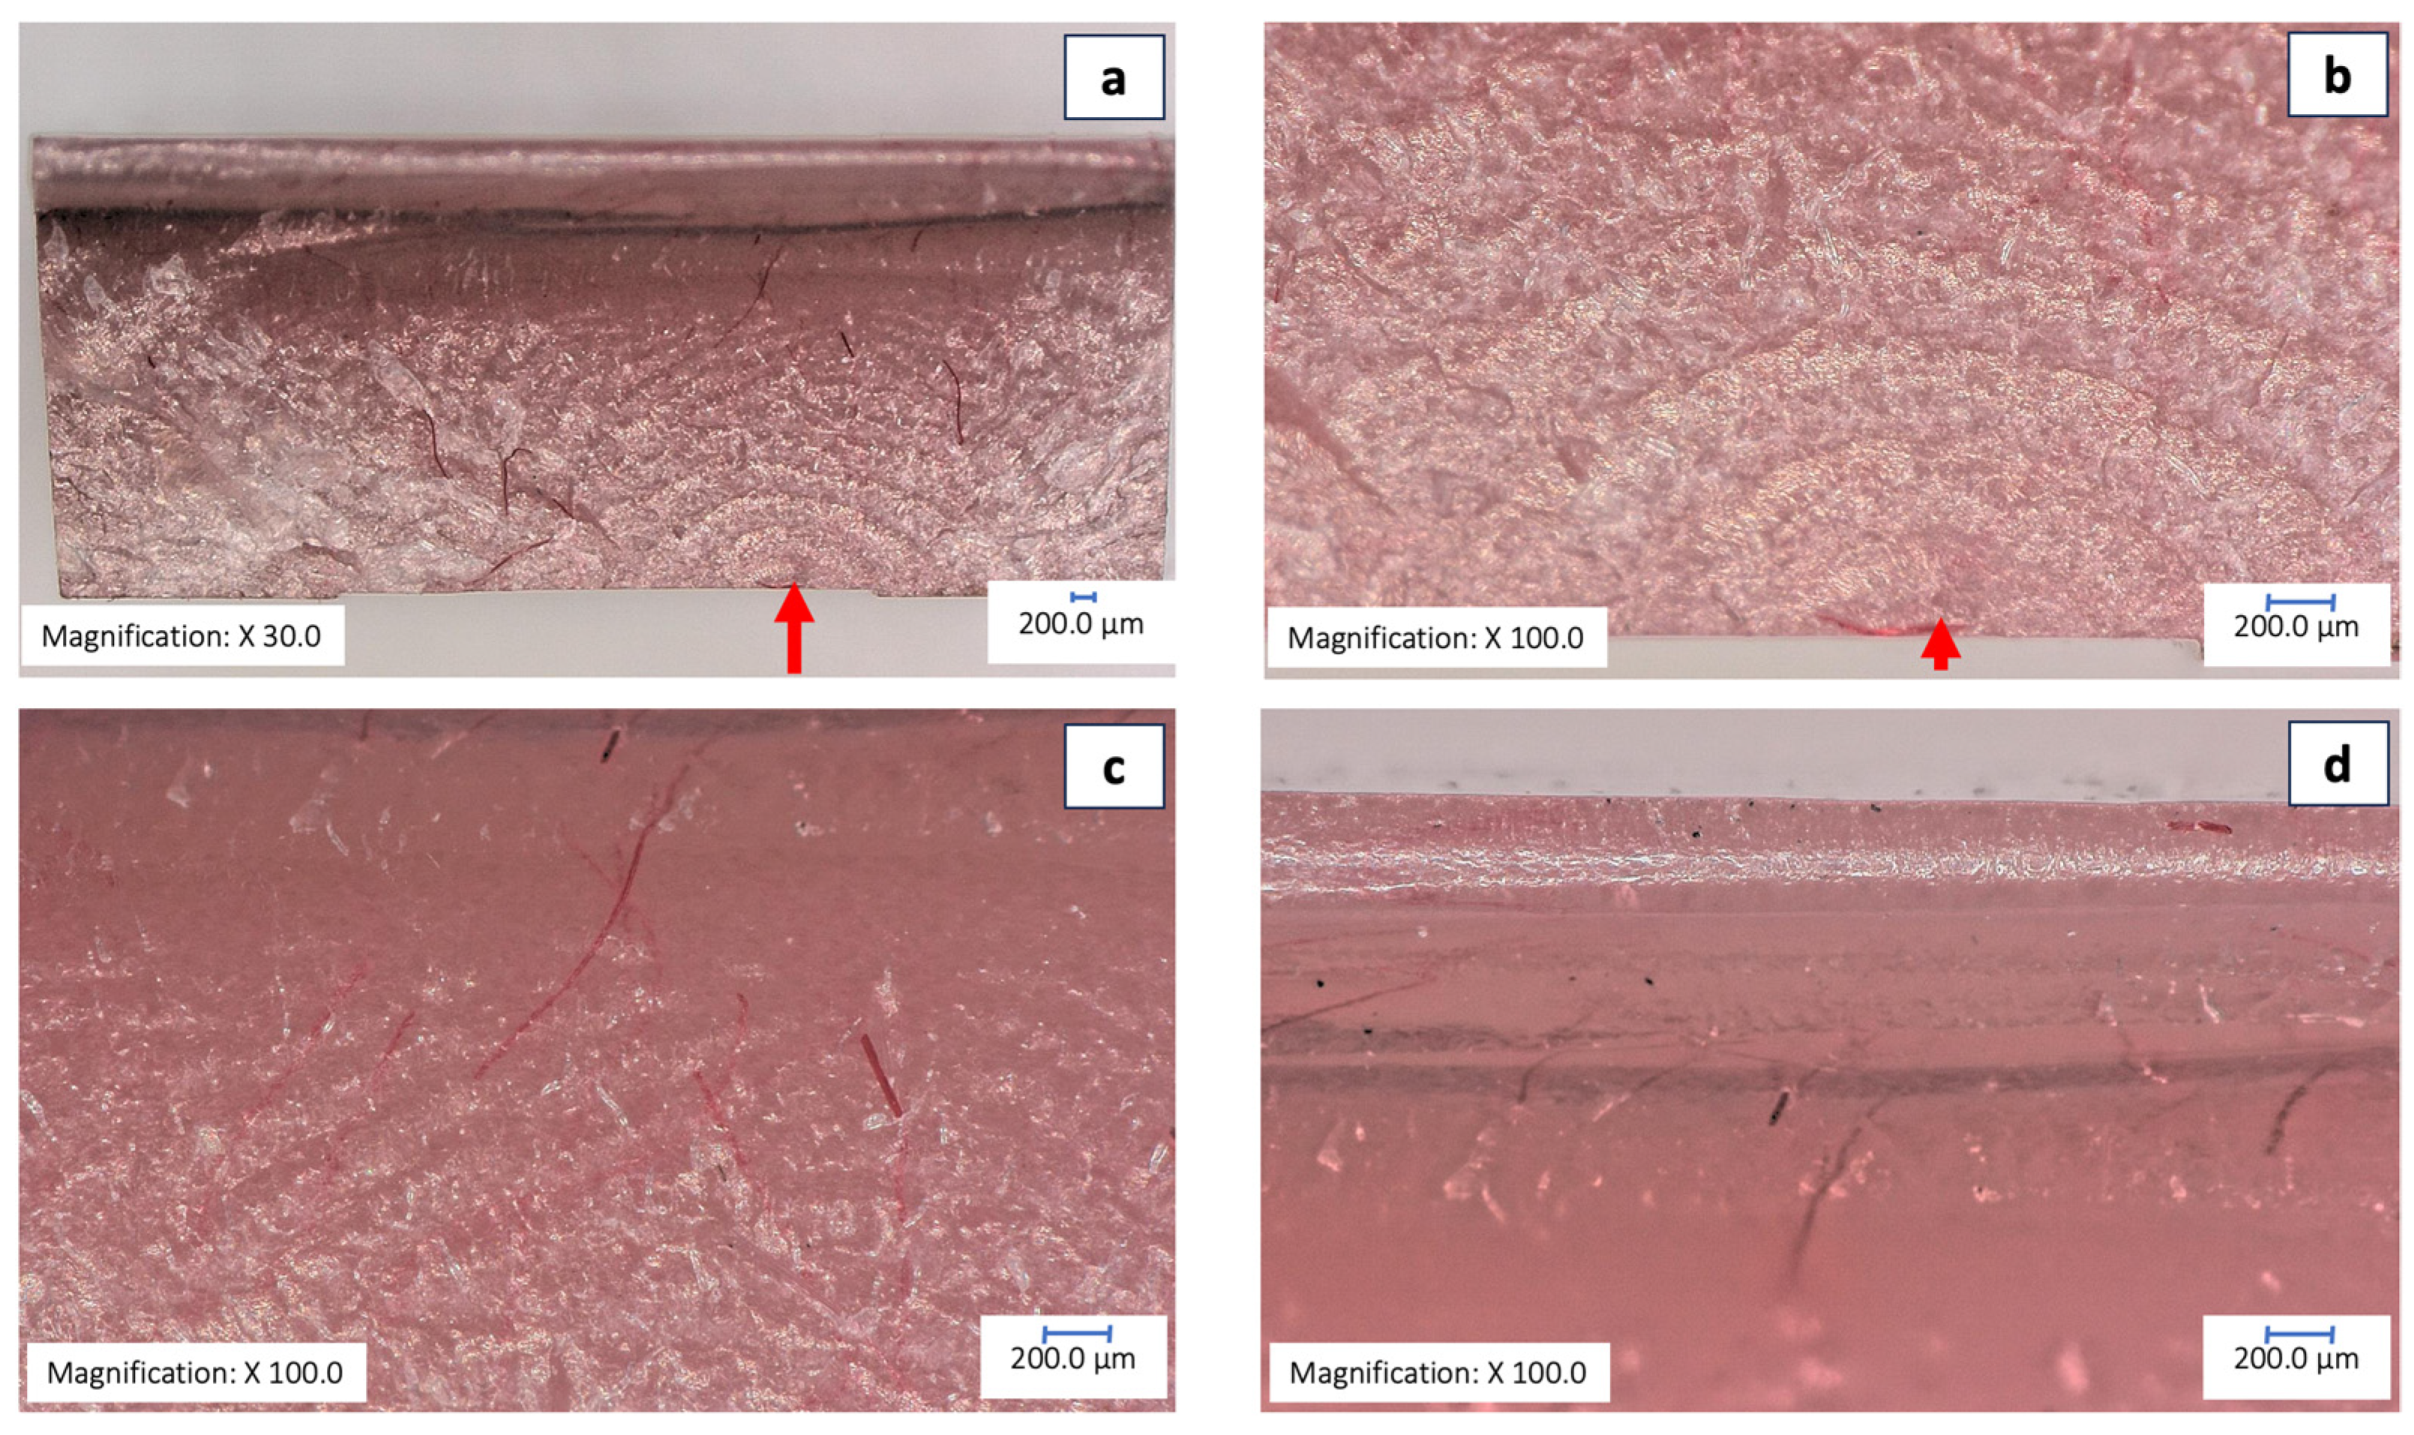
The milled group showed a different fracture pattern. First, the fractures followed the direction of the impact. Horizontal compression radial bands appeared, extending from the impact point toward the opposite side. The surfaces of the samples were less irregular than in the printed group. The samples showed fewer fracture facets. There was a color change (darkening) observed at the side opposite to the fracture. A closer view of compression bands showed increased diameters as they progressed to the opposite side. Some microfractures were observed running perpendicular to the compression bands. There was not a clear transition between the impact and the middle zone. The compression bands tended to disappear near the end of the middle zone. In some instances, microfractures were observed near the facets. Horizontal facets can be observed near the opposite side. There was a band of microfractures perpendicular to the facets. The surface was less irregular than at the middle and impact zones (Figure 7).

3.4.3. Fracture Analysis of the Milled-with-Framework Group

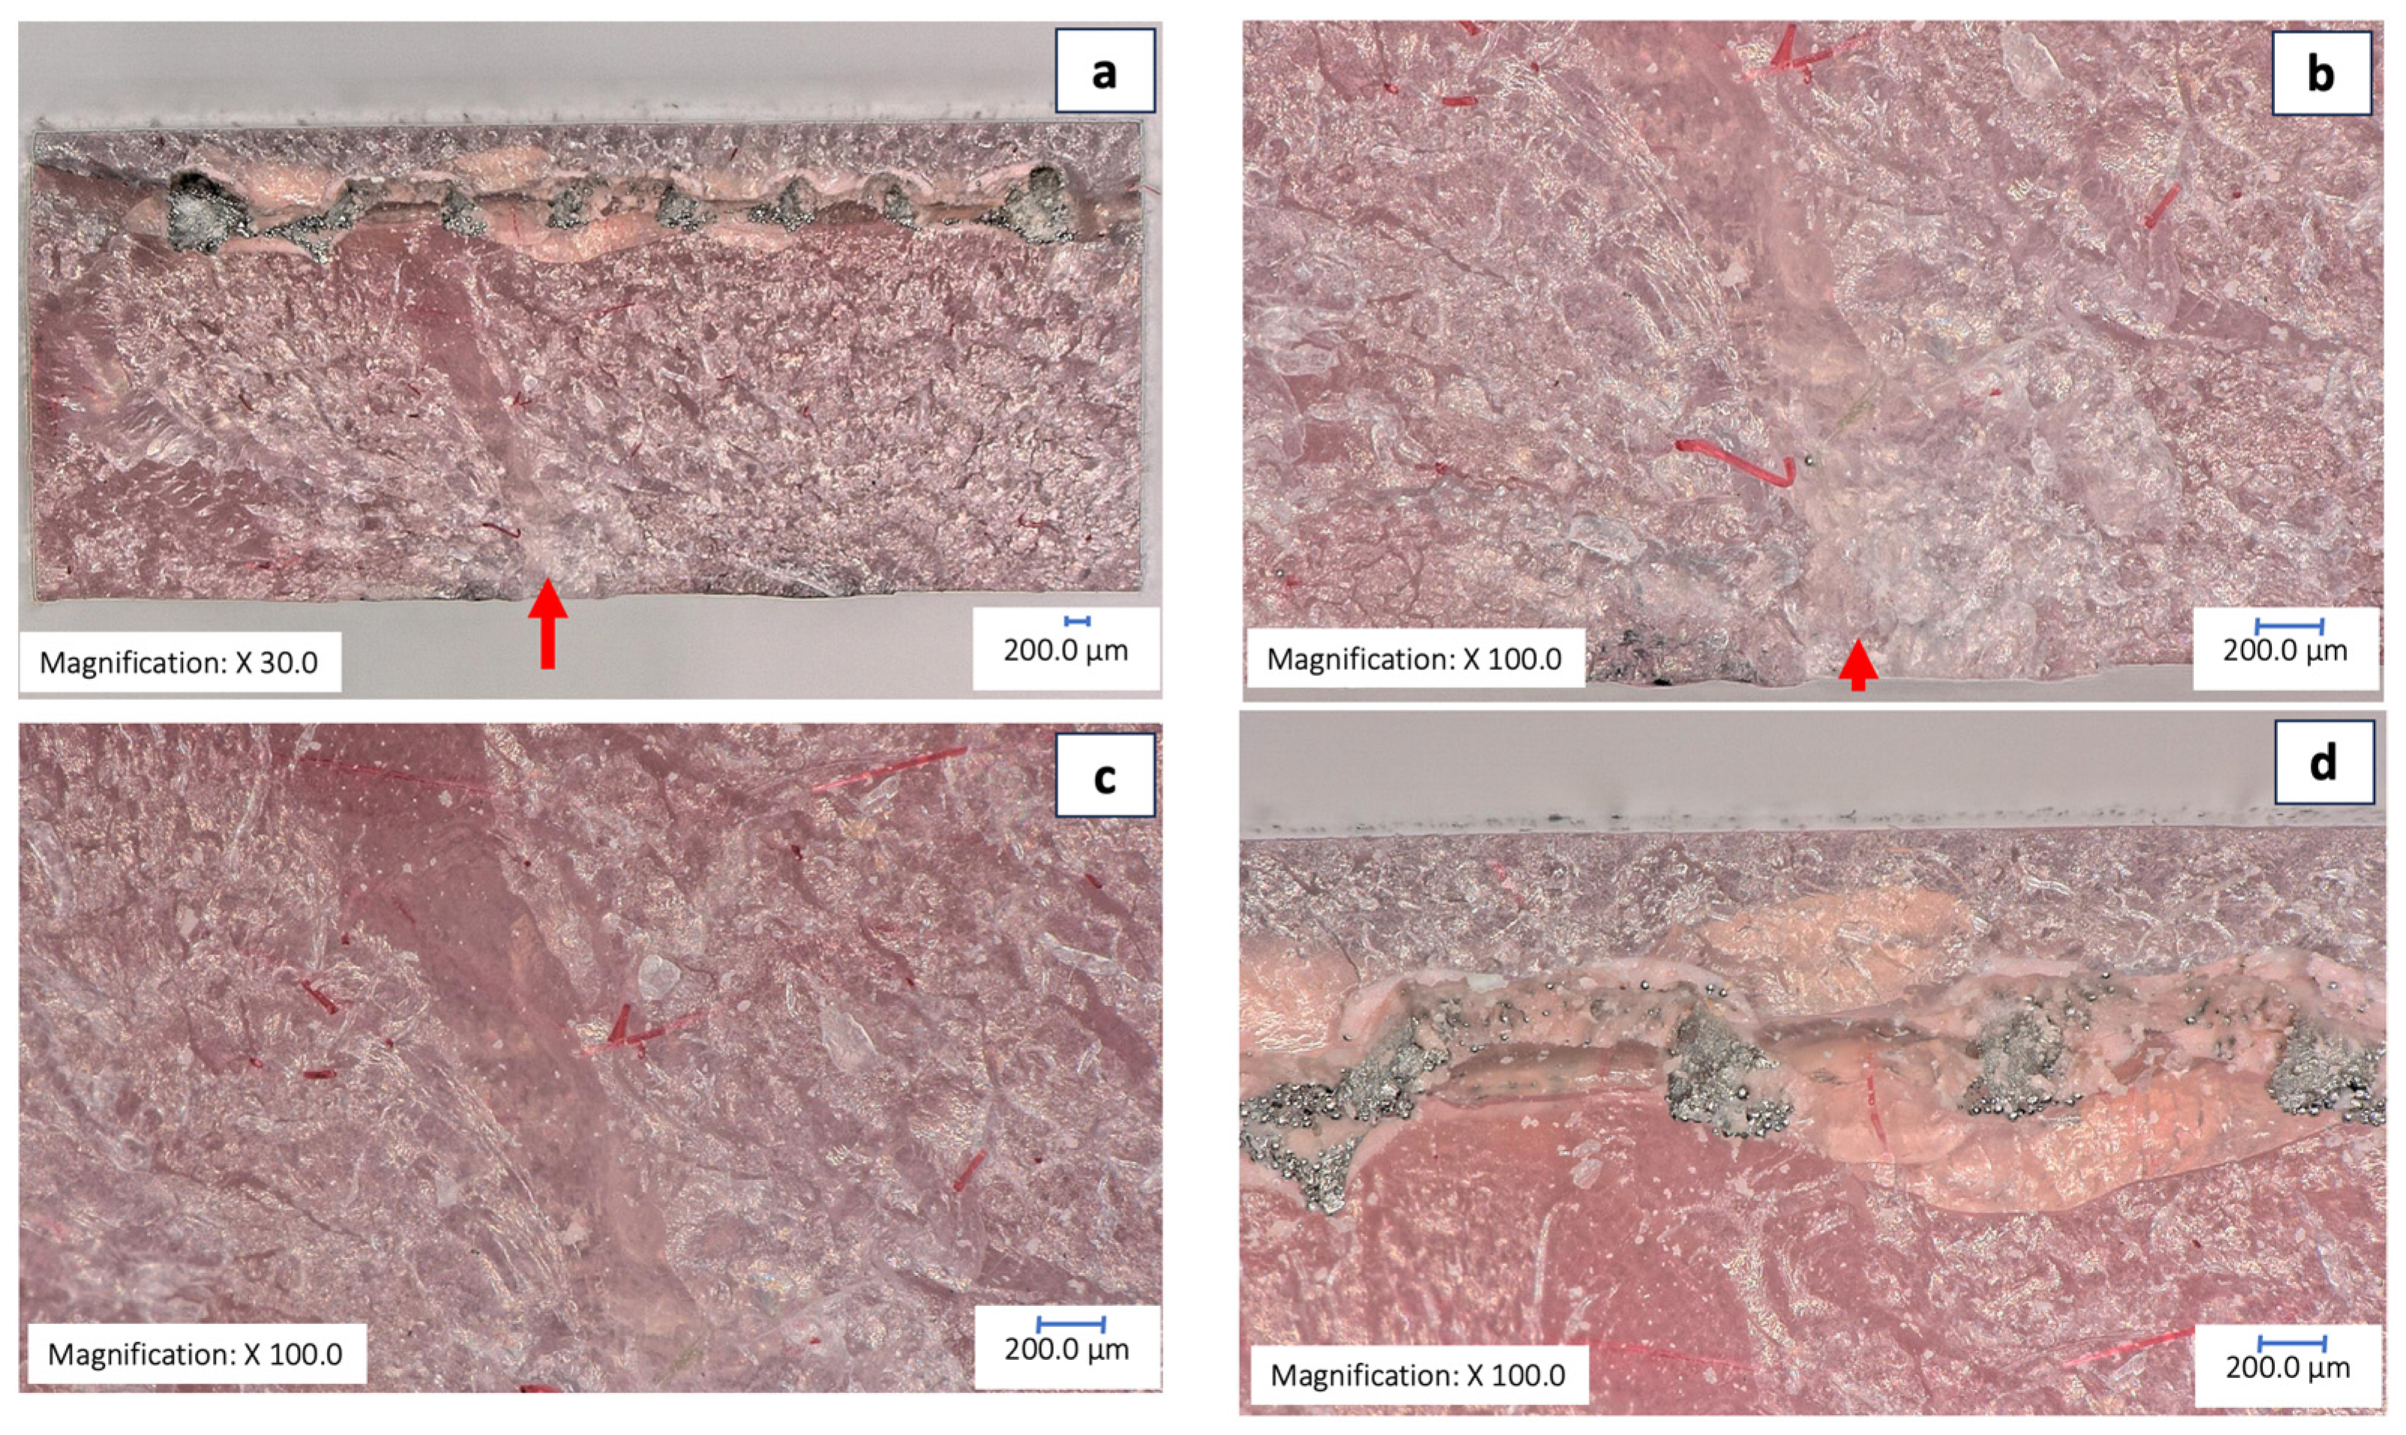
The milled group with reinforcement showed a pattern comparable to the milled group. However, not all samples showed fragment separation after the impact test. Smaller compression bands were observed, extending from the impact side along the sample. The impact occurred at the bottom of the samples, and the metal reinforcement could be seen at the side opposite to the impact (grey circles). In addition, an area compatible with an opaque or a coating was observed around the metal reinforcement. A close view of the impact zone showed the smaller size of compression bands as compared to the milled samples. The red fibers that simulate blood vessels were also observed. A close view of the impact zone showed the smaller size of the compression bands and their changing directions. The surface was slightly irregular. There was not a clear fracture orientation. Some fractures ran perpendicular to the metal reinforcement, then, when the fracture reached the reinforcement, stopped or disappeared. The layer covering the framework presented some microfractures in different directions (Figure 8).

4. Discussion

This study aimed to evaluate the elastic deformation, fracture toughness, and fracture characteristics following the impact test of three CAD/CAM denture base materials, including 3D-printed, milled, and milled with an embedded 3D-printed titanium framework. Our results showed that the milled samples suffered less deformation and possessed higher fracture toughness as compared to the 3D-printed samples. This is in agreement with the studies by Fouda et al. [26], who evaluated the flexural strength and hardness of conventional heat-polymerized acrylic resins, milled resins, and 3D-printed resins used for the fabrication of denture bases. Their results showed that milled resins possess higher flexural strength, elastic modulus, and hardness as compared to conventional resins and 3D-printed resins. Valenti et al. [27] evaluated the mechanical properties of 3D-printed prosthetic materials as compared to milled and conventional materials in in vitro studies. The materials included ceramics, polymers, and metals. Seventy-six studies were included, and their analysis concluded that 3D-printed polymeric materials possessed inferior flexural strength, fracture load, and hardness. Thus, their rigidity and fracture resistance does not support mastication forces for extended periods. Finally, Prpić et al. [28] found the lowest flexural strength in 3D-printed denture base samples in comparison to conventionally manufactured and milled CAD/CAM denture base materials.
If milled CAD/CAM denture base material is mechanically superior to conventional and 3D-printed denture base materials, why do we need to use reinforcements? Takahashi et al. [29] completed a comprehensive review of reinforcement in removable prosthodontics and its impact on the fracture and deformation of the prostheses and the quality of life of the patients who use them. Specifically, fracture and flexural strength and elastic modulus were compared in prostheses with and without reinforcement. Their results showed that metal reinforcements placed in thin and deformable areas effectively improved the mechanical properties of the prostheses and, indirectly, the patient’s quality of life by reducing the maintenance and repair of the prostheses. In addition, any material (conventional, milled, and 3D-printed) exposed to the oral environment for enough time will experience a decrease in the original values of fracture strength, modulus, and hardness. Therefore, including a reinforcement will counterbalance for these changes [24,25].
Denture bases with implant attachments, including balls or locators, have been associated with increased deformation and higher stress around the attachments, indicating the need for reinforcement in the denture bases [30]. Finally, it seems that the incorporation of a reinforcement reduces and redistribute the strains on the supporting structures, reducing the incidence of fractures in implant overdentures [31].
The thickness of our samples, 4 mm, was selected for standardization based on different in vitro studies. These studies determined that a thickness of 4 mm exhibited higher fracture toughness as compared to thicknesses of 3 mm and 2 mm [32]. Furthermore, CAD/CAM-manufactured samples of different thicknesses were tested to determine the minimal thickness that can satisfactorily withstand mechanical loads. This study concluded that CAD/CAM denture base resins with a thickness of 2 mm do not exhibit better mechanical properties as compared to conventional resins. Therefore, reinforcement was recommended for both types of resins when thicknesses are lower than 4 mm [33]. Given that in the clinical settings patients often prefer a minimal thickness for the denture base, the benefits of embedding 3D-printed titanium reinforcement could be applied.
The elastic deformations experienced by the 3D-printed samples resulted in higher standard deviations. This outcome is attributed more to the intrinsic nature of the 3D-printed material than to experimental inconsistencies. Printed materials fabricated from liquid resins possess inherent defects created during the printing process, such as porosity, layer separation, bubbling, and gaps, all of which adversely affect mechanical strength. In contrast, the pucks used for milling denture base materials are fabricated under standardized conditions of pressure and temperature, resulting in a denser structure with minimal porosity and improved mechanical properties [34,35,36].
A striking finding of the present study was that the fractures differed between samples. For example, the 3D-printed samples suffered from shattered fractures and were more brittle. Meanwhile, the milled samples showed mostly clean fractures, resulting in two or three pieces, and the milled and reinforced samples showed fractures but not the separation of the segments.
The limitations of this study include the absence of a control group fabricated by conventional methods and the omission of evaluation of other thicknesses of denture base materials. However, we used the printed group as a control to the milled and the milled-with-reinforced samples. To increase the validity and reproducibility, we followed ISO standards for the samples used in the mechanical tests. This allowed the comparisons to be centered on the fabrication method.

4.1. Practical Implications

The results of the present experimental study demonstrate that 3D-printed samples experience higher elastic deformation. Thus, 3D-printed complete dentures will experience deformation (flexing) and unstable occlusion under increased axial and non-axial loads (like these produced through clenching and bruxism). Furthermore, the lack of rigidity of 3D-printed denture bases can result in inefficient or reduced bite force, thus reducing the chewing efficiency.
In contrast, milled samples with reinforcement, as well as milled samples, exhibit lower elastic deformation, potentially resulting in more stable occlusion and higher masticatory efficiency. The resistance to impact fracture is superior in milled samples with a titanium framework as compared to milled samples without titanium frameworks and printed samples.
Therefore, based on these results, it is recommended to add a reinforcement method to any CAD/CAM denture base materials. This is particularly important for 3D-printed denture base materials. The fracture type of the printed samples was characterized by shattering, with fractures occurring in multiple directions, multiple fracture facets, material chipping, and material loss. Clinically, this implies that in the event of an impact, a 3D-printed denture may break into multiple pieces, which could preclude repair.

4.2. Opportunities for Research

Several aspects require further exploration, including the effect of CAD/CAM material thickness on reinforced versus non-reinforced CAD/CAM denture bases and the mechanical strength of milled denture bases incorporating 3D-printed frameworks with different thicknesses. It is also necessary to include a control group with conventionally fabricated denture bases for comparison with both the reinforced and non-reinforced CAD/CAM denture bases. Additionally, the effect of aging (thermocycling) on the mechanical properties of reinforced versus non-reinforced CAD/CAM denture base materials should be evaluated. Finally, it is important to investigate whether the reinforcement material leaches into the oral environment

5. Conclusions

Within the limitations of this experimental study, the null hypothesis can be rejected. This study found that milled denture base material, printed denture base material, and milled denture base material with an embedded metallic framework exhibit different flexural strength and impact fracture toughness.
Thus, the following can be concluded:
First, milled samples with an embedded 3D-printed titanium framework demonstrate higher resistance to impact as compared to milled samples without a framework and printed samples.
Second, milled samples with an embedded 3D-printed titanium framework show increased flexural strength and lower elastic deformation as compared to milled samples without a framework and printed samples.
Third, printed denture base material exhibits the lowest resistance to impact and the lowest flexural strength as compared to milled denture base materials with and without a framework.

Supplementary Materials

The following supporting information can be downloaded at: https://www.mdpi.com/article/10.3390/prosthesis6040053/s1.

Author Contributions

Conceptualization, R.D.-R.; data curation, I.B., A.A. and Y.F.; formal analysis, I.B. and A.A.; investigation, R.D.-R., I.B., A.A. and Y.F.; methodology, R.D.-R., G.R. and M.R.; resources, R.D.-R., G.R. and M.R.; software, R.D.-R. and Y.F.; supervision, R.D.-R.; validation, R.D.-R., I.B. and A.A.; visualization, R.D.-R., I.B. and A.A.; writing—original draft, I.B. and A.A.; writing—review and editing, R.D.-R., I.B., A.A., Y.F., G.R. and M.R. All authors have read and agreed to the published version of the manuscript.

Funding

This research received no external funding.

Institutional Review Board Statement

Not applicable.

Informed Consent Statement

Not applicable.

Data Availability Statement

Raw data are available in Supplementary Materials and further data will be made available upon request to the authors.

Acknowledgments

The authors acknowledgment the technical support of Axel Calderon from the Center for Implant Digital Technology (CIDT) of the School of Dental Medicine at Stony Brook University. The authors also acknowledge the access to the ThINC facilities at the Advanced Energy Center, Stony Brook University, supported by Myriam Rafailovich.

Conflicts of Interest

The authors declare no conflicts of interest.

References

  1. Xie, Q.; Ding, T.; Yang, G. Rehabilitation of Oral Function with Removable Dentures--Still an Option? J. Oral. Rehabil. 2015, 42, 234–242. [Google Scholar] [CrossRef] [PubMed]
  2. Salloum, A.M. Effect of Adding Basalt Powder on Flexural Strength of a Denture Base Acrylic Resin. BJSTR 2019, 18, 13205–13210. [Google Scholar] [CrossRef]
  3. Rickman, L.J.; Padipatvuthikul, P.; Satterthwaite, J.D. Contemporary Denture Base Resins: Part 1. Dent. Update 2012, 39, 25–30. [Google Scholar] [CrossRef] [PubMed]
  4. Zafar, M.S. Prosthodontic Applications of Polymethyl Methacrylate (PMMA): An Update. Polymers 2020, 12, 2299. [Google Scholar] [CrossRef] [PubMed]
  5. Beyli, M.S.; von Fraunhofer, J.A. An Analysis of Causes of Fracture of Acrylic Resin Dentures. J. Prosthet. Dent. 1981, 46, 238–241. [Google Scholar] [CrossRef] [PubMed]
  6. Nandal, S.; Ghalaut, P.; Shekhawat, H.; Gulati, M. New Era in Denture Base Resins: A Review. Dent. J. Adv. Stud. 2013, 01, 136–143. [Google Scholar] [CrossRef]
  7. Prombonas, A.E.; Vlissidis, D.S. Comparison of the Midline Stress Fields in Maxillary and Mandibular Complete Dentures: A Pilot Study. J. Prosthet. Dent. 2006, 95, 63–70. [Google Scholar] [CrossRef] [PubMed]
  8. Cilingir, A.; Bilhan, H.; Baysal, G.; Sunbuloglu, E.; Bozdag, E. The Impact of Frenulum Height on Strains in Maxillary Denture Bases. J. Adv. Prosthodont. 2013, 5, 409–415. [Google Scholar] [CrossRef] [PubMed]
  9. Polyzois, G.L.; Tarantili, P.A.; Frangou, M.J.; Andreopoulos, A.G. Fracture Force, Deflection at Fracture, and Toughness of Repaired Denture Resin Subjected to Microwave Polymerization or Reinforced with Wire or Glass Fiber. J. Prosthet. Dent. 2001, 86, 613–619. [Google Scholar] [CrossRef]
  10. Wiskott, H.W.; Nicholls, J.I.; Belser, U.C. Stress Fatigue: Basic Principles and Prosthodontic Implications. Int. J. Prosthodont. 1995, 8, 105–116. [Google Scholar]
  11. Steinmassl, P.-A.; Wiedemair, V.; Huck, C.; Klaunzer, F.; Steinmassl, O.; Grunert, I.; Dumfahrt, H. Do CAD/CAM Dentures Really Release Less Monomer than Conventional Dentures? Clin. Oral. Investig. 2017, 21, 1697–1705. [Google Scholar] [CrossRef] [PubMed]
  12. Aldegheishem, A.; AlDeeb, M.; Al-Ahdal, K.; Helmi, M.; Alsagob, E.I. Influence of Reinforcing Agents on the Mechanical Properties of Denture Base Resin: A Systematic Review. Polymers 2021, 13, 3083. [Google Scholar] [CrossRef] [PubMed]
  13. Gad, M.M.; Abualsaud, R.; Al-Thobity, A.M.; Baba, N.Z.; Al-Harbi, F.A. Influence of Addition of Different Nanoparticles on the Surface Properties of Poly(Methylmethacrylate) Denture Base Material. J. Prosthodont. 2020, 29, 422–428. [Google Scholar] [CrossRef] [PubMed]
  14. Abdulrazzaq Naji, S.; Behroozibakhsh, M.; Jafarzadeh Kashi, T.S.; Eslami, H.; Masaeli, R.; Mahgoli, H.; Tahriri, M.; Ghavvami Lahiji, M.; Rakhshan, V. Effects of Incorporation of 2.5 and 5 Wt% TiO2 Nanotubes on Fracture Toughness, Flexural Strength, and Microhardness of Denture Base Poly Methyl Methacrylate (PMMA). J. Adv. Prosthodont. 2018, 10, 113. [Google Scholar] [CrossRef] [PubMed]
  15. Khan, A.A.; Fareed, M.A.; Alshehri, A.H.; Aldegheishem, A.; Alharthi, R.; Saadaldin, S.A.; Zafar, M.S. Mechanical Properties of the Modified Denture Base Materials and Polymerization Methods: A Systematic Review. Int. J. Mol. Sci. 2022, 23, 5737. [Google Scholar] [CrossRef] [PubMed]
  16. Bangera, M.K.; Kotian, R.; Ravishankar, N. Effect of Titanium Dioxide Nanoparticle Reinforcement on Flexural Strength of Denture Base Resin: A Systematic Review and Meta-Analysis. Jpn. Dent. Sci. Rev. 2020, 56, 68–76. [Google Scholar] [CrossRef] [PubMed]
  17. Alla, R.K.; Sajjan, S.; Alluri, V.R.; Ginjupalli, K.; Upadhya, N. Influence of Fiber Reinforcement on the Properties of Denture Base Resins. JBNB 2013, 4, 91–97. [Google Scholar] [CrossRef]
  18. Oluwajana, F.; Walmsley, A.D. Titanium Alloy Removable Partial Denture Framework in a Patient with a Metal Allergy: A Case Study. Br. Dent. J. 2012, 213, 123–124. [Google Scholar] [CrossRef] [PubMed]
  19. Mourouzis, P.; Pandoleon, P.; Tortopidis, D.; Tolidis, K. Clinical Evaluation of Removable Partial Dentures with Digitally Fabricated Metal Framework after 4 Years of Clinical Service. J. Prosthodont. 2024, 33, 5–11. [Google Scholar] [CrossRef]
  20. Park, K.; Kang, N.-G.; Lee, J.-H.; Srinivasan, M. Removable Complete Denture with a Metal Base: Integration of Digital Design and Conventional Fabrication Techniques. J. Esthet. Restor. Dent. 2023, 36, 255–262. [Google Scholar] [CrossRef]
  21. Peterson, L.J.; Ellis, E.; Hupp, J.R.; Tucker, M.R. Contemporary Oral and Maxillofacial Surgery; Elsevier Health Sciences: Philadelphia, PA, USA, 2018. [Google Scholar]
  22. de Oliveira Limírio, J.P.J.; de Luna Gomes, J.M.; Alves Rezende, M.C.R.; Lemos, C.A.A.; Rosa, C.D.D.R.D.; Pellizzer, E.P. Mechanical Properties of Polymethyl Methacrylate as a Denture Base: Conventional versus CAD-CAM Resin—A Systematic Review and Meta-Analysis of in Vitro Studies. J. Prosthet. Dent. 2022, 128, 1221–1229. [Google Scholar] [CrossRef]
  23. Abdul-Monem, M.M.; Hanno, K.I. Effect of Thermocycling on Surface Topography and Fracture Toughness of Milled and Additively Manufactured Denture Base Materials: An in-Vitro Study. BMC Oral Health 2024, 24, 267. [Google Scholar] [CrossRef]
  24. Hanno, K.I.; Abdul-Monem, M.M. Effect of Denture Cleansers on the Physical and Mechanical Properties of CAD-CAM Milled and 3D Printed Denture Base Materials: An in Vitro Study. J. Prosthet. Dent. 2023, 130, 798.e1–798.e8. [Google Scholar] [CrossRef]
  25. Amaral, C.F.; Gomes, R.S.; Rodrigues Garcia, R.C.M.; Del Bel Cury, A.A. Stress Distribution of Single-Implant-Retained Overdenture Reinforced with a Framework: A Finite Element Analysis Study. J. Prosthet. Dent. 2018, 119, 791–796. [Google Scholar] [CrossRef]
  26. Fouda, S.M.; Gad, M.M.; Abualsaud, R.; Ellakany, P.; AlRumaih, H.S.; Khan, S.Q.; Akhtar, S.; Al-Qarni, F.D.; Al-Harbi, F.A. Flexural Properties and Hardness of CAD-CAM Denture Base Materials. J. Prosthodont. 2023, 32, 318–324. [Google Scholar] [CrossRef]
  27. Valenti, C.; Isabella Federici, M.; Masciotti, F.; Marinucci, L.; Xhimitiku, I.; Cianetti, S.; Pagano, S. Mechanical Properties of 3D-Printed Prosthetic Materials Compared with Milled and Conventional Processing: A Systematic Review and Meta-Analysis of in Vitro Studies. J. Prosthet. Dent. 2022. Online ahead of print. [Google Scholar] [CrossRef]
  28. Prpić, V.; Schauperl, Z.; Ćatić, A.; Dulčić, N.; Čimić, S. Comparison of Mechanical Properties of 3D-Printed, CAD/CAM, and Conventional Denture Base Materials. J. Prosthodont. 2020, 29, 524–528. [Google Scholar] [CrossRef]
  29. Takahashi, T.; Gonda, T.; Mizuno, Y.; Fujinami, Y.; Maeda, Y. Reinforcement in Removable Prosthodontics: A Literature Review. J. Oral Rehabil. 2017, 44, 133–143. [Google Scholar] [CrossRef]
  30. ELsyad, M.A.; Errabti, H.M.; Mustafa, A.Z. Mandibular Denture Base Deformation with Locator and Ball Attachments of Implant-Retained Overdentures. J. Prosthodont. 2016, 25, 656–664. [Google Scholar] [CrossRef]
  31. Gibreel, M.F.; Khalifa, A.; Said, M.M.; Mahanna, F.; El-Amier, N.; Närhi, T.O.; Perea-Lowery, L.; Vallittu, P.K. Biomechanical Aspects of Reinforced Implant Overdentures: A Systematic Review. J. Mech. Behav. Biomed. Mater. 2019, 91, 202–211. [Google Scholar] [CrossRef]
  32. Tokgoz, S.; Ozdiler, A.; Gencel, B.; Bozdag, E.; Isık-Ozkol, G. Effects of Denture Base Thicknesses and Reinforcement on Fracture Strength in Mandibular Implant Overdenture with Bar Attachment: Under Various Acrylic Resin Types. Eur. J. Dent. 2019, 13, 64–68. [Google Scholar] [CrossRef] [PubMed]
  33. Steinmassl, O.; Offermanns, V.; Stöckl, W.; Dumfahrt, H.; Grunert, I.; Steinmassl, P.-A. In Vitro Analysis of the Fracture Resistance of CAD/CAM Denture Base Resins. Materials 2018, 11, 401. [Google Scholar] [CrossRef] [PubMed]
  34. Galati, M.; Minetola, P. On the measure of the aesthetic quality of 3D printed plastic parts. Int. J. Interact. Des. Manuf. 2020, 14, 381–392. [Google Scholar] [CrossRef]
  35. Erokhin, K.; Naumov, S.; Ananikov, V. Defects in 3D Printing and Strategies to Enhance Quality of FFF Additive Manufacturing. A Review. 2023. Available online: https://chemrxiv.org/engage/chemrxiv/article-details/6516b0aba69febde9eea81b1 (accessed on 1 June 2024).
  36. Holzmond, O.; Li, X. In situ real time defect detection of 3D printed parts. Addit. Manuf. 2017, 17, 135–142. [Google Scholar] [CrossRef]
Figure 1. Scheme of the sample distribution. Three groups of 22 samples were fabricated by different CAD/CAM methods. Two experiments were carried out: a three-point bending test and an impact fracture test.
Prosthesis 06 00053 g001
Figure 2. (a) Image showing samples of one bar from each experimental group: Milled (M), Printed (P), and Milled + Framework (M + F). The white arrows point to the location of the framework toward the left side of the M + F bar. The photos were obtained using the digital microscope Keyence VHX-6000, Keyence, Itasca, MN, USA. The magnification is 20×. (b) Image composition showing one sample of each experimental group observed under a transmitted light microscope, Milled (M), Printed (P), and Milled + Framework (M + F). The milled samples under transmitted light look orange and possess more characterization, including the simulated blood vessels, and the M + F shows the framework. The printed sample is pick and plain without color characterization. The photos were obtained using the digital microscope Keyence VHX-6000, Keyence, Itasca, MN, USA. Magnification 20×.
Prosthesis 06 00053 g002
Figure 3. (a) Stress/strain curves for 10 printed samples. (b) Stress/strain curves for 10 milled samples. (c) Stress/strain cures for 10 milled and reinforced samples.
Prosthesis 06 00053 g003
Figure 4. Deformation during the three-point bending test was present in all the groups. The displacement is measured in micrometers, and ten samples are measured per group: P (Printed), W (milled without reinforcement), F (milled with framework), and P (212 µm) groups. The vertical dotted lines separate each group (F, W, and P).
Prosthesis 06 00053 g004
Figure 5. Representative photos of printed (P), milled (M), and reinforced samples (F). Different fractures occurred; the P group showed mainly shattered fractures, the M group showed clean fractures, and the F group showed a bent fracture (the framework keeps the segments united).
Prosthesis 06 00053 g005
Figure 6. Printed samples: analysis of the fragments after the impact fracture test. (a) This image illustrates an overview of one fragment. Multiple shattered zones can be observed. The red arrow points to the area where the impact occurred. Magnification is 30×. (b) This image shows the impact zone (darker area) in a close view. Magnification is 100×. (c) This image shows the middle portion of the sample. Magnification is 100×. (d) This image demonstrates the opposite side to the impact where the microfractures extend. The red circle illustrates an area with microfractures. Magnification is 100×.
Prosthesis 06 00053 g006
Figure 7. Milled samples without reinforcement. Analysis of the fragments after the impact fracture test. In general, the fracture is cleaner and not shattered. (a) Overview of one fragment. The red arrow points to the area where the impact occurred. Compression bands irradiate from the impact point toward the opposite side. Magnification is 30×. (b) This image shows a close view of the impact zone. Alternant clear and dark bands can be observed. Magnification is 100×. (c) This image shows the middle portion of the sample. Also, red filaments (simulating blood vessels) can be seen embedded in the sample. Magnification is 100×. (d) This image demonstrates the opposite side to the impact where some microfractures can also be seen. Magnification is 100×.
Prosthesis 06 00053 g007
Figure 8. Milled and reinforced samples. Analysis of the fragments after the impact fracture test. (a), Overview. The red arrow at the base of the sample shows the impact zone. At the top of the sample the reinforcement can be observed. Some compression bands can be observed. Magnification is 30×. (b) The red arrow illustrates the impact zone in a close view. Magnification is 100× (c) This image shows the middle portion of the sample. Magnification is 100×. (d) This image demonstrates the side opposite to the impact and the framework section. Magnification is 100×.
Prosthesis 06 00053 g008
Table 1. Elastic deformation for the three groups, including mean, standard deviation, and median distributions. Additional details and information are included in Supplementary Materials.
FactorNMeanStDev
Printed10212.0129.03
Milled10133.0185.12
Milled + reinforcement1074.4847.57
Table 2. Statistical comparisons. Differences between means and p values.
Comparisons between GroupsDifference
of Means
95% CIAdjusted p-Value
Milled Vs Printed−79.0(−103.9, −54.0)0.001
Milled + reinforced Vs Printed−137.5(−162.5, −112.6)0.001
Milled + reinforced Vs Milled−58.5(−83.5, −33.6)0.002
Table 3. Descriptive statistics of the fracture toughness of CAD/CAM denture base materials: kJ/m2 (Kilojoules/sectional area).
GroupsNMeanStDev
Milled kJ/m2108.6341.225
Milled + reinforcement kJ/m21015.2032.244
Printed kJ/m2106.3042.600
Table 4. Multiple group comparisons: Tukey post-test.
Difference of LevelsDifference of Means95% CIAdjusted p-Value
Milled + reinforcement Vs Milled6.569(4.968, 8.170)0.001
Printed Vs Milled−2.330(−3.931, −0.729)0.003
Printed Vs Milled + reinforcement −8.899(−10.499, −7.298)0.001
Disclaimer/Publisher’s Note: The statements, opinions and data contained in all publications are solely those of the individual author(s) and contributor(s) and not of MDPI and/or the editor(s). MDPI and/or the editor(s) disclaim responsibility for any injury to people or property resulting from any ideas, methods, instructions or products referred to in the content.