
Seismic Performance Prediction of RC, BRB and SDOF Structures Using Deep Learning and the Intensity Measure INp
 , , , and
Abstract
:1. Introduction
1.1. Intensity Measures
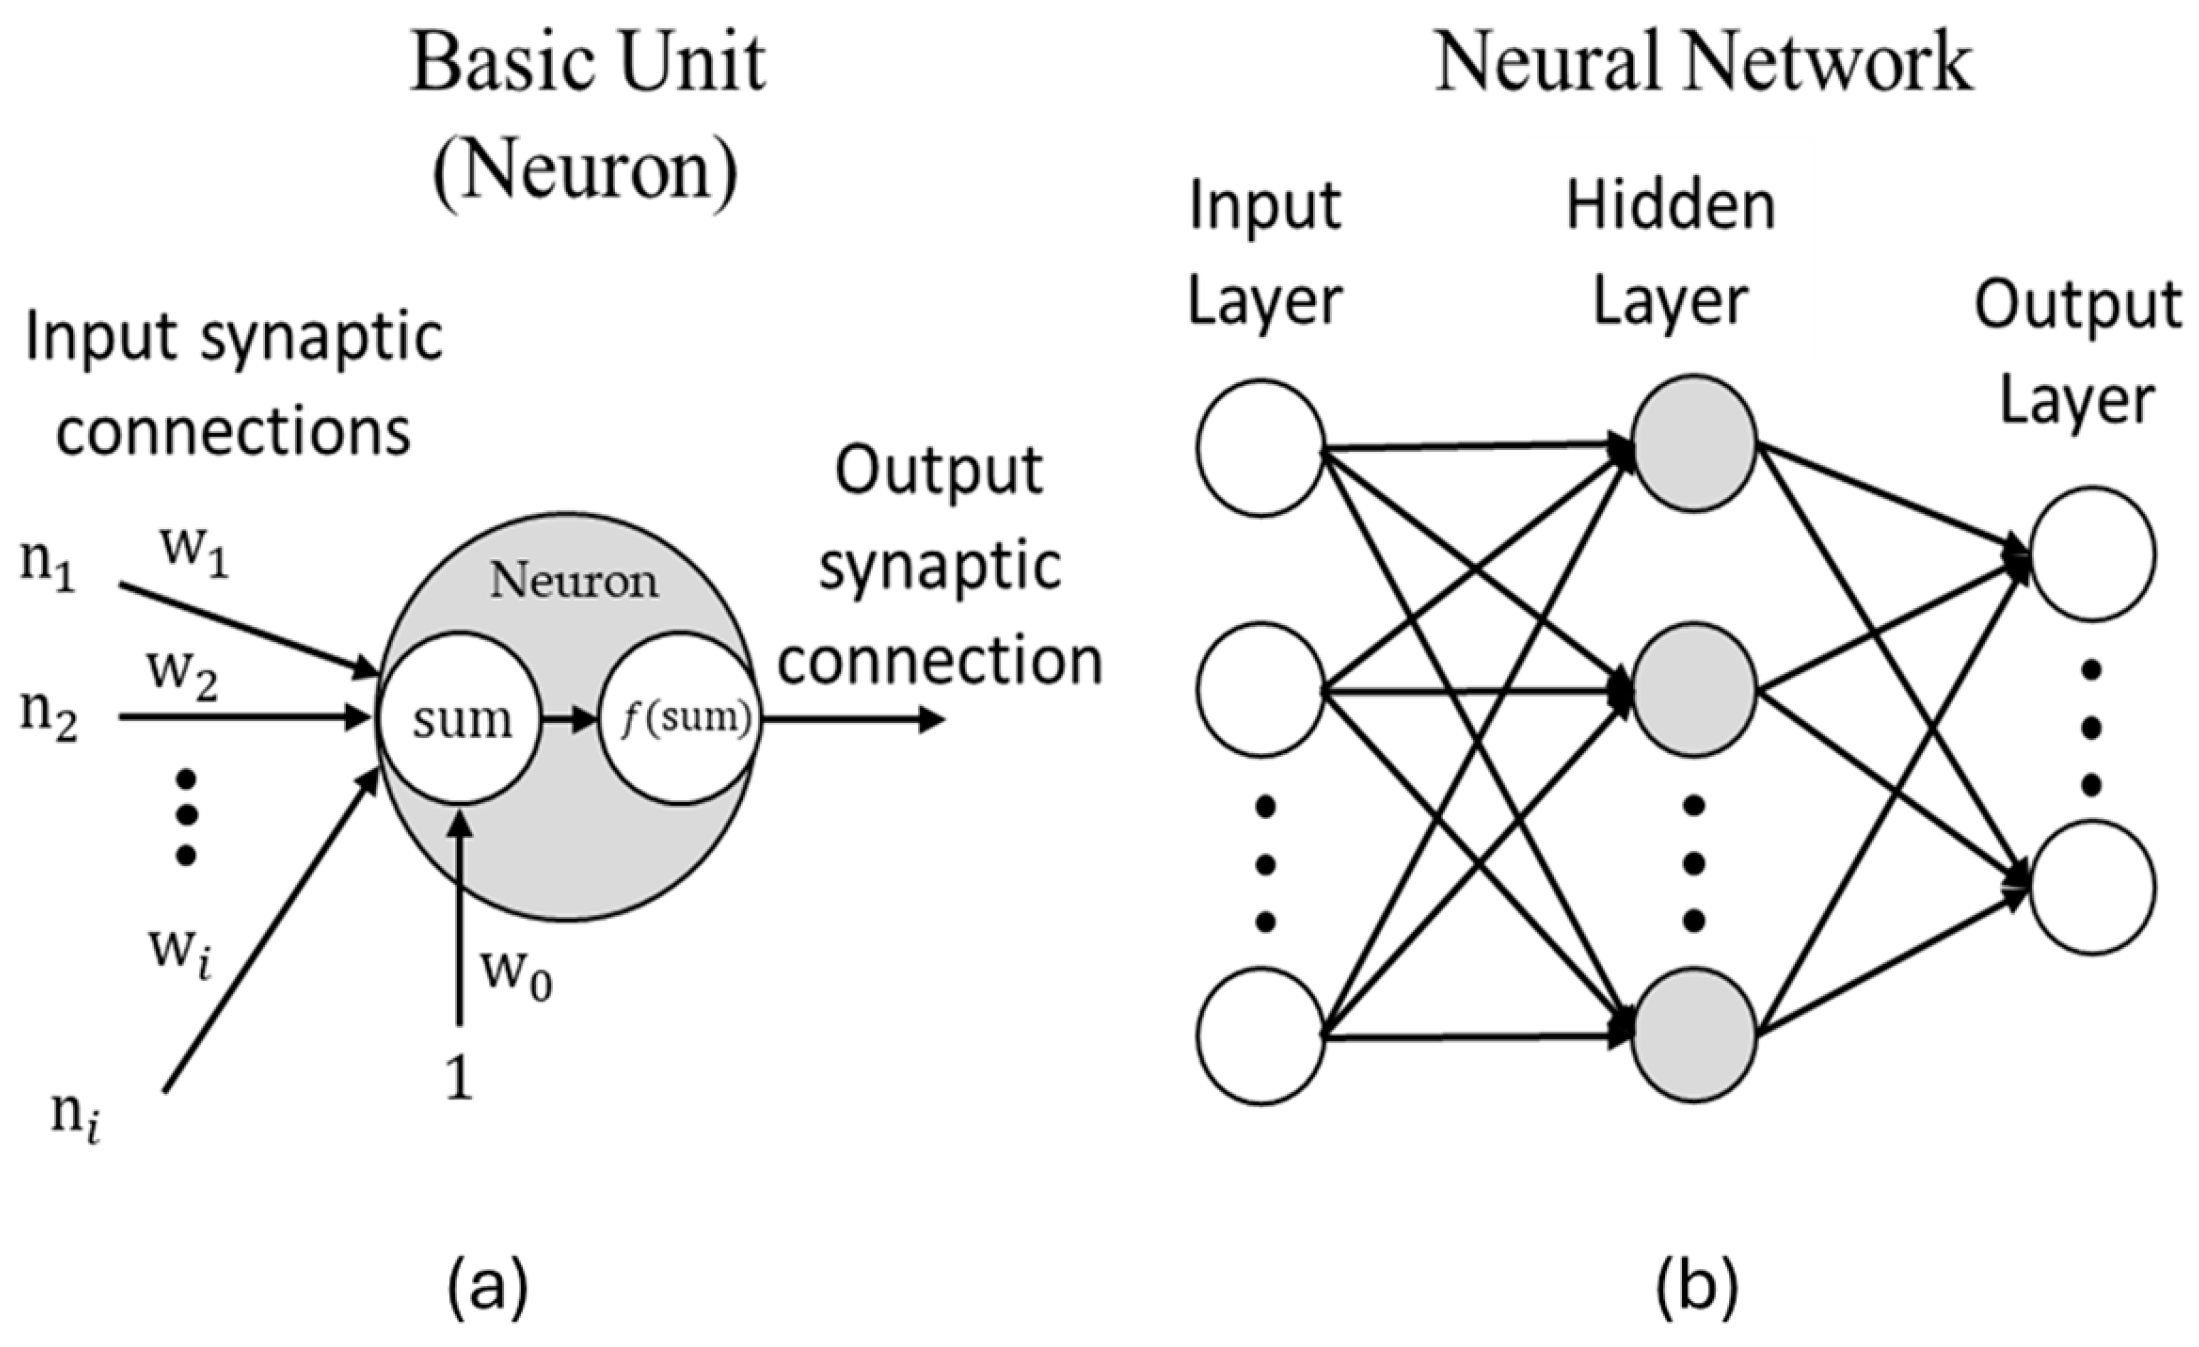
1.2. Advances in Artificial Neural Networks
1.3. Neural Networks in Civil Engineering
2. Theoretical Framework
3. Methodology
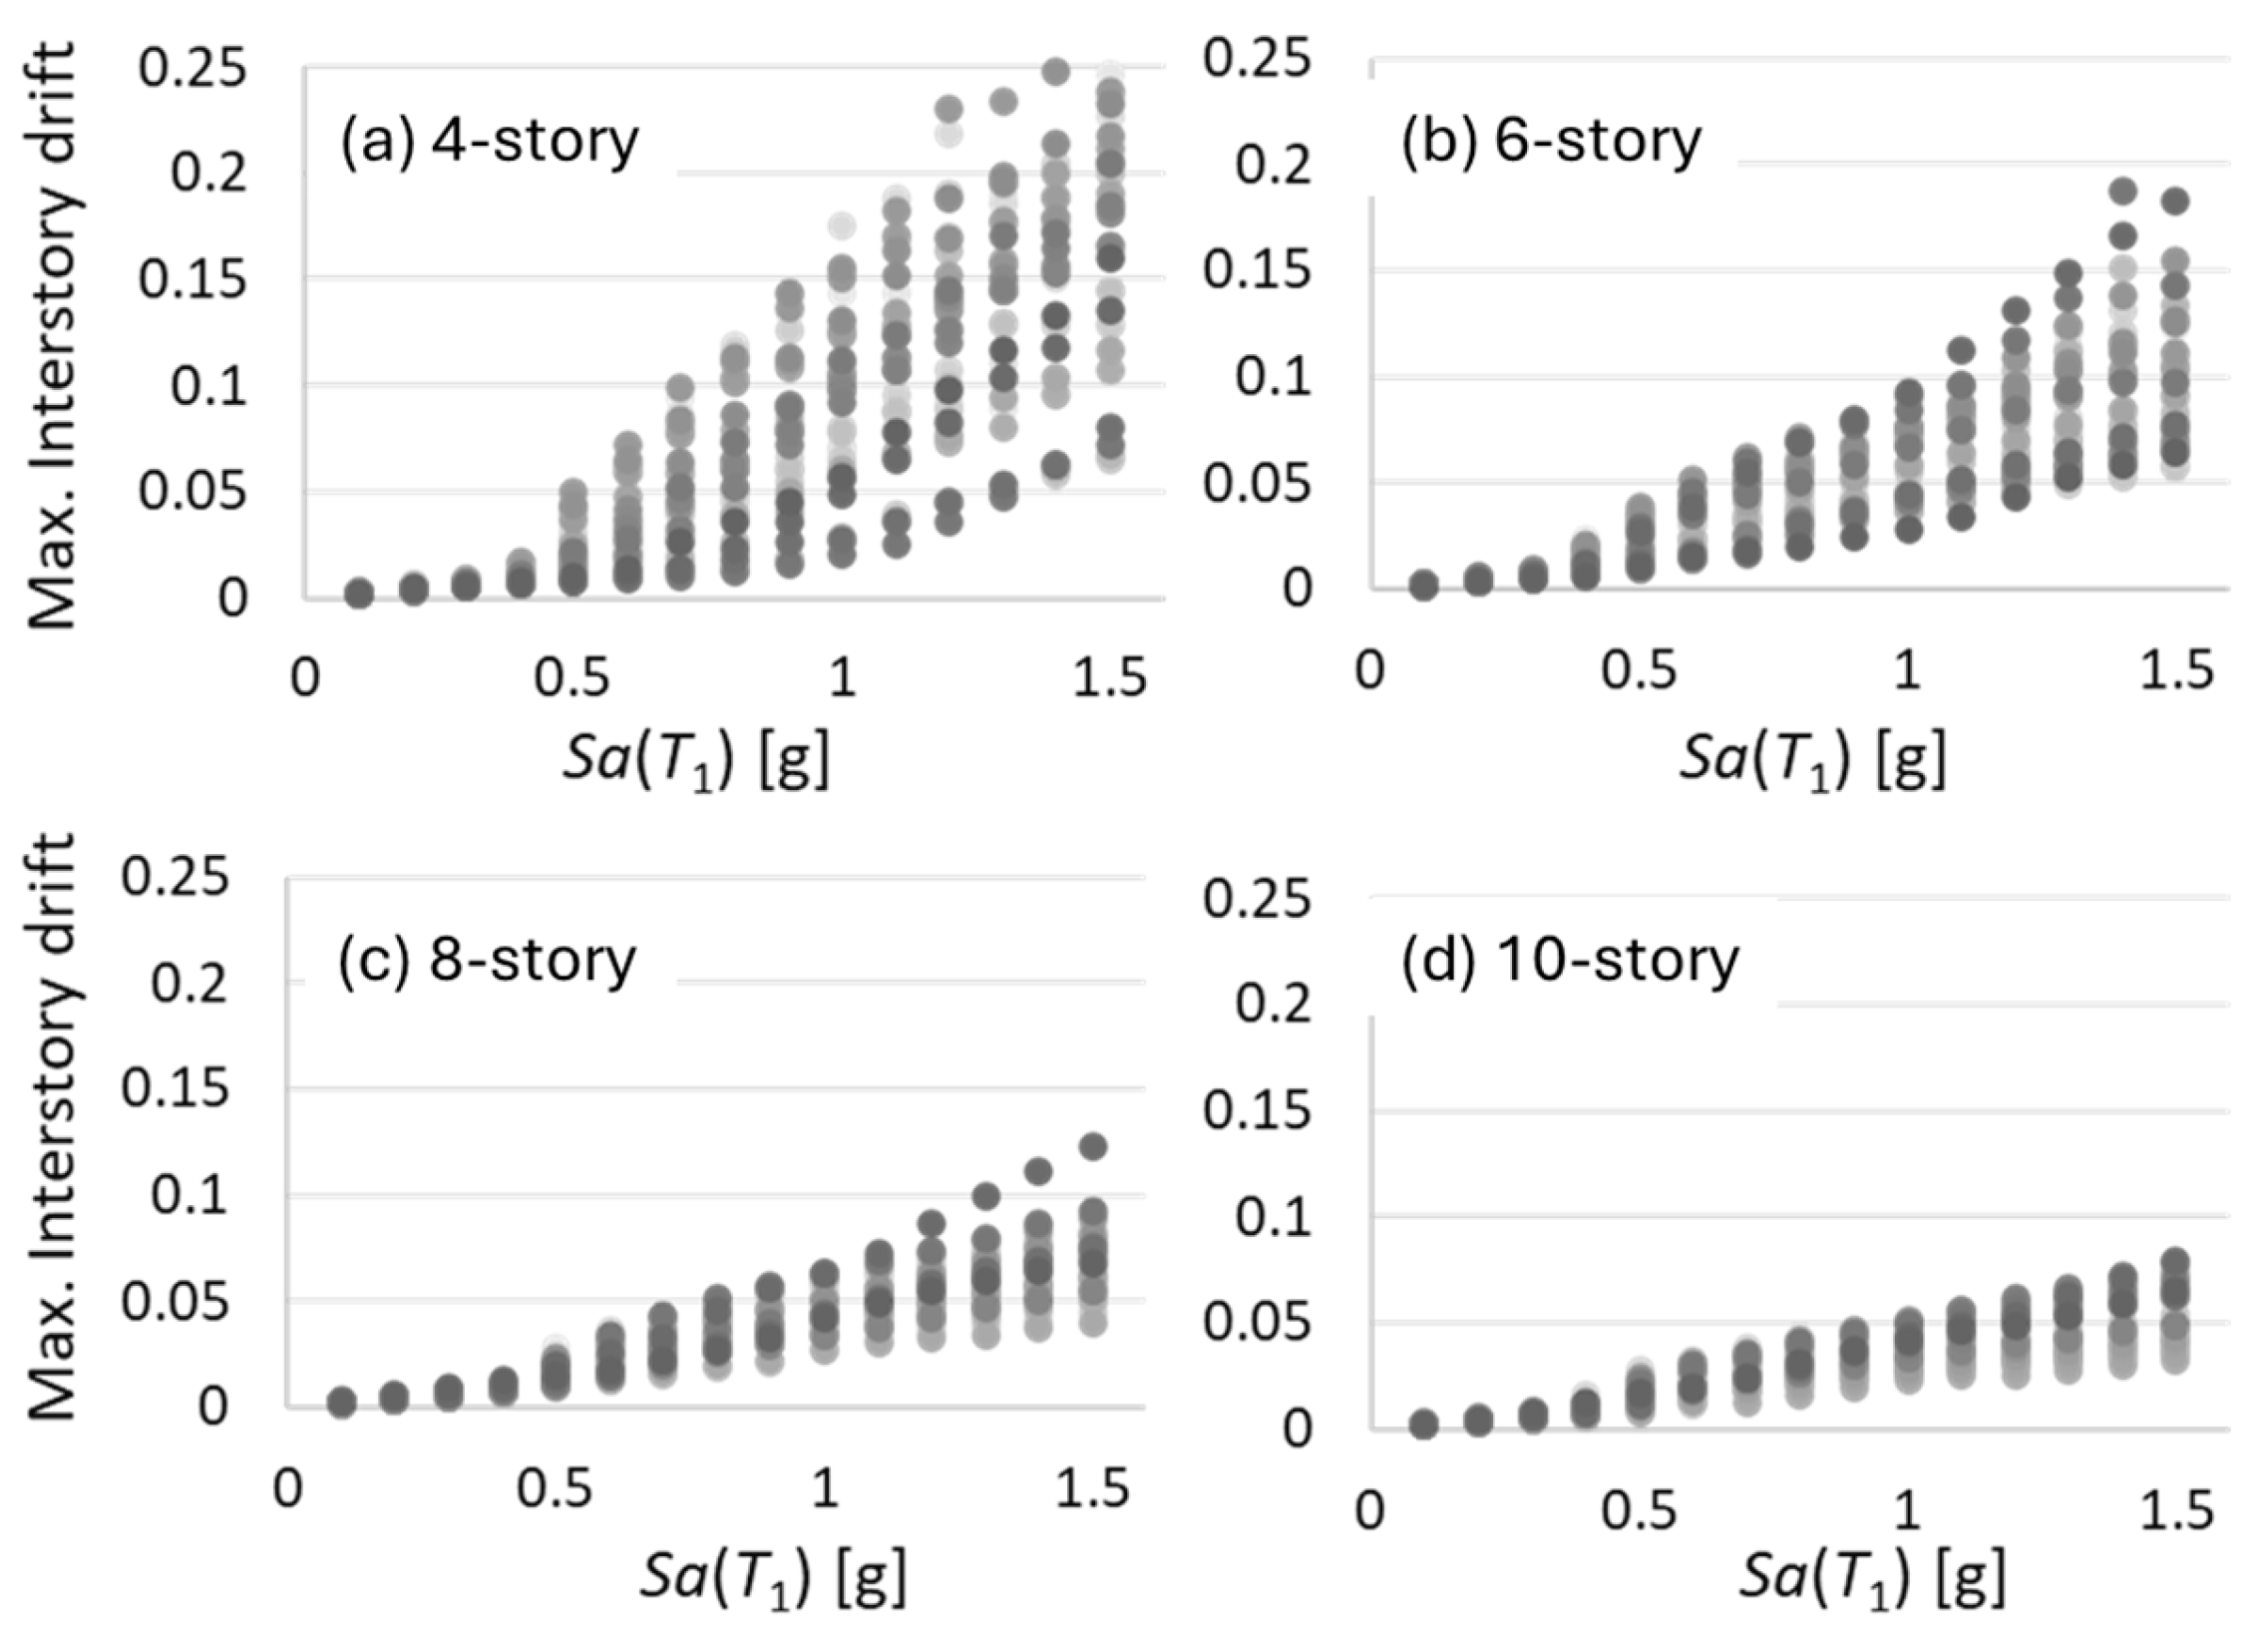
4. Numerical Results
5. Deep Learning Model Tested to Assess the Seismic Performance of a Complex RC-BRB Building
6. Seismic Performance Prediction of Nonlinear SDOF Structures via INp and Deep Learning
7. Conclusions
Author Contributions
Funding
Institutional Review Board Statement
Informed Consent Statement
Data Availability Statement
Acknowledgments
Conflicts of Interest
Appendix A
| Period of Vibration | INp | Mean | Std. Desv. | Median |
| 0.9 | 0.1 | 0.00198557 | 0.00018930 | 0.00195350 |
| 0.9 | 0.2 | 0.00397103 | 0.00037838 | 0.00390650 |
| 0.9 | 0.3 | 0.00593630 | 0.00054159 | 0.00585900 |
| 0.9 | 0.4 | 0.00803373 | 0.00075550 | 0.00800800 |
| 0.9 | 0.5 | 0.01178300 | 0.00246631 | 0.01066000 |
| 0.9 | 0.6 | 0.02134267 | 0.01051187 | 0.01768500 |
| 0.9 | 0.7 | 0.03442300 | 0.01713227 | 0.03376500 |
| 0.9 | 0.8 | 0.04790433 | 0.02367704 | 0.04695000 |
| 0.9 | 0.9 | 0.06115533 | 0.02682896 | 0.05965500 |
| 0.9 | 1 | 0.07689667 | 0.03224495 | 0.07299000 |
| 0.9 | 1.1 | 0.09194733 | 0.03621639 | 0.09150000 |
| 0.9 | 1.2 | 0.10524233 | 0.03840779 | 0.10685000 |
| 0.9 | 1.3 | 0.12248200 | 0.04450585 | 0.11635000 |
| 0.9 | 1.4 | 0.13362267 | 0.04366843 | 0.13725000 |
| 0.9 | 1.5 | 0.15169600 | 0.04790769 | 0.15115000 |
| 1.2 | 0.1 | 0.00175870 | 0.00025072 | 0.00167250 |
| 1.2 | 0.2 | 0.00351747 | 0.00050132 | 0.00334550 |
| 1.2 | 0.3 | 0.00527587 | 0.00076145 | 0.00501850 |
| 1.2 | 0.4 | 0.00737523 | 0.00106450 | 0.00700900 |
| 1.2 | 0.5 | 0.01190380 | 0.00170633 | 0.01175000 |
| 1.2 | 0.6 | 0.02021367 | 0.00589694 | 0.01848500 |
| 1.2 | 0.7 | 0.02831367 | 0.00846909 | 0.02597000 |
| 1.2 | 0.8 | 0.03556167 | 0.00910376 | 0.03676500 |
| 1.2 | 0.9 | 0.04234233 | 0.00959351 | 0.04308000 |
| 1.2 | 1 | 0.04814133 | 0.01066981 | 0.04855000 |
| 1.2 | 1.1 | 0.05345333 | 0.01169260 | 0.05307000 |
| 1.2 | 1.2 | 0.05871833 | 0.01224732 | 0.05751000 |
| 1.2 | 1.3 | 0.06413967 | 0.01309662 | 0.06248500 |
| 1.2 | 1.4 | 0.07016600 | 0.01495424 | 0.06851000 |
| 1.2 | 1.5 | 0.07593100 | 0.01659735 | 0.07410000 |
| 1.38 | 0.1 | 0.00177580 | 0.00028973 | 0.00166350 |
| 1.38 | 0.2 | 0.00355183 | 0.00057954 | 0.00332750 |
| 1.38 | 0.3 | 0.00537903 | 0.00096485 | 0.00499100 |
| 1.38 | 0.4 | 0.00740917 | 0.00139175 | 0.00692350 |
| 1.38 | 0.5 | 0.01008277 | 0.00137013 | 0.00980850 |
| 1.38 | 0.6 | 0.01500067 | 0.00226893 | 0.01464000 |
| 1.38 | 0.7 | 0.02134900 | 0.00494191 | 0.02101000 |
| 1.38 | 0.8 | 0.02709833 | 0.00535109 | 0.02647500 |
| 1.38 | 0.9 | 0.03223300 | 0.00570592 | 0.03082000 |
| 1.38 | 1 | 0.03703900 | 0.00629038 | 0.03550000 |
| 1.38 | 1.1 | 0.04143833 | 0.00675983 | 0.03908000 |
| 1.38 | 1.2 | 0.04565000 | 0.00724887 | 0.04377500 |
| 1.38 | 1.3 | 0.04942667 | 0.00768099 | 0.04884500 |
| 1.38 | 1.4 | 0.05354900 | 0.00840227 | 0.05392500 |
| 1.38 | 1.5 | 0.05770500 | 0.00943261 | 0.05799000 |
| 1.53 | 0.1 | 0.00189230 | 0.00029065 | 0.00188800 |
| 1.53 | 0.2 | 0.00378440 | 0.00058139 | 0.00377600 |
| 1.53 | 0.3 | 0.00570843 | 0.00091909 | 0.00566400 |
| 1.53 | 0.4 | 0.00778640 | 0.00112739 | 0.00792050 |
| 1.53 | 0.5 | 0.01170440 | 0.00180979 | 0.01182500 |
| 1.53 | 0.6 | 0.01797733 | 0.00312006 | 0.01780000 |
| 1.53 | 0.7 | 0.02267433 | 0.00316726 | 0.02170000 |
| 1.53 | 0.8 | 0.02671800 | 0.00375887 | 0.02544500 |
| 1.53 | 0.9 | 0.03016967 | 0.00454644 | 0.02883500 |
| 1.53 | 1 | 0.03376000 | 0.00493950 | 0.03244500 |
| 1.53 | 1.1 | 0.03707567 | 0.00538001 | 0.03624500 |
| 1.53 | 1.2 | 0.04022967 | 0.00582309 | 0.03930000 |
| 1.53 | 1.3 | 0.04323533 | 0.00629872 | 0.04211000 |
| 1.53 | 1.4 | 0.04640567 | 0.00690343 | 0.04497500 |
| 1.53 | 1.5 | 0.04966700 | 0.00761394 | 0.04785500 |
References
- Wieland, M. Safety Aspects of Sustainable Storage Dams and Earthquake Safety of Existing Dams. Engineering 2016, 2, 325–331. [Google Scholar] [CrossRef]
- Rezvani Sharif, M.; Sadri Tabaei Zavareh, S.M.R. Predictive Modeling of the Lateral Drift Capacity of Circular Reinforced Concrete Columns Using an Evolutionary Algorithm. Eng. Comput. 2019, 37, 1579–1591. [Google Scholar] [CrossRef]
- Takagi, J.; Wada, A. Higher Performance Seismic Structures for Advanced Cities and Societies. Engineering 2019, 5, 184–189. [Google Scholar] [CrossRef]
- Fujino, Y.; Siringoringo, D.M.; Ikeda, Y.; Nagayama, T.; Mizutani, T. Research and Implementations of Structural Monitoring for Bridges and Buildings in Japan. Engineering 2019, 5, 1093–1119. [Google Scholar] [CrossRef]
- Nishiyama, I.; Kuramoto, H.; Noguchi, H. Guidelines: Seismic Design of Composite Reinforced Concrete and Steel Buildings. J. Struct. Eng. 2004, 130, 336–342. [Google Scholar] [CrossRef]
- Yang, H.; Feng, Y.; Wang, H.; Jeremić, B. Energy Dissipation Analysis for Inelastic Reinforced Concrete and Steel Beam-Columns. Eng. Struct. 2019, 197, 109431. [Google Scholar] [CrossRef]
- Xiao, J.; Zhang, K.; Ding, T.; Zhang, Q.; Xiao, X. Fundamental Issues towards Unified Design Theory of Recycled and Natural Aggregate Concrete Components. Engineering 2023, 29, 188–197. [Google Scholar] [CrossRef]
- Qiu, C.; Du, X.; Teng, J.; Li, Z.; Chen, C. Seismic Design Method for Multi-Story SMA Braced Frames Based on Inelastic Displacement Ratio. Soil. Dyn. Earthq. Eng. 2021, 147, 106794. [Google Scholar] [CrossRef]
- Housner, G.W. Spectrum Intensities of Strong-Motion Earthquakes. In Proceedings of the Symposium on Earthquake and Blast Effects on Structures, Los Angeles, CA, USA, June 1952; EERI: Oakland, CA, USA, 1952. [Google Scholar]
- Arias, A. A Measure of Earthquake Intensity. In Seismic Design for Nuclear Power Plants; MIT Press: Cambridge, MA, USA, 1970; ISBN 9780262080415. [Google Scholar]
- Padgett, J.E.; Nielson, B.G.; DesRoches, R. Selection of Optimal Intensity Measures in Probabilistic Seismic Demand Models of Highway Bridge Portfolios. Earthq. Eng. Struct. Dyn. 2008, 37, 711–725. [Google Scholar] [CrossRef]
- Kazantzi, A.K.; Vamvatsikos, D. Intensity Measure Selection for Vulnerability Studies of Building Classes. Earthq. Eng. Struct. Dyn. 2015, 44, 2677–2694. [Google Scholar] [CrossRef]
- Bojórquez, E.; Baca, V.; Bojórquez, J.; Reyes-Salazar, A.; Chávez, R.; Barraza, M. A Simplified Procedure to Estimate Peak Drift Demands for Mid-Rise Steel and R/C Frames under Narrow-Band Motions in Terms of the Spectral-Shape-Based Intensity Measure INp. Eng. Struct. 2017, 150, 334–345. [Google Scholar] [CrossRef]
- Torres, J.I.; Bojórquez, E.; Chavez, R.; Bojórquez, J.; Reyes-Salazar, A.; Baca, V.; Valenzuela, F.; Carvajal, J.; Payán, O.; Leal, M. Peak Floor Acceleration Prediction Using Spectral Shape: Comparison between Acceleration and Velocity. Earthq. Struct. 2021, 21, 551–562. [Google Scholar] [CrossRef]
- Tothong, P.; Luco, N. Probabilistic Seismic Demand Analysis Using Advanced Ground Motion Intensity Measures. Earthq. Eng. Struct. Dyn. 2007, 36, 1837–1860. [Google Scholar] [CrossRef]
- Mehanny, S.S.F. A Broad-Range Power-Law Form Scalar-Based Seismic Intensity Measure. Eng. Struct. 2009, 31, 1354–1368. [Google Scholar] [CrossRef]
- Bojórquez, E.; Iervolino, I. Spectral Shape Proxies and Nonlinear Structural Response. Soil. Dyn. Earthq. Eng. 2011, 31, 996–1008. [Google Scholar] [CrossRef]
- Buratti, N. A Comparison of the Performances of Various Ground–Motion Intensity Measures. In Proceedings of the 15th World Conference on Earthquake Engineering, Lisbon, Portugal, 24–28 September 2012. [Google Scholar]
- Cai, J.; Bu, G.; Yang, C.; Chen, Q.; Zuo, Z. Calculation Methods for Inter-Story Drifts of Building Structures. Adv. Struct. Eng. 2014, 17, 735–745. [Google Scholar] [CrossRef]
- Lee, H.J.; Aschheim, M.A.; Kuchma, D. Interstory Drift Estimates for Low-Rise Flexible Diaphragm Structures. Eng. Struct. 2007, 29, 1375–1397. [Google Scholar] [CrossRef]
- Ruiz-García, J.; Miranda, E. Probabilistic Estimation of Residual Drift Demands for Seismic Assessment of Multi-Story Framed Buildings. Eng. Struct. 2010, 32, 11–20. [Google Scholar] [CrossRef]
- VANLUCHENE, R.D.; SUN, R. Neural Networks in Structural Engineering. Comput.-Aided Civ. Infrastruct. Eng. 1990, 5, 207–215. [Google Scholar] [CrossRef]
- Adeli, H. Neural Networks in Civil Engineering: 1989–2000. Comput.-Aided Civ. Infrastruct. Eng. 2001, 16, 126–142. [Google Scholar] [CrossRef]
- Rafiq, M.Y.; Bugmann, G.; Easterbrook, D.J. Neural Network Design for Engineering Applications. Comput. Struct. 2001, 79, 1541–1552. [Google Scholar] [CrossRef]
- Barraza, M.; Bojórquez, E.; Fernández-González, E.; Reyes-Salazar, A. Multi-Objective Optimization of Structural Steel Buildings under Earthquake Loads Using NSGA-II and PSO. KSCE J. Civ. Eng. 2017, 21, 488–500. [Google Scholar] [CrossRef]
- Leyva, H.; Bojórquez, J.; Bojórquez, E.; Reyes-Salazar, A.; Carrillo, J.; López-Almansa, F. Multi-Objective Seismic Design of BRBs-Reinforced Concrete Buildings Using Genetic Algorithms. Struct. Multidiscip. Optim. 2021, 64, 2097–2112. [Google Scholar] [CrossRef]
- Reyes, H.E.; Bojórquez, J.; Cruz-Reyes, L.; Ruiz, S.E.; Reyes-Salazar, A.; Bojórquez, E.; Barraza, M.; Formisano, A.; Payán, O.; Torres, J.R. Development an Artificial Neural Network Model for Estimating Cost of R/C Building by Using Life-Cycle Cost Function: Case Study of Mexico City. Adv. Civ. Eng. 2022, 2022, 7418230. [Google Scholar] [CrossRef]
- Zhou, Y.; Meng, S.; Lou, Y.; Kong, Q. Physics-Informed Deep Learning-Based Real-Time Structural Response Prediction Method. Engineering 2024, 35, 140–157. [Google Scholar] [CrossRef]
- Marcelin, J.L. Evolutionary Optimisation of Mechanical Structures: Towards an Integrated Optimisation. Eng. Comput. 1999, 15, 326–333. [Google Scholar] [CrossRef]
- Spencer, B.F.; Hoskere, V.; Narazaki, Y. Advances in Computer Vision-Based Civil Infrastructure Inspection and Monitoring. Engineering 2019, 5, 199–222. [Google Scholar] [CrossRef]
- Rao, M.A.; Srinivas, J. Torsional Vibrations of Pre-Twisted Blades Using Artificial Neural Network Technology. Eng. Comput. 2000, 16, 10–15. [Google Scholar] [CrossRef]
- Lecun, Y.; Bengio, Y.; Hinton, G. Deep Learning. Nature 2015, 521, 436–444. [Google Scholar] [CrossRef]
- Seo, J.; Kapania, R.K. Topology Optimization with Advanced CNN Using Mapped Physics-Based Data. Struct. Multidiscip. Optim. 2023, 66, 21. [Google Scholar] [CrossRef]
- Mohammed Sahib, M.; Kovács, G. Multi-Objective Optimization of Composite Sandwich Structures Using Artificial Neural Networks and Genetic Algorithm. Results Eng. 2024, 21, 101937. [Google Scholar] [CrossRef]
- Kim, K.G. Book Review: Deep Learning. Health Inf. Res. 2016, 22, 351–354. [Google Scholar] [CrossRef]
- Harrou, F.; Dairi, A.; Dorbane, A.; Sun, Y. Energy Consumption Prediction in Water Treatment Plants Using Deep Learning with Data Augmentation. Results Eng. 2023, 20, 101428. [Google Scholar] [CrossRef]
- Armghan, A.; Logeshwaran, J.; Sutharshan, S.M.; Aliqab, K.; Alsharari, M.; Patel, S.K. Design of Biosensor for Synchronized Identification of Diabetes Using Deep Learning. Results Eng. 2023, 20, 101382. [Google Scholar] [CrossRef]
- Payán-Serrano, O.; Bojórquez, E.; Bojórquez, J.; Chávez, R.; Reyes-Salazar, A.; Barraza, M.; López-Barraza, A.; Rodríguez-Lozoya, H.; Corona, E. Prediction of Maximum Story Drift of MDOF Structures under Simulated Wind Loads Using Artificial Neural Networks. Appl. Sci. 2017, 7, 563. [Google Scholar] [CrossRef]
- Morfidis, K.; Kostinakis, K. Approaches to the rapid seismic damage prediction of r/c buildings using artificial neural networks. Eng. Struct. 2018, 165, 120–141. [Google Scholar] [CrossRef]
- Mishra, M.; Bhatia, A.S.; Maity, D. A Comparative Study of Regression, Neural Network and Neuro-Fuzzy Inference System for Determining the Compressive Strength of Brick–Mortar Masonry by Fusing Nondestructive Testing Data. Eng. Comput. 2019, 37, 77–91. [Google Scholar] [CrossRef]
- Raza, A.; Adnan Raheel Shah, S.; ul Haq, F.; Arshad, H.; Safdar Raza, S.; Farhan, M.; Waseem, M. Prediction of Axial Load-Carrying Capacity of GFRP-Reinforced Concrete Columns through Artificial Neural Networks. Structures 2020, 28, 1557–1571. [Google Scholar] [CrossRef]
- Yuan, X.; Zhong, J.; Zhu, Y.; Chen, G.; Dagli, C. Post-earthquake regional structural damage evaluation based on artificial neural networks considering variant structural properties. Structures 2023, 52, 971–982. [Google Scholar] [CrossRef]
- Hassoun, M.H. Fundamentals of Artificial Neural Networks; The MIT Press: Cambridge, MA, USA, 2005. [Google Scholar] [CrossRef]
- Yegnanarayana, B. Artificial Neural Networks for Pattern Recognition. Sadhana 1994, 19, 189–238. [Google Scholar] [CrossRef]
- Morelli, M.; Hauth, J.; Guardone, A.; Huan, X.; Zhou, B.Y. A Rotorcraft In-Flight Ice Detection Framework Using Computational Aeroacoustics and Bayesian Neural Networks. Struct. Multidiscip. Optim. 2023, 66, 197. [Google Scholar] [CrossRef]
- Vamvatsikos, D.; Allin Cornell, C. Incremental Dynamic Analysis. Earthq. Eng. Struct. Dyn. 2002, 31, 491–514. [Google Scholar] [CrossRef]
- Kingma, D.P.; Ba, J.L. Adam: A Method for Stochastic Optimization. In Proceedings of the 3rd International Conference on Learning Representations, ICLR 2015—Conference Track Proceedings, San Diego, CA, USA, 7–9 May 2015. [Google Scholar]
- Panchal, G.; Ganatra, A.; Shah, P.; Panchal, D. Determination of Over-Learning and Over-Fitting Problem in Back Propagation Neurl Network. Int. J. Soft Comput. 2011, 2, 40–51. [Google Scholar] [CrossRef]
- Koziel, S.; Calik, N.; Mahouti, P.; Belen, M. Accurate Modeling of Antenna Structures by Means of Domain Confinement and Pyramidal Deep Neural Networks. IEEE Trans. Antennas Propag. 2022, 70, 2174–2188. [Google Scholar] [CrossRef]
- Browne, M.W. Cross-Validation Methods. J. Math. Psychol. 2000, 44, 108–132. [Google Scholar] [CrossRef] [PubMed]
- Dabiri, H.; Rahimzadeh, K.; Kheyroddin, A. A Comparison of Machine Learning- and Regression-Based Models for Predicting Ductility Ratio of RC Beam-Column Joints. Structures 2022, 37, 69–81. [Google Scholar] [CrossRef]
- Park, R. Evaluation of Ductility of Structures and Structural Assemblages from Laboratory Testing. Bull. New Zealand Soc. Earthq. Eng. 1989, 22, 155–166. [Google Scholar] [CrossRef]
- Moghaddam, H.; Mohammadi, R.K. Ductility Reduction Factor of MDOF Shear-Building Structures. J. Earthq. Eng. 2001, 5, 425–440. [Google Scholar] [CrossRef]
- Arslan, M.H. Estimation of Curvature and Displacement Ductility in Reinforced Concrete Buildings. KSCE J. Civ. Eng. 2012, 16, 759–770. [Google Scholar] [CrossRef]
- Kunnath, S.K.; Chai, Y.H. Cumulative Damage-Based Inelastic Cyclic Demand Spectrum. Earthq. Eng. Struct. Dyn. 2004, 33, 499–520. [Google Scholar] [CrossRef]
- Bojórquez, E.; Terán-Gilmore, A.; Ruiz, S.E.; Reyes-Salazar, A. Evaluation of Structural Reliability of Steel Frames: Interstory Drift versus Plastic Hysteretic Energy. Earthq. Spectra 2011, 27, 661–682. [Google Scholar] [CrossRef]
- Zhou, Y.; Song, G.; Tan, P. Hysteretic Energy Demand for Self-Centering SDOF Systems. Soil. Dyn. Earthq. Eng. 2019, 125, 105703. [Google Scholar] [CrossRef]
- Bojorquez, E.; Ruiz, S.E.; Teran-Gilmore, A. Reliability-Based Evaluation of Steel Structures Using Energy Concepts. Eng. Struct. 2008, 30, 1745–1759. [Google Scholar] [CrossRef]
- Bojórquez, E.; Reyes-Salazar, A.; Terán-Gilmore, A.; Ruiz, S.E. Energy-Based Damage Index for Steel Structures. Steel Compos. Struct. 2010, 10, 331–348. [Google Scholar] [CrossRef]
- Song, Z.; Konietzky, H.; Frühwirt, T. Hysteresis Energy-Based Failure Indicators for Concrete and Brittle Rocks under the Condition of Fatigue Loading. Int. J. Fatigue 2018, 114, 298–310. [Google Scholar] [CrossRef]
- Qiu, C.; Qi, J.; Chen, C. Energy-Based Seismic Design Methodology of SMABFs Using Hysteretic Energy Spectrum. J. Struct. Eng. 2020, 146, 04019207. [Google Scholar] [CrossRef]
- Gentile, R.; Galasso, C. Hysteretic Energy-based State-dependent Fragility for Ground-motion Sequences. Earthq. Eng. Struct. Dyn. 2021, 50, 1187–1203. [Google Scholar] [CrossRef]
- Gholami, N.; Garivani, S.; Askariani, S.S.; Hajirasouliha, I. Estimation of Hysteretic Energy Distribution for Energy-Based Design of Structures Equipped with Dampers. J. Build. Eng. 2022, 51, 104221. [Google Scholar] [CrossRef]


| Record | Magnitude | PGV [cm/s] | PGA [cm/s2] | Date | Station |
|---|---|---|---|---|---|
| 1 | 8.1 | 59.5 | 178.0 | 19 September 1985 | SCT |
| 2 | 7.6 | 14.6 | 48.7 | 21 September 1985 | Tlahuac deportivo |
| 3 | 6.9 | 15.6 | 45.0 | 25 April 1989 | Alameda |
| 4 | 6.9 | 21.5 | 68.0 | 25 April 1989 | Garibaldi |
| 5 | 6.9 | 12.8 | 44.9 | 25 April 1989 | SCT |
| 6 | 6.9 | 15.3 | 45.1 | 25 April 1989 | Sector Popular |
| 7 | 6.9 | 17.3 | 52.9 | 25 April 1989 | Tlatelolco TL08 |
| 8 | 6.9 | 17.3 | 49.5 | 25 April 1989 | Tlatelolco TL55 |
| 9 | 7.3 | 12.2 | 39.3 | 14 April 1995 | Alameda |
| 10 | 7.3 | 10.6 | 39.1 | 14 September 1995 | Garibaldi |
| 11 | 7.3 | 9.62 | 30.1 | 14 September 1995 | Liconsa |
| 12 | 7.3 | 9.37 | 33.5 | 14 September 1995 | Plutarco Elías Calles |
| 13 | 7.3 | 12.5 | 34.3 | 14 September 1995 | S. Popular |
| 14 | 7.3 | 7.8 | 27.5 | 14 September 1995 | Tlatelolco TL08 |
| 15 | 7.3 | 7.4 | 27.2 | 14 September 1995 | Tlatelolco TL55 |
| 16 | 7.5 | 4.6 | 14.4 | 9 October 1995 | Cibeles |
| 17 | 7.5 | 5.1 | 15.8 | 9 October 1995 | CU Juárez |
| 18 | 7.5 | 4.8 | 15.7 | 9 October 1995 | C. urbano P Juárez |
| 19 | 7.5 | 8.6 | 24.9 | 9 October 1995 | Córdoba |
| 20 | 7.5 | 6.3 | 17.6 | 9 October 1995 | Liverpool |
| 21 | 7.5 | 7.9 | 19.2 | 9 October 1995 | Plutarco Elías Calles |
| 22 | 7.5 | 5.3 | 13.7 | 9 October 1995 | S. Popular |
| 23 | 7.5 | 7.18 | 17.9 | 9 October 1995 | V. Gómez |
| 24 | 6.9 | 5.9 | 16.2 | 11 January 1997 | CU Juárez |
| 25 | 6.9 | 5.5 | 16.3 | 11 January 1997 | C. urbano P Juárez |
| 26 | 6.9 | 6.9 | 18.7 | 11 January 1997 | García Campillo |
| 27 | 6.9 | 8.6 | 22.2 | 11 January 1997 | Plutarco Elías Calles |
| 28 | 6.9 | 7.76 | 21.0 | 11 January 1997 | 10 Roma A |
| 29 | 6.9 | 7.1 | 20.4 | 11 January 1997 | 11 Roma B |
| 30 | 6.9 | 7.2 | 16.0 | 11 January 1997 | Tlatelolco TL08 |
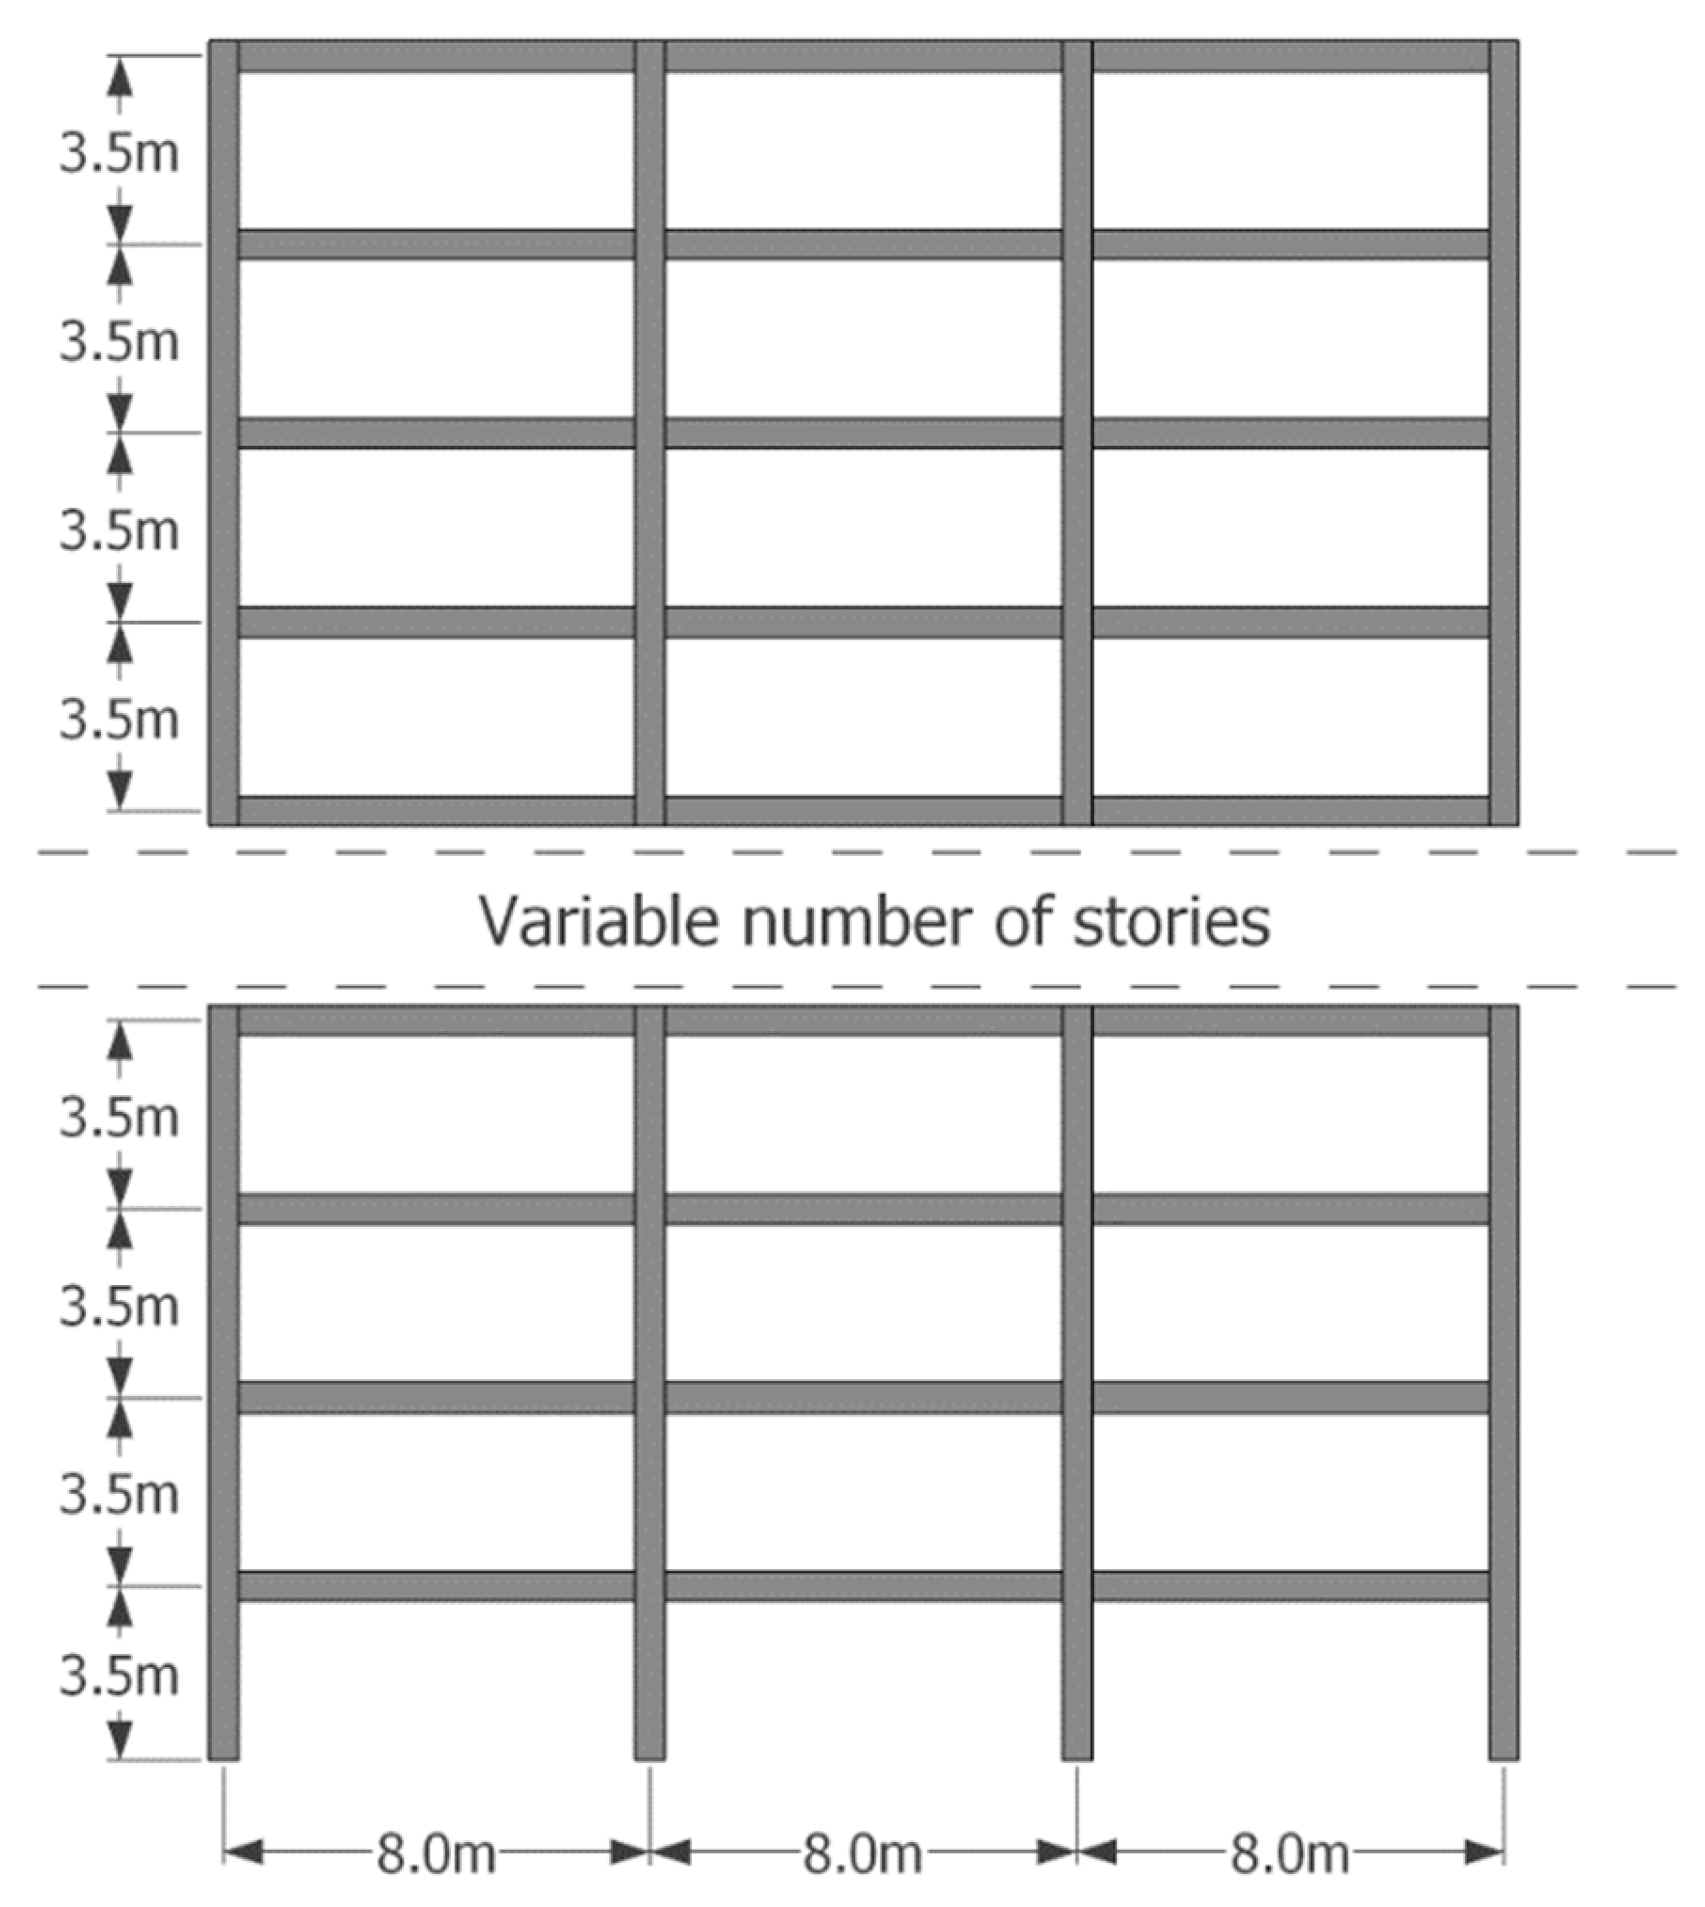
| Frame ID | Number of Stories | Period of Vibration (s) | |
|---|---|---|---|
| T1 | T2 | ||
| F4 | 4 | 0.90 | 0.31 |
| F6 | 6 | 1.20 | 0.39 |
| F8 | 8 | 1.38 | 0.44 |
| F10 | 10 | 1.53 | 0.48 |
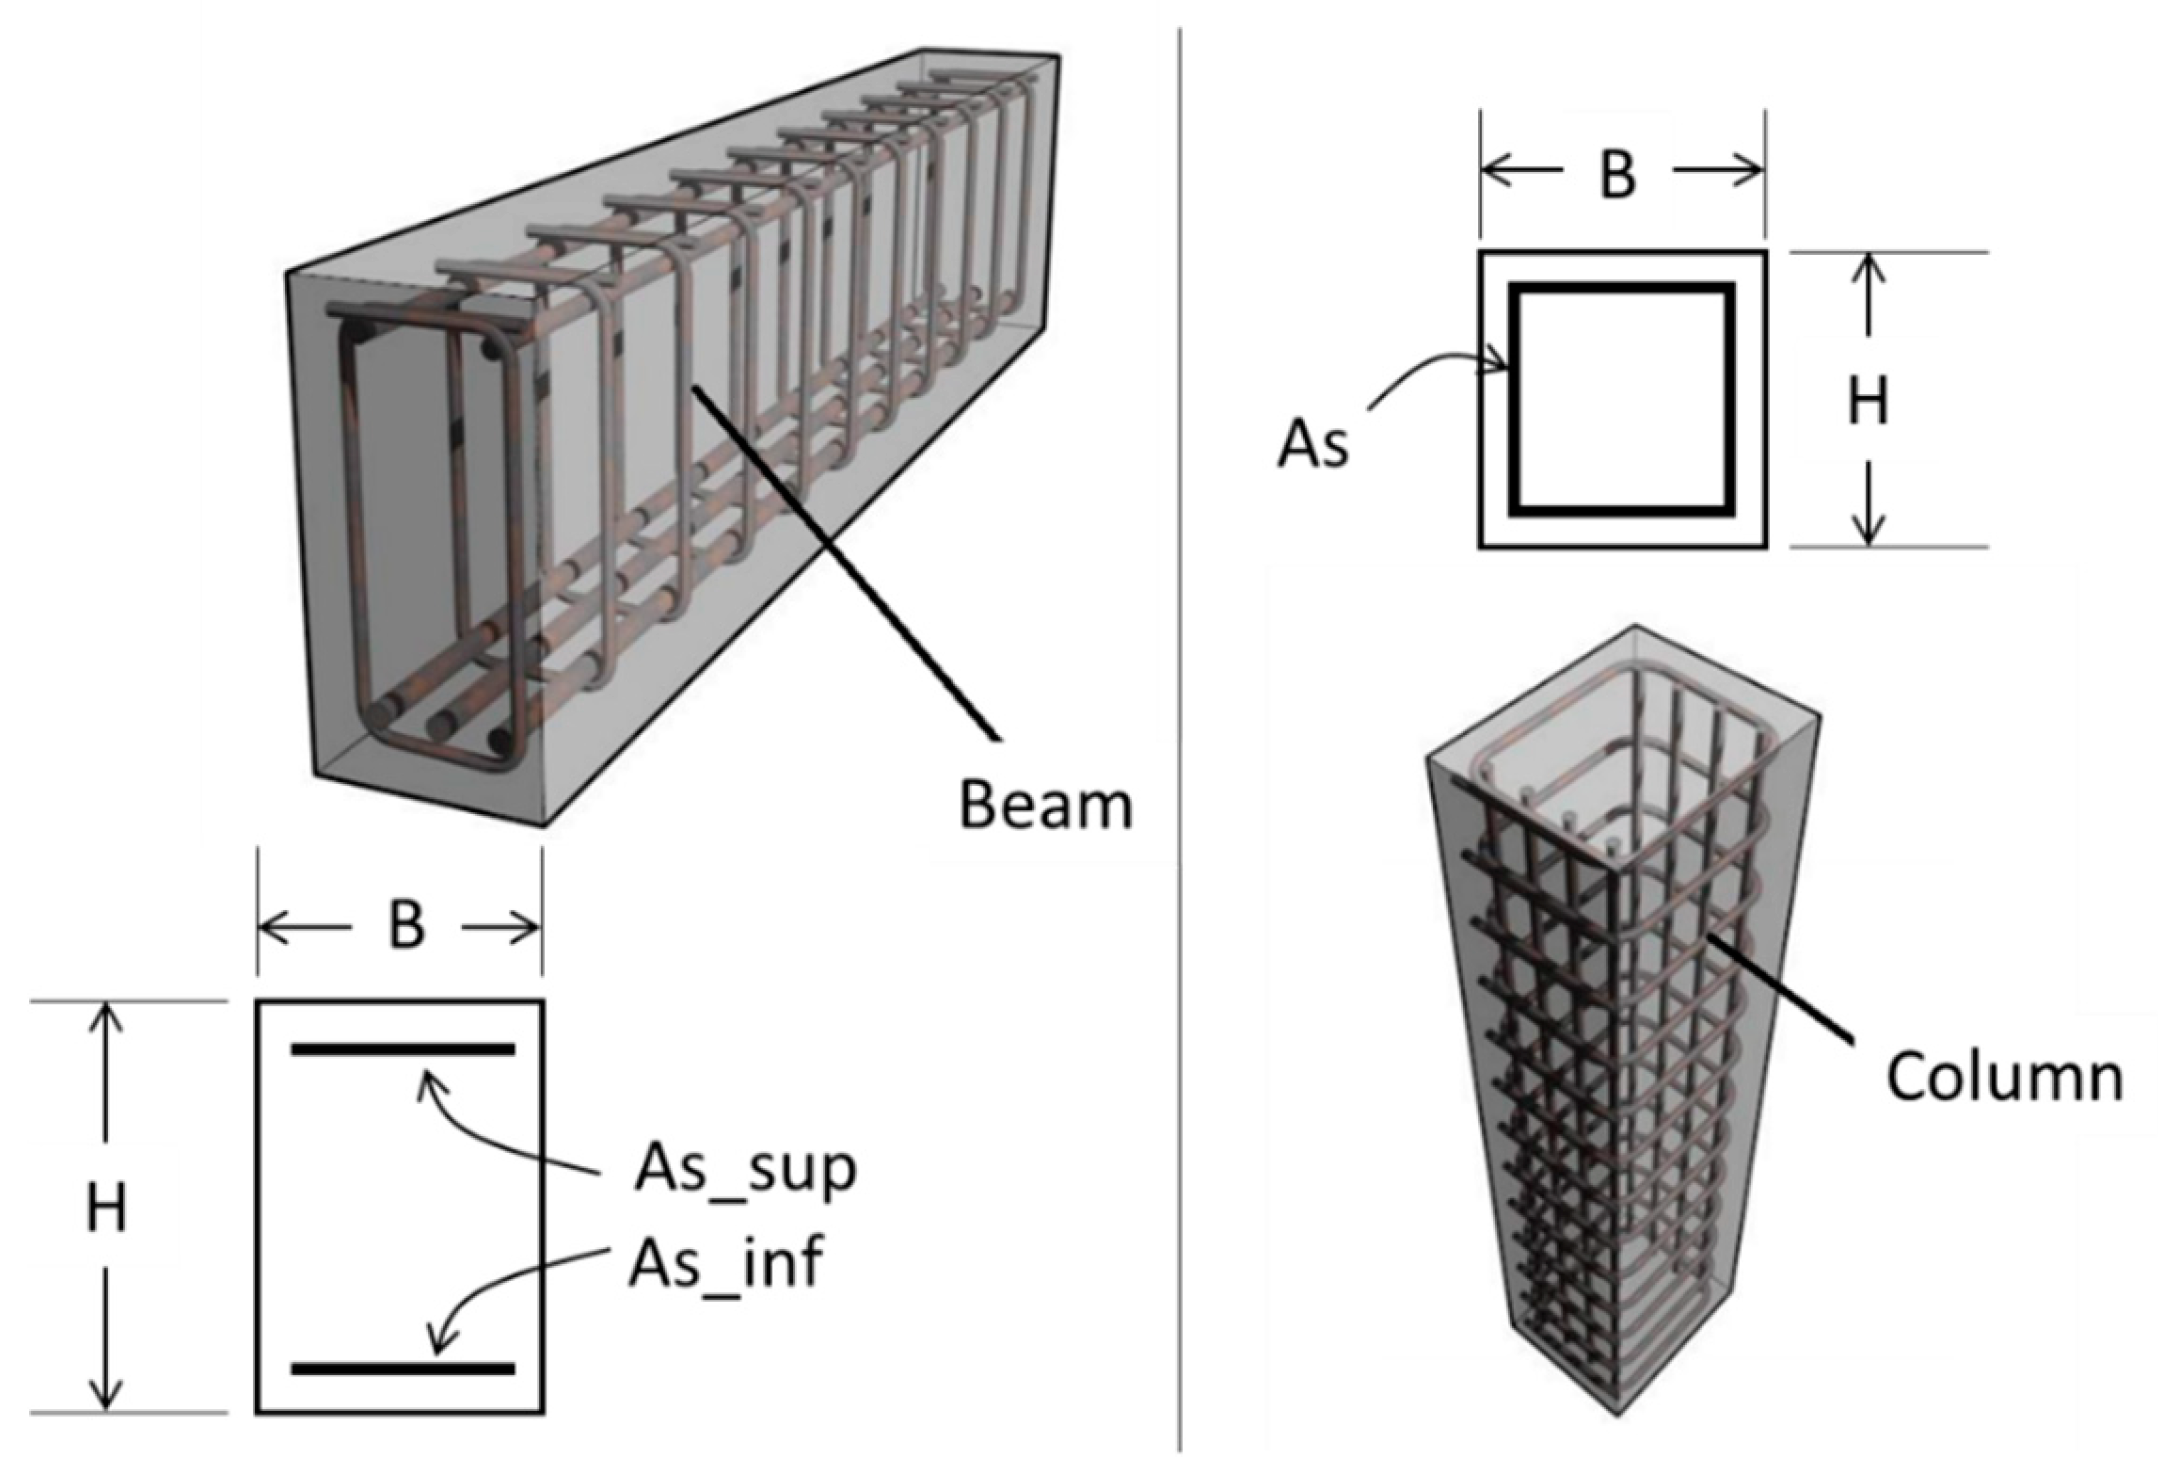
| Element ID_Frame(Story Loc) | Characteristic | F4 | F6 | F8 | F10 |
|---|---|---|---|---|---|
| Beam 1 F4(1–2) F6(1–3) F8(1–3) F10(1–4) | B | 25 | 25 | 35 | 35 |
| H | 55 | 60 | 80 | 90 | |
| As_sup | 12.7 | 19.1 | 47.7 | 56.2 | |
| As_inf | 7.6 | 13.2 | 38.9 | 47.9 | |
| spacing_ext | 15 | 15 | 15 | 10 | |
| spacing_cen | 25 | 25 | 15 | 10 | |
| Beam 2 F4(3–4) F6(4–6) F8(4–6) F10(5–7) | B | 20 | 20 | 35 | 35 |
| H | 50 | 55 | 70 | 75 | |
| As_sup | 9.5 | 13.8 | 39.5 | 47.3 | |
| As_inf | 4.4 | 7.8 | 27.2 | 37.6 | |
| spacing_ext | 15 | 15 | 15 | 10 | |
| spacing_cen | 25 | 25 | 20 | 15 | |
| Beam 3 F8(7–8) F10(8–10) | B | 30 | 35 | ||
| H | 55 | 65 | |||
| As_sup | 22.6 | 27.3 | |||
| As_inf | 10 | 15.2 | |||
| spacing_ext | 15 | 15 | |||
| spacing_cen | 25 | 25 | |||
| Column 1 F4(1–2) F6(1–3) F8(1–3) | B | 50 | 60 | 95 | 110 |
| H | 50 | 60 | 95 | 110 | |
| As | 64.39 | 95.89 | 190.25 | 242.29 | |
| Spacing | 15 | 10 | 10 | 10 | |
| Column 2 F4(3–4) F6(4–6) F8(4–6) | B | 40 | 50 | 85 | 100 |
| H | 40 | 50 | 85 | 100 | |
| As | 45.19 | 49.12 | 72.25 | 100 | |
| Spacing | 10 | 15 | 15 | 15 | |
| Column 3 F8(7–8) | B | 75 | 90 | ||
| H | 75 | 90 | |||
| As | 56.25 | 81 | |||
| spacing | 15 | 15 |
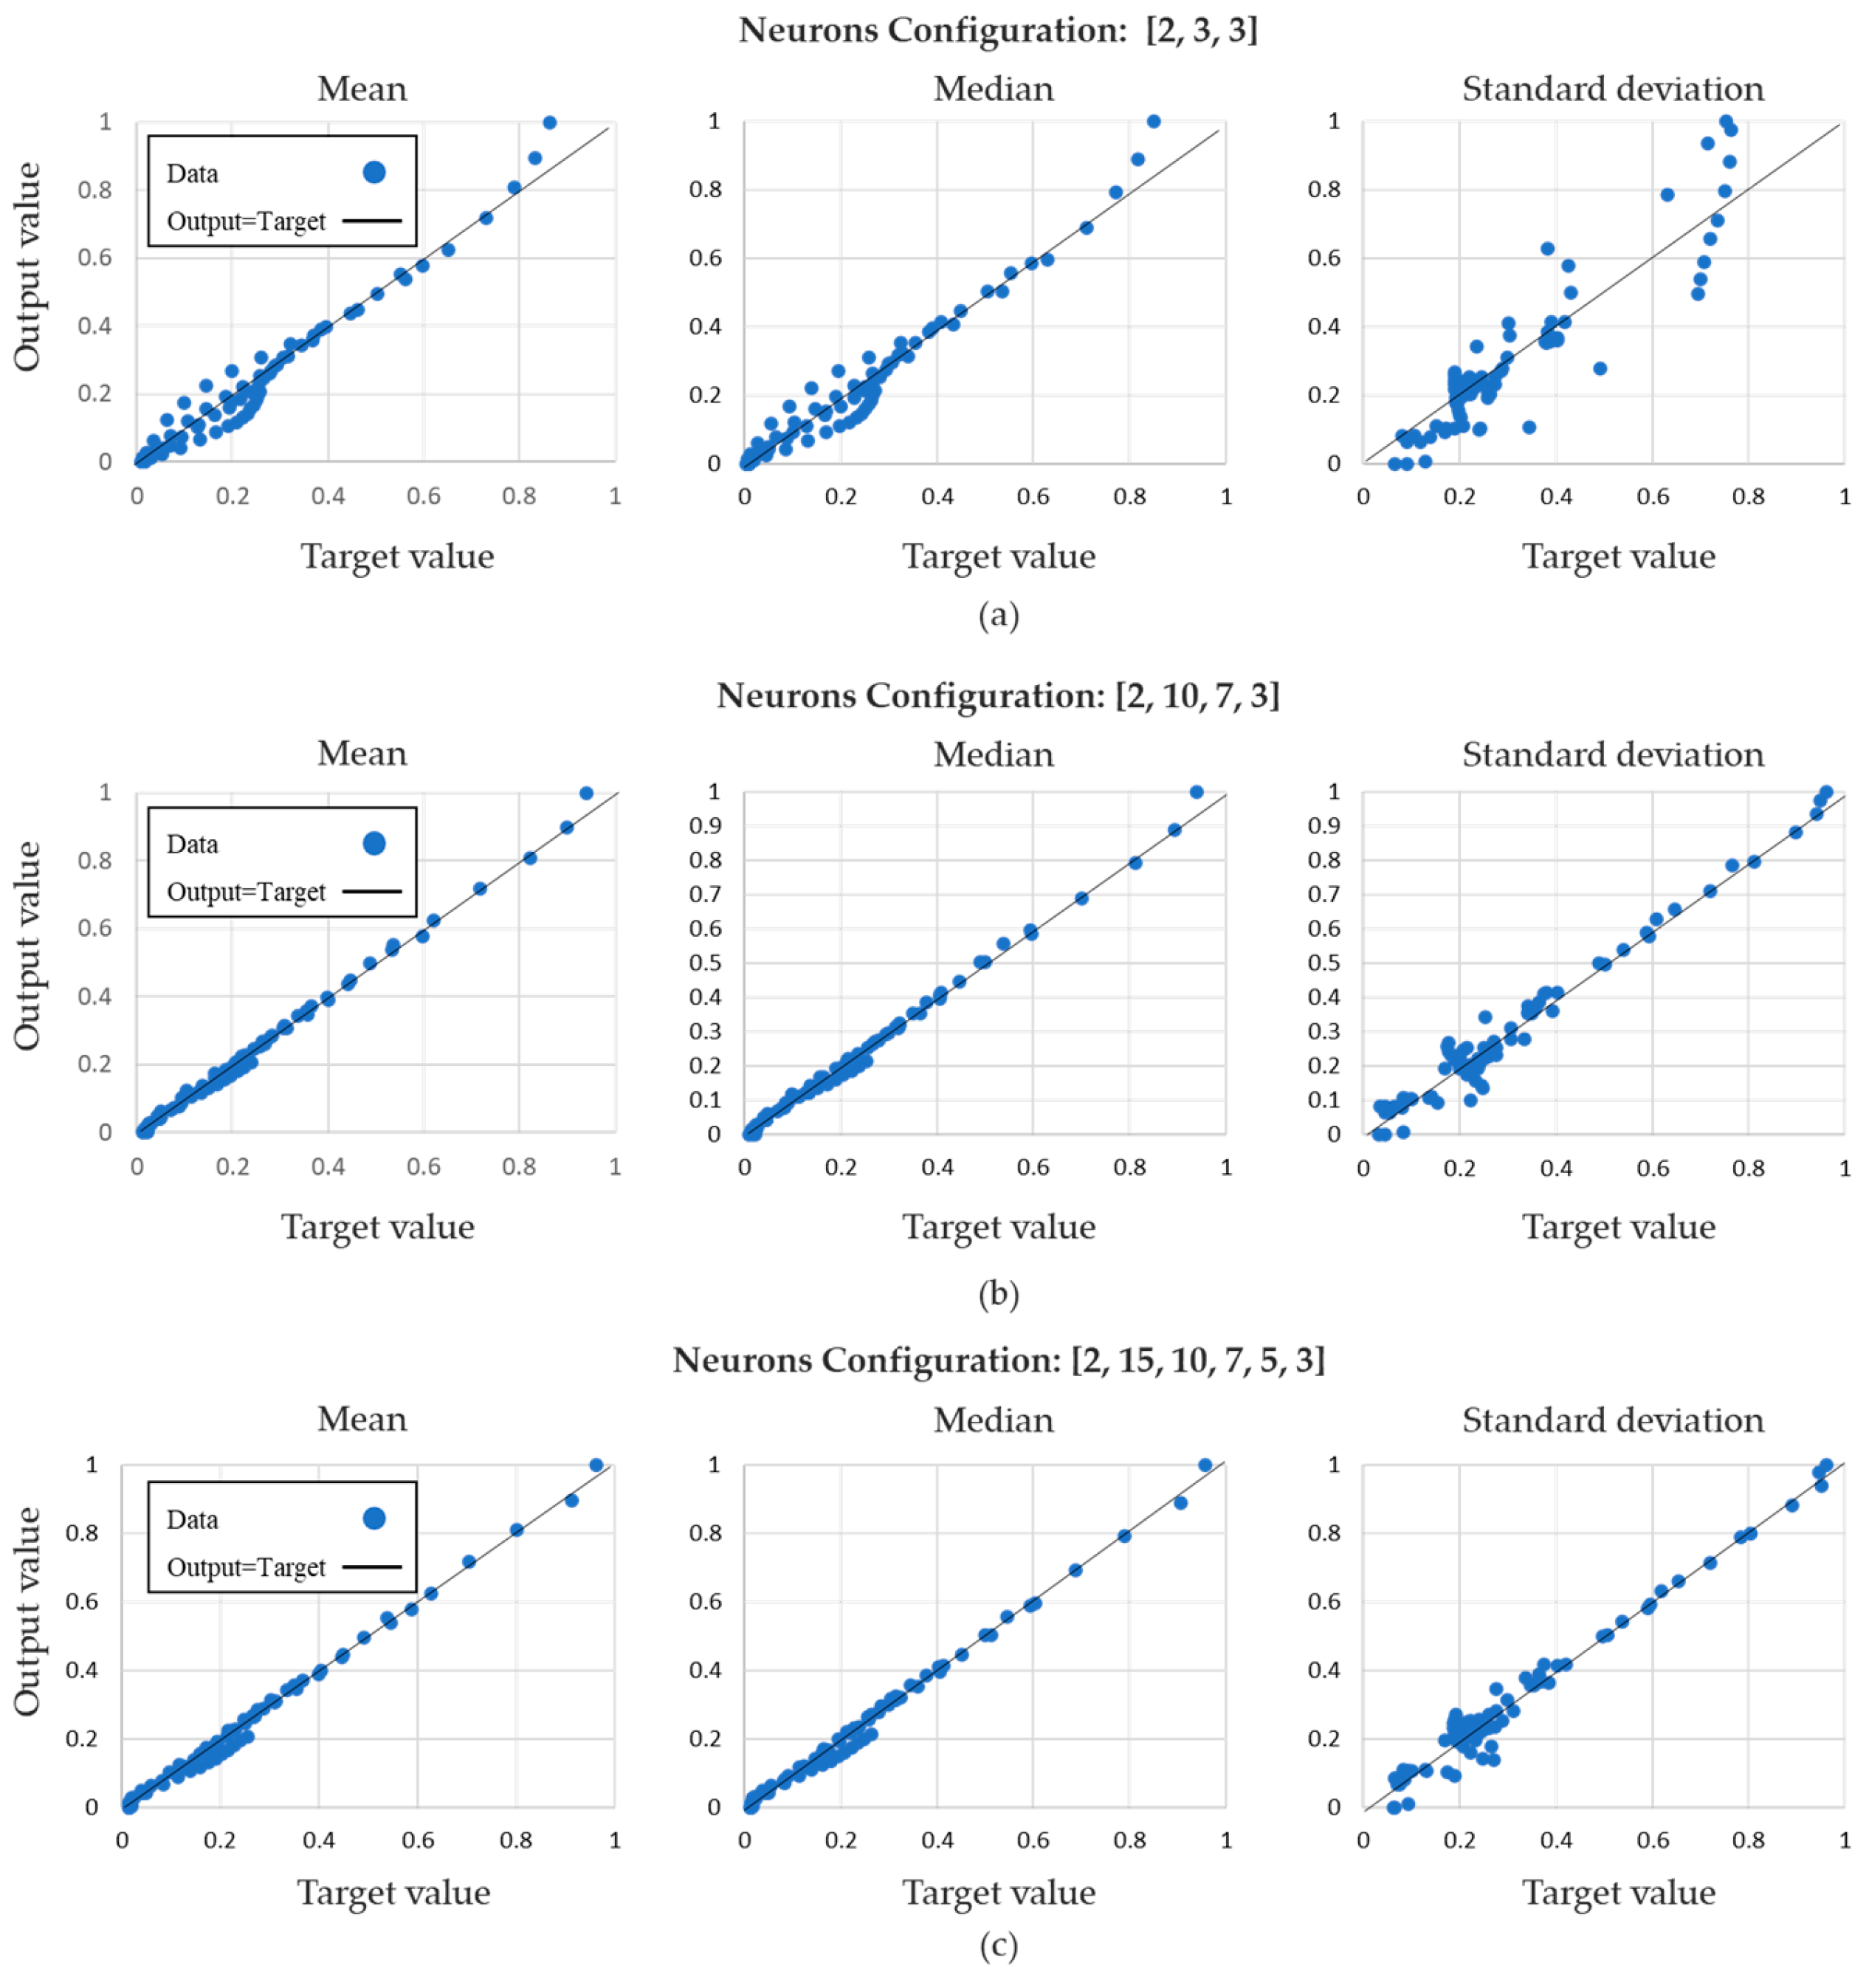
| Neurons Configuration | Hidden Layers | Training Data | Evaluation Data | Training Iterations | MSE Training Data | R2 Training Data | MSE Evaluation Data | R2 Evaluation Data |
|---|---|---|---|---|---|---|---|---|
| [2, 3, 3] | 1 | 70% | 30% | 5000 | 0.00538 | 0.75 | 0.00832 | 0.65 |
| [2, 6, 3] | 1 | 70% | 30% | 5000 | 0.00284 | 0.77 | 0.00350 | 0.76 |
| [2, 12, 3] | 1 | 70% | 30% | 5000 | 0.00262 | 0.78 | 0.00304 | 0.76 |
| [2, 10, 7, 3] | 2 | 70% | 30% | 5000 | 0.00093 | 0.81 | 0.00120 | 0.80 |
| [2, 15, 9, 5, 3] | 3 | 70% | 30% | 5000 | 0.00062 | 0.93 | 0.00084 | 0.85 |
| [2, 15, 10, 7, 5, 3] | 4 | 70% | 30% | 5000 | 0.00036 | 0.95 | 0.00053 | 0.94 |
| [2, 15, 11, 9, 7, 5, 3] | 5 | 70% | 30% | 5000 | 0.00016 | 0.98 | 0.00145 | 0.79 |
| Training ID | MSE Training Data | MSE Evaluation Data |
|---|---|---|
| 1 | 0.0002450 | 0.0002520 |
| 2 | 0.0002145 | 0.0002235 |
| 3 | 0.0002320 | 0.0002420 |
| 4 | 0.0002214 | 0.0002315 |
| 5 | 0.0002351 | 0.0002452 |
| 6 | 0.0002170 | 0.0002260 |
| 7 | 0.0002443 | 0.0002533 |
| 8 | 0.0002246 | 0.0002335 |
| 9 | 0.0002330 | 0.0002410 |
| 10 | 0.0002302 | 0.0002413 |
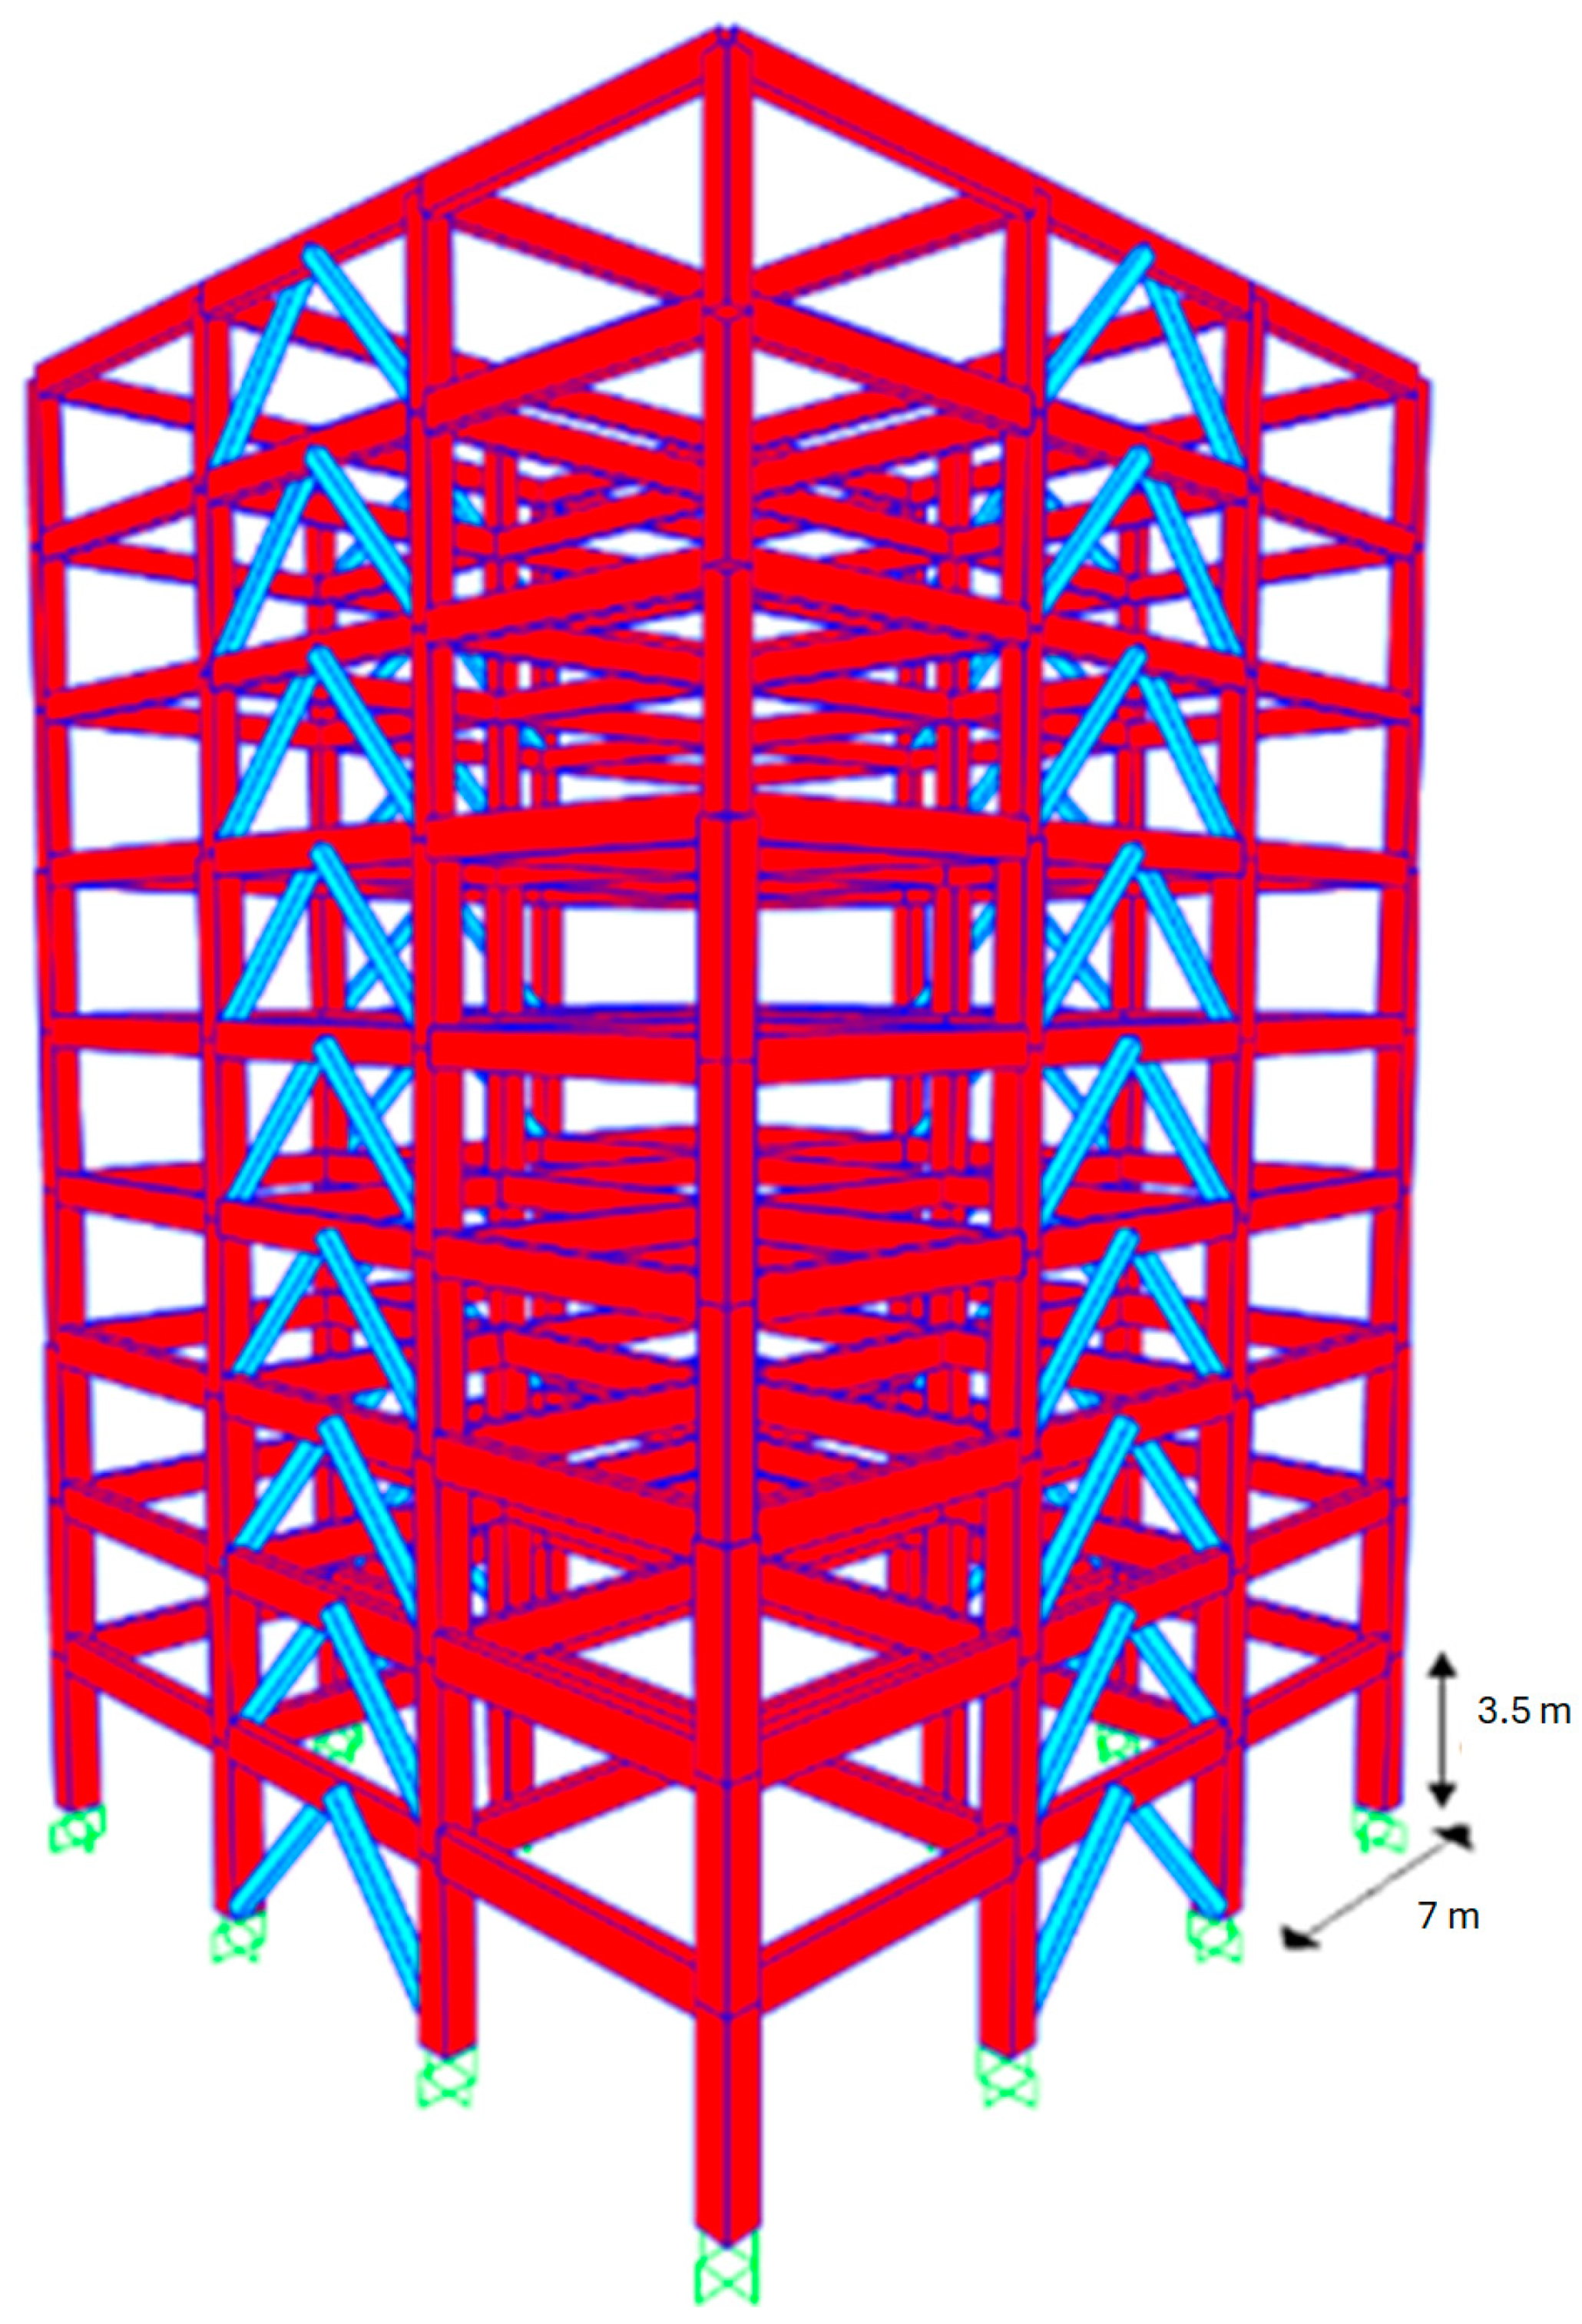
| Model | Number of Floors | Bays Dir. X | Bays Dir. Y | Interstory Height (m) | Bays Length (m) |
|---|---|---|---|---|---|
| RC9-BRB | 9 | 3 | 3 | 3.5 | 7 |
| Model Property | RC9-BRB |
|---|---|
| Column1 | 60x60 |
| Column2 | 45x45 |
| Column3 | 35x35 |
| Beam1 | 30x55 |
| Beam2 | 30x60 |
| Beam3 | 25x50 |
| BRB | 36 |
| Cy | 0.45 |
| Period (s) | 0.87 |
| Neurons Configuration | Hidden Layers | Evaluation Data | Training Iterations | MSE Training Data | R2 Training Data | MSE Evaluation Data | R2 Evaluation Data |
|---|---|---|---|---|---|---|---|
| [3, 6] | 0 | 30% | 5000 | 0.126 | 0.82 | 0.134 | 0.80 |
| [3, 10, 6] | 1 | 30% | 5000 | 0.090 | 0.85 | 0.115 | 0.82 |
| [3, 15, 10, 3] | 2 | 30% | 5000 | 0.085 | 0.87 | 0.097 | 0.83 |
| [3, 20, 15, 10, 7, 5, 3] | 3 | 30% | 5000 | 0.068 | 0.89 | 0.090 | 0.85 |
| [3, 25, 20, 15, 10, 7, 5, 3] | 4 | 30% | 5000 | 0.058 | 0.91 | 0.060 | 0.91 |
| [3, 30, 25, 20, 15, 10, 7, 5, 3] | 5 | 30% | 5000 | 0.049 | 0.92 | 0.069 | 0.89 |
Disclaimer/Publisher’s Note: The statements, opinions and data contained in all publications are solely those of the individual author(s) and contributor(s) and not of MDPI and/or the editor(s). MDPI and/or the editor(s) disclaim responsibility for any injury to people or property resulting from any ideas, methods, instructions or products referred to in the content. |
© 2024 by the authors. Licensee MDPI, Basel, Switzerland. This article is an open access article distributed under the terms and conditions of the Creative Commons Attribution (CC BY) license (https://creativecommons.org/licenses/by/4.0/).
Share and Cite
Payán-Serrano, O.; Bojórquez, E.; Carrillo, J.; Bojórquez, J.; Leyva, H.; Rodríguez-Castellanos, A.; Carvajal, J.; Torres, J. Seismic Performance Prediction of RC, BRB and SDOF Structures Using Deep Learning and the Intensity Measure INp. AI 2024, 5, 1496-1516. https://doi.org/10.3390/ai5030072
Payán-Serrano O, Bojórquez E, Carrillo J, Bojórquez J, Leyva H, Rodríguez-Castellanos A, Carvajal J, Torres J. Seismic Performance Prediction of RC, BRB and SDOF Structures Using Deep Learning and the Intensity Measure INp. AI. 2024; 5(3):1496-1516. https://doi.org/10.3390/ai5030072
Chicago/Turabian StylePayán-Serrano, Omar, Edén Bojórquez, Julián Carrillo, Juan Bojórquez, Herian Leyva, Ali Rodríguez-Castellanos, Joel Carvajal, and José Torres. 2024. "Seismic Performance Prediction of RC, BRB and SDOF Structures Using Deep Learning and the Intensity Measure INp" AI 5, no. 3: 1496-1516. https://doi.org/10.3390/ai5030072