Abstract
Background—Diabetes is a rapidly spreading chronic disease that poses a significant risk to individual health as the population grows. This increase is largely attributed to busy lifestyles, unhealthy eating habits, and a lack of awareness about the disease. Diabetes impacts the human body in various ways, one of the most serious being diabetic retinopathy (DR), which can result in severely reduced vision or even blindness if left untreated. Therefore, an effective early detection and diagnosis system is essential. As part of the Kingdom of Saudi Arabia’s Vision 2030 initiative, which emphasizes the importance of digital transformation in the healthcare sector, it is vital to equip healthcare professionals with effective tools for diagnosing DR. This not only ensures high-quality patient care but also results in cost savings and contributes to the kingdom’s economic growth, as the traditional process of diagnosing diabetic retinopathy can be both time-consuming and expensive. Methods—Artificial intelligence (AI), particularly deep learning, has played an important role in various areas of human life, especially in healthcare. This study leverages AI technology, specifically deep learning, to achieve two primary objectives: binary classification to determine whether a patient has DR, and multi-class classification to identify the stage of DR accurately and in a timely manner. The proposed model utilizes six pre-trained convolutional neural networks (CNNs): EfficientNetB3, EfficientNetV2B1, RegNetX008, RegNetX080, RegNetY006, and RegNetY008. In our study, we conducted two experiments. In the first experiment, we trained and evaluated different models using fundus images from the publicly available APTOS dataset. Results—The RegNetX080 model achieved 98.6% accuracy in binary classification, while the EfficientNetB3 model achieved 85.1% accuracy in multi-classification, respectively. For the second experiment, we trained the models using the APTOS dataset and evaluated them using fundus images from Al-Saif Medical Center in Saudi Arabia. In this experiment, EfficientNetB3 achieved 98.2% accuracy in binary classification and EfficientNetV2B1 achieved 84.4% accuracy in multi-classification, respectively. Conclusions—These results indicate the potential of AI technology for early and accurate detection and classification of DR. The study is a potential contribution towards improved healthcare and clinical decision support for an early detection of DR in Saudi Arabia.
Keywords:
diabetic retinopathy; deep learning; fundus images; EfficientNet; EfficientNetV2; RegNetX; RegNetY 1. Introduction
Diabetes occurs when there is an excess of glucose in the blood. This condition can arise if the pancreas does not produce enough insulin, leading to elevated blood sugar levels. High blood sugar can result in serious health complications, including heart disease, kidney disease, nerve damage, and blindness [1]. Diabetic retinopathy (DR) is a severe complication of diabetes that can damage the retina of the eye due to prolonged high blood sugar levels. Throughout the body, diabetes affects blood vessels [2]. In the retina, blockages in small blood vessels can cause fluid to leak or bleed, resulting in eye damage. In response to these blockages, the eyes create new blood vessels; however, these new vessels are often less functional, increasing the risk of bleeding or leakage [3]. Figure 1 illustrates the differences between a healthy retina and one affected by diabetic retinopathy. According to the World Health Organization (WHO), diabetic retinopathy is responsible for approximately 37 million cases of blindness worldwide. Current treatments for DR primarily focus on delaying or preventing further deterioration of vision, highlighting the importance of regular eye screenings with advanced computer systems [4]. Several factors may contribute to low adherence rates for diabetes medications or annual eye examinations. Early diagnosis and treatment of Vision-Threatening Diabetic Retinopathy (VTDR) are crucial to minimizing the risk of vision loss [5].
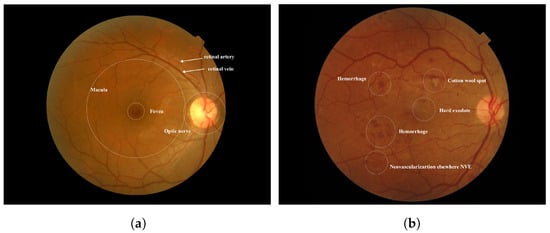
Figure 1.
(a) Normal Retina [6] (b) Diabetic Retinopathy was obtained from the Saudi dataset.
Diabetes mellitus is prevalent in Saudi Arabia, particularly in the form of diabetic retinopathy. According to the World Health Organization (WHO), Saudi Arabia has the second-highest prevalence of diabetes in the Middle East and ranks seventh globally. It is estimated that around 7 million people, approximately twice the population of Oklahoma, are living with diabetes, while over 3 million individuals, about the population of Arkansas, are classified as having pre-diabetes in the country [7,8]. Additionally, the prevalence of diabetic retinopathy (DR) ranges from 27.8% to 36%, with 53% of these cases reporting proliferative diabetic retinopathy (PDR) [9].
Generally, DR is divided into two types:
- NPDRIt delineates the initial three stages of diabetic retinopathy. Nonproliferative signifies the absence of irregular blood vessels within the retina.
- Mild NPDR stageDuring the early stage of diabetic retinopathy, the blood vessels in the retina may develop small bulges known as microaneurysms. These bulges may manifest as minuscule red dots, resulting in some blood leakage. While this stage typically does not impact vision or produce any symptoms, it can lead to macular swelling. While treatment is not typically necessary at this point, it is advisable to take preventative measures to impede the disease’s advancement.
- Moderate NPDR stageThis stage causes retinal blood vessels to swell, disrupting blood flow and depriving the retina of nutrients. Unlike mild NPDR, moderate NPDR is characterized by multiple microaneurysms. Accumulation of blood and fluids in the macula may cause symptoms like blurry vision.
- Severe NPDR stageAs the condition progresses, larger sections of retinal blood vessels become blocked, significantly reducing blood flow. Severe NPDR is characterized by Intraaretinal Microvascular Abnormalities (IRMA), which indicate abnormal vessel branching or dilation. IRMA signifies either new vessel growth or vessel remodeling due to low oxygen levels in the retina. These fragile vessels can produce a range of symptoms, such as blurred vision, areas of vision loss, and dark spots.
- PDRThe advanced stage of diabetic retinopathy is marked by insufficient oxygen supply to the retina, causing the emergence of delicate new blood vessels in both the retina and the vitreous. These vessels are prone to blood leakage, resulting in hazy vision and scar tissue formation that could lead to macular problems or retinal detachment. Such complications can potentially elevate eye pressure and damage the optic nerve. Timely treatment is necessary to stabilize vision and prevent serious consequences. Neglecting to address PDR could result in significant vision impairment and eventual blindness [10]. Figure 2 provides a visual representation of the two types with the four stages of DR.
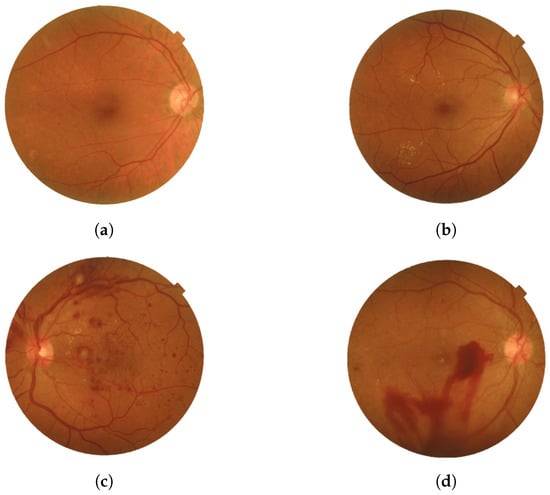 Figure 2. Four stages of DR: (a) Mild, (b) Moderate, (c) Severe, and (d) PDR were obtained from the Saudi dataset.
DR is diagnosed using several key methods. The primary approach is a comprehensive dilated eye exam, where the eye doctor administers drops to dilate the pupils and carefully examines the back of the eyes, including the retina and blood vessels, to detect signs of DR [11]. Another important diagnostic tool is fluorescein angiography (FA), which involves injecting a dye into a vein in the arm. This dye then travels to the blood vessels in the retina, and a specialized camera captures images of the retina as the dye circulates. This helps identify leaking blood vessels and other signs of DR [12]. Optical coherence tomography (OCT) is also essential for assessing DR, providing a detailed analysis of the retina to identify structural changes like subclinical diabetic macular edema. OCT can even predict outcomes and treatment responses by identifying specific imaging biomarkers [13]. Additionally, fundus photography (FP) plays a critical role, capturing detailed images of the back of the eye, including the retina, optic disc, and macula, using specialized cameras with complex microscopes and flash capabilities. Colored filters or dyes like fluorescein and green indocyanine are often used during FP to enhance visualization [14]. Follow-up imaging is also vital in assessing treatment response and detecting any disease recurrence or need for further intervention. However, the manual examination of imaging modalities can lead to inconsistencies and consume significant time, potentially introducing errors in DR diagnosis. Additionally, these technologies are often costly and not universally accessible in healthcare facilities, hampering the effective diagnosis and monitoring of DR. This limitation poses challenges to patient care and may negatively impact outcomes.
Artificial Intelligence (AI) has emerged as a pivotal tool in recent years, driven by advancements in computing technology and Deep Learning (DL) models. By harnessing training data, AI-powered learning algorithms can achieve enhanced precision and accuracy, reducing misdiagnoses and increasing efficiencies, thereby saving time, effort, and costs [15].
This progress is especially relevant in addressing the challenges in DR diagnosis and the limited accessibility of advanced imaging technologies. The proposed study aims to harness the power of AI techniques, specifically DL, to enhance healthcare effectiveness and accessibility for Saudi Arabian citizens, particularly in the early detection and management of DR. By utilizing large datasets and advanced learning algorithms, AI can significantly improve precision and, importantly, reduce diagnostic errors. This study employs six pre-trained convolutional neural networks (CNNs), EfficientNetB3, EfficientNetV2B1, RegNetX008, RegNetX080, RegNetY006, and RegNetY008, for analyzing retina images to detect DR. This approach enhances diagnostic accuracy and efficiency and promotes early intervention and personalized treatment strategies, ultimately improving healthcare outcomes for individuals at risk of diabetic retinopathy.
The study aims to achieve acceptable accuracy in diabetic retinopathy detection and grading by leveraging datasets from both Saudi Arabia and the APTOS 2019 dataset. The APTOS 2019 dataset, a widely recognized resource for identifying and grading diabetic retinopathy, was supplied by the Asia Pacific Tele-Ophthalmology Society (APTOS) and was featured on the Kaggle platform as part of a competition in 2019. Our approach shows promising potential to enhance the early detection and severity grading of diabetic retinopathy (DR), thereby yielding improved clinical outcomes.
2. Literature Review
Various deep learning techniques have been utilized to diagnose diabetic retinopathy. This section reviews recent advancements in the early diagnosis of this condition, specifically focusing on machine learning (ML) and deep learning (DL) algorithms. Numerous studies have investigated the use of convolutional neural networks (CNNs), ensemble learning, transfer learning, and feature extraction methods to automate the detection and classification of diabetic retinopathy severity levels from retinal images. Diabetic retinopathy classification is primarily divided into two categories: binary classification and multi-class classification. Binary classification aims to determine the presence or absence of diabetic retinopathy (DR), while multi-class classification seeks to identify the severity or stage of the disease, which typically includes Mild Non-Proliferative Diabetic Retinopathy (NPDR), Moderate NPDR, Severe NPDR, and Proliferative Diabetic Retinopathy (PDR). Numerous studies have explored both binary and multi-class classification of DR. In this section, we will examine research that focuses on binary classification, as well as studies that concentrate on multi-class classification, including those that address both types of classification.
2.1. Binary Classification of DR
Zeng et al.’s study [16] delved into the automatic identification of referable diabetic retinopathy. They did this by dividing fundus images into two severity classes. The study utilized the “Diabetic Retinopathy Detection” high-quality fundus image dataset from Kaggle. Their method employed a specific form of deep learning model, the convolutional neural network. This model was created by modifying an already-existing one (transfer learning) to make it unique. This model, in contrast to other techniques, simultaneously examined images from both eyes and independently predicted the severity for each eye. This method produced an area under the ROC curve of 0.951, which is marginally better (by 0.011) than the current approach that analyzes one eye at a time.
In a paper by Voets et al. [17], researchers conducted a study to validate previous studies on detecting diabetic retinopathy (DR) in retinal pictures using publicly available datasets. Instead of using the dataset used in the original work, they chose to utilize a different one from Kaggle EyePACS and Messidor-2. Like the original method, the algorithm was trained using the InceptionV3 neural network architecture. Techniques for ensemble learning were also included to improve the training process even more. The replicated approach obtained area under the curve (AUC) ratings of 0.951 and 0.853 on the separate Kaggle EyePACS test dataset and Messidor-2, respectively.
Chetoui and Akhloufi [18] developed an advanced deep-learning convolutional neural network (CNN) for detecting diabetic retinopathy (DR) in retinal images. To assess its effectiveness, they tested the model on a large dataset consisting of over 90,000 images sourced from nine public databases: EyePacs, MESSIDOR, MESSIDOR-2, DIARETDB0, DIARETDB1, STARE, IDRID, E-ophtha, and UoA-DR. Their approach featured a unique “explainability” component that visually highlights areas identified by the model as indicative of DR. On the EyePACS dataset, their system surpassed existing benchmarks, achieving an Area Under the Curve (AUC) of 0.986. The model demonstrated robust performance across all nine datasets, with AUC values consistently above 0.95. Specifically, the AUC values for the MESSIDOR, MESSIDOR-2, DIARETDB0, DIARETDB1, STARE, IDRID, E-ophtha, and UoA-DR datasets were 0.963, 0.979, 0.986, 0.988, 0.964, 0.957, 0.984, and 0.990, respectively.
A study by Zong et al. [19] proposed an automated method to segment hard exudates in retinal images to aid DR diagnosis. They employed 81 classified images from a public dataset (IDRiD) and used a specific technique (SLIC) to handle data limitations. To achieve better performance, their method uses a special network architecture based on U-Net and includes extra elements (inception modules and residual connections). On the IDRiD dataset, their novel network architecture produced high accuracy (97.95%).
Abdelsalam and Zahran [20] examined a novel approach to early DR detection employing retinal pictures acquired from the Ophthalmology Center at Mansoura University, Egypt. Their approach was based on a methodology used in other scientific domains to analyze the complex branching patterns in the pictures: multifractal geometry analysis. This approach and a particular algorithm (SVM) produced good accuracy results of 98.5%. This method has the potential for identifying different phases of diabetic retinopathy and other retinal illnesses that impact blood vessel distribution, in addition to early DR identification.
In a paper by Maqsood et al. [21], the authors presented a technique to detect hemorrhages, a crucial early indicator of DR. Their method combines a unique CNN architecture with a modified contrast enhancement methodology. The system uses fusion to identify the most informative features after using a pre-trained CNN to extract features from hemorrhages. Using a dataset of 1509 images from six sources (HRF, DRIVE, STARE, MESSIDOR, DIARETDB0, and DIARETDB1), the approach achieved an average accuracy of 97.71%. Comparing the system to other hemorrhage detection techniques shows better quantitative performance and visual quality.
In a study by Ayala et al. [22], the authors introduced a novel deep-learning model for detecting diabetic retinopathy (DR) using fundus images. They utilized two datasets: the APTOS 2019 Blindness Detection dataset from Kaggle and the MESSIDOR2 dataset. The approach employed Convolutional Neural Networks (CNNs), which are particularly effective for image classification tasks. To evaluate the model’s ability to learn complex features, the two datasets were cross-tested. The CNN was trained to differentiate between Non-Proliferative Diabetic Retinopathy (NPDR) and Proliferative Diabetic Retinopathy (PDR) in fundus images. The model used transfer learning to initialize the weights of the CNN. This study demonstrates that deep learning can effectively create accurate DR detection models, achieving an accuracy of 81% on the APTOS dataset and 64% on the MESSIDOR dataset. However, the study had limitations, including a lack of diversity in the dataset.
Maaliw et al. [23] propose an improved method for diagnosing diabetic retinopathy (DR). Their approach uses Atrous Spatial Pyramid Pooling (ASPP) for segmentation and a CNN based on ResidualNet for classification. This technique scored satisfactorily using a dataset that combined the DIARETDB0 and DIARETDB1 datasets (accuracy: 99.2%, precision: 98.9%, sensitivity: 99.4%, specificity: 98.9%).
A study by Rahman et al. [24] proposed a hybrid intelligent approach that combines transfer learning and machine learning techniques to detect DR. The proposed model consists of a pretrained feature extractor, namely ResNet50, which produces output features that are then fed to a machine learning classifier, namely, SVM. Utilizing the APTOS dataset, the model achieved its highest accuracy at 96.9%.
Table 1 describes the techniques, dataset, and results of the binary classification of DR literature review.

Table 1.
Summary of literature review for binary classification of DR.
2.2. Multi-Class Classification of DR
This section will discuss recent studies that demonstrate how deep learning models can improve the accuracy and efficiency of diagnosing and classifying diabetic retinopathy. Research has shown promising results in terms of accuracy, efficiency, and scalability for multi-stage diabetic retinopathy diagnosis using deep learning methods. However, there are still some limitations and challenges that need to be addressed, requiring further exploration and refinement in future research.
Alyoubi et al. [4] conducted an in-depth study that introduced a comprehensive approach for classifying diabetic retinopathy (DR) images into five categories: no DR, mild DR, moderate DR, severe DR, and proliferative DR. Their technique is also capable of identifying individual lesions on the retinal surface, classifying them into two main groups: red lesions, which include microaneurysms (MA) and hemorrhages (HM), and bright lesions, which encompass soft and hard exudates (EX). The study utilized two publicly available fundus retina databases: the DDR and the Asia Pacific Tele-Ophthalmology Society (APTOS), both of which contain photographs of various DR stages. The system architecture incorporates two deep learning models: the first employs three CNN-based models for DR classification. Among these, one model utilizes transfer learning through EfficientNetB0, while the others, referred to as CNN512 and CNN229, are specifically designed and trained for the task. Notably, CNN512 processes the full image to classify it according to the DR stage. The second model is a modified version of YOLOv3, which excels in identifying and localizing DR lesions. Before training, the system benefited from image preprocessing techniques to enhance data augmentation. Performance metrics showed that CNN512 achieved an accuracy of 88.6% on the DDR dataset and 84.1% on the APTOS dataset. In terms of lesion localization, the adapted YOLOv3 model produced a mean Average Precision (mAP) of 0.216 on the DDR dataset. Remarkably, the fusion of the CNN512 and YOLOv3 models yielded an impressive accuracy of 89%, establishing a new benchmark in the field. However, a limitation of the study is that the sensitivity for detecting mild and severe DR stages was lower compared to other categories. This outcome is attributed to the imbalance present in the datasets used for training.
The goal of a study by Gao et al. [25] is to automatically diagnose DR patients and provide them with useful recommendations. The dataset, including 4476 images, was provided by the Sichuan Provincial People’s Hospital’s ophthalmology departments, endocrinology and metabolism, and health management center. The hospital is the second-best in Sichuan Province for ophthalmology. They classified the severity of DR fundus photos using this dataset by applying transfer learning and deep convolutional neural network models. The basic model was the Inception-V3 network, but each of the four portions of the image was fed into a different Inception-V3 model. The model that was suggested was called Inception4. They achieved 88.72% accuracy, 95.77% precision, and 94.84% recall in the studies.
An ensemble of deep CNN models was created by Qummar et al. [26] utilizing retinal pictures to improve the classification accuracy of various stages of DR. The study used the publicly available Kaggle Diabetic Retinopathy Detection dataset to address the shortcomings of current models in reliably detecting different stages of DR, with a particular focus on the early stages. The publicly accessible Kaggle dataset was used to train an ensemble of five deep CNN models, namely Resnet50, Inceptionv3, Xception, Dense121, and Dense169, to do this. The preprocessing and augmentation stages of the dataset involved scaling the images to 786 × 512 pixels, randomly clipping five 512 × 512 patches from each image, flipping, rotating the images 90 degrees, and applying mean normalization. The results showed that the suggested model had an F1-score of 53.74%, an accuracy of 80.8%, a recall of 51.5%, a specificity of 86.72, and a precision of 63.85%. The suggested model outperforms previous methods on the Kaggle dataset in detecting all levels of DR.
An advanced capsule network is presented in a study paper by Kalyani et al. [27] to identify and categorize the stages of diabetic retinopathy. Finding out if patients have diabetic retinopathy and, if so, what stage it is in is the study’s primary goal. They used the Messidor dataset, a well-known DR dataset that divides diabetic retinopathy into four grades, 0 through 3. This study was driven by the rise of capsule networks in deep learning, outperforming classic machine learning approaches in numerous applications. Fundus images are processed using the convolution and primary capsule layers for feature extraction. The class capsule and softmax layers then determine the image’s class likelihood. Additionally, because the green channel has better contrast and accentuates characteristics like microaneurysms, only the green channel is taken out of the RGB channels of retinal pictures during preprocessing. With an astounding accuracy of 97.98%, 95.62% precision, 96.11% recall, and a 96.36% F1 score, the completed capsule network is impressive. The study is limited, nevertheless, by its concentration on the first three stages (0–3) of diabetic retinopathy; other databases categorize DR into five stages. For this kind of dataset, the existing network is still untrained.
The main goal of a study by Khan et al. [28] is to categorize the several stages of DR, focusing on lowering learnable parameters to accelerate model training and convergence. The study used Kaggle’s EyePACS dataset, which has 88,702 images. 53,576 of these images are unlabeled, while 35,126 have labels. For its analysis, the study only used a subset of tagged photos. The study incorporates the CNN model with modifications in terms of methodology. The VGG-NiN model is a highly nonlinear, scale-invariant deep model built using the VGG16, the Spatial Pyramid Pooling layer (SPP), and the Network-in-Network (NiN) architectures. The model shows the following performance metrics: 91% specificity, 55.6% recall, 67% precision, 85% accuracy, and 59.6% F1-score. One limitation of the research was its focus on solely labeled photos, which excluded a substantial portion of the available data.
Bhardwaj et al. [29] proposed an elaborate fusion of four InceptionResnet-V2 architectures, the Quadrant-based Ensemble InceptionResnet-V2 (QEIRV-2) model for automated DR detection. The goal of this framework was to enhance early detection of retinal abnormalities. Two datasets, MESSIDOR (1,200 images) and IDRiD (454 images with non-proliferative DR), were used to train the model. Additionally, data augmentation and preprocessing methods were used to improve performance. The approach achieved an accuracy rate of 93.33%.
Jagan et al. [30] presented a way to enhance the classification of diabetic retinopathy (DR) using deep learning on retinal pictures. Their method includes entropy image conversion to enhance the proposed model’s deep learning capabilities and a four-step ensemble strategy (MRMR, Chi-Sq, ReliefF, and F-tests) for feature selection. This approach seeks to decrease redundancy and increase accuracy. The paper employs three datasets to accomplish this, which are Kaggle, the Indian Diabetic Retinopathy Image Dataset (IDRID), and MESSIDOR-2 and assesses Naive Bayes classifiers, K-Nearest Neighbors (KNN), and Support Vector Machines (SVM). SVMs outperformed KNN and Naive Bayes, with the best accuracy of 97.8%.
A study by Yasashvini et al. [31] proposed a deep learning approach to classify diabetic retinopathy (DR) phases based on retinal pictures. Three models are assessed: CNN, hybrid CNN-ResNet, and hybrid CNN-DenseNet. On the Kaggle APTOS 2019 Blindness Detection dataset, all models performed well in accuracy; however, the hybrid CNN-DenseNet model performed best, scoring 96.22%. The study does, however, admit its limitations, including its small sample size and lack of cross-validation for the generalizability assessment.
A recent study by Adak et al. [32] focused on the automated detection of diabetic retinopathy (DR) severity stages using fundus images. The researchers employed transformer-based learning models to efficiently extract important features from retinal images, enabling a detailed understanding of the severity of diabetic retinopathy. They utilized an ensemble technique that combined four different models: Class-Attention in Image Transformers (CaiT), Bidirectional Encoder representation for Image Transformer (BEiT), Data-efficient Image Transformers (DeiT), and Vision Transformer (ViT). Together, these models assessed fundus photographs to determine the severity of DR. Additionally, they introduced two ensembled image transformers: EiTwm and EiTmv. EiTwm uses majority voting, while EiTmv employs a weighted mean combination voting approach. The experiments were conducted using the publicly available APTOS-2019 blindness detection dataset, and the results were promising. EiTwm achieved an accuracy of 94.63%, while EiTmv attained 91.26%. Despite the dataset’s inherent imbalance, the models performed exceptionally well, surpassing the current state-of-the-art methods in detecting DR severity stages.
Luo et al.’s study [33] suggested a deep CNN for DR detection that can mine retinal fundus photos’ local and long-range dependence. The research employs two methodologies: Long-Range Unit and Patch-wise Relationship Learning. The patch-wise relationship learning module improves the local patch features by using the relationships between patches. On the other hand, the image’s dispersed lesion features’ long-range reliance is captured by the Long-Range unit module. The MESSIDOR and E-Ophtha datasets were used to assess the suggested methodology. According to the results, the suggested strategy beat cutting-edge techniques on DR detection tasks. The suggested approach obtained an accuracy of 92.1% for normal/abnormal and 93.5% for referable/non-referable on the MESSIDOR dataset. The accuracy of the suggested technique was 83.6% on the E-Ophtha dataset.
The goal of a study by Jena et al. [34] is to use asymmetric deep learning features to create a new deep learning-based method for DR screening. It used the APTOS and MESSIDOR datasets, which are both freely accessible. Photos with and without DR and photos in various DR phases are included in both collections. Using a U-Net architecture, the research extracted asymmetric deep-learning characteristics from the retinal pictures. The retrieved features were divided into DR and non-DR groups using a CNN and SVM. The MESSIDOR dataset was used to assess the CNN after it had been trained on the APTOS dataset. Non-diabetic retinopathy can be identified with 98.6% and 91.9% accuracy, respectively, according to the APTOS and MESSIDOR datasets. According to both datasets, exudates are detected with 96.7% and 98.3% accuracy.
In a study by Usman et al. [35] the authors suggest a deep learning model that uses principle component analysis (PCA) for multi-label feature extraction and classification in order to detect and classify DR. A publicly accessible dataset of color fundus photos (CFPs) from the Kaggle Diabetic Retinopathy Detection dataset was utilized by the model. Five DR stages were identified for the dataset: proliferative DR, mild DR, moderate DR, severe DR, and no DR. The study employed a deep learning model for multi-label feature extraction and classification that was built on top of a pre-trained CNN architecture. The feature extraction and classification modules comprise the model’s two primary parts. The feature extraction module uses PCA to extract useful features from the CFPs. The retrieved characteristics are then divided into the five DR phases by the classification module using a CNN. The proposed model yielded an accuracy of 94.40%, a sensitivity of 76.35%, an F1 score of 72.87%, and a hamming loss of 0.0560, as per the experimental results.
Research by Ali et al. [36] presented a novel DL model for the early classification of DR in their study. To achieve the best recognition accuracy, the model uses color fundus images and concentrates on the most critical components of the illness to exclude unimportant elements. Eighty percent of the Kaggle Diabetic Retinopathy Detection dataset was utilized for training, and twenty percent was used for testing in this study. The model was created using a hybrid deep-learning classification technique that included ResNet50 and Inceptionv3. Two models were used for feature extraction: ResNet50 and Inceptionv3. ResNet50 improved performance without becoming overly complex, whereas Inceptionv3 used varying filter widths to lower parameters and computational costs. Histogram equalization, intensity normalization, and augmentation were used in the pre-processing of the photos. The study yielded a precision of 96.46%, sensitivity of 99.28%, specificity of 98.92%, accuracy of 96.85%, and F1 score of 98.65%.
Manjula et al. [37] proposed an ensemble machine-learning technique for DR detection using a Kaggle dataset. The study investigated several machine learning techniques, such as Random Forests, Decision Trees, K-Nearest Neighbor, AdaBoost Classifier, J48graft classifier, and Logistic Regression. On the Kaggle dataset, these researchers achieved a 96.34% accuracy rate, demonstrating the promise of machine learning for early DR detection.
Alwakid et al. [38] built a deep learning model to accurately classify five stages of diabetic retinopathy (DR) in retinal images. They trained the model on two datasets (DDR and APTOS) containing high-resolution images for all DR stages (0–4). The study compared two approaches: one with image enhancement techniques (CLAHE and ESRGAN) and another without. The DenseNet-121 model demonstrated a remarkable accuracy of 98.7% on the APTOS dataset with image enhancement. However, accuracy dropped significantly to 81.23% without enhancement. Meanwhile, for approaches 1 and 2, with and without enhancement, the accuracy was reported by the DDR dataset as 79.6% and 79.2%, respectively.
Kumari et al. [39] suggest a deep learning method for automated DR detection using a ResNet-based neural network. They investigate how well retinal pictures in color and black and white can be used for classification. Using 10-fold cross-validation, the model was trained and assessed on two datasets: EyePACS and APTOS. A ResNet architecture was used for feature extraction, and missing data was addressed by vectorization. The method showed potential for clinical applications by achieving a high accuracy of 98.9% for high-quality images. Nevertheless, accuracy fell to 94.9% for low-quality photos, emphasizing how crucial high-quality images are for accurate DR detection.
Table 2 describes the techniques, dataset, and results of the multi-class classification of DR literature review.
Table 2.
Summary of literature review for multi-class classification of DR.
2.3. Joint Binary and Multi-Class Classification of DR
Without early detection and treatment, diabetic retinopathy, a common eye disease, can cause vision loss. A deep learning-based method was suggested by Yaqoob et al. [40] for categorizing and evaluating diabetic retinopathy images. After determining the symptoms, the disease’s severity degree must be determined so that the appropriate medication can be given. The authors employed Random Forest for classification with the ResNet-50 feature map. The suggested approach is compared with state-of-the-art approaches, such as ResNet-50, VGG-19, Inception-v3, MobileNet, Xception, and VGG16. They use two publicly available datasets called Messidor-2 and EyePACS. There are two classifications of diabetic macular edema in the Messidor-2 dataset: “No Referable DME Grade” and “Referable DME Grade”. Furthermore, five disease categories from the EyePACS dataset are proliferative diabetic retinopathy, severe, moderate, mild, and no diabetic retinopathy. Consequently, the suggested method outperforms the comparable methods in accuracy, attaining 96% and 75.09% for the two datasets, respectively.
Novitasari et al. [41] suggests the use of a hybrid fundus image classification system that combines Deep Extreme Learning Machines (DELMs) and Convolutional Neural Networks (CNNs) for identifying the stages of Diabetic Retinopathy (DR). The study utilized three publicly accessible datasets: Messidor-2, Messidor-4, and the Diabetic Retinopathy Image Database (DRIVE). This hybrid approach involved using CNNs along with Extreme Learning Machines (ELMs) [42] to assess the severity of DR. Five different CNN architectures were employed to extract features from fundus images: ResNet-18, ResNet-50, ResNet-101, GoogleNet, and DenseNet. The extracted features were then classified using the DELM method. A key objective of this study was to identify the best CNN architecture for feature extraction from fundus images. Additionally, the performance of DELM was evaluated using various kernel functions. Consequently, remarkable results were achieved across all experiments using the CDELM method, achieving 100% accuracy for two classes in both the MESSIDOR and DRIVE datasets. For the four-class MESSIDOR dataset, the highest accuracy recorded was 98.20%. However, despite its advantages, the CDELM approach faces challenges when handling extensive datasets. Specifically, errors may occur during training when DELM attempts to multiply several square matrices with 60,000 or more data points.
A trustworthy approach for screening and grading the phases of diabetic retinopathy was introduced in a study by Shakibania et al. [43]. The technique shows a significant potential for enhancing clinical decision-making and patient care in terms of classification accuracy and other metrics. The research presents a deep learning approach that uses a single fundus retinal image to identify and grade diabetic retinopathy Discriminative Restricted Boltzmann Machines (DRBMs) with Softmax layers stages. ResNet50 and EfficientNetB0, two sophisticated pre-trained models, are used by the model to act as feature extractors and refine them using a new dataset through transfer learning. The dataset was divided into subsets for testing (20%), validation (10%), and training (70%). The unbalanced data was resolved using the complement cross-entropy (CCE) loss function. Three datasets were used to train the model: the Indian Diabetic Retinopathy Image Dataset (IDRID), MESSIDOR2, and APTOS 2019 Blindness Detection. In binary classification, the proposed technique achieves 98.50% accuracy, 99.46% sensitivity, and 97.51% specificity; in stage grading, it achieves 93.00% quadratic weighted kappa, 89.60% accuracy, 89.60% sensitivity, and 97.72% specificity.
Table 3 describes the techniques, dataset, and results of joint binary and multi-class classification of DR literature review. It is worth noting that, there are relatively small number of studies targeting joint detection and classification of DR. Another observation is that the binary classification results in terms of accuracy and other metrics are better than the multi-classification results. That is quite understandable as granularity increases, the classification accuracy is somewhat compromised.
Table 3.
Summary of literature review for both binary and multi-class classification of DR.
3. Materials and Methods
3.1. Dataset
In this study, we utilized two datasets to detect and analyze diabetic retinopathy (DR): the Asia Pacific Tele-Ophthalmology Society (APTOS) dataset [6] and a dataset from Al-Saif Medical Center in Saudi Arabia. These datasets were pivotal in evaluating the model’s effectiveness and its applicability to diverse data sources.
The APTOS dataset, which is publicly accessible, consists of 3662 PNG images. Each image is labeled with an id_code and a DR severity level, categorized on a scale from 0 (no DR) to 4 (proliferative DR). For our research, we adapted this dataset into a binary classification system, dividing the images into two groups: without DR (diagnosis 0) and with DR (diagnoses 1–4). We conducted analyses using the original multi-class and modified binary formats to assess the dataset’s versatility and effectiveness across various diagnostic models.
Similarly, the Saudi dataset from Al-Saif Medical Center includes 168 JPEG images, each annotated with an id_code and a DR severity level on the same 0-4 scale. This dataset was collected and annotated by a physician over approximately one month. Like the APTOS dataset, we converted the Saudi dataset into a binary classification system for our analysis. This modification enabled a comprehensive validation of our diagnostic models, utilizing both the original multi-class and binary classification systems.
Statistical Analysis
The data were analyzed statistically to evaluate the count of each class. Table 4, Table 5, Table 6 and Table 7 below were used to tally the data and determine its balance.
Table 4.
Statistical analysis of the APTOS dataset (Multi-class).
Table 5.
Statistical analysis of the Saudi dataset (Multi-class).
Table 6.
Statistical analysis of the APTOS dataset (Binary).
Table 7.
Statistical analysis of the Saudi dataset (Binary).
3.2. Proposed Approach
In this study, we conducted two experiments using the APTOS dataset, a publicly available resource, and a Saudi dataset from Alsaif Medical Center. The experiments included binary classification to determine the presence or absence of DR and multi-class classification to categorize patients into different stages of the disease (No DR, Mild, Moderate, Severe, and Proliferative DR).In the first experiment, we divided the APTOS dataset into training (70%), validation (10%), and testing (20%) subsets. For the second experiment, we used the Saudi dataset for validation and the APTOS dataset for training (80%) and testing (20%). We trained six pre-trained Convolutional Neural Networks (CNNs) models: EfficientNetB3, EfficientNetV2B1, RegNetX008, RegNetX080, RegNetY006, and RegNetY008. We also integrated two new callback functions, EarlyStopping and ReduceLROnPlateau, to improve the training process by preventing overfitting and optimizing the learning rate. Each model underwent rigorous training for thirty epochs to ensure comprehensive data exploration.
The process employed in constructing the prediction models is encapsulated in Figure 3 and Figure 4.

Figure 3.
The proposed framework for the first experiment preemptive diagnosis of DR.
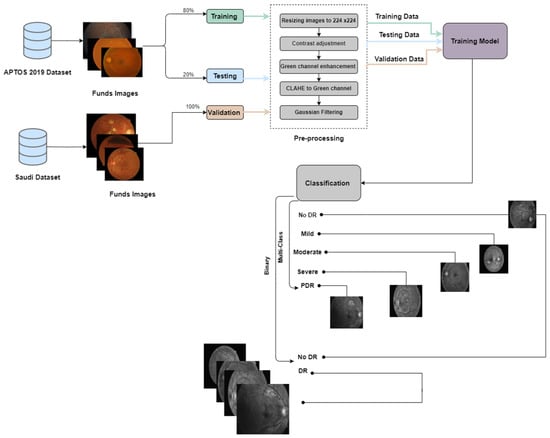
Figure 4.
The proposed framework for the second experiment pre-emptive diagnosis of DR.
3.3. Pre-Trained Models
A pr-trained AI model is a machine learning model that has already been trained on a substantial dataset to perform a specific function. These models are widely used because they save time and resources, requiring less data for fine-tuning specific tasks. They have been particularly transformative in fields like natural language processing, speech recognition, healthcare diagnostics, and cybersecurity, enabling rapid advances by serving as a foundational framework upon which customized solutions can be developed. Based on past literature and extensive trials, we selected EfficientNet and RegNet because they offer an excellent balance of accuracy and efficiency, which is essential in real-world applications like diabetic retinopathy detection [44].
3.3.1. EfficientNet Family
EfficientNet is a new approach to scaling up CNNs in a more structured and effective manner than previous methods. Before EfficientNet, the standard practice for scaling up CNNs involved increasing the input images’ depth, width, or resolution without a proper balance. This often led to inefficient performance improvements. EfficientNet introduces a new scaling method called compound scaling, which uniformly scales network width, depth, and resolution with a set of fixed scaling coefficients. This method is based on the observation that balancing these dimensions is crucial for improving the network’s performance and efficiency. The compound scaling method is shown in Figure 5.
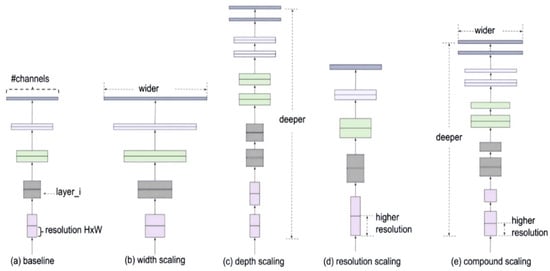
Figure 5.
Compound scaling method.
The mathematical process of compound scaling is demonstrated through the equations given below:
To find the optimal balance, a neural architecture search is conducted to find a baseline network architecture called EfficientNet-B0. This baseline model is then scaled up systematically to obtain a family of models, EfficientNet-B1 to EfficientNet-B7 [45].
EfficientNetV2 was created to address specific shortcomings of the original EfficientNet models. Its primary goal was to improve the efficiency and speed of model training while also enhancing its ability to identify various types of images accurately. EfficientNetV2 features a variety of important upgrades and features, such as Faster Training, Optimized Scaling, and New Architectural Changes [46].
For our study, we will use EfficientNetB3 and EfficientNetV2B1. EfficientNetB3 is a member of the original EfficientNet family, while EfficientNetV2B1 belongs to the newer EfficientNetV2 series [37,47].
EifficientNetB3
EfficientNetB3 is a convolutional neural network model that balances high accuracy and computational efficiency for image classification tasks. The number in EfficientNetB3 indicates the scaling factor applied to the base architecture. It has been created by Mingxing Tan using neural architecture search to develop a new baseline network and then scale it up to create a family of models called EfficientNets. This approach involves simultaneous adjustments to the network’s depth, width (number of channels in layers), and resolution (input image size) in a carefully coordinated manner. The goal is to achieve the optimal balance between performance and resource usage, resulting in significantly better results than previous ConvNets [48].
EfficientNetV2B1
EfficientNetV2B1 is a CNN architecture designed to perform image classification tasks while maintaining computational efficiency. It is a smaller and faster model compared to other variants in the EfficientNetV2 family as it applies a smaller scaling factor (1). It was created by Mingxing Tan in 2021 and is based on the original EfficientNet family, which was introduced in 2019. It is renowned for having faster training speed and better parameter efficiency than previous models. EfficientNetV2 achieves this through a more sophisticated scaling method that considers network complexity and channel allocation rather than simultaneously scaling depth, width, and resolution. Within its building blocks, EfficientNetV2 incorporates Squeeze and Excitation (SE) blocks to allow the model to focus on informative features while suppressing less important ones. It also includes fused activation and batch normalization (Fused-BatchNorm), which improves its speed and efficiency. Despite its smaller size compared to some popular models, EfficientNetV2B1 delivers comparable or better accuracy on image classification tasks. As such, it serves as a strong foundation for transfer learning, where the pre-trained model is fine-tuned for specific classification tasks [49].
3.3.2. RegNet Family
RegNet is a network design approach developed by Facebook AI Research (FAIR) that focuses on creating network architecture spaces rather than designing individual network instances. The core idea behind RegNet is to parametrize a low-dimensional design space of simple, regular networks. This is based on the observation that effective networks can be described by a quantized linear function that determines their widths (the number of channels) and depths (the number of layers). What makes the RegNet approach distinctive is its emphasis on simplicity and interpretability, along with the goal of identifying general design principles that apply to well-performing networks across various settings. This stands in contrast to traditional manual network design and neural architecture search (NAS).
RegNetX and RegNetY are two families of models within the RegNet design paradigm, each defined by distinct configurations of the network’s components. RegNetX focuses on adjusting the network’s width (the number of channels) and depth (the number of layers) based on a quantized linear parameterization, without employing any additional mechanisms like Squeeze-and-Excitation (SE) blocks. In contrast, RegNetY builds on RegNetX by integrating SE blocks into its architecture, which enhances performance through channel-wise attention mechanisms [50].
To obtain the most optimal RegNetX model, a series of equations are utilized that rely on various input configurations, such as Initial Width (w0), Slope Parameter (wa), Quantization Parameter (wm), Network Depth (D), Group and Bottleneck ratio (g) and (b). Below, we outline the steps to determine the RegNetX model successfully.
- Calculating Possible Widths
- Determining Possible Block Sizes (s)
- Quantizing Widths (w)
- Finding the Depth List (d)
- Validation Against Group Size (g)
- Integrating Parameters into Generic Architecture
RegNetX and RegNetY models have a primary difference, which is the use of the SE block, as shown below:
As previously mentioned, the RegNet architecture is split into two primary series: “X” and “Y”. Each series is crafted to meet specific performance and efficiency objectives in machine learning tasks. The “X” series, which includes RegNetX008 and RegNetX080 models, prioritizes speed and simplicity. Its design is straightforward, avoiding complicated operations to ensure quick and efficient performance. Meanwhile, the “Y” series, represented by RegNetY006 and RegNetY008 models, aims for higher accuracy in image recognition tasks. This series incorporates more advanced architectural elements, striving for improved outcomes on challenging datasets while balancing computational efficiency.
In the RegNet models, such as 008 and 080 for the “X” series and 006 and 008 for the “Y” series, the numbering system denotes the model’s capacity and complexity. Lower numbers indicate less complex models with a lower capacity, making them quicker and less resource-intensive [51].
RegNetX008
The term “008” in the context of RegNet refers to a network with a lower capacity. This typically means the network has fewer layers and fewer parameters or is narrower than the base RegNet configuration. RegNetX008, for instance, has eight times the number of channels in each layer compared to the base RegNet configuration. While this may result in slightly lower performance compared to more extensive networks, it is also more efficient in computation and faster in inference, making it well-suited for environments with limited resources or situations where quick responses are essential [52].
RegNetX080
This model is likely more extensive and complex than RegNetX008. The “080” suggests a higher capacity, which usually means more layers, more parameters, or a wider network overall [52].
RegNetY006
With a width multiplier of 6, this configuration has six times more channels in each layer than the base RegNetY configuration. It offers a balance between accuracy and efficiency because of its moderate width [40].
RegNetY008
RegNetY008 is a variation of RegNetY, which has a width multiplier of 8. This means that RegNetY008 has eight times more channels in each layer compared to the base RegNetY configuration. Due to its increased width, RegNetY008 potentially has a higher capacity for learning complex features than RegNetY006 [52].
EfficientNetB3, EfficientNetV2B1, RegNetX008, RegNetX080, RegNetY006, and RegNetY008 were carefully selected for their exceptional balance of efficiency, scalability, and accuracy in detecting diabetic retinopathy. These models use advanced scaling methods and a regular network design to handle the intricate details present in high-resolution retinal images that are critical for identifying subtle indicators of the disease. They are adaptable to variations in imaging conditions and capable of processing large datasets efficiently, making them the ideal choice for the high-precision task of diabetic retinopathy screening. Early detection is crucial for effective treatment planning and improving patient outcomes, and these models are well-suited to meet this critical need.
3.4. Preprocessing
To ensure that the images in our dataset were of the highest quality, we implemented a preprocessing phase. This step was crucial for standardizing the images and aligning them with the input image size used in the extraction phase. We explored various preprocessing techniques, including resizing the images to a uniform 224 × 224 pixel size. Additionally, we applied contrast adjustment techniques to enhance the image contrast. Also, we extracted the green channel from the available red, blue, and green channels. We then utilized the Contrast-Limited Adaptive Histogram Equalization (CLAHE) process to improve contrast within the green channel image at the tile level. We also employed Gaussian filtering to reduce noise and refine the images.
3.5. Network Architecture
In this study, we propose a dual-approach network architecture for diagnosing and classifying diabetic retinopathy (DR) using deep learning, leveraging six pre-trained convolutional neural networks (CNNs) from the EfficientNet and RegNet families. The architecture integrates binary and multi-class classification systems; the binary system, primarily using the RegNetX080 model, quickly determines the presence of DR, while the multi-class system, utilizing EfficientNetB3, classifies the severity of DR into one of five stages. We fine-tuned both systems on the comprehensive APTOS dataset, which includes 3662 PNG images thoroughly labeled for DR severity, and validated our models against the Saudi dataset from Al-Saif Medical Center, which consists of 168 JPEG images. To optimize performance, the output from the base network is processed through a GlobalAveragePooling2D() layer, effectively reducing dimensionality while retaining the inherent spatial structure of the features. This is followed by a Dense layer, where the activation function is specifically chosen: Sigmoid for binary classification and SoftMax for multi-class classification, enhancing diagnostic accuracy. Each custom model is meticulously compiled using the Adam optimizer, incorporating a strategic learning rate. This robust configuration ensures adaptability across diverse datasets and employs techniques such as data augmentation and cross-validation. Performance metrics including accuracy, precision, recall, and F1-Score further validate our approach, ensuring high reliability and effectiveness in clinical environments. This innovative methodology aligns seamlessly with Saudi Arabia’s Vision 2030 healthcare initiatives, paving the way for improved patient outcomes and healthcare delivery.
4. Experimental Results and Analysis
For the train, test, and validation splits, the models were generated using 70%, 20%, and 10%, respectively. The best hyperparameters were selected after numerous manual attempts with different hyperparameter settings to get the optimum performance. To guarantee that the model is trained on data similar to what is available in real life or to “let the data speak”, the real data is not balanced and is kept that way for the purposes of this study. The following six CNN models were trained: EfficientNetB3, EfficientNetV2B1, RegNetX008, RegNetX080, RegNetY006, and RegNetY008. A total of twelve trials were carried out and contrasted. In the first six experiments, the models were trained for binary classification to determine if a patient has DR or doesn’t have it. The second set of six experiments used multiclass classification to predict which of the five stages of the DR disease—NDR, mild, moderate, severe, and PDR a patient might be in.
Table 8 shows the training and testing accuracy, recall, precision, call, and F1-score for binary classification.
Table 8.
Models Performance in Binary Classification.
Table 9 shows the training and testing accuracy, precision, recall, and F1-score for multiclass classification.
Table 9.
Models Performance in Multiclass Classification.
To evaluate the precision of the anticipated results, the confusion matrices were employed. Figure 6 and Figure 7 contain the confusion matrices for the most promising models in binary and multi-class classifications. In binary classification, label 1 signifies that the patient has DR. In contrast, a label of 0 represents no DR. Similarly, in multi-class classification, DR phases are denoted by labels 0, 1, 2, 3, and 4, indicating no DR, mild, moderate, severe, and proliferative DR, respectively.
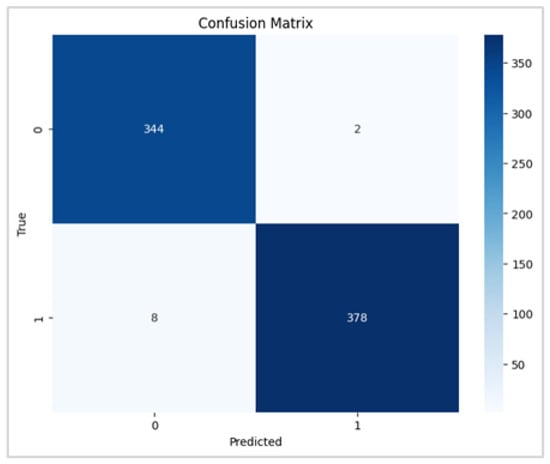
Figure 6.
RegNetX080 Binary Confusion Matrix.

Figure 7.
EfficientNetB3 Multi Confusion Matrix.
The following plots demonstrate the performance measures of the best models during training, like loss or accuracy. These plots, which are also known as “model history plots”, can provide important insights into the learning behavior of the model and assist in evaluating its efficacy. Figure 8 and Figure 9 demonstrate the model history for the binary and multi-class classification tasks.
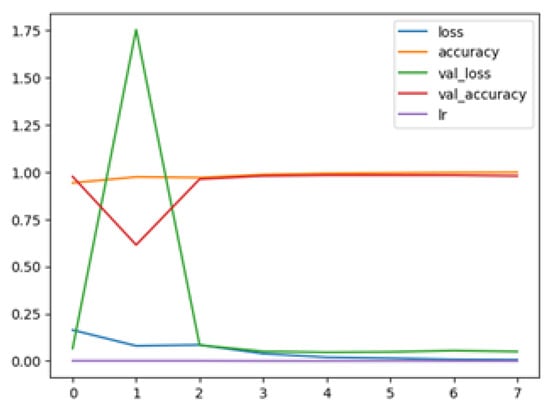
Figure 8.
RegNetX080 Binary Model History.
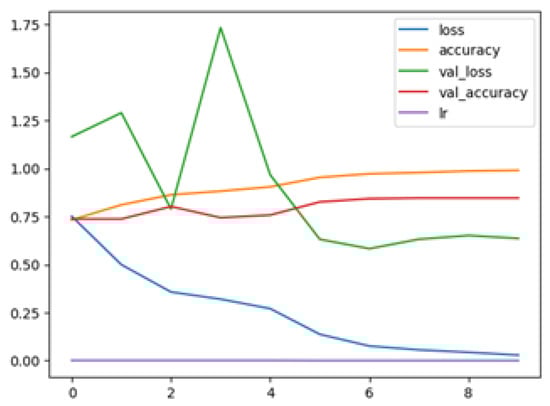
Figure 9.
EfficientNetB3 Multi Model History.
When comparing our findings to the benchmark studies, our results showed that, in terms of binary classification, the proposed model RegNetX080 performed better than the model developed in [25] achieved 81% accuracy on the APTOS dataset. Furthermore, in stage grading, the proposed model, EfficientNetB3, outperformed the model developed in [4] that achieved an accuracy of 84.1% on the APTOS dataset.
Overall, the six models performed significantly better in binary classification than in multiclass classification. Nonetheless, obtaining this outcome in a multiclass classification task with five distinct classes is regarded as a remarkable accomplishment. This is due to the fact that the more classes there are, the more difficult it is for the model to identify the patterns that separate them. RegNetX080 was the best-performing model in binary classification at 98.6% for accuracy, precision, recall, and F1-score. Furthermore, EfficientNetB3 produced the best results for multiclass classification, with an accuracy of 85.1%, precision of 84.5%, recall of 85.1%, and F1-score of 84.4%.
5. Experimental Results and Analysis of (Saudi Dataset)
This section describes our methodology and findings of utilizing the Saudi dataset to validate our models. The primary objective of conducting this experiment was to develop robust and efficient models for detecting DR using a clinical dataset from the Eastern Province of Saudi Arabia (Alsaif Medical Center) to improve our model’s heterogeneity source data performance. We used the APTOS 2019 dataset as our primary data source for our experiments. However, we also used additional data, which is the Saudi dataset. Initially, we split the APTOS dataset for the training, which is 80%,and for the testing, which is 20%.
Moreover, 100% of the Saudi dataset was used for validation, thereby using both Saudi and Aptos datasets to expand the diversity and representativeness of the evaluation process of the proposed models. Various experiments were conducted to compare the performance of six convolutional neural network (CNN) models, considering both binary and multi-class classifications. Table 10 and Table 11 illustrate the training and testing accuracy, precision, recall, and F1-score for binary and multi-class classification.
Table 10.
Models Performance in Binary Classification in Validation Phase.
Table 11.
Models Performance in Multiclass Classification in Validation Phase.
Table 10 shows the training and testing accuracy, recall, precision, call, and F1-score for binary classification.
Based on the results of binary classification, EfficientNetB3 performed exceptionally well with an accuracy rate of 98.2%. In addition, further evaluations were conducted to measure the recall, precision, and F1-score values. Remarkably, EfficientNetB3 achieved the highest precision, recall, and F1-score rates with 98.2%.
Table 11 shows the training and testing accuracy, precision, recall, and F1-score for multiclass classification.
According to the performance indicators, the six models performed better in binary classification than in multiclass classification. EfficientNetB3 was the top-performing model in binary classification, achieving an accuracy, precision, recall, and F1-score of 98.2%. On the other hand, EfficientNetV2B1 produced the best results for multiclass classification, with an accuracy and recall of 84.4%, precision of 84.3%, and F1-score of 83.9%.
While there is little difference in the models’ precision, recall, and F1-scores, EfficientNetB3 typically retains higher scores, suggesting that it may be better able to manage the subtleties across DR phases.
The consistency of the results compared to predictions was examined using confusion matrices. The confusion matrices show the forecasts produced by the models in both binary and multi-class classification. Figure 10 and Figure 11 illustrate confusion matrices for the binary and multi-class classification.

Figure 10.
EfficientNetB3 Binary Confusion Matrix.

Figure 11.
EfficientNetV2B1 Multi Confusion Matrix.
During training, model history plots depict performance measures like loss or accuracy. These plots offer beneficial understandings of the model’s learning behavior and aid in evaluating its effectiveness. Figure 12 and Figure 13 demonstrate model history plots for the binary and multi-class classification.
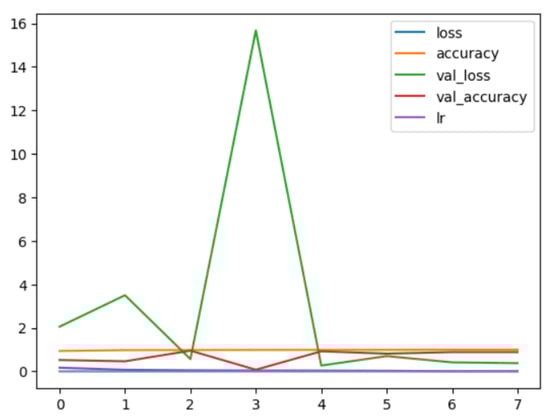
Figure 12.
EfficientNetB3 Binary Model History.
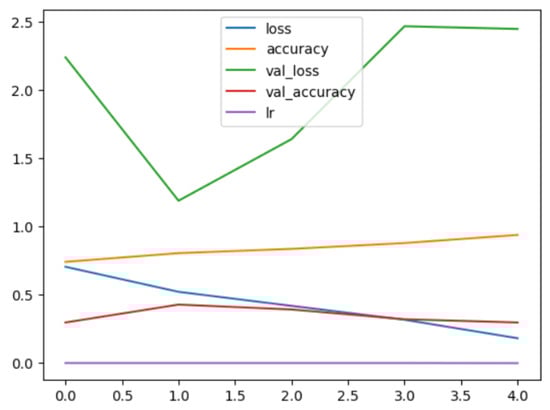
Figure 13.
EfficientNetV2B1 Multi Model History.
5.1. Evaluation Metrics
The model’s classification performance was assessed using four commonly used metrics: accuracy, precision, recall, and F-score. Accuracy gauged the accuracy of predictions in proportion to the total observations made. Precision-measured the rate of correct positive predictions from all positive predictions. Recall also referred to as sensitivity or True Positive Rate, assessed the ratio of accurately detected positive predictions to the overall number of positive observations. Lastly, the F-score calculated the harmonic mean of precision and recall, presenting a balanced metric that considered both aspects. Mathematically, the accuracy can be represented as [41].
5.1.1. Accuracy
In machine learning, accuracy is referred to as a ratio of correctly predicted instances to total number of predictions made.
Mathematically, the precision, recall, and F1-score can be represented as [43].
5.1.2. Precision, Recall, and F1-Score
Precision is a measure of how frequently the positive class is accurately predicted by a machine learning model.
The frequency with which a machine learning model properly detects positive instances (true positives) out of all the actual positive samples in the dataset is known as recall or sensitivity.
An essential indicator for assessing a machine learning model’s performance is the F1-score. Precision and recall are combined in this statistic. Data scientists can more easily explain the performance of their models to stakeholders thanks to the F1-score, which streamlines the evaluation process.
5.2. Optimization Strategy
Optimizers are crucial in solving optimization problems, especially in neural networks. They work by minimizing the loss function, which guides the optimizer towards the global minimum, similar to descending into a valley. For this study, we use an Adam optimizer with a learning rate of 0.001, and the chosen loss function is ‘categorical_crossentropy’, a commonly used metric for multi-class classification problems. The model’s performance is evaluated using the ‘accuracy’ metric, which measures the fraction of correctly classified samples. To enhance model performance, several training strategies are implemented. Early stopping is employed to prevent overfitting, with parameters set to monitor validation loss, a min_delta (minimum change threshold) with 0.0001, a patience of 3 epochs, and a verbose set to 1. ModelCheckpoint ensures that only the best-performing model is saved by specifying the filename as ‘best_model.h5’ and setting ‘save_best_only’ to True. Additionally, ReduceLROnPlateau adjusts the learning rate dynamically based on validation loss. Its parameters include monitoring validation loss, a min_delta of 0.0004, patience of 2, a factor of 0.1, a min_lr (minimum learning rate) of , a mode of ‘auto’, and verbose set to 1.
5.3. Discussion
The proposed approach effectively utilizes deep learning techniques for the detection of diabetic retinopathy, successfully tackling both binary and multi-class classification challenges. These methods show impressive accuracy and other crucial performance metrics compared to state-of-the-art techniques using the same dataset. This highlights the potential contribution of the study to the healthcare sector, particularly in alignment with Saudi Arabia’s Vision 2030, which primarily focuses on improving the wellbeing of the population.
Regarding the potential limitations of the study, it primarily relies on the APTOS dataset, which is comprehensive and has been the focus of several state-of-the-art studies. Additionally, we used the Saudi dataset solely for validation purposes. To enhance the generalizability of the findings, it is recommended to explore a more diverse dataset by incorporating more public datasets such as EyePACS and/or IDRiDby by using data augmentation techniques, which can help in building more robust and generalized models [53].
Furthermore, the study is missing an interpretability framework, such as heatmaps or attention maps, which would enable clinicians to identify the critical regions the model focuses on during diabetic retinopathy (DR) diagnosis. By integrating such interpretability methods, we can foster greater trust in AI models, especially in the crucial realm of medical diagnosis. Additionally, this study has overlooked important security considerations in the development and deployment of the proposed models [54]. Moving forward, it is essential to explore federated learning and other secure models and architectures to enhance the safety and integrity of healthcare systems [55,56,57].
To showcase the economic viability of the proposed system, it is essential to leverage robust computational resources, particularly advanced graphical processing units (GPUs), during the model training phase. Additionally, clinics and healthcare centers will need to install compatible hardware and software. Once implemented, the system facilitates convenient operation through smartphone apps, allowing doctors to effortlessly upload retinal images. These images are then transmitted to a back-end server where the model is integrated, ensuring a swift analysis. In a matter of moments, the model diagnoses the image and relays the results back to the doctor, maintaining an efficient response time. The prototype has already been developed and rigorously tested in collaboration with the doctors at the College of Medicine at the university, demonstrating its effectiveness in a clinical setting.
6. Conclusions and Future Work
In this paper, we present an innovative approach using deep learning models to effectively identify and categorize distinct stages of diabetic retinopathy through individual retinal images, utilizing both binary and multi-class classification techniques. Our method incorporates six advanced pre-trained convolutional neural networks (CNNs): EfficientNetB3, EfficientNetV2B1, RegNetX008, RegNetX080, RegNetY006, and RegNetY008. These models have been rigorously trained and evaluated with various fundus images obtained from the publicly available APTOS dataset. A key strength of our research lies in the meticulous selection and curation of our validation dataset, which includes additional data from a well-established medical institution in Saudi Arabia. By combining data from different sources, we significantly enhanced our model’s performance. The integration of the APTOS dataset with the Saudi dataset has led to a notable improvement in our results. Our method has demonstrated exceptional performance across a comprehensive set of evaluation metrics. We have also applied various optimization techniques to reinforce the model’s robustness and generalizability. Looking ahead, future research should embrace the exploration of alternative datasets to further strengthen the model’s capabilities across varied populations. Additionally, there is significant potential in advancing preprocessing techniques, refining hyperparameter tuning, and incorporating additional modalities to boost the accuracy of diabetic retinopathy diagnosis. Our findings suggest that the developed model can play a pivotal role in enhancing clinical decision-making related to diabetic retinopathy diagnosis. Furthermore, the versatility of our approach opens doors to addressing a broader spectrum of medical imaging challenges beyond diabetic retinopathy and other eye conditions, paving the way for transformative future research.
Author Contributions
Conceptualization, M.Y. and A.R.; Data curation, M.A. (Manar Alsayed) and N.A.; Formal analysis, G.A.; Methodology, M.A. (Manar Alsayed), A.S., J.A. and M.A. (Mona Alqahtani); Resources, M.Y.; Software, M.A. (Manar Alsayed), A.S., N.A., G.A. and M.A. (Mona Alqahtani); Supervision, M.Y. and A.R.; Validation, J.A.; Writing—original draft, A.S., J.A., N.A., G.A. and M.A. (Mona Alqahtani); Writing—review & editing, A.R. All authors have read and agreed to the published version of the manuscript.
Funding
This research received no external funding.
Institutional Review Board Statement
Not applicable.
Informed Consent Statement
Not applicable.
Data Availability Statement
Data is available at Kaggle, a public repository: https://www.kaggle.com/c/aptos2019-blindness-detection.
Acknowledgments
We would like to express our sincere gratitude to Wadha Almattar for her valuable assessment and feedback on this work. Additionally, we thank Hammam Abdullah Alotaibi for his expertise and assistance with the medical images used in this study.
Conflicts of Interest
The authors declare no conflicts of interest.
References
- Diabetes. (n.d.). Available online: https://www.who.int/news-room/fact-sheets/detail/diabetes (accessed on 1 December 2023).
- Gelcho, G.N.; Gari, F.S. Time to Diabetic Retinopathy and Its Risk Factors among Diabetes Mellitus Patients in Jimma University Medical Center, Jimma, Southwest Ethiopia. Ethiop. J. Health Sci. 2022, 32, 937–946. [Google Scholar] [CrossRef] [PubMed]
- Diabetic Retinopathy|National Eye Institute. Available online: https://www.nei.nih.gov/learn-about-eye-health/eye-conditions-and-diseases/diabetic-retinopathy (accessed on 9 October 2023).
- Basheer Ahmed, M.I. Early detection of Diabetic Retinopathy utilizing advanced fuzzy logic techniques. Math. Model. Eng. Probl. 2023, 10, 2086–2094. [Google Scholar] [CrossRef]
- Zheng, Y.; He, M.; Congdon, N. The worldwide epidemic of diabetic retinopathy. Indian J. Ophthalmol. 2012, 60, 428–431. [Google Scholar] [CrossRef] [PubMed]
- APTOS 2019 Blindness Detection | Kaggle. (n.d.). Available online: https://www.kaggle.com/c/aptos2019-blindness-detection (accessed on 6 December 2023).
- Rehman, A.; Athar, A.; Khan, M.A.; Abbas, S.; Fatima, A.; Rahman, A.; Saeed, A. Modelling, simulation, and optimization of diabetes type II prediction using deep extreme learning machine. J. Ambient. Intell. Smart Environ. 2020, 12, 125–138. [Google Scholar] [CrossRef]
- Robert, A.A.; Al Dawish, M.A.; Braham, R.; Musallam, M.A.; Al Hayek, A.A.; Al Kahtany, N.H. Type 2 Diabetes Mellitus in Saudi Arabia: Major Challenges and Possible Solutions. Curr. Diabetes Rev. 2017, 13, 59–64. [Google Scholar] [CrossRef] [PubMed]
- Al-Shehri, A.M.; Aldihan, K.A.; Aljohani, S. Reasons for the Late Presentation of Diabetic Retinopathy in Saudi Arabia: A Survey of Patients Who Presented with Advanced Proliferative Diabetic Retinopathy to a Tertiary Eye Hospital. Clin. Ophthalmol. 2022, 16, 4323–4333. [Google Scholar] [CrossRef] [PubMed]
- Morales-Brown, L. What Are the Different Stages of Diabetic Retinopathy? Available online: https://www.medicalnewstoday.com/articles/diabetic-retinopathy-stages#stage-4 (accessed on 1 February 2023).
- What Is a Comprehensive Dilated Eye Exam?—Cameron NC|Northgate Eye Center OD, PA. Available online: https://northgateeye.com/2016/04/23/what-is-a-comprehensive-dilated-eye-exam/ (accessed on 23 April 2016).
- Ruia, S.; Tripathy, K. Fluorescein Angiography. In StatPearls [Internet]; StatPearls Publishing: Treasure Island, FL, USA, 2024. Available online: https://www.ncbi.nlm.nih.gov/books/NBK576378/ (accessed on 25 August 2023).
- Tey, K.Y.; Teo, K.; Tan, A.C.S.; Devarajan, K.; Tan, B.; Tan, J.; Schmetterer, L.; Ang, M. Optical coherence tomography angiography in diabetic retinopathy: A review of current applications. Eye Vis. 2019, 6, 37. [Google Scholar] [CrossRef] [PubMed]
- FuNDus Photography Overview—Ophthalmic Photographers’ Society. Available online: https://www.opsweb.org/page/fundusphotography (accessed on 22 January 2024).
- Alyoubi, W.L.; Abulkhair, M.F.; Shalash, W.M. Diabetic Retinopathy Fundus Image Classification and Lesions Localization System Using Deep Learning. Sensors 2021, 21, 3704. [Google Scholar] [CrossRef] [PubMed]
- Zeng, X.; Chen, H.; Luo, Y.; Ye, W. Automated Diabetic Retinopathy Detection Based on Binocular Siamese-like Convolutional Neural Network. IEEE Access 2019, 7, 30744–30753. [Google Scholar] [CrossRef]
- Voets, M.; Møllersen, K.; Bongo, L.A. Reproduction study using public data of: Development and validation of a deep learning algorithm for detection of diabetic retinopathy in retinal fundus photographs. PLoS ONE 2019, 14, e0217541. [Google Scholar] [CrossRef]
- Chetoui, M.; Akhloufi, M.A. Explainable end-to-end deep learning for diabetic retinopathy detection across multiple datasets. J. Med. Imaging 2020, 7, 044503. [Google Scholar] [CrossRef]
- Zong, Y.; Chen, J.; Yang, L.; Tao, S.; Aoma, C.; Zhao, J.; Wang, S.-H. U-net Based Method for Automatic Hard Exudates Segmentation in Fundus Images Using Inception Module and Residual Connection. IEEE Access 2020, 8, 167225–167235. [Google Scholar] [CrossRef]
- Abdelsalam, M.M.; Zahran, M.A. A Novel Approach of Diabetic Retinopathy Early Detection Based on Multifractal Geometry Analysis for OCTA Macular Images Using Support Vector Machine. IEEE Access 2021, 9, 22844–22858. [Google Scholar] [CrossRef]
- Maqsood, S.; Damaševičius, R.; Maskeliūnas, R. Hemorrhage Detection Based on 3D CNN Deep Learning Framework and Feature Fusion for Evaluating Retinal Abnormality in Diabetic Patients. Sensors 2021, 21, 3865. [Google Scholar] [CrossRef] [PubMed]
- Ayala, A.; Ortiz Figueroa, T.; Fernandes, B.; Cruz, F. Diabetic Retinopathy Improved Detection Using Deep Learning. Appl. Sci. 2021, 11, 11970. [Google Scholar] [CrossRef]
- Maaliw, R.R.; Mabunga, Z.P.; Veluz, M.R.; Alon, A.S.; Lagman, A.C.; García, M.B.; Lacatan, L.L.; Dellosa, R.M. An Enhanced Segmentation and Deep Learning Architecture for Early Diabetic Retinopathy Detection. In Proceedings of the 2023 IEEE 13th Annual Computing and Communication Workshop and Conference (CCWC), Las Vegas, NV, USA, 8–11 March 2023; pp. 0168–0175. [Google Scholar] [CrossRef]
- Rahman, A.; Youldash, M.; Alshammari, G.; Sebiany, A.; Alzayat, J.; Alsayed, M.; Alqahtani, M.; Aljishi, N. Diabetic retinopathy detection: A hybrid intelligent approach. Comput. Mater. Contin. 2024, 8, 4561–4576. [Google Scholar] [CrossRef]
- Gao, Z.; Li, J.; Guo, J.; Chen, Y.; Yi, Z.; Zhong, J. Diagnosis of Diabetic Retinopathy Using Deep Neural Networks. IEEE Access 2019, 7, 3360–3370. [Google Scholar] [CrossRef]
- Qummar, S.; Khan, F.G.; Shah, S.; Khan, A.; Shamshirband, S.; Rehman, Z.U.; Khan, I.A.; Jadoon, W. A Deep Learning Ensemble Approach for Diabetic Retinopathy Detection. IEEE Access 2019, 7, 150530–150539. [Google Scholar] [CrossRef]
- Kalyani, G.; Janakiramaiah, B.; Karuna, A.; Prasad, L.V.N. Diabetic retinopathy detection and classification using capsule networks. Complex Intell. Syst. 2023, 9, 2651–2664. [Google Scholar] [CrossRef]
- Khan, Z.; Khan, F.G.; Khan, A.; Rehman, Z.U.; Shah, S.; Qummar, S.; Ali, F.; Pack, S. Diabetic Retinopathy Detection Using VGG-NIN a Deep Learning Architecture. IEEE Access 2021, 9, 61408–61416. [Google Scholar] [CrossRef]
- Bhardwaj, C.; Jain, S.; Sood, M. Deep Learning-Based Diabetic Retinopathy Severity Grading System Employing Quadrant Ensemble Model. J. Digit. Imaging 2021, 34, 440–457. [Google Scholar] [CrossRef] [PubMed]
- Jagan Mohan, N.; Murugan, R.; Goel, T.; Mirjalili, S.; Roy, P. A novel four-step feature selection technique for diabetic retinopathy grading. Phys. Eng. Sci. Med. 2021, 44, 351–1366. [Google Scholar] [CrossRef] [PubMed]
- Raja Sarobin, M.V.; Panjanathan, R. Diabetic Retinopathy Classification Using CNN and Hybrid Deep Convolutional Neural Networks. Symmetry 2022, 14, 1932. [Google Scholar] [CrossRef]
- Adak, C.; Member, S.; Karkera, T.; Chattopadhyay, S.; Saqib, M. Detecting severity of Diabetic Retinopathy from fundus images: A transformer network-based review. Neurocomputing 2024, 597, 127991. [Google Scholar] [CrossRef]
- Zeng, X.; Chen, H.; Luo, Y.; Ye, W. Automated Detection of Diabetic Retinopathy using a Binocular Siamese-like Convolutional Network. In Proceedings of the 2019 IEEE International Symposium on Circuits and Systems (ISCAS), Sapporo, Japan, 26–29 May 2019; pp. 1–5. [Google Scholar] [CrossRef]
- Jena, P.K.; Khuntia, B.; Palai, C.; Nayak, M.; Mishra, T.K.; Mohanty, S.N. A Novel Approach for Diabetic Retinopathy Screening Using Asymmetric Deep Learning Features. Big Data Cogn. Comput. 2023, 7, 25. [Google Scholar] [CrossRef]
- Usman, T.M.; Saheed, Y.K.; Ignace, D.; Nsang, A. Diabetic retinopathy detection using principal component analysis multi-label feature extraction and classification. Int. J. Cogn. Comput. Eng. 2023, 4, 78–88. [Google Scholar] [CrossRef]
- Ali, G.; Dastgir, A.; Iqbal, M.W.; Anwar, M.; Faheem, M. A Hybrid Convolutional Neural Network Model for Automatic Diabetic Retinopathy Classification From Fundus Images. IEEE J. Transl. Eng. Health Med. 2023, 11, 341–350. [Google Scholar] [CrossRef]
- Manjula, J.; Radharani, S.; Rao, N.H.; Madhulika, Y. An Ensemble Classification Techniques Based On ‘Ml’ Model For Automatic Diabetic Retinopathy Detection. Turk. Online J. Qual. Inq. 2021, 12. Available online: https://www.tojqi.net/index.php/journal/article/view/870 (accessed on 10 January 2024).
- Alwakid, G.; Gouda, W.; Humayun, M.; Jhanjhi, N.Z. Deep Learning-enhanced diabetic retinopathy image classification. Digit. Health 2023, 9, 20552076231194942. [Google Scholar] [CrossRef]
- Kumari, A.A.; Bhagat, A.; Henge, S.K.; Mandal, S.K. Automated Decision Making ResNet Feed-Forward Neural Network based Methodology for Diabetic Retinopathy Detection. Int. J. Adv. Comput. Sci. Appl. 2023, 14, 303–314. [Google Scholar] [CrossRef]
- Yaqoob, M.K.; Ali, S.F.; Bilal, M.; Hanif, M.S.; Al-Saggaf, U.M. ResNet Based Deep Features and Random Forest Classifier for Diabetic Retinopathy Detection. Sensors 2021, 21, 3883. [Google Scholar] [CrossRef] [PubMed]
- Novitasari, D.C.R.; Fatmawati, F.; Hendradi, R.; Rohayani, H.; Nariswari, R.; Arnita, A.; Primadewi, A. Image Fundus Classification System for Diabetic Retinopathy Stage Detection Using Hybrid CNN-DELM. Big Data Cogn. Comput. 2022, 6, 146. [Google Scholar] [CrossRef]
- Alhaidari, F.; Almotiri, S.H.; Ghamdi, M.A.; Khan, M.A.; Rehman, A.; Abbas, S.; Khan, K.M.; Rahman, A.U. Intelligent software-defined network for cognitive routing optimization using deep extreme learning machine approach. Comput. Mater. Contin. 2021, 67, 1269–1285. [Google Scholar] [CrossRef]
- Shakibania, H.; Raoufi, S.; Pourafkham, B.; Khotanlou, H.; Mansoorizadeh, M. Dual Branch Deep Learning Network for Detection and Stage Grading of Diabetic Retinopathy. Aug. 2023. Available online: http://arxiv.org/abs/2308.09945 (accessed on 9 October 2023).
- Lee, A. What Is a Pretrained AI Model? NVIDIA Blog, Dec. 08. 2022. Available online: https://blogs.nvidia.com/blog/what-is-a-pretrained-ai-model/ (accessed on 12 January 2024).
- Tan, M.; Le, Q.V. EfficientNet: Rethinking Model Scaling for Convolutional Neural Networks, arXiv.org. 2020. Available online: https://arxiv.org/abs/1905.11946 (accessed on 5 March 2024).
- Tan, M.; Le, Q.V. EFFICIENTNETV2: Smaller Models and Faster Training, arXiv.org. 2021. Available online: https://arxiv.org/abs/2104.00298 (accessed on 5 March 2024).
- Alnuaimi, M.M.; Alqahtani, N.S.; Gollapalli, M.; Rahman, A.; Alahmadi, A. A Deep Learning Approach to Industrial Corrosion Detection. Comput. Model. Eng. Sci. 2024, 141, 2609–2623. [Google Scholar]
- Radosavovic, I.; Kosaraju, R.P.; Girshick, G.; He, K.; Dollár, P. Designing Network Design Spaces. In Proceedings of the 2020 IEEE/CVF Conference on Computer Vision and Pattern Recognition (CVPR), Seattle, WA, USA, 13–19 June 2020; pp. 10425–10433. [Google Scholar] [CrossRef]
- Shreejal, T. Simple, Powerful, and Fast—RegNet Architecture from Facebook AI. Available online: https://medium.com/visionwizard/simple-powerful-and-fast-regnet-architecture-from-facebook-ai-research-6bbc8818fb44 (accessed on 19 March 2024).
- RegNet. Available online: https://huggingface.co/docs/transformers/model_doc/regnet (accessed on 19 March 2024).
- Ahmed, M.I.B.; Saraireh, L.; Rahman, A.; Al-Qarawi, S.; Mhran, A.; Al-Jalaoud, J.; Al-Mudaifer, D.; Al-Haidar, F.; AlKhulaifi, D.; Youldash, M.; et al. Personal Protective Equipment Detection: A Deep-Learning-Based Sustainable Approach. Sustainability 2023, 15, 13990. [Google Scholar] [CrossRef]
- Ahmed, M.S.; Rahman, A.; AlGhamdi, F.; AlDakheel, S.; Hakami, H.; AlJumah, A.; AlIbrahim, Z.; Youldash, M.; Alam Khan, M.A.; Basheer Ahmed, M.I. Joint Diagnosis of Pneumonia, COVID-19, and Tuberculosis from Chest X-ray Images: A Deep Learning Approach. Diagnostics 2023, 13, 2562. [Google Scholar] [CrossRef] [PubMed]
- Gollapalli, M.; Rahman, A.; Kudos, S.A.; Foula, M.S.; Alkhalifa, A.M.; Albisher, H.M.; Al-Hariri, M.T.; Mohammad, N. Appendicitis Diagnosis: Ensemble Machine Learning and Explainable Artificial Intelligence-Based Comprehensive Approach. Big Data Cogn. Comput. 2024, 8, 108. [Google Scholar] [CrossRef]
- Mozaffari-Kermani, M.; Sur-Kolay, S.; Raghunathan, A.; Jha, N.K. Systematic Poisoning Attacks on and Defenses for Machine Learning in Healthcare. IEEE J. Biomed. Health Inform. 2015, 19, 1893–1905. [Google Scholar] [CrossRef] [PubMed]
- Hu, Y.; Kuang, W.; Qin, Z.; Li, K.; Zhang, J.; Gao, Y.; Li, W.; Li, K. Artificial Intelligence Security: Threats and Countermeasures. ACM Comput. Surv. 2021, 55, 20. [Google Scholar] [CrossRef]
- Lv, Z.; Qiao, L.; Kumar Singh, A.; Wang, Q. AI-empowered IoT Security for Smart Cities. ACM Trans. Internet Technol. 2021, 21, 99. [Google Scholar] [CrossRef]
- Khan, T.A.; Fatima, A.; Shahzad, T.; Rahman, A.U.; Alissa, K.; Ghazal, T.M.; Al-Sakhnini, M.M.; Abbas, S.; Khan, M.A.; Ahmed, A. Secure IoMT for Disease Prediction Empowered With Transfer Learning in Healthcare 5.0, the Concept and Case Study. IEEE Access 2023, 11, 39418–39430. [Google Scholar] [CrossRef]

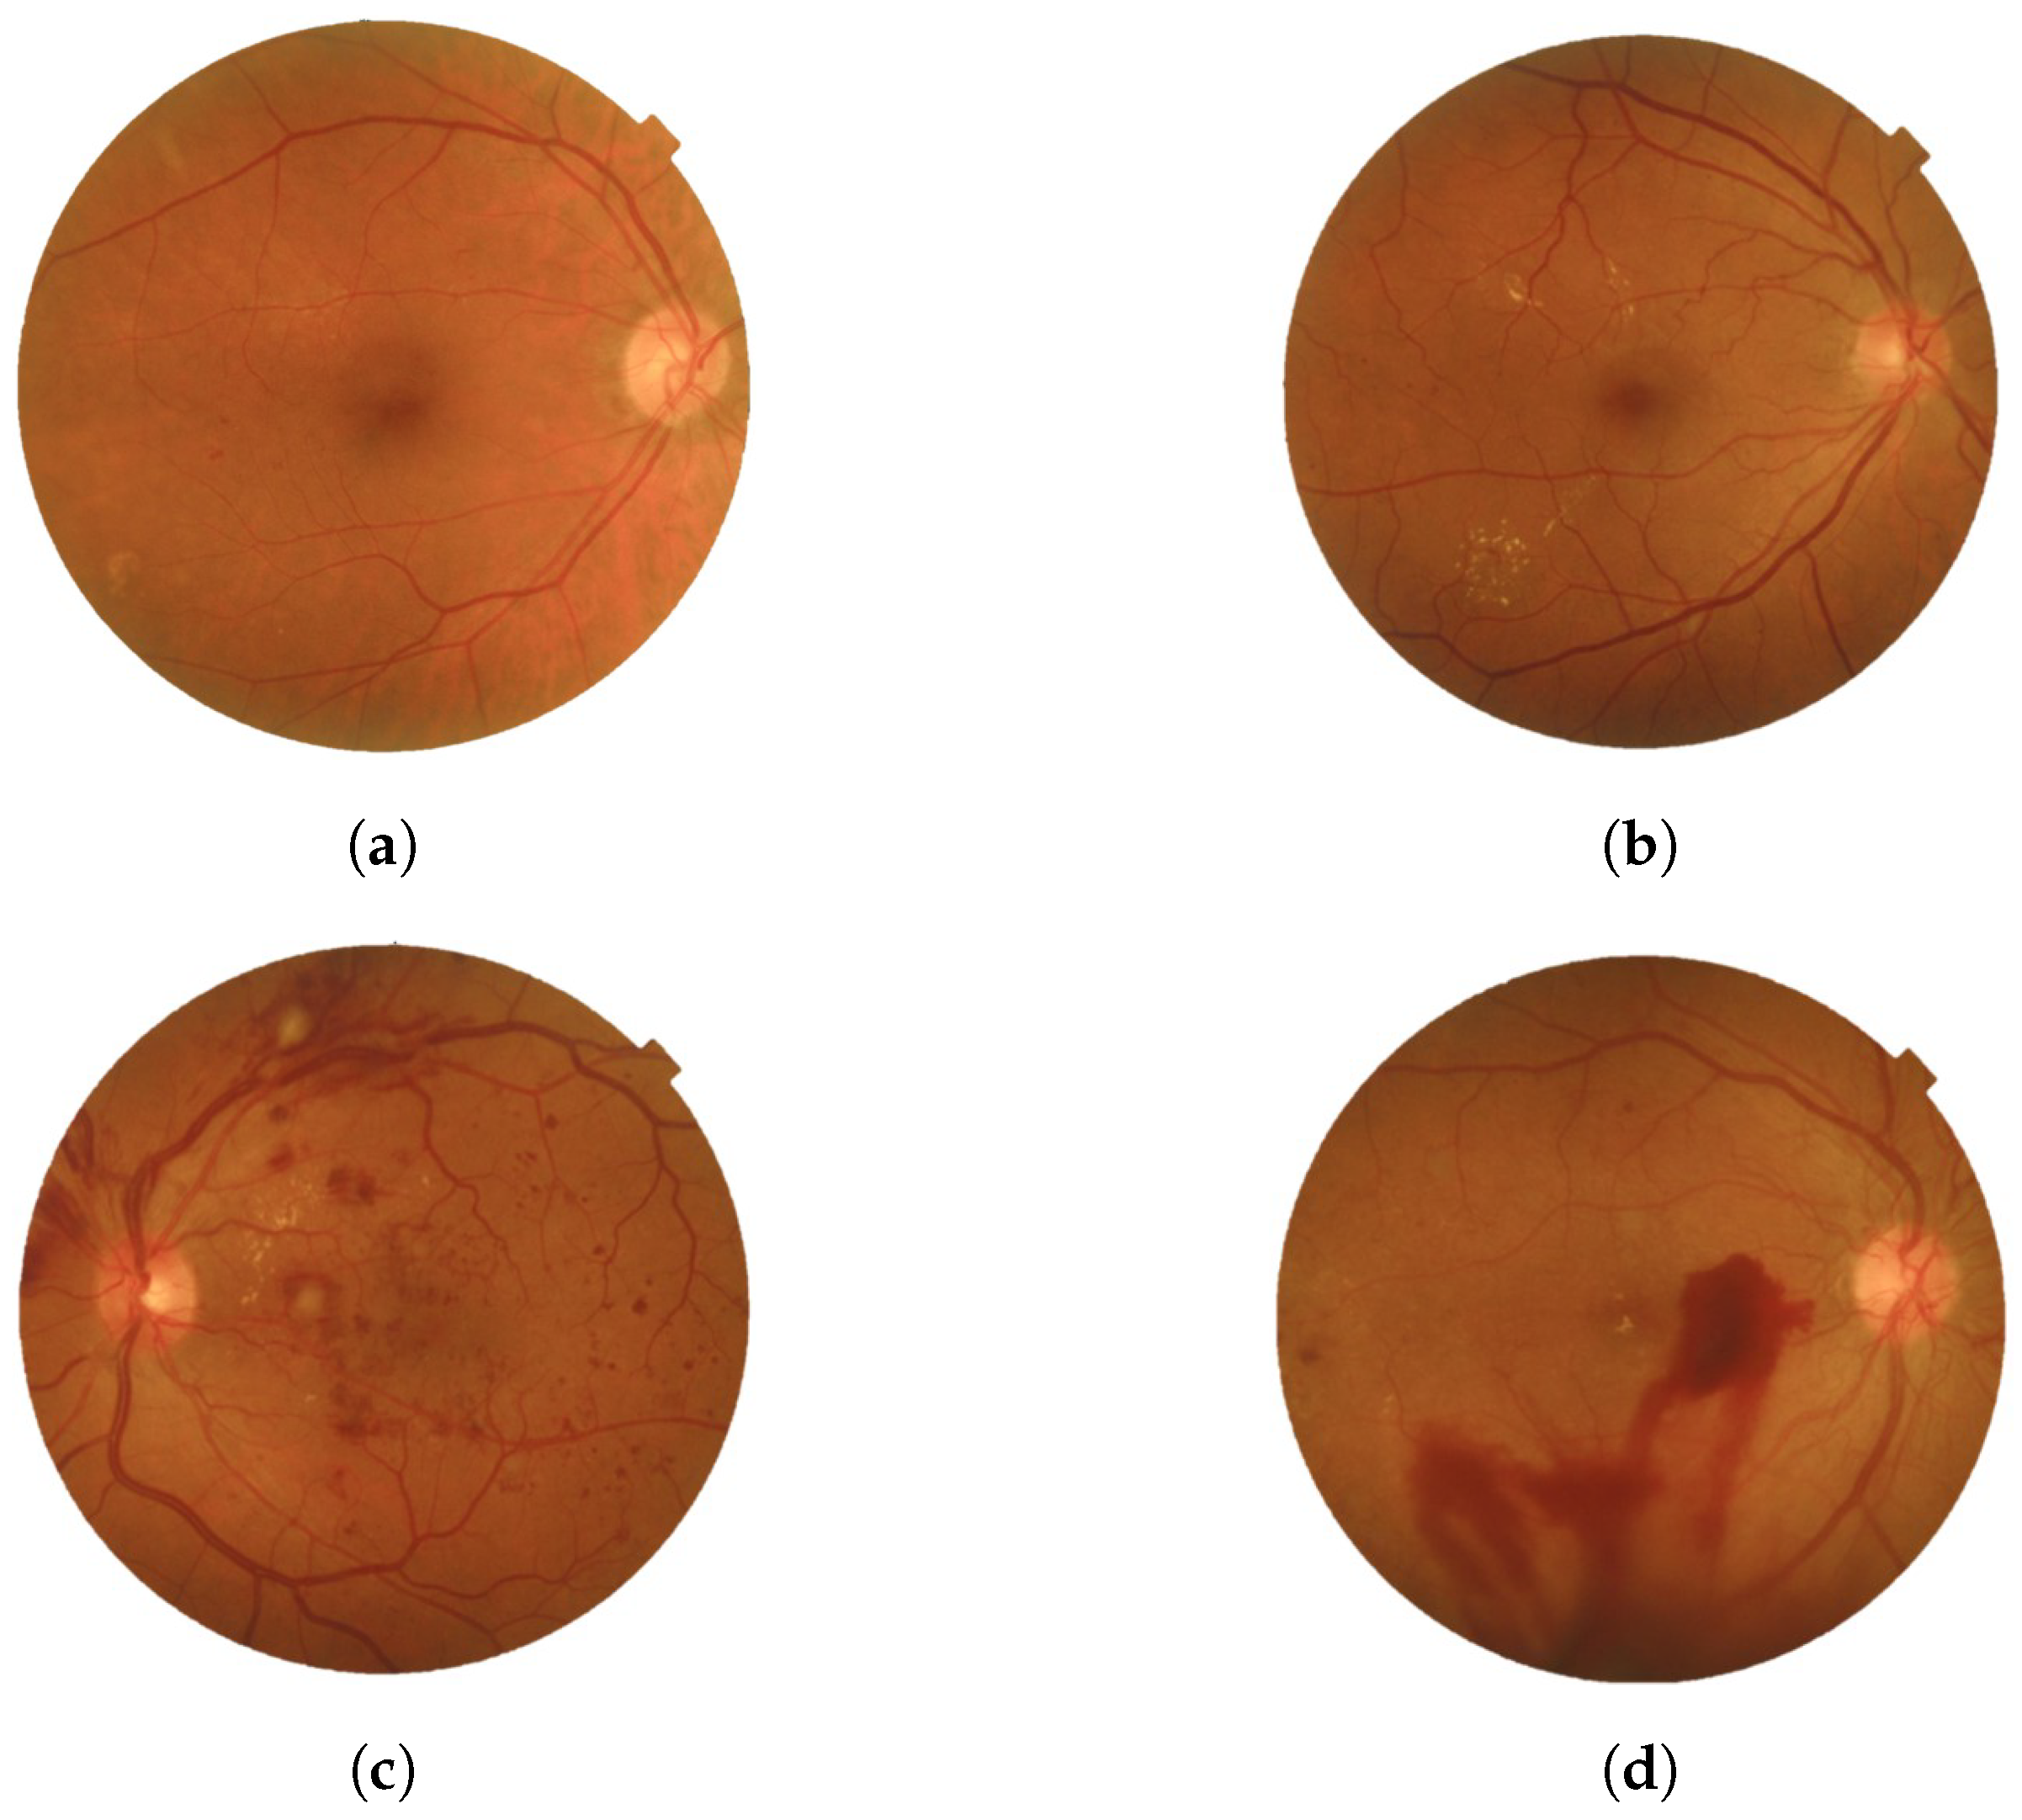
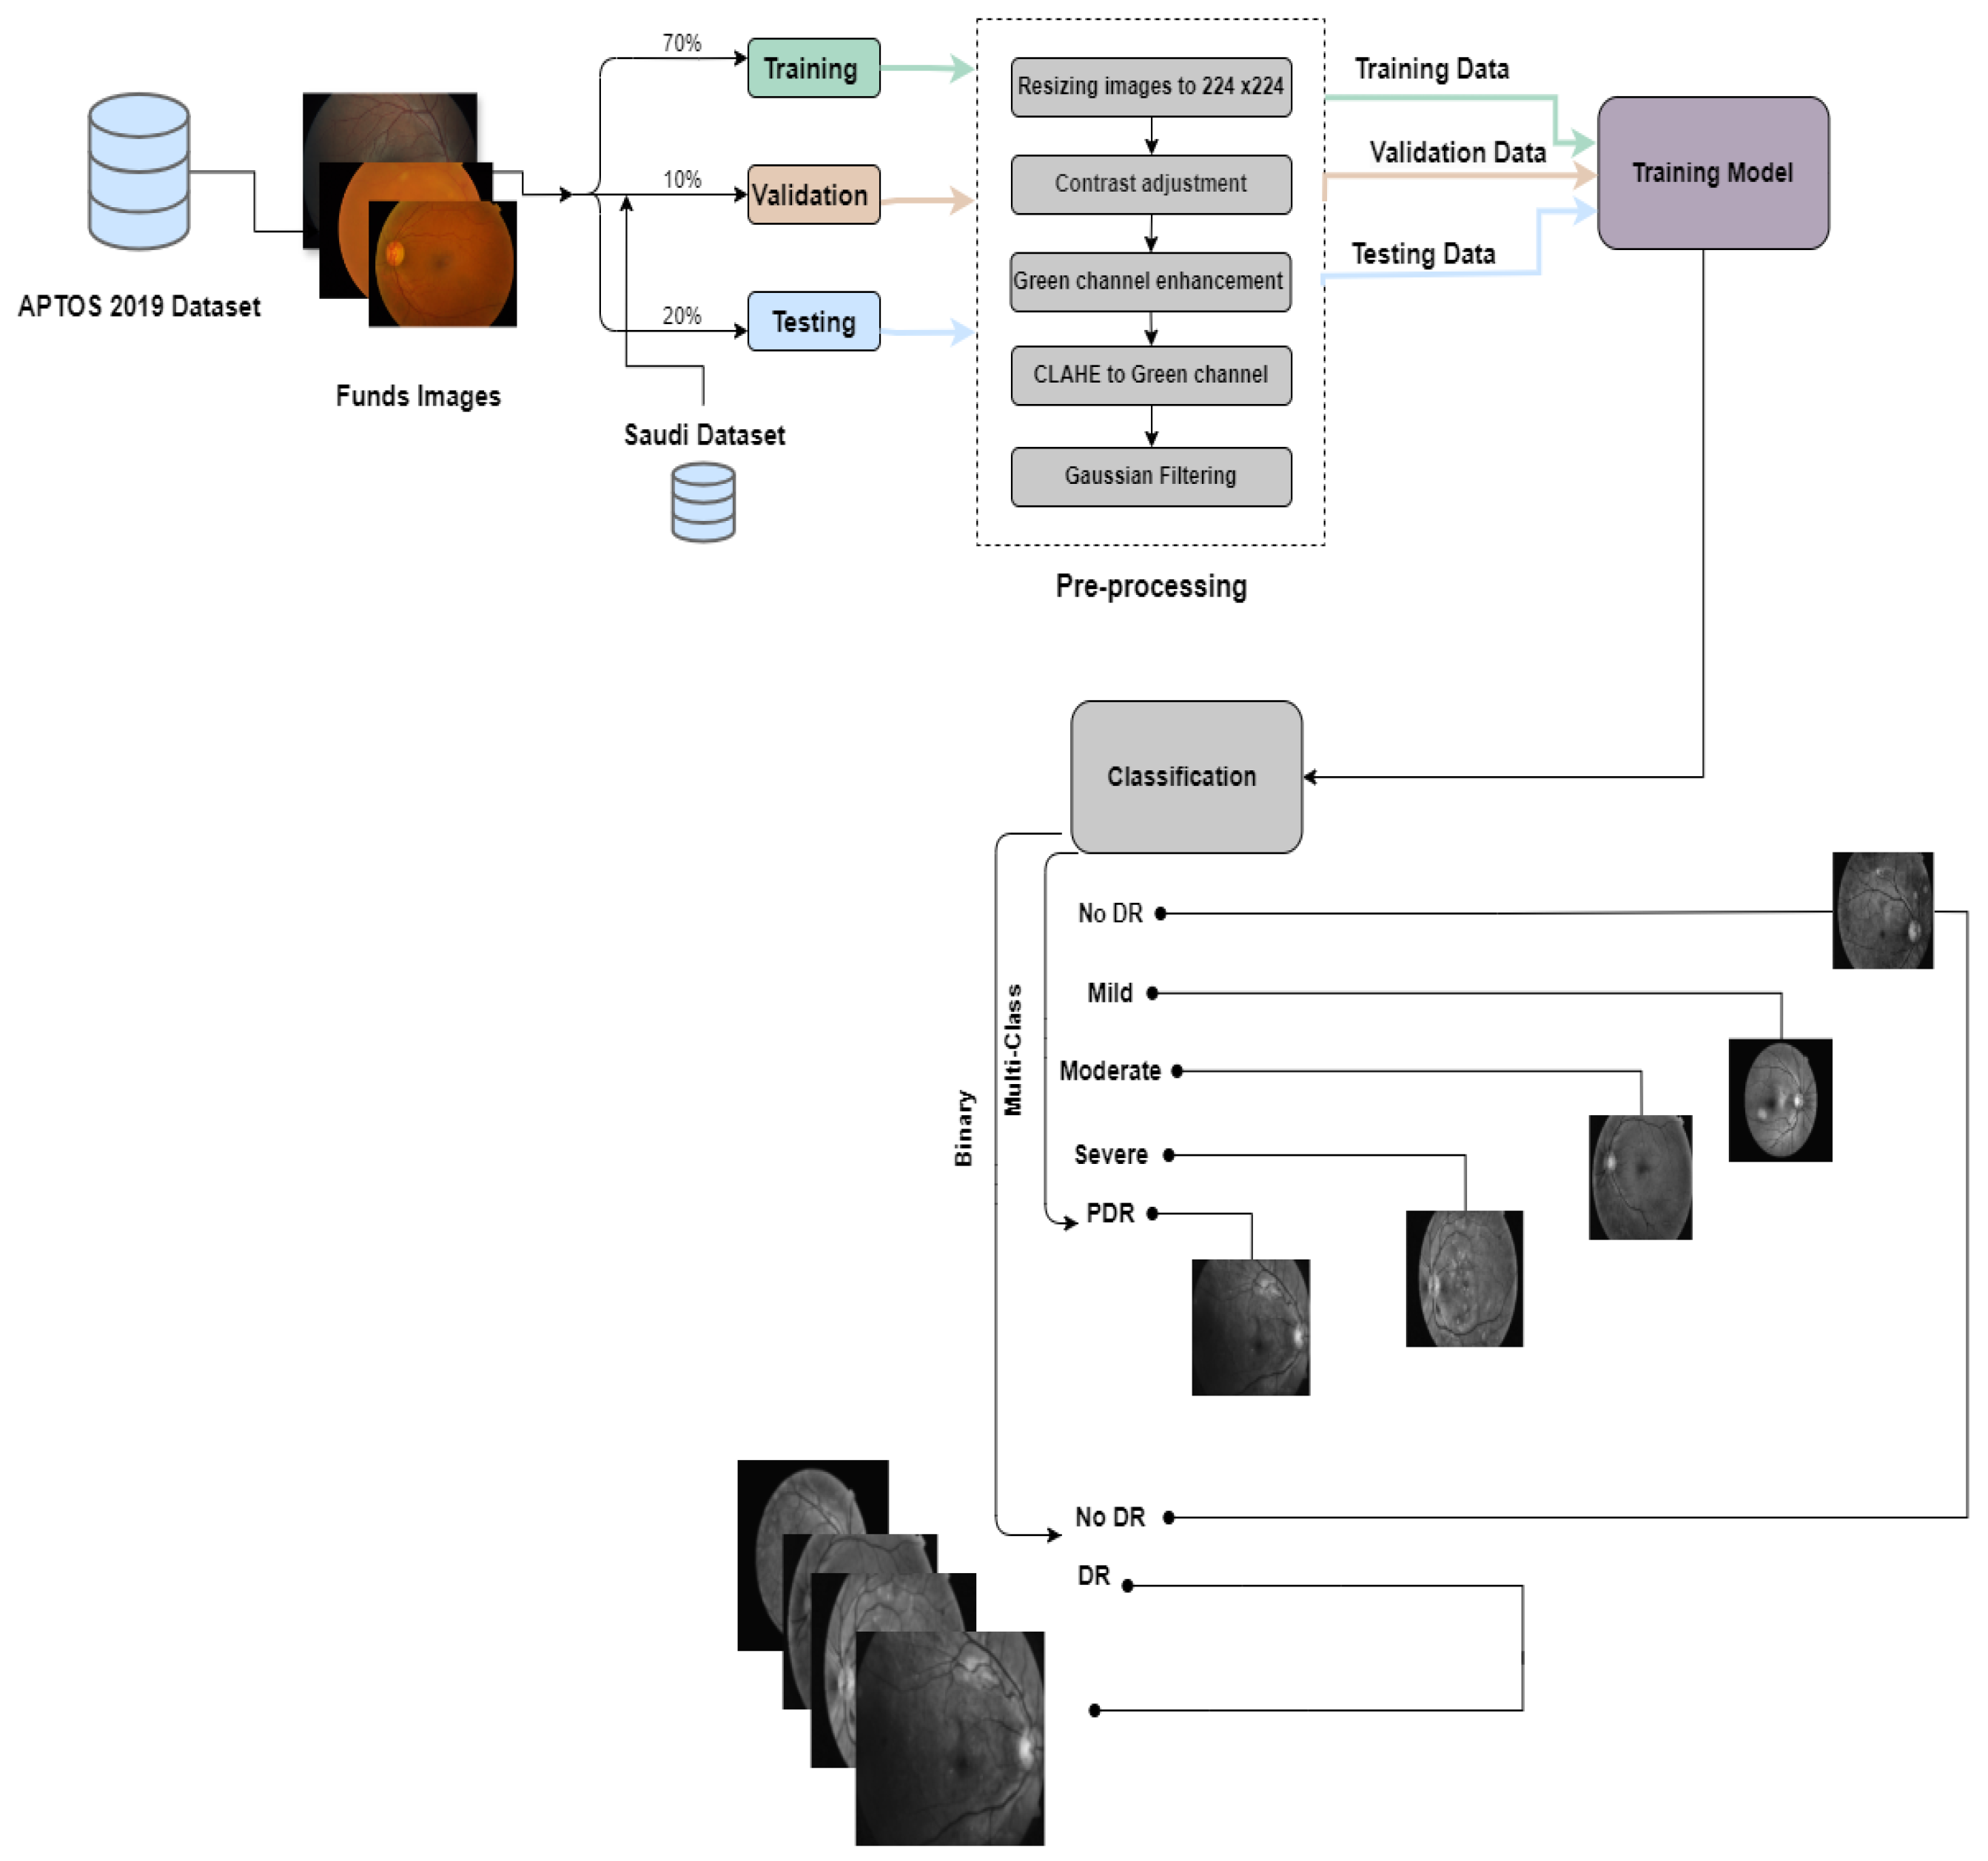
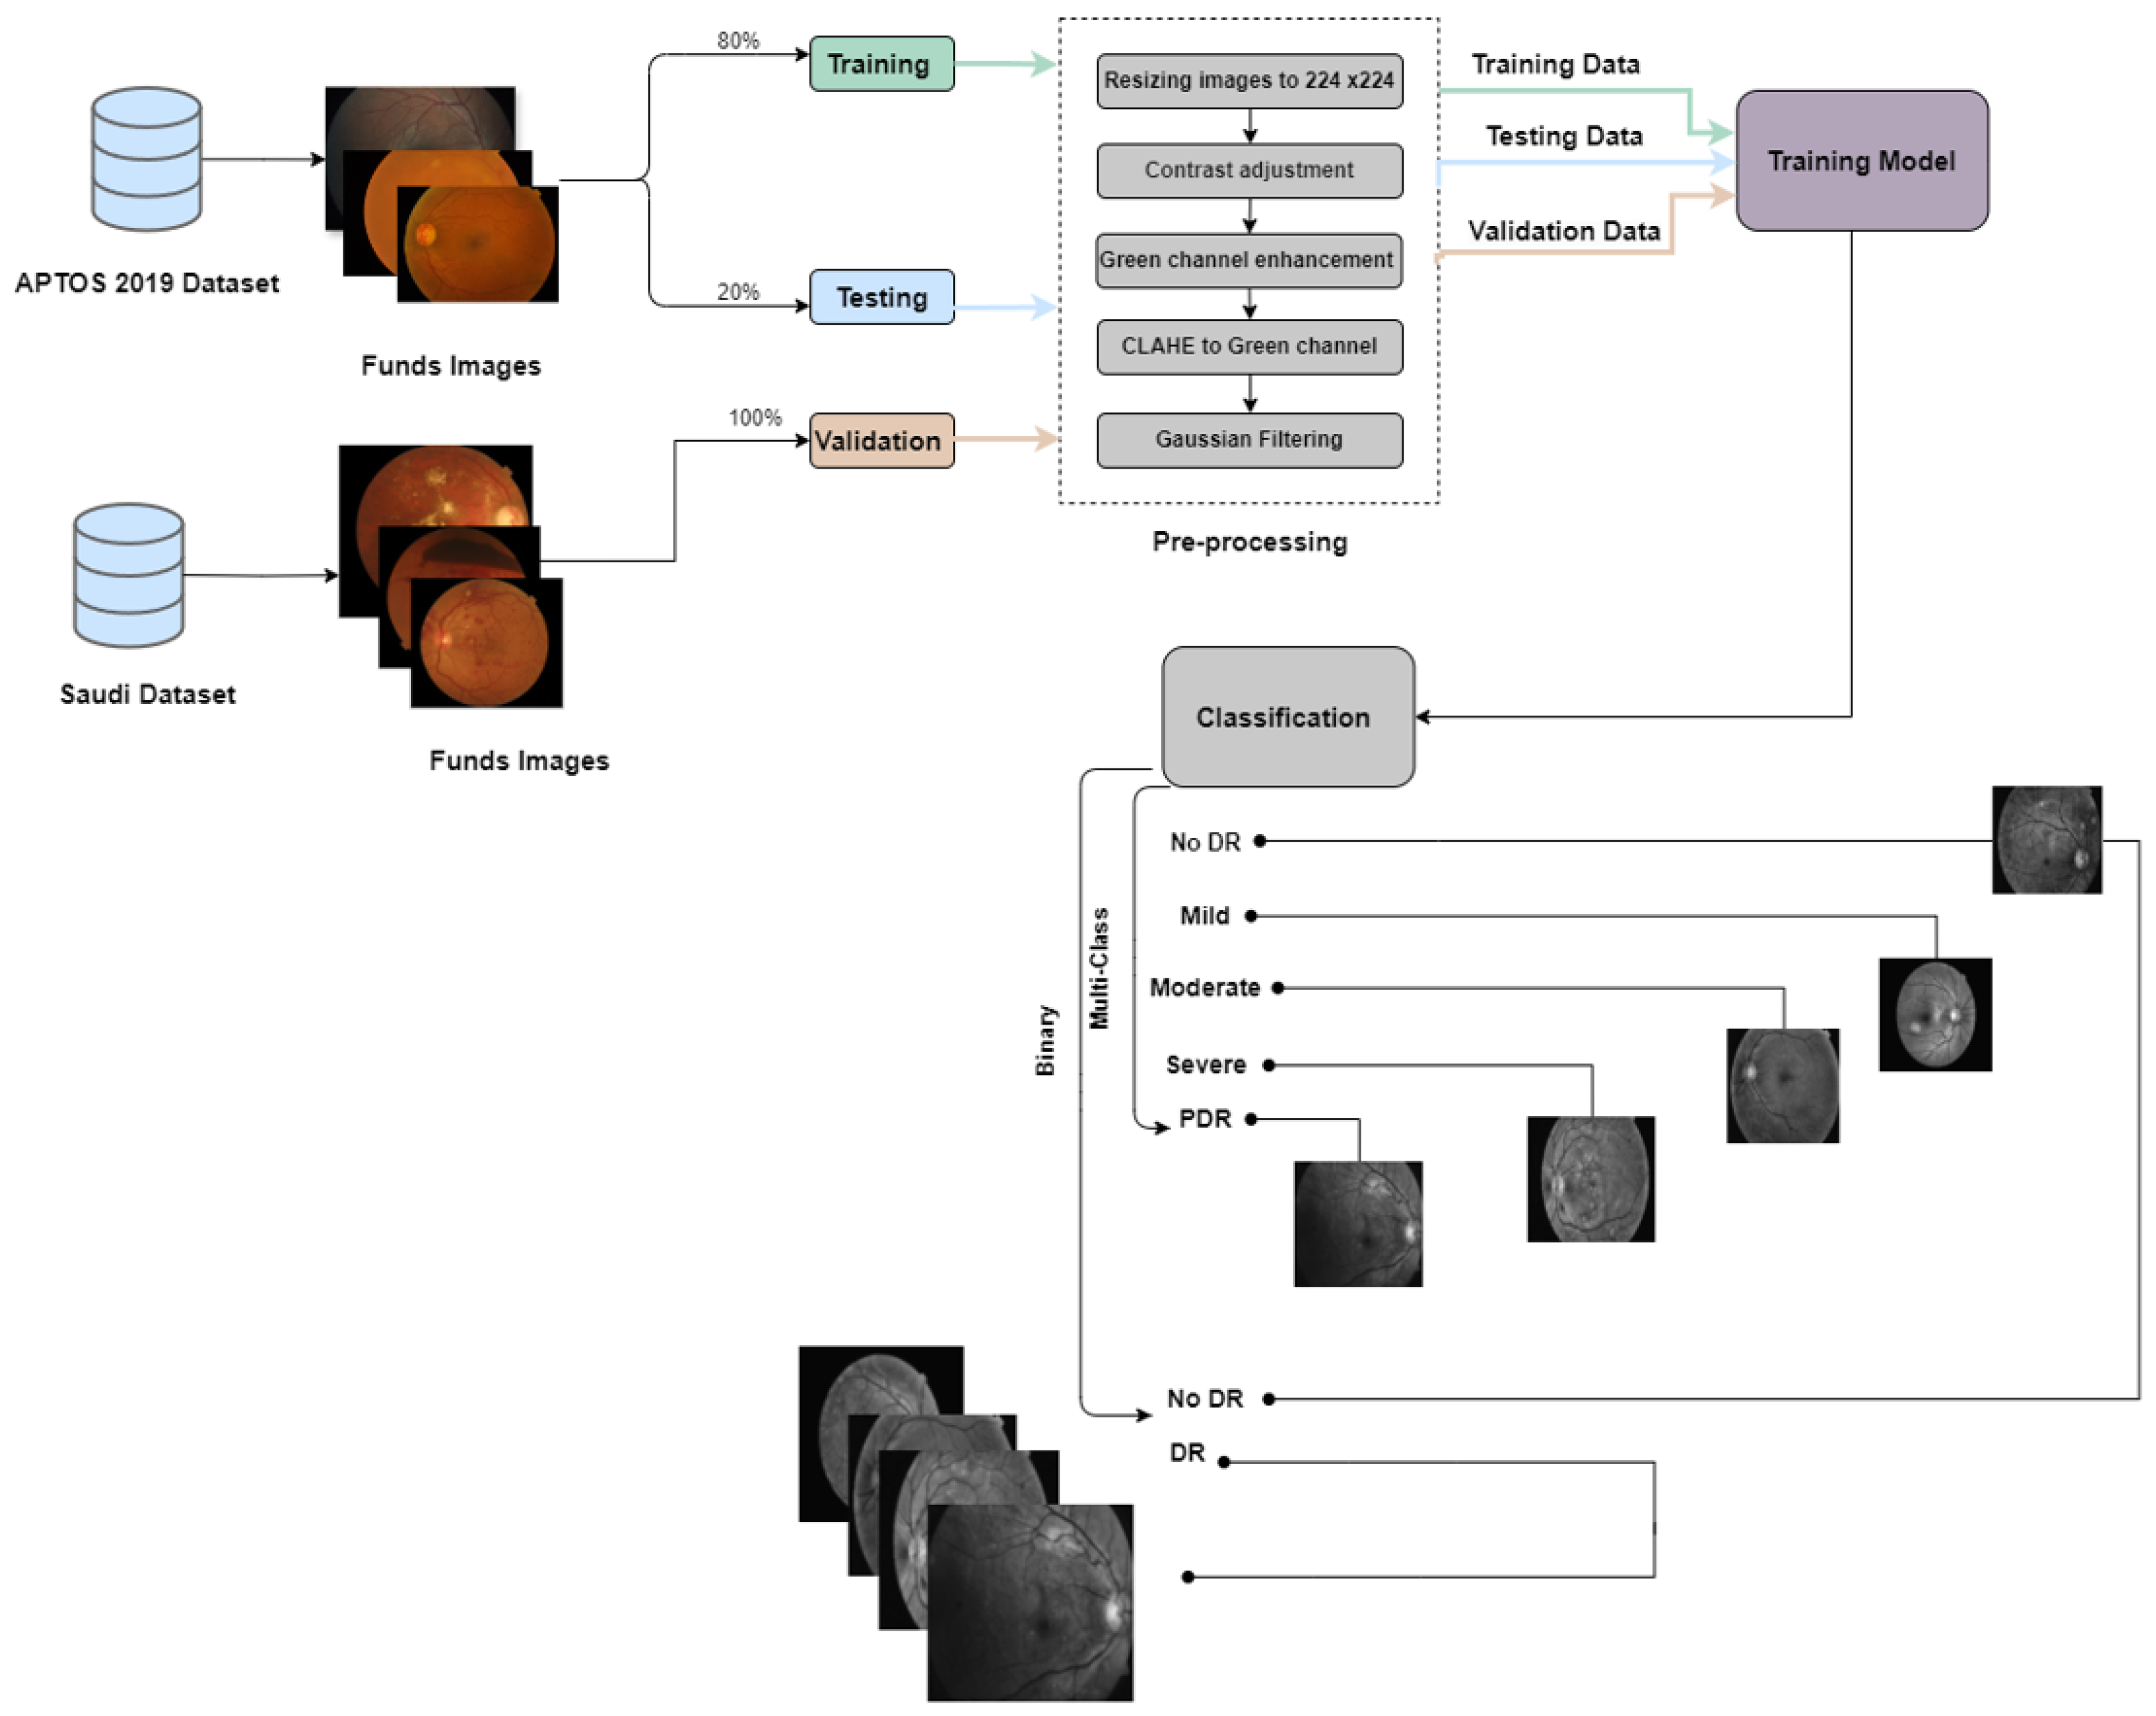
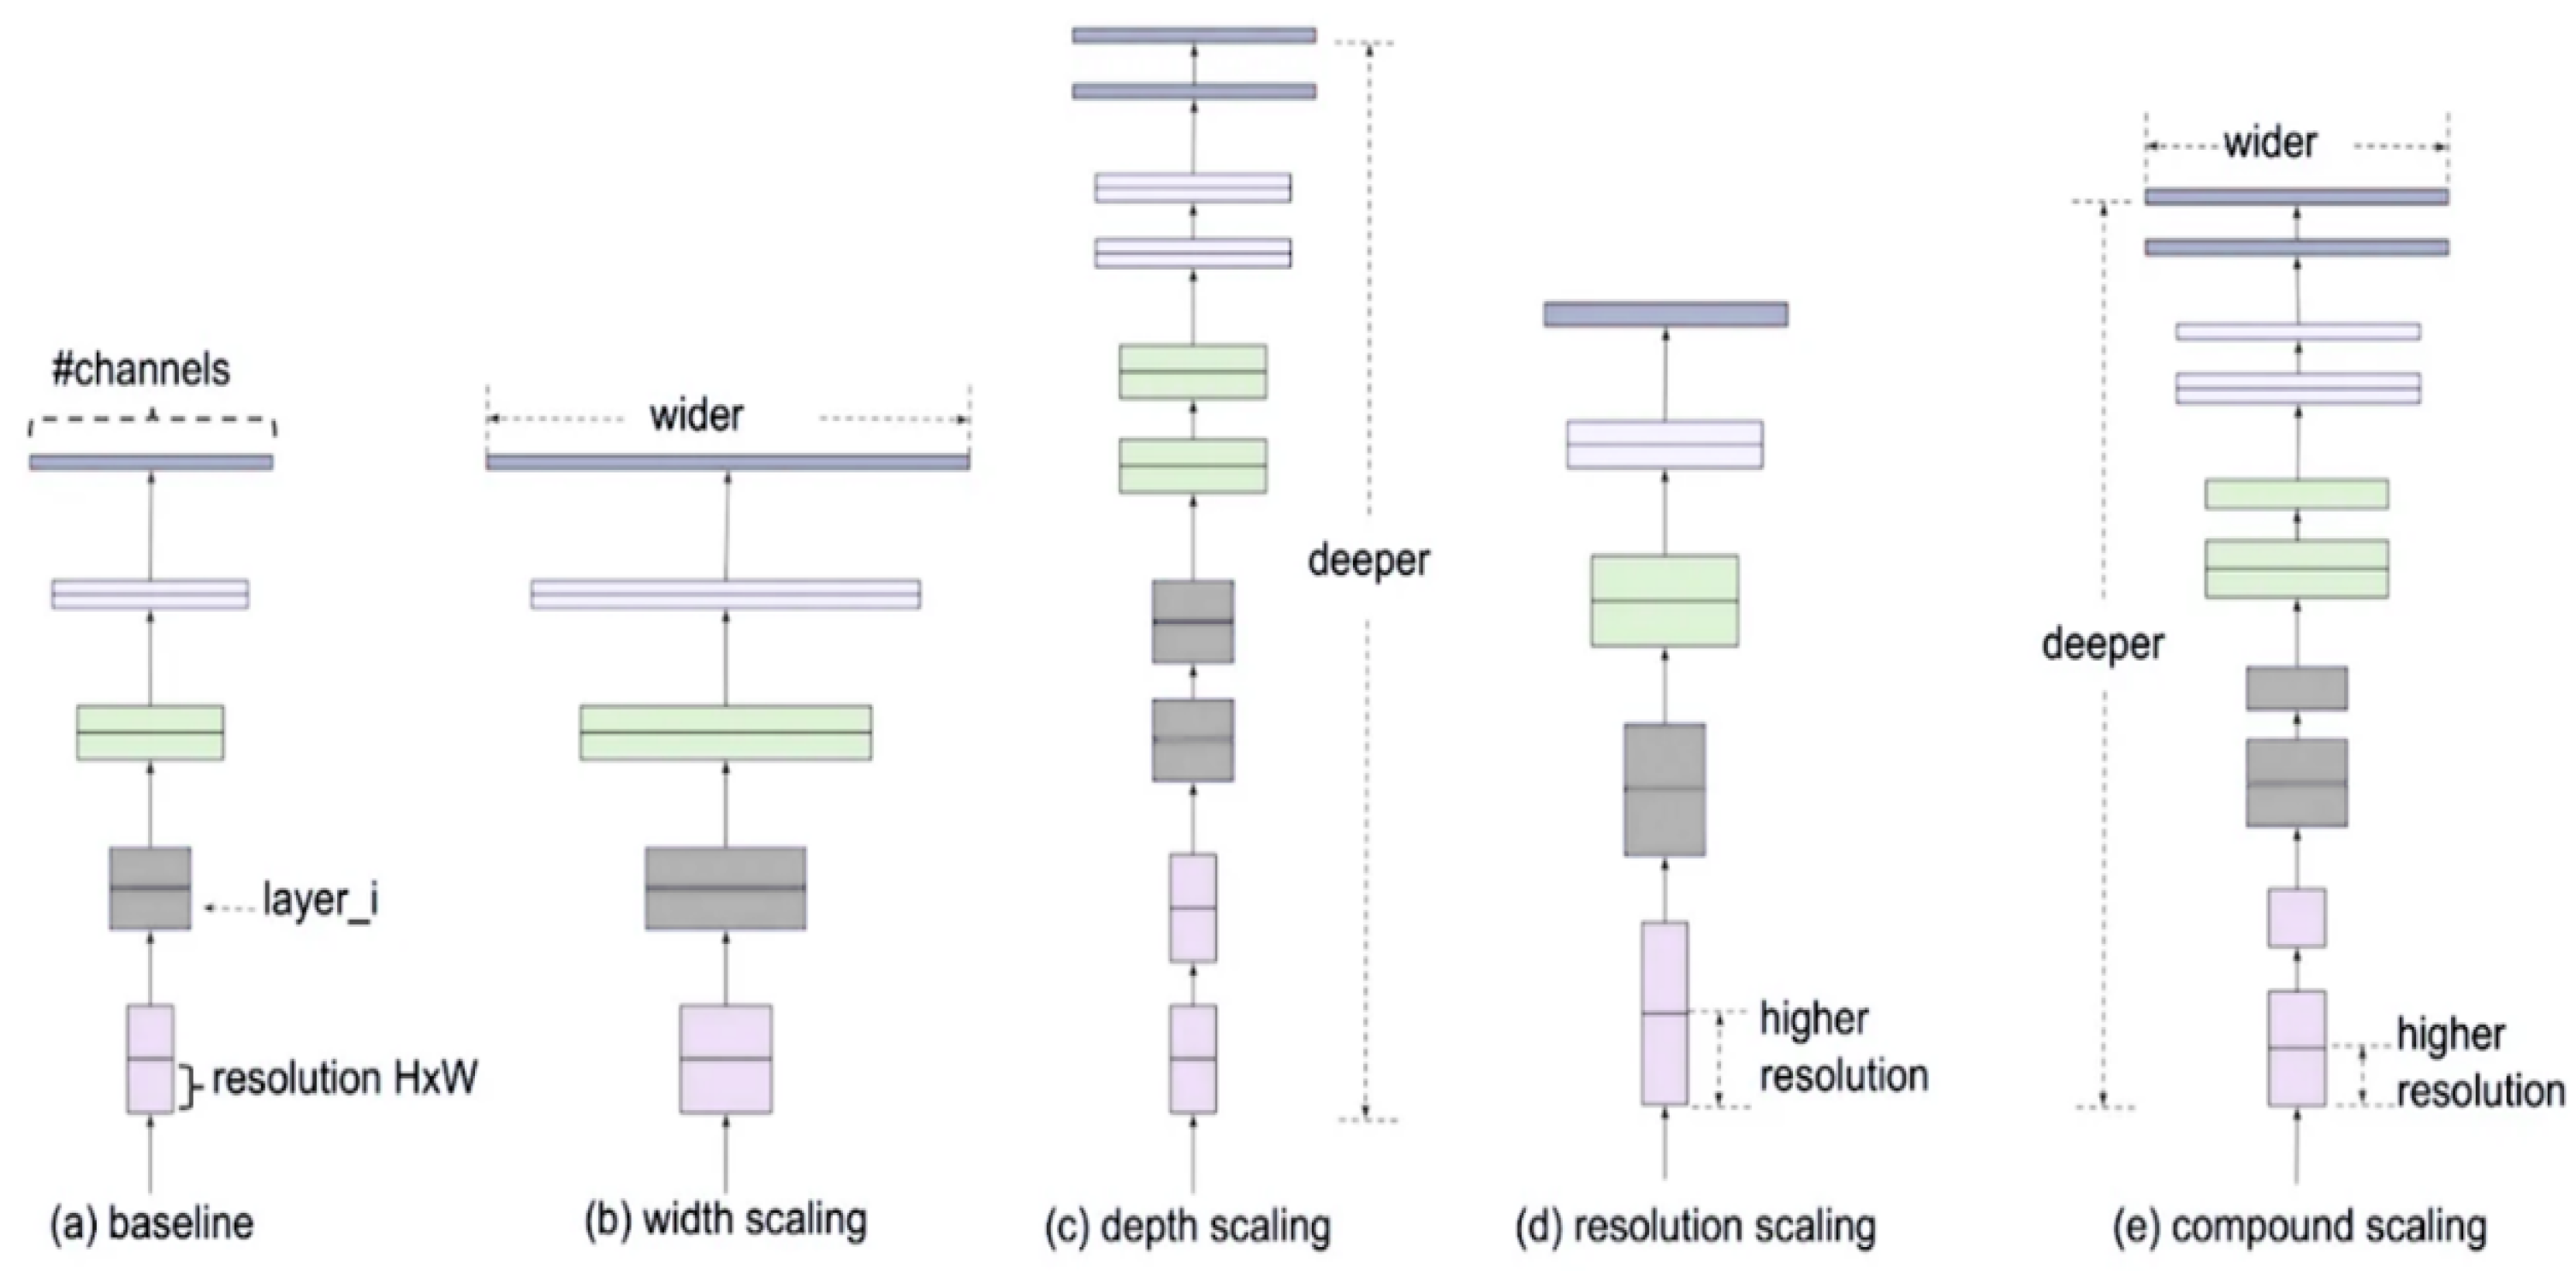

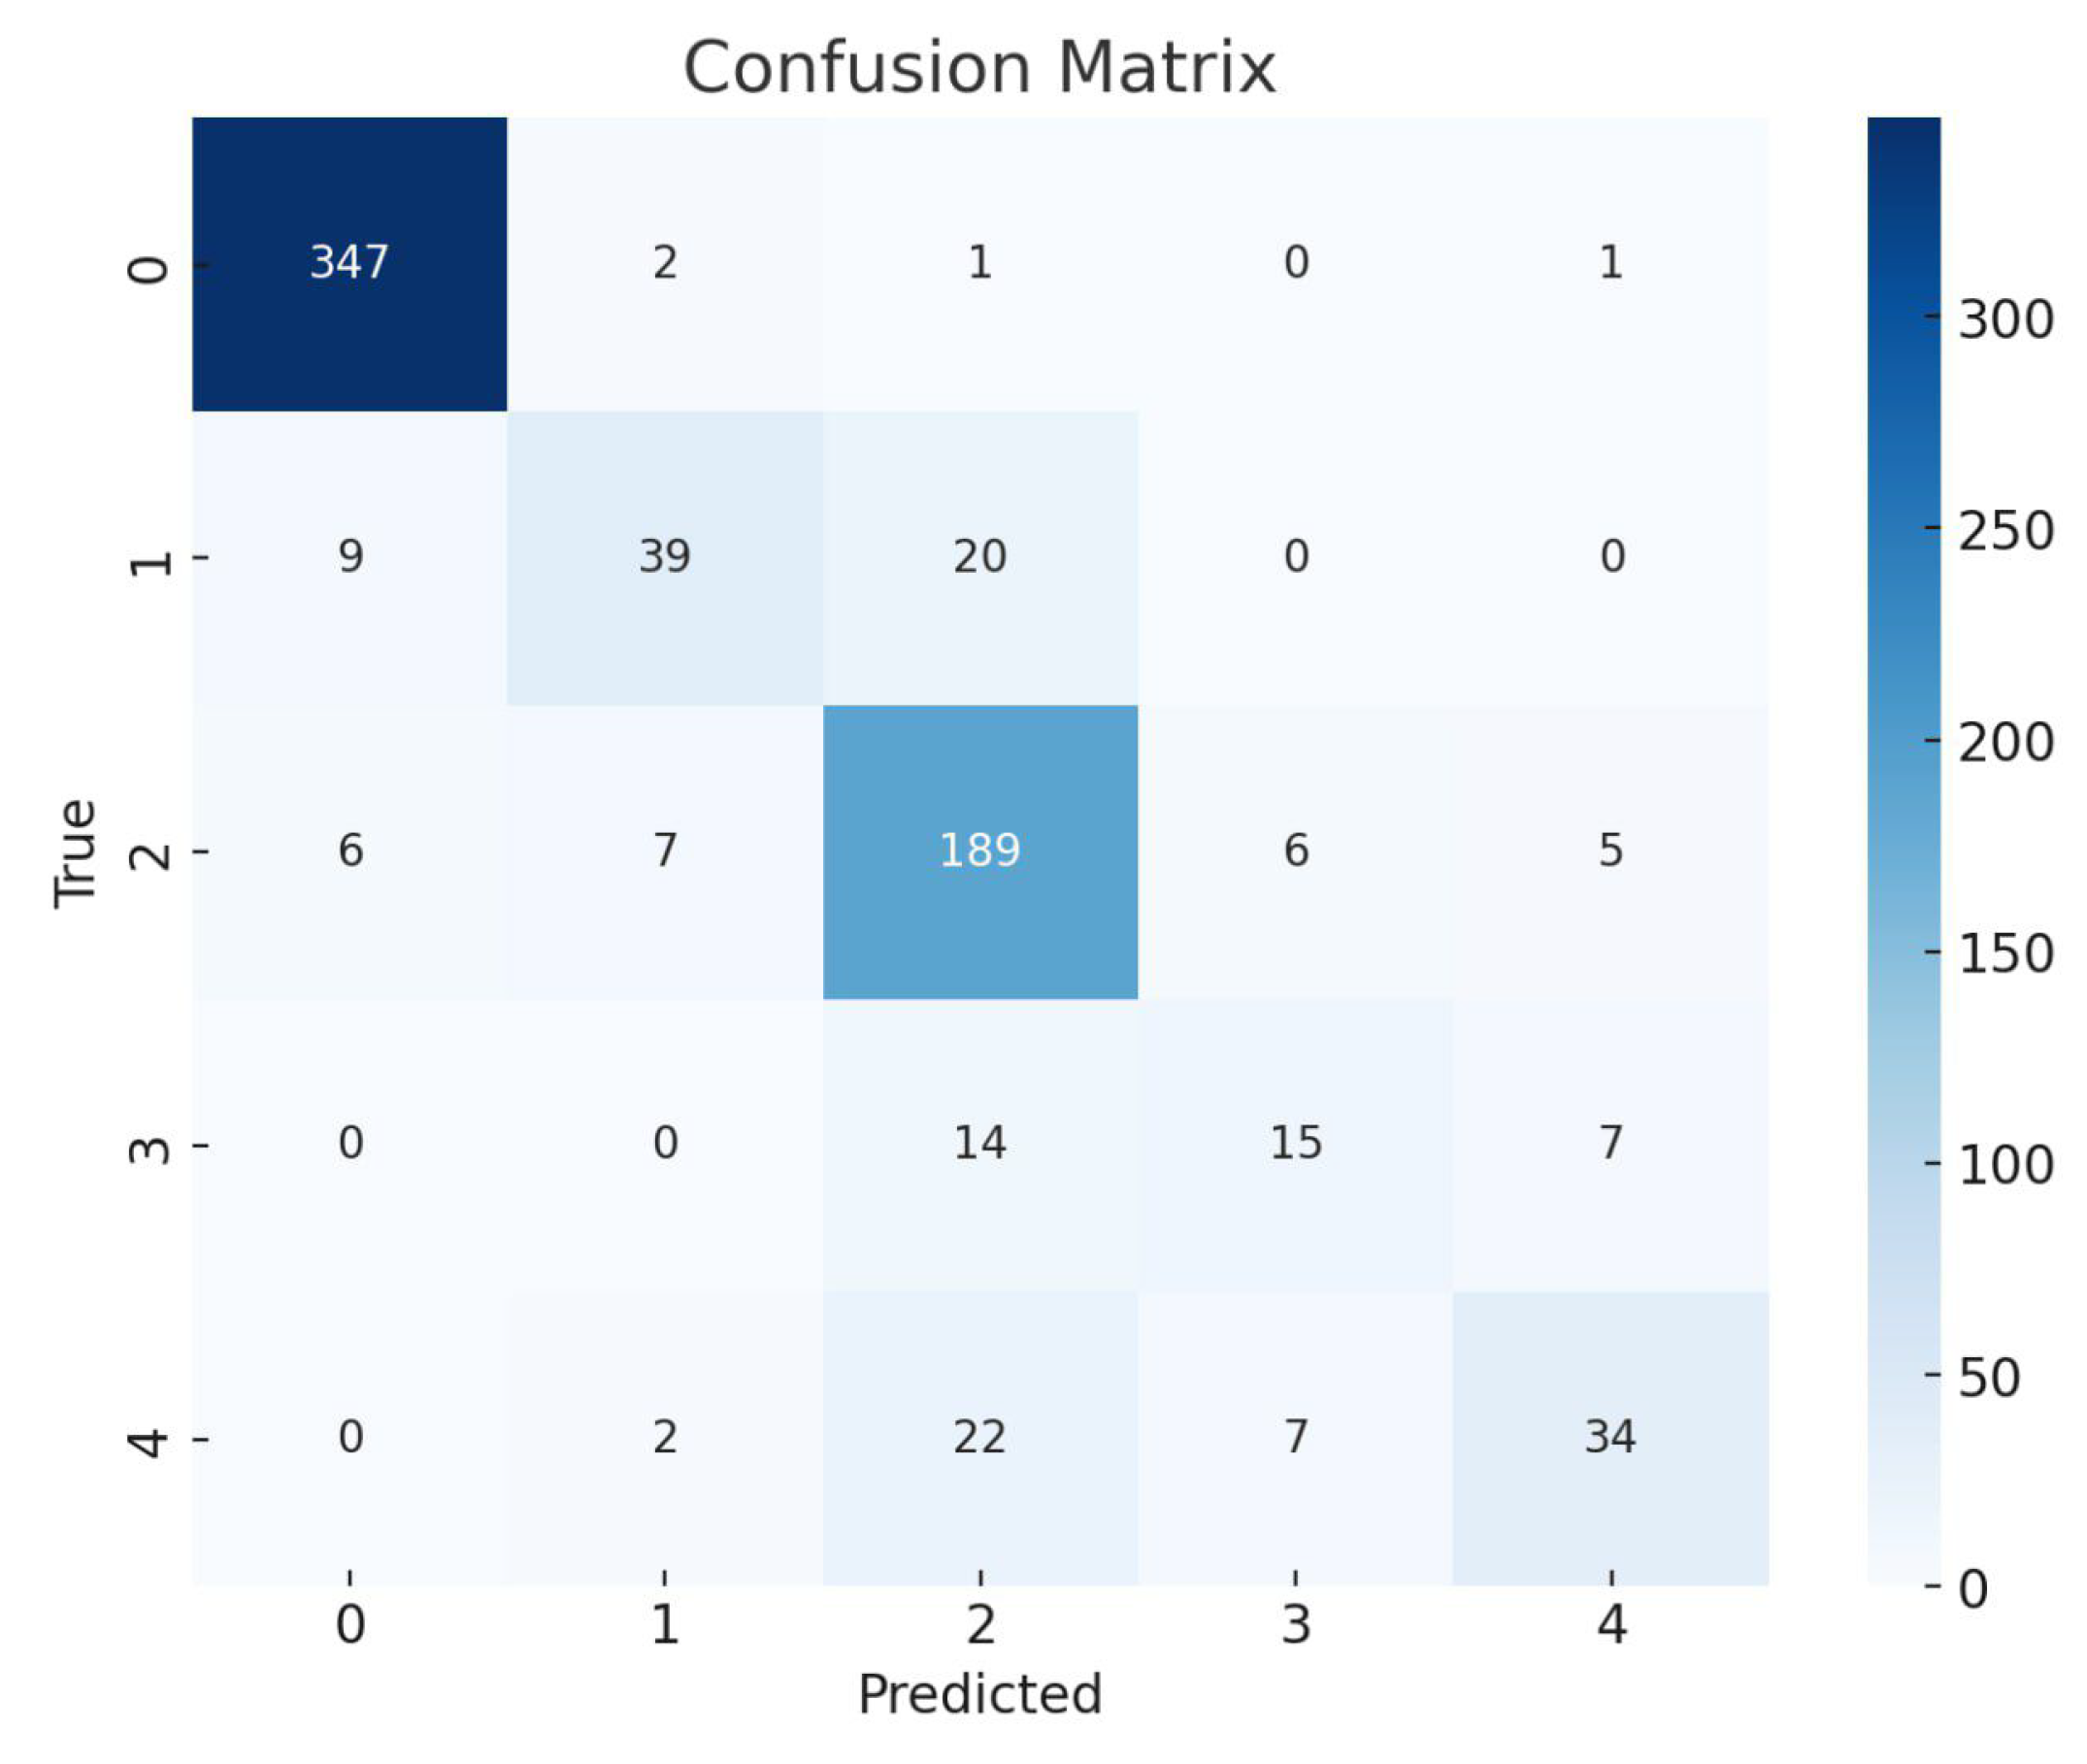
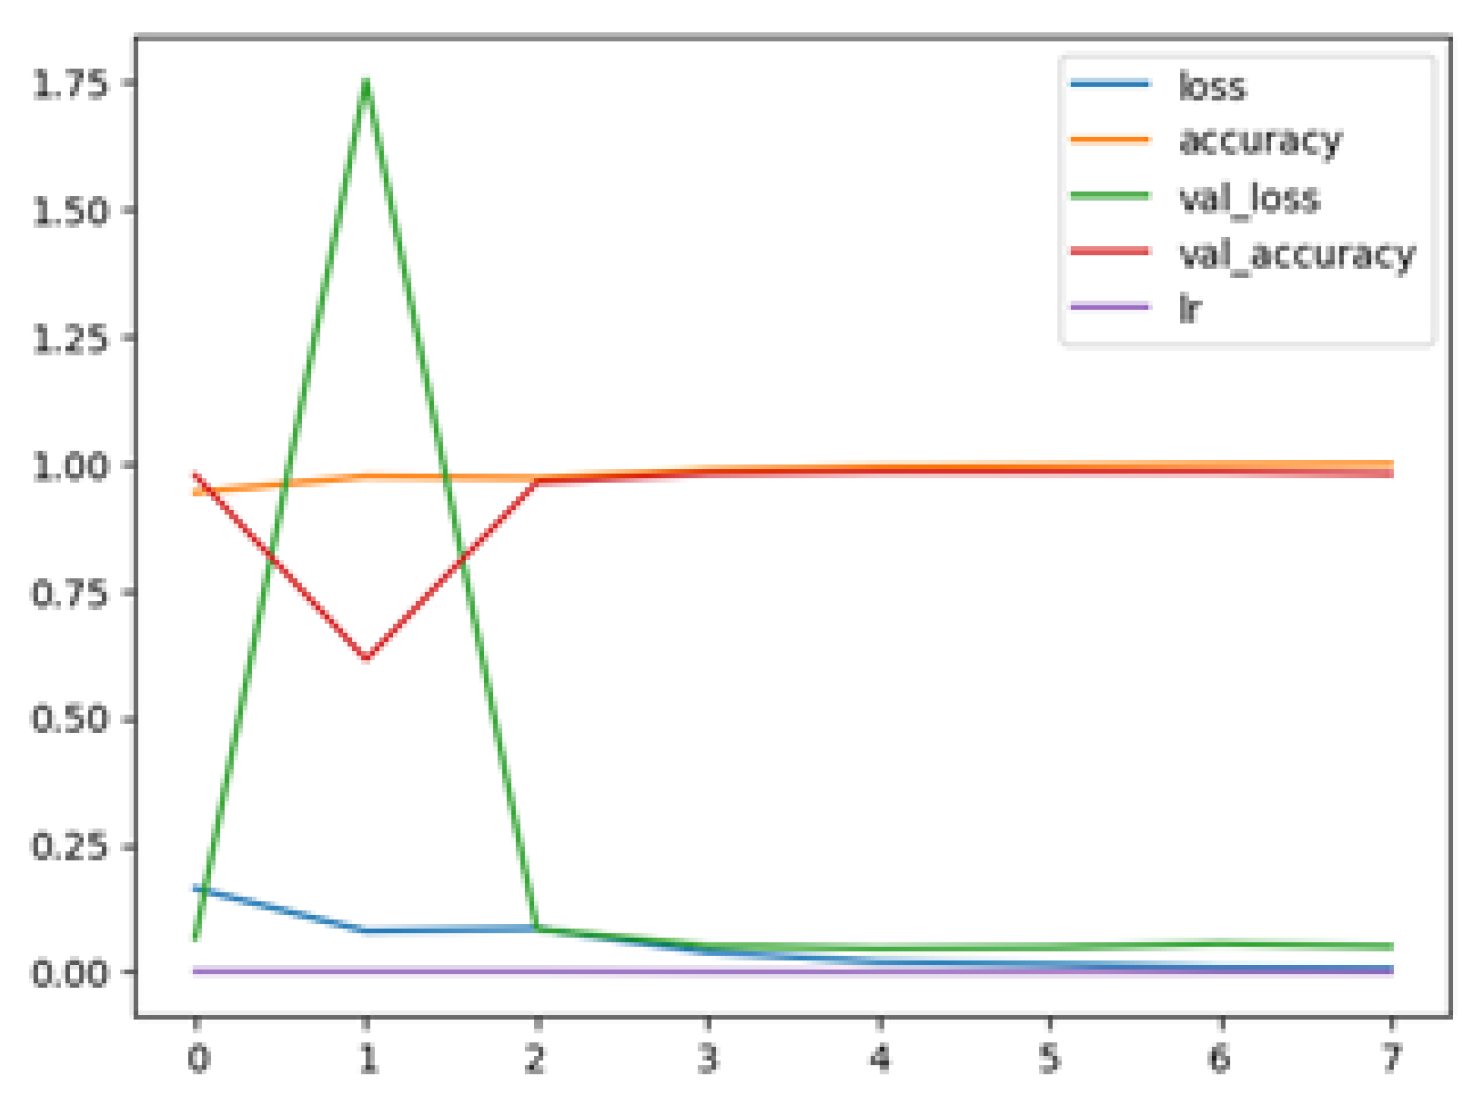
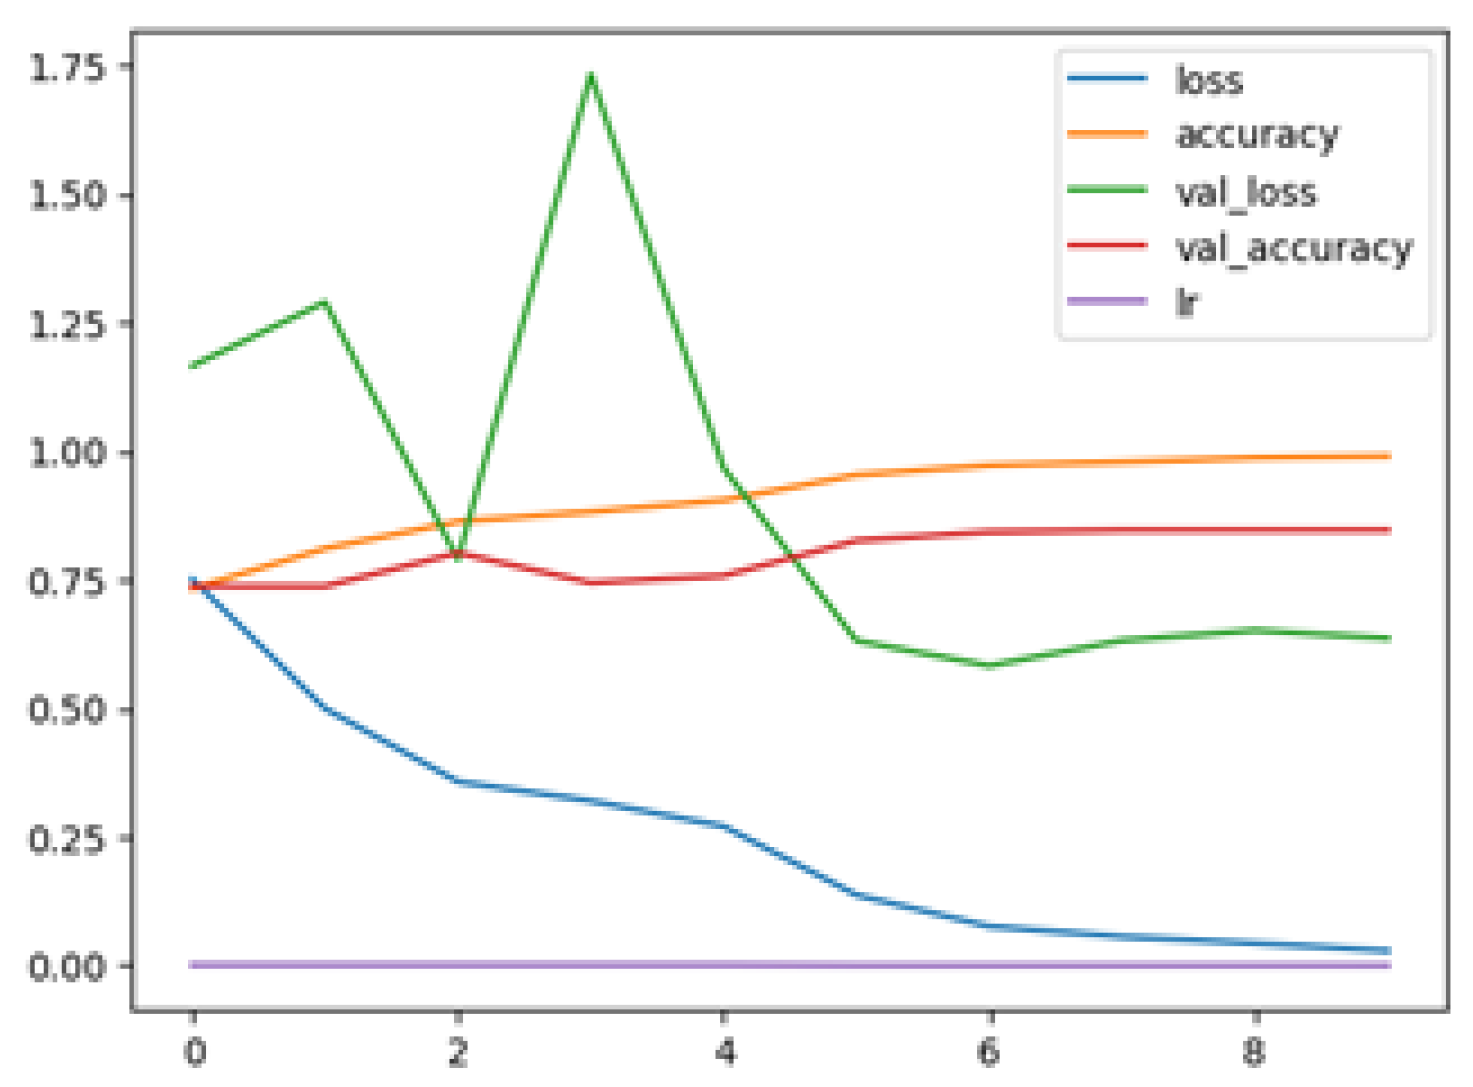
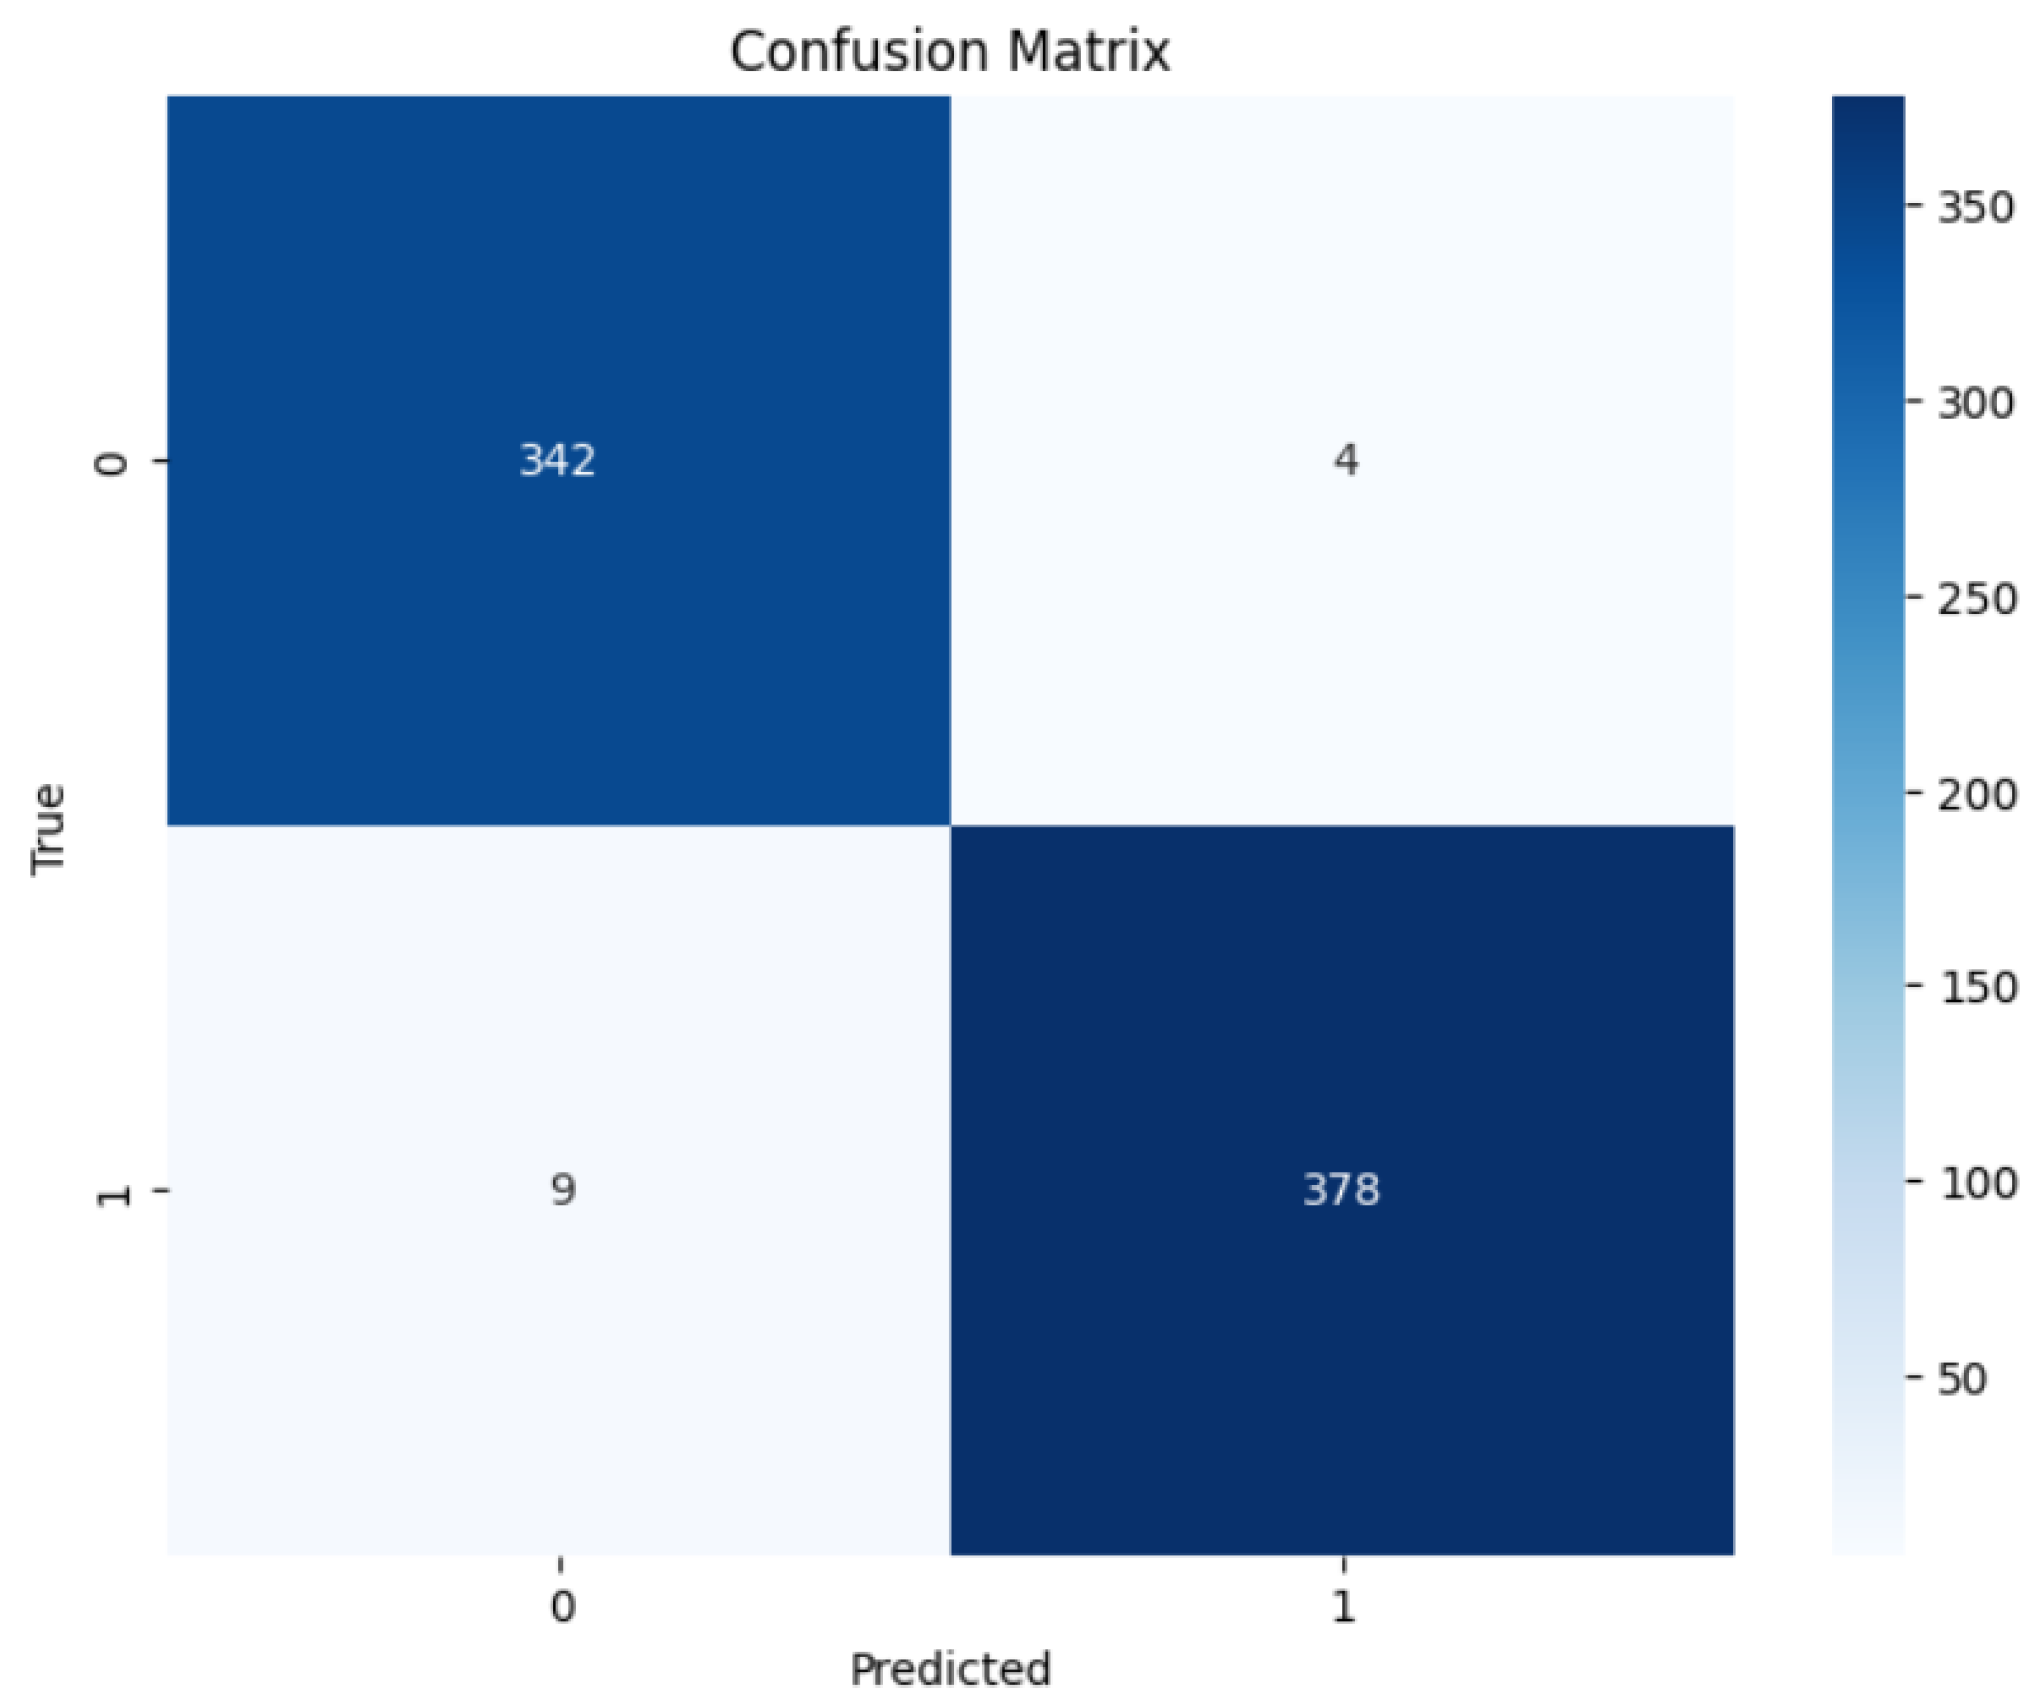
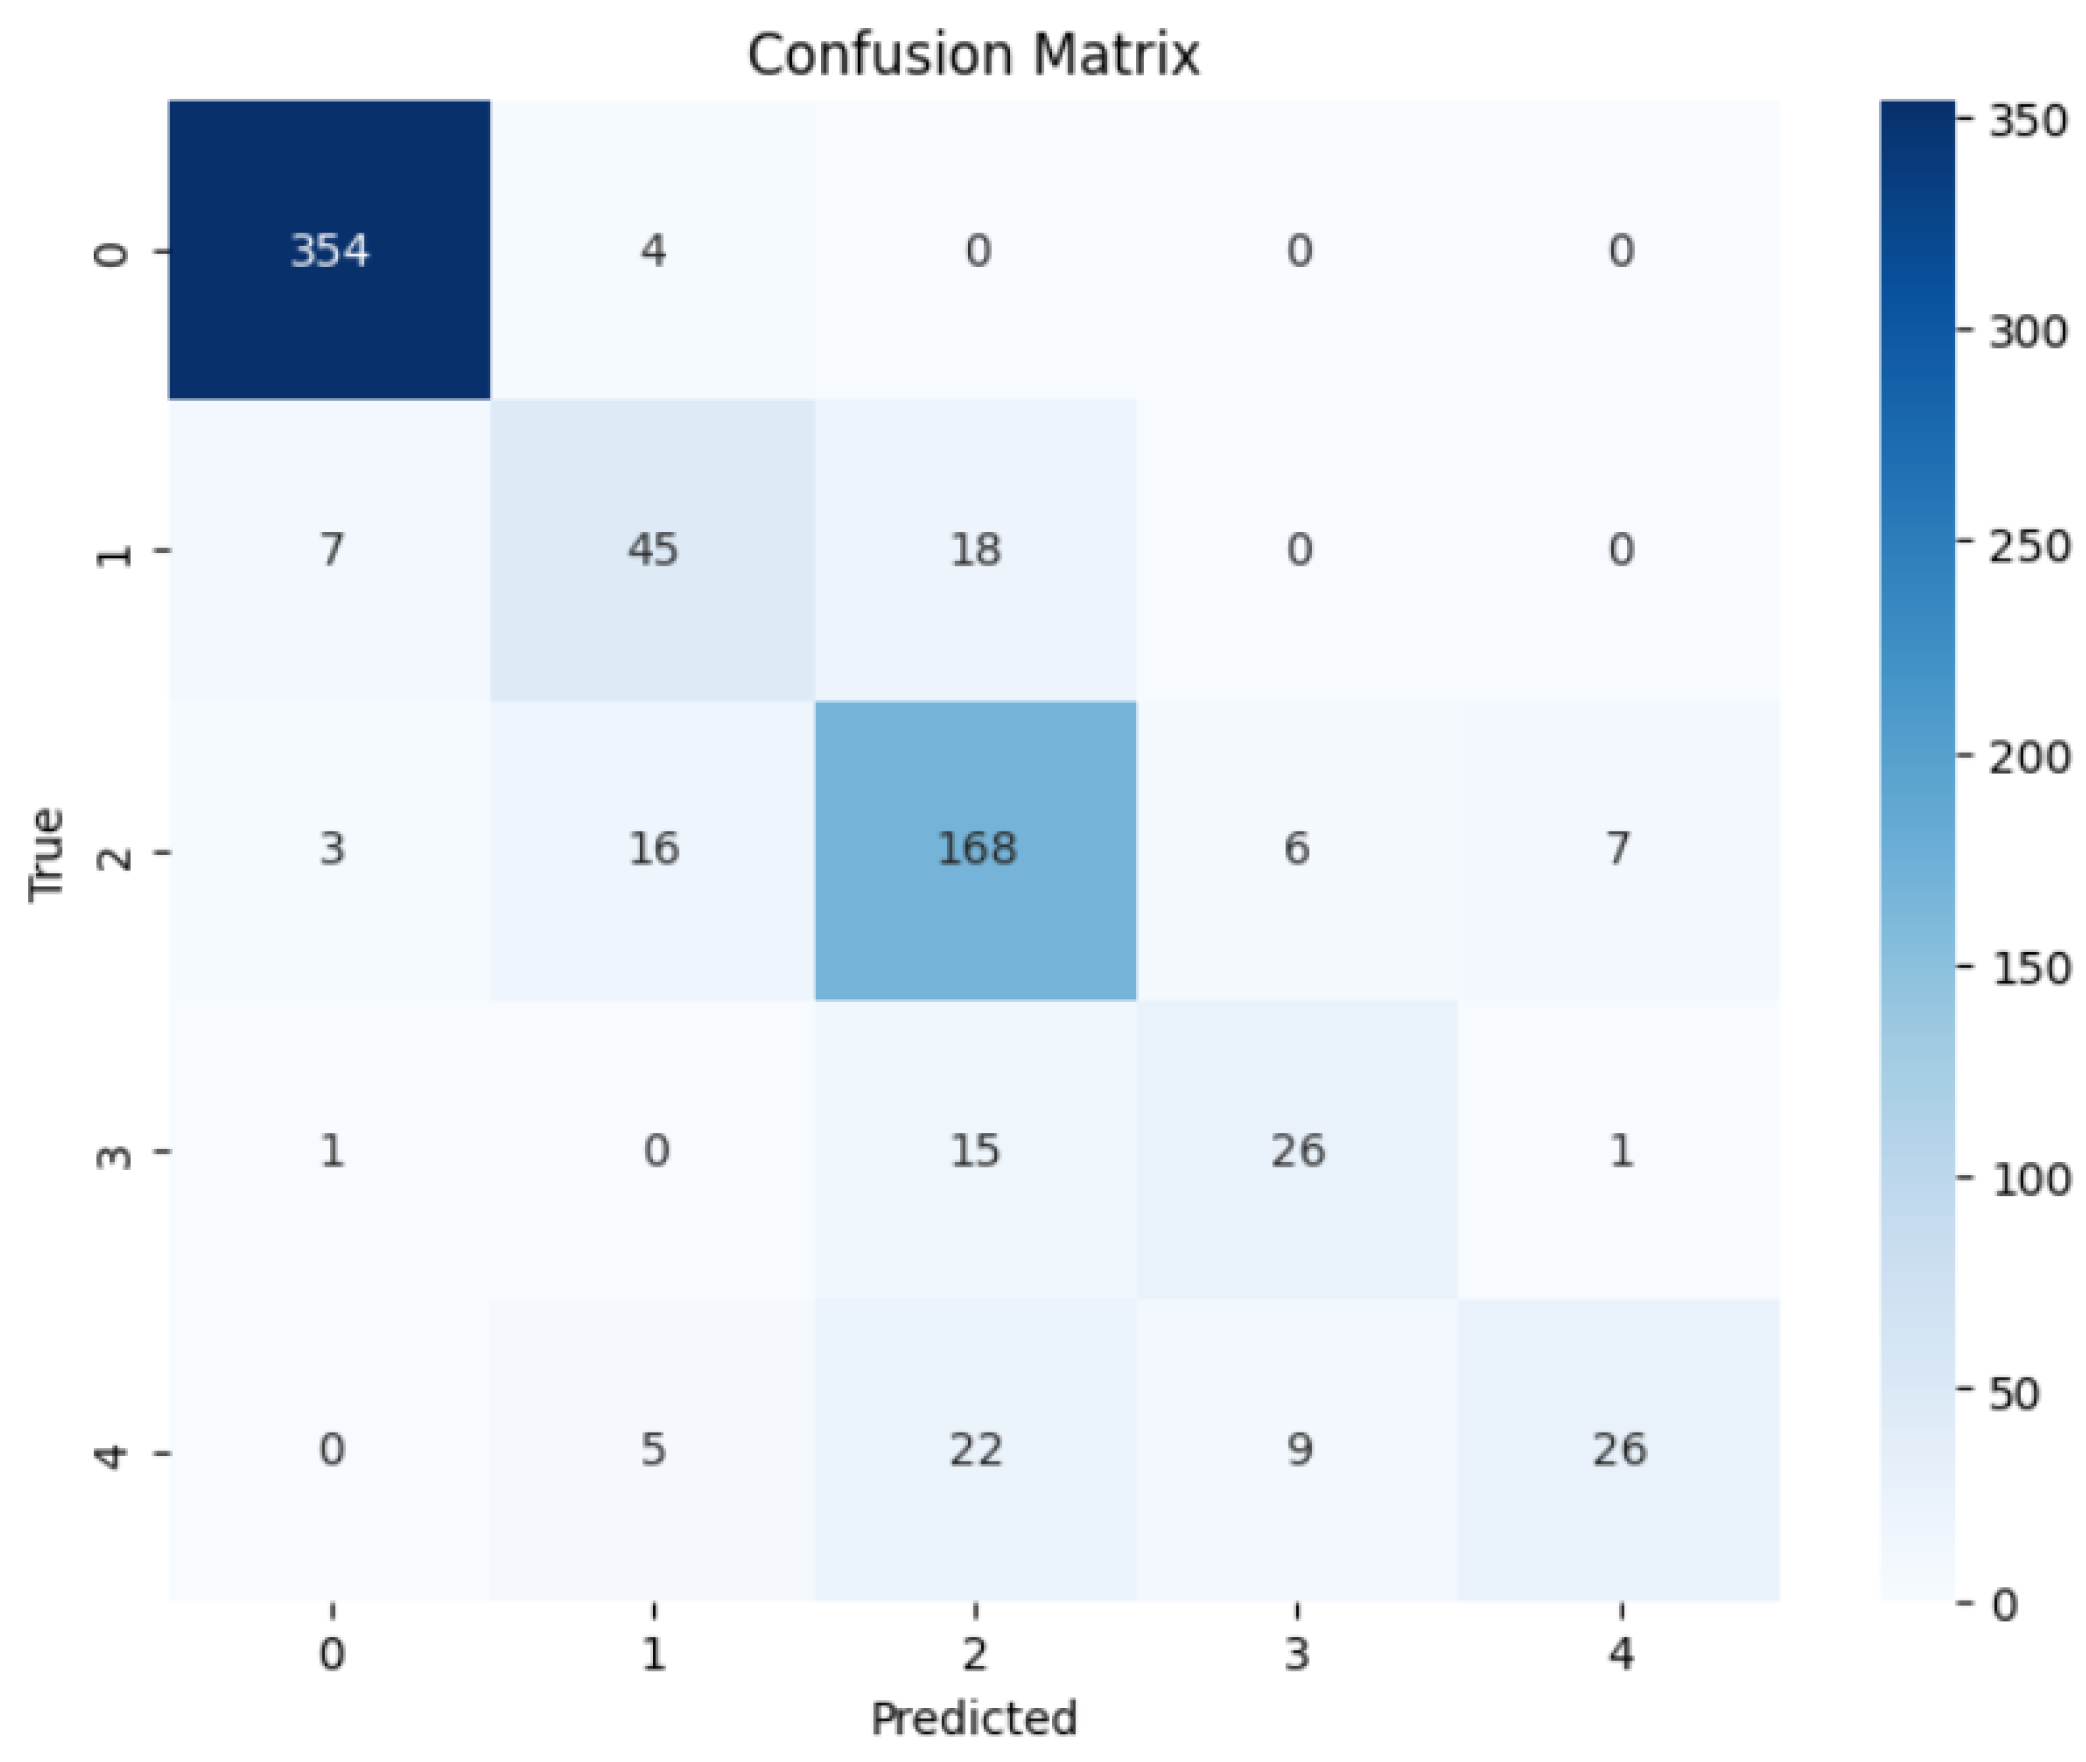
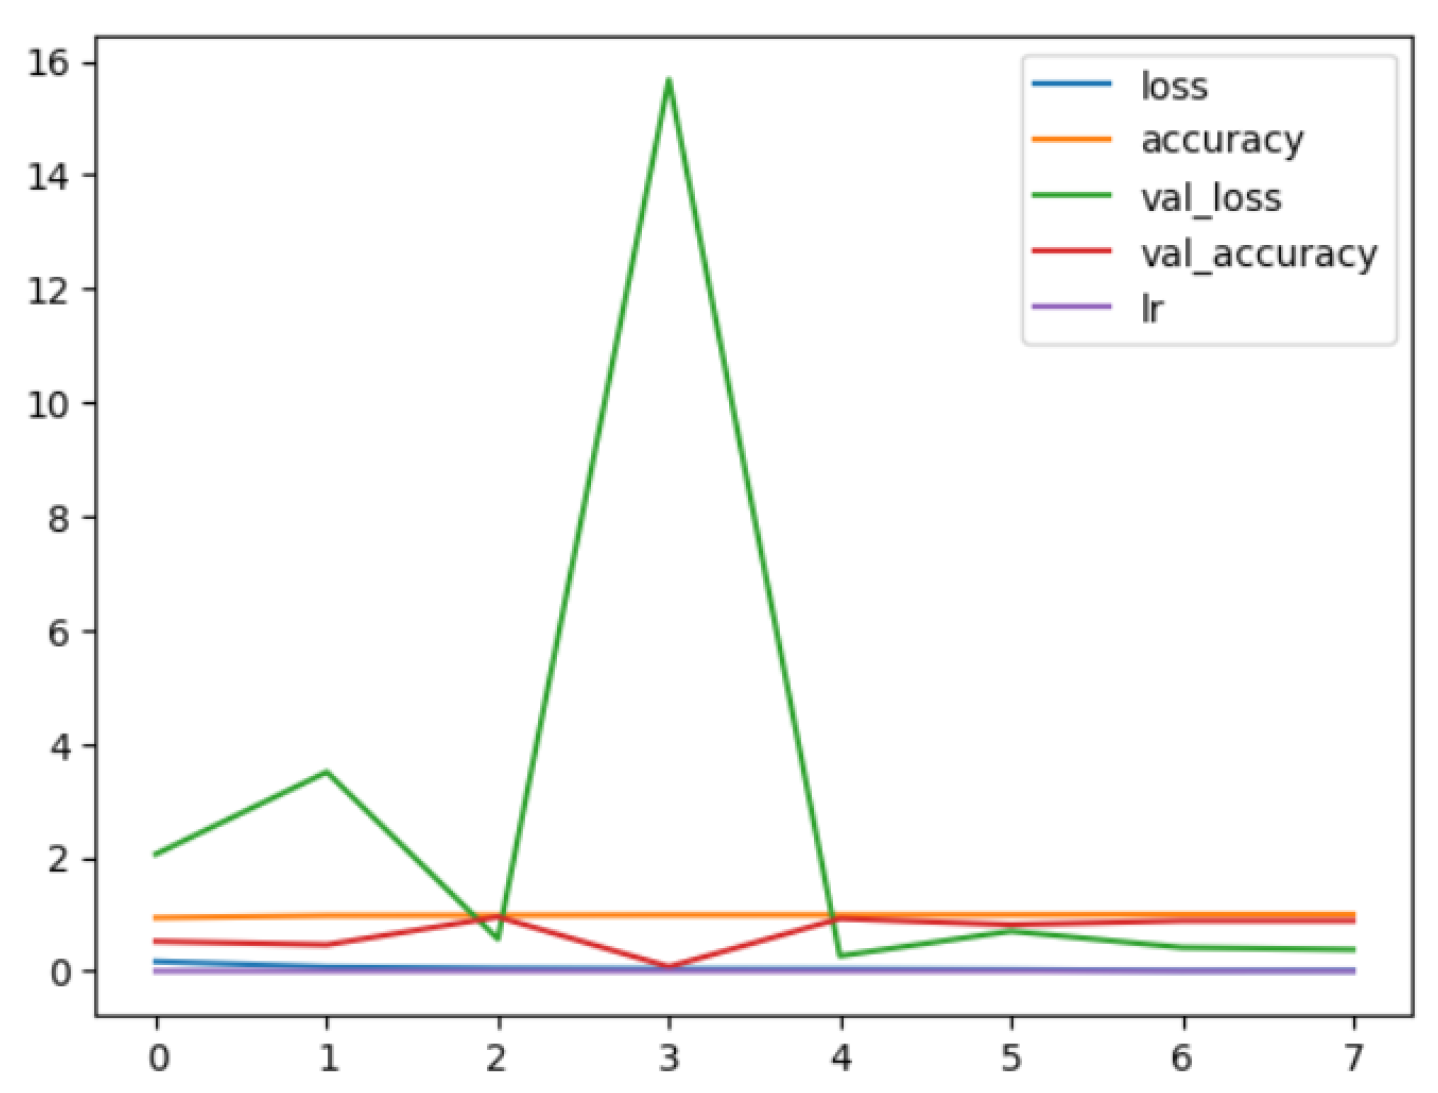

Disclaimer/Publisher’s Note: The statements, opinions and data contained in all publications are solely those of the individual author(s) and contributor(s) and not of MDPI and/or the editor(s). MDPI and/or the editor(s) disclaim responsibility for any injury to people or property resulting from any ideas, methods, instructions or products referred to in the content. |
© 2024 by the authors. Licensee MDPI, Basel, Switzerland. This article is an open access article distributed under the terms and conditions of the Creative Commons Attribution (CC BY) license (https://creativecommons.org/licenses/by/4.0/).