Abstract
Inspection and material evaluation are some of the critical factors to ensure the structural integrity and safety of an aircraft in the aviation industry. These inspections are carried out by trained personnel, and while effective, they are prone to human error, where even a minute error could result in a large-scale negative impact. Automated detection devices designed to improve the reliability of inspections could help the industry reduce the potential effects caused by human error. This study aims to develop a system that can automatically detect and identify defects on aircraft skin using relatively lightweight devices, including mobile phones and unmanned aerial vehicles (UAVs). The study combines an internet of things (IoT) network, allowing the results to be reviewed in real time, regardless of distance. The experimental results confirmed the effective recognition of defects with the mean average precision (mAP@0.5) at 0.853 for YOLOv9c for all classes. However, despite the effective detection, the test device (mobile phone) was prone to overheating, significantly reducing its performance. While there is still room for further enhancements, this study demonstrates the potential of introducing automated image detection technology to assist the inspection process in the aviation industry.
1. Introduction
Inspection and material evaluation are vital for maintaining an aircraft’s structural integrity and safety within the aviation industry. One of the essential aspects of aircraft maintenance is the regular inspection of the aircraft’s surface for any signs of wear, damage or corrosion that could compromise its safety. Traditionally, these inspections have been conducted by trained personnel. Although practical, this method is time-consuming and subject to human error, where even a minor mistake could result in a large-scale negative impact.
Recent advancements in deep-learning and object detection algorithms have revolutionized various fields, including aviation, healthcare and autonomous driving. Deep learning, a subset of machine learning, utilizes neural networks with many layers, allowing the trained algorithm to analyze complex data patterns and make accurate predictions [1]. Moreover, the development of convolutional neural networks (CNNs) has significantly improved the performance of object detection tasks, enabling systems to identify and classify objects with remarkable accuracy and speed [1]. Algorithms such as You Only Look Once (YOLO) [2], Single Shot MultiBox Detector (SSD) [3] and Faster R-CNN [4] have defined a new era in real-time object detection by efficiently processing images and videos. These advancements allow computationally intensive tasks to be performed even on devices with limited computational power, such as mobile devices.
These advancements have paved the way for developing sophisticated applications, such as automated visual inspection systems, which can detect minute surface abnormalities on aircraft, ensuring higher safety and reliability standards. With advancements in technology, there is a growing opportunity to enhance the accuracy of these inspections, efficiency and reliability through automated visual checking systems. To lower the potential risk of human error and introduce a method to ensure inspection quality, the research aims to develop a tool to detect and grade surface damage on an aircraft.
The work related to this method includes using UAV-based images to assess crop health and detect diseases in early stages [5] and modifying the YOLOv8 module for road surface defect detection [6]. The proposed system combines UAV, imaging technologies, machine-learning algorithms and private server technology, allowing it to visually inspect aircraft surfaces with high-resolution cameras while sending the results to internet of things (IoT) devices for further inspection in real time. The research aims to detect and classify surface anomalies, such as dents, scratches, cracks and paint-offs. The system can learn from each inspection by integrating artificial intelligence, improving its accuracy and reducing the likelihood of missed defects. This automated approach speeds up the inspection process and ensures a higher level of consistency and reliability than manual inspections.
2. Materials and Methods
The primary approach of the system was the use of an image detection algorithm, namely You Only Look Once (YOLO), to detect defects on the surfaces of an aircraft as trained using the test devices and combining it with the ability to transfer imagery data in real time to the designed IoT devices. With this combination, the detected test results will be uploaded to the server and accessed via IoT devices for monitoring.
The equipment used in this study for algorithm training included a computer running Windows 11 OS with an AMD Ryzen 9 7950X 16-Core Processor, an NVIDIA GeForce RTX 4070Ti GPU with 6 GB VRAM, a CUDA version 12.1 + CUDNN 8.8.0.1 acceleration environment and 128 GB RAM capacity for model training. The above equipment comes from ASUS and MSI in Taiwan. Other devices included a Raspberry Pi 4 with 8 GB RAM, Nginx [7] installed and a Wi-Fi router for the Real-Time Messaging Protocol (RTMP) server for transferring imagery detection results to the IoT monitoring process. The test devices used in the detection process included an iPhone 13 as a mobile detection device and a DJI Mavic 2 Enterprise, which allows detection in areas that are difficult to reach, such as upper wings and rudders. The aircraft sample used in this experiment was a Cessna 172. The following Table 1 shows a comparison of the specifications of the test devices used.

Table 1.
Comparison of camera specifications: iPhone 13 [8] and DJI Mavic 2 Enterprise [9].
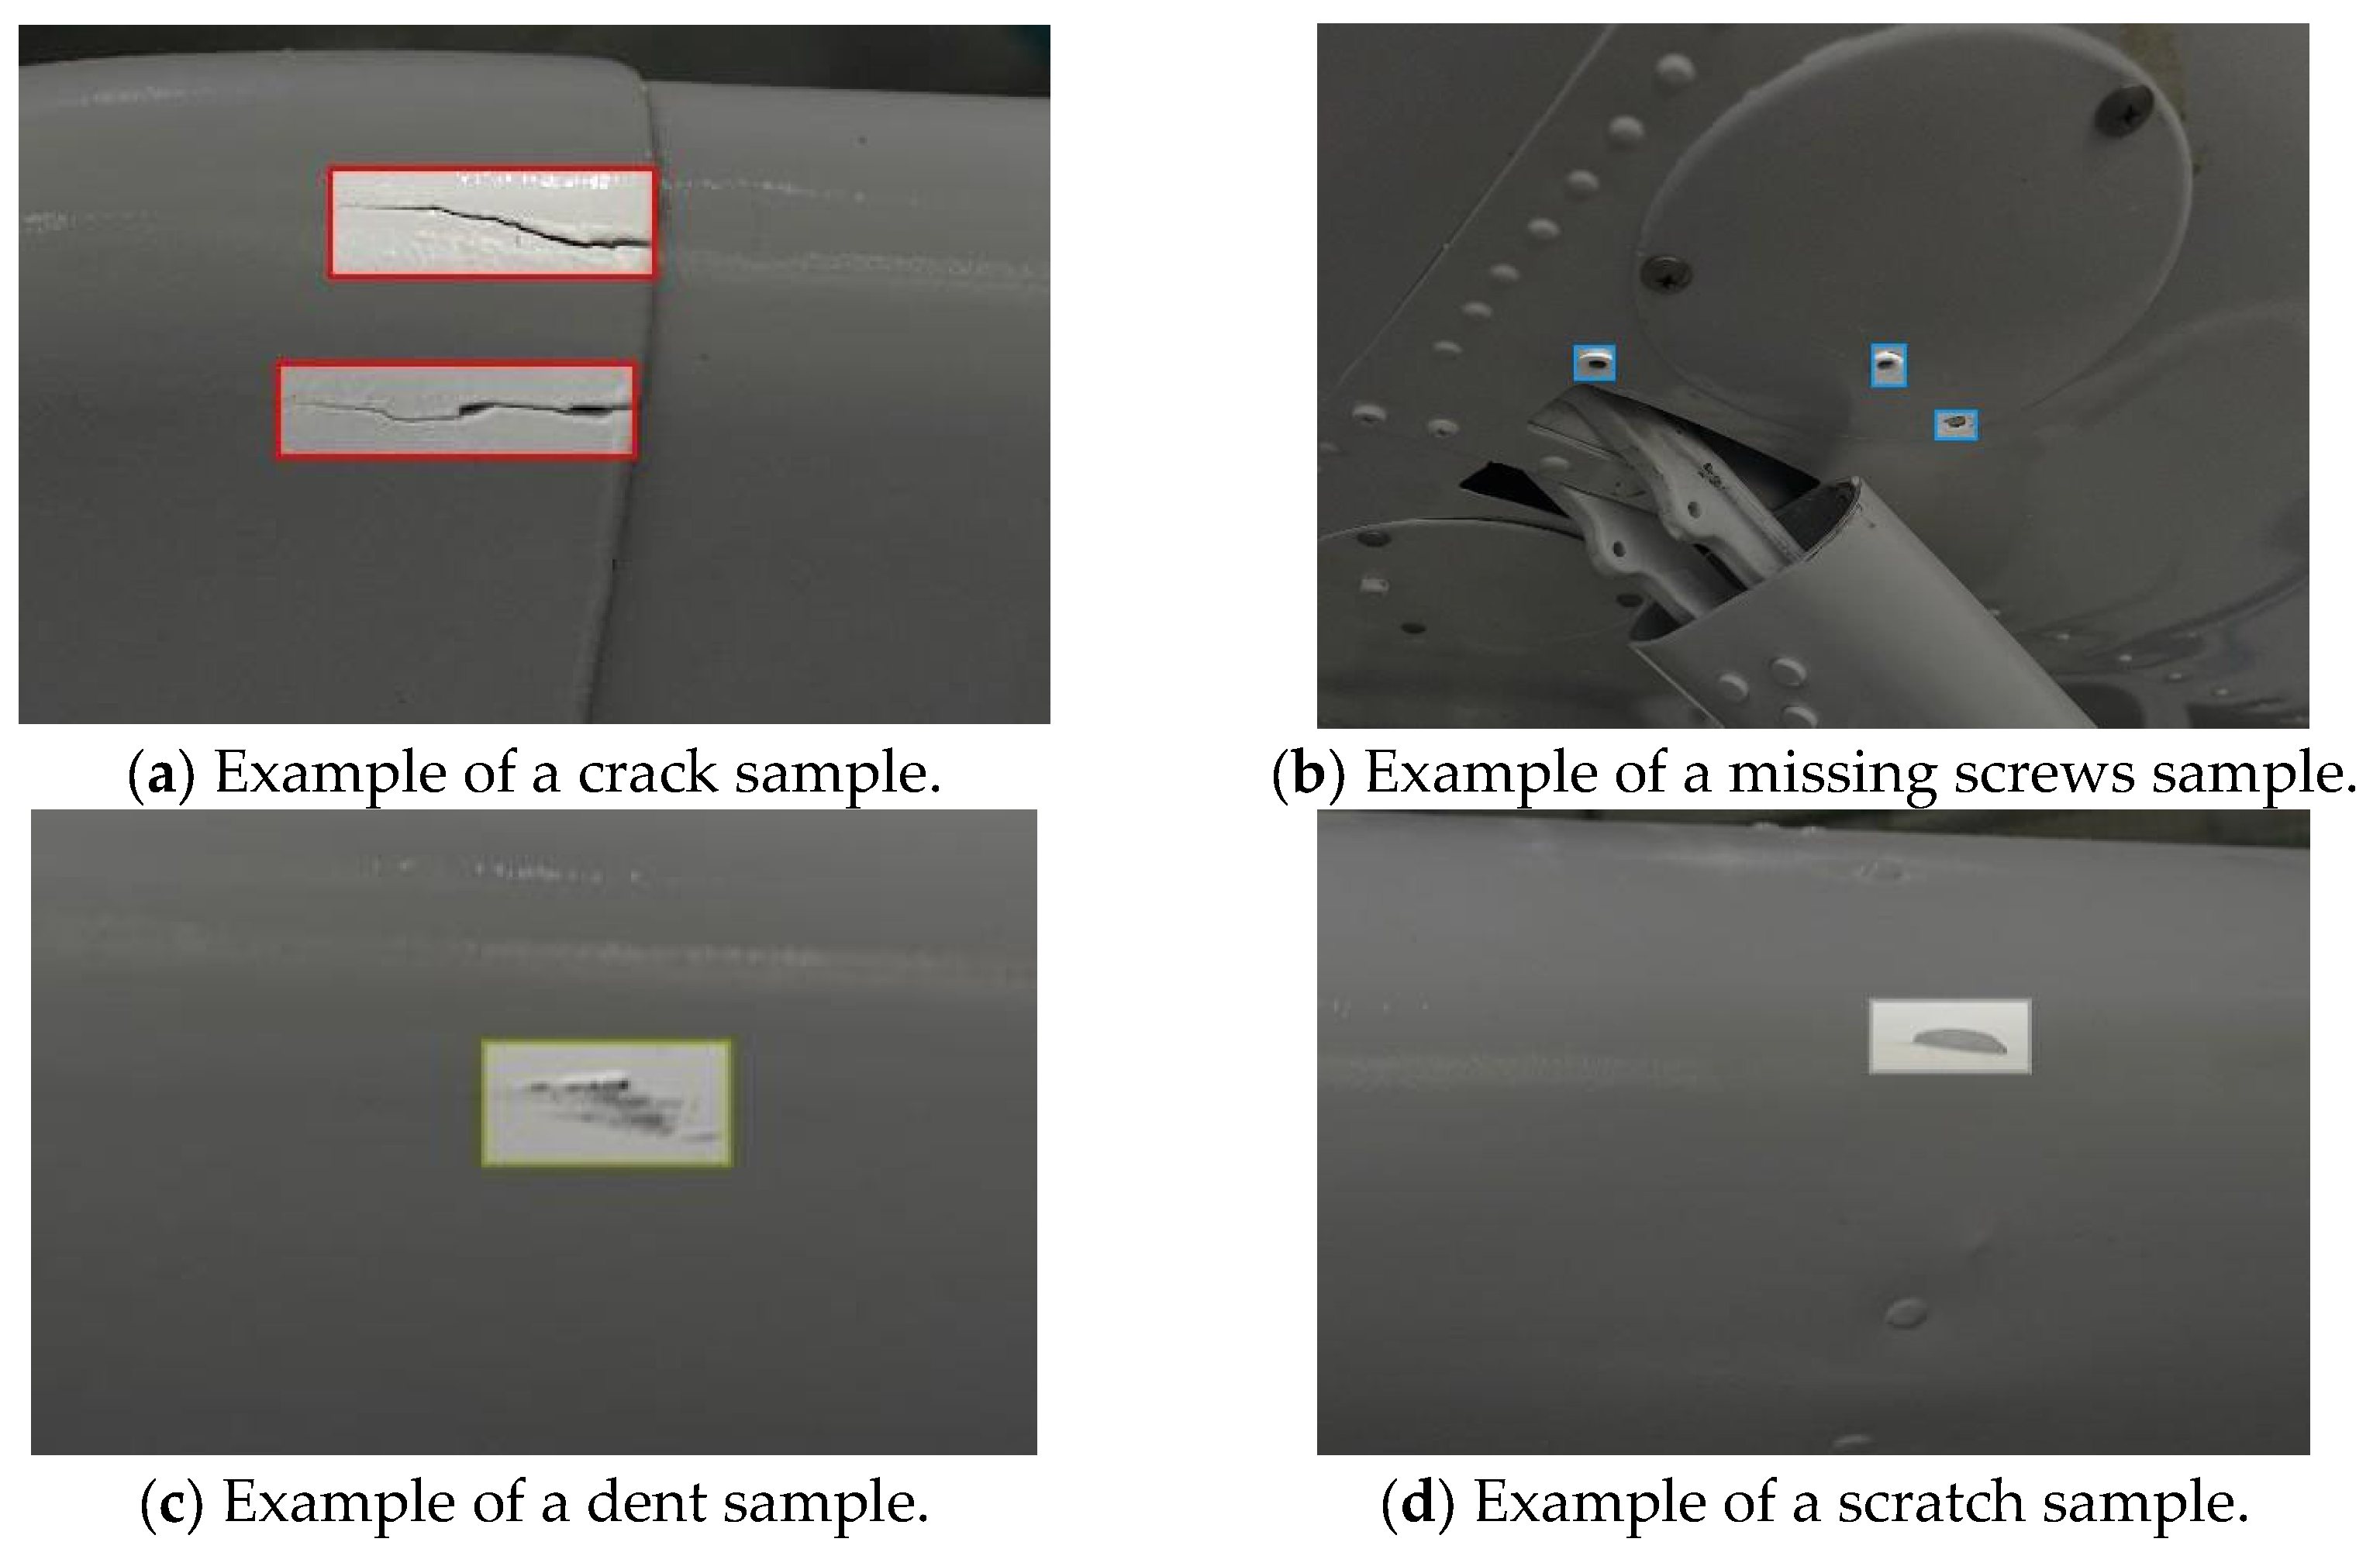
The most vital component of the system was the YOLO model, which was trained with images prepared according to the target defect types. During the image acquisition session, 1535 images were captured using an iPhone 12 Pro Max and a DJI UAV. The defect samples were captured repeatedly from different angles to lower the impact caused by the perspective of the cameras. Figure 1 shows examples of the images acquired, in which the colors frames indicate the different classification of the defects in the annotation tool, where red, blue, green, and grey stand for “cracks”, “missing screws”, “dent” and “scratch”, respectively. Please note that the color can be changed freely according to the user and only use for easy identification for frames in different classes.
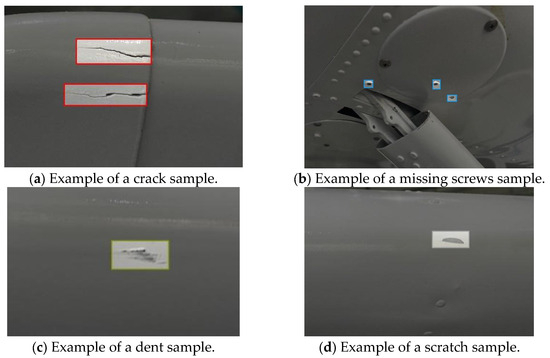
Figure 1.
Example images of various samples captured on the ground.
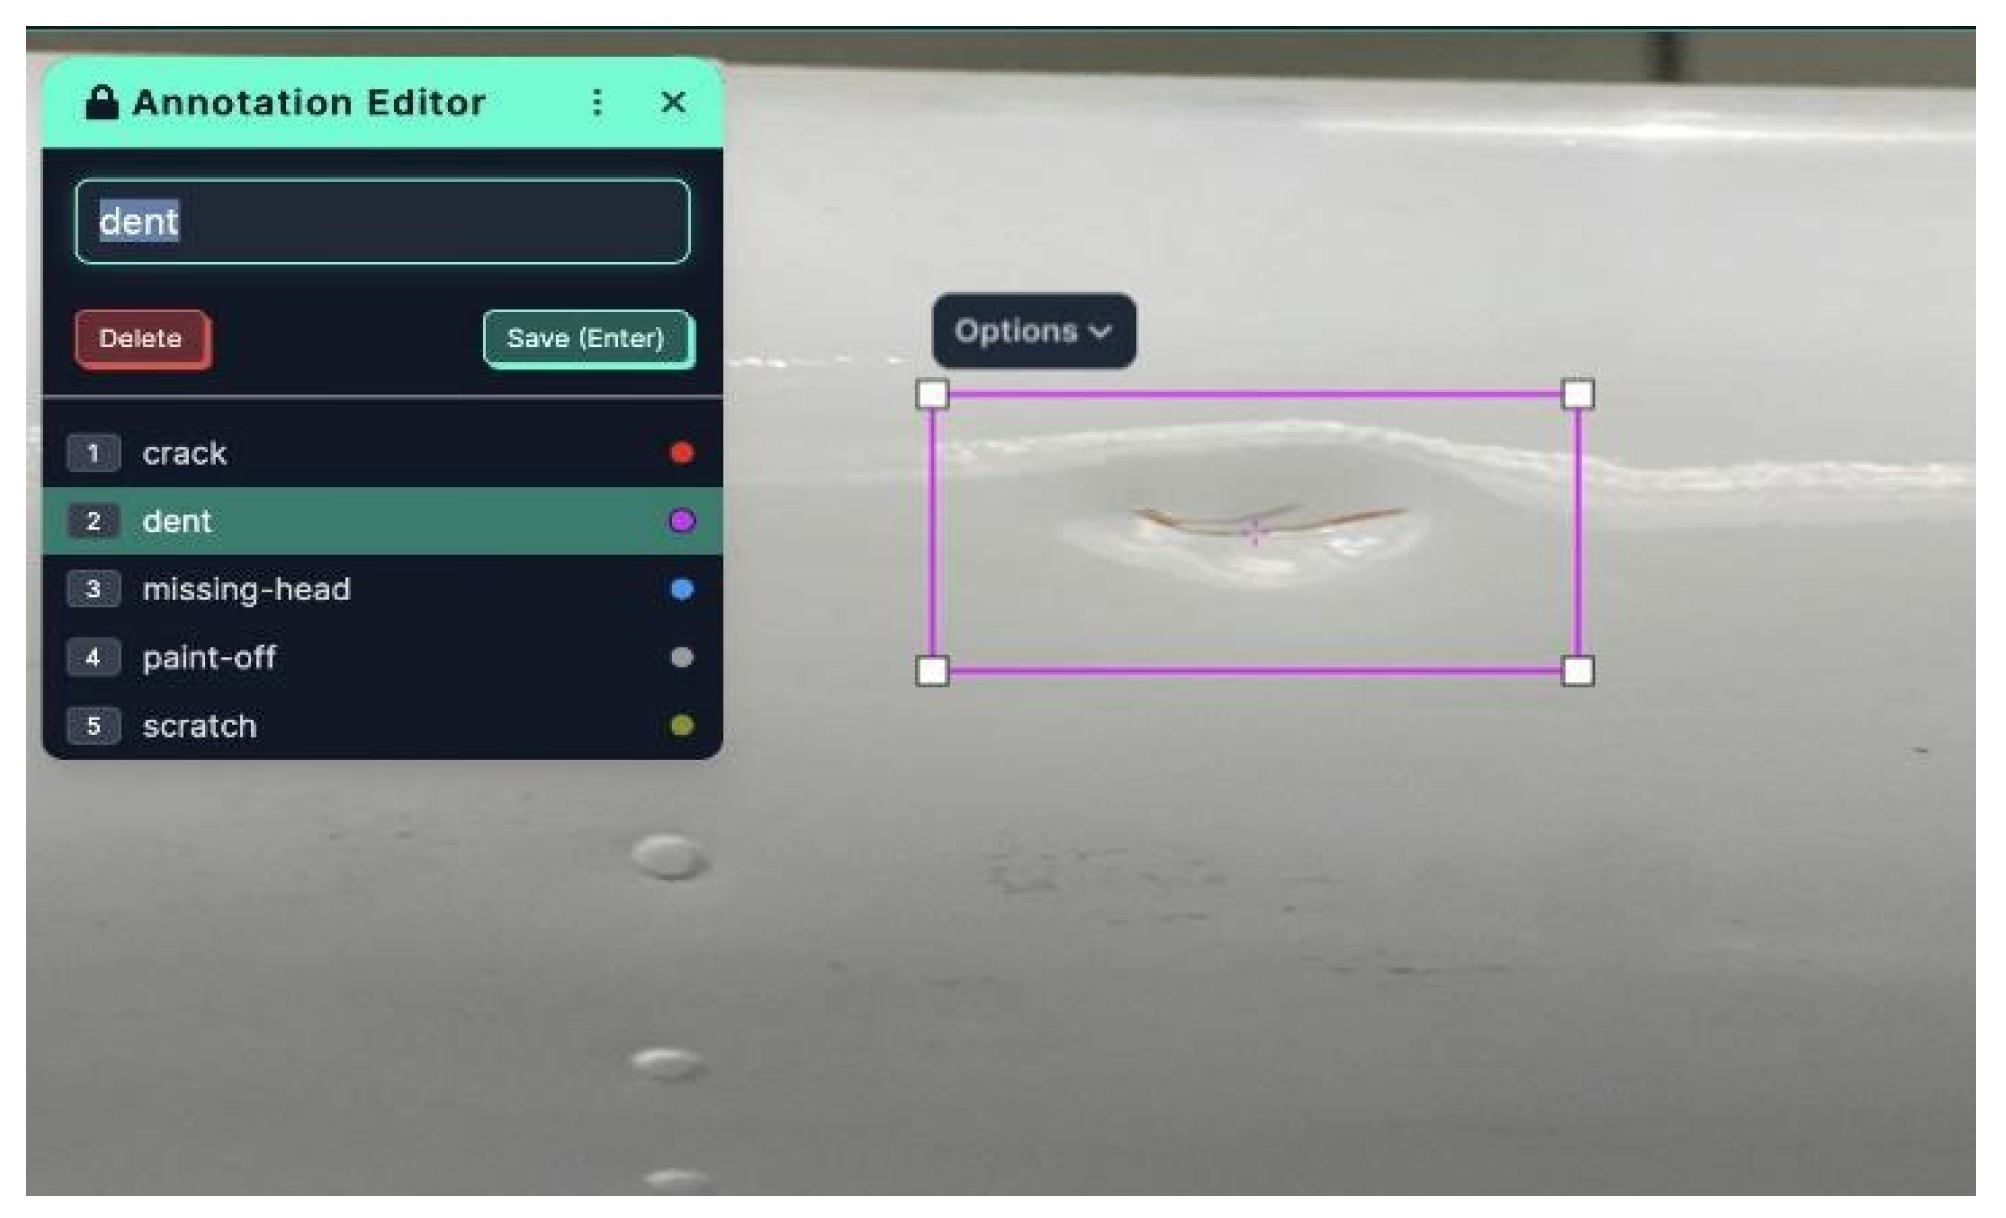
After collecting the images, they were subjected to an annotation process, which applied labels to the defects found. Data annotation involves labeling the target objects in the captured images, which helps the algorithm learn and detect specific objects. In this project, the annotation process was performed using Roboflow, an open-source tool that provides various helpful features for object detection model machine learning [10]. Figure 2 shows the interface of the tool used for labeling the sample images.
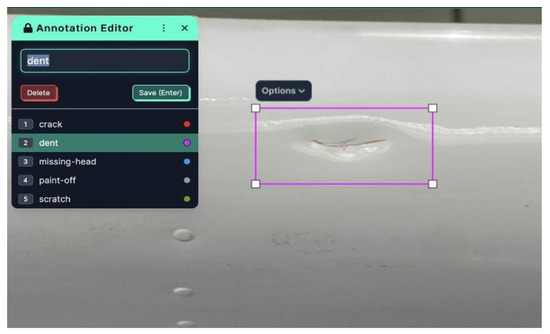
Figure 2.
The annotated dent sample.
Defects in the images were categorized into classes, resulting in 783 crack samples, 423 dent samples, 918 paint-off samples, 1054 missing rivet samples, 999 scratch samples and 421 null samples. With the tool provided by Roboflow, the images underwent an augmentation process, with features such as shear, which allows the model to observe more potential defect angles; exposure, which decreases the effect of light on the cameras; tile, which allows the model to perform better on smaller objects; and blur, which decreases the effects of camera focus on the model. The exported dataset consisted of 10,029 samples, with a null ratio of 85%. The ratios of the training, validation and testing sets were 70%, 20% and 10%, respectively. The following figure shows an example of the annotated images.
2.1. Algorithm Training
Programming was primarily performed via algorithm training using Visual Studio Code software version 1.93 [11]. Python was installed as a plugin and used as the interpreter to utilize the “YAML” training files provided by the official Ultralytics site [12,13]. A YAML file is a human-readable data serialization format primarily used for configuration files and data interchange in languages with varying data structures. It uses indentation to represent nested data structures, making it appear similar to JSON but more concise and user-friendly [14].
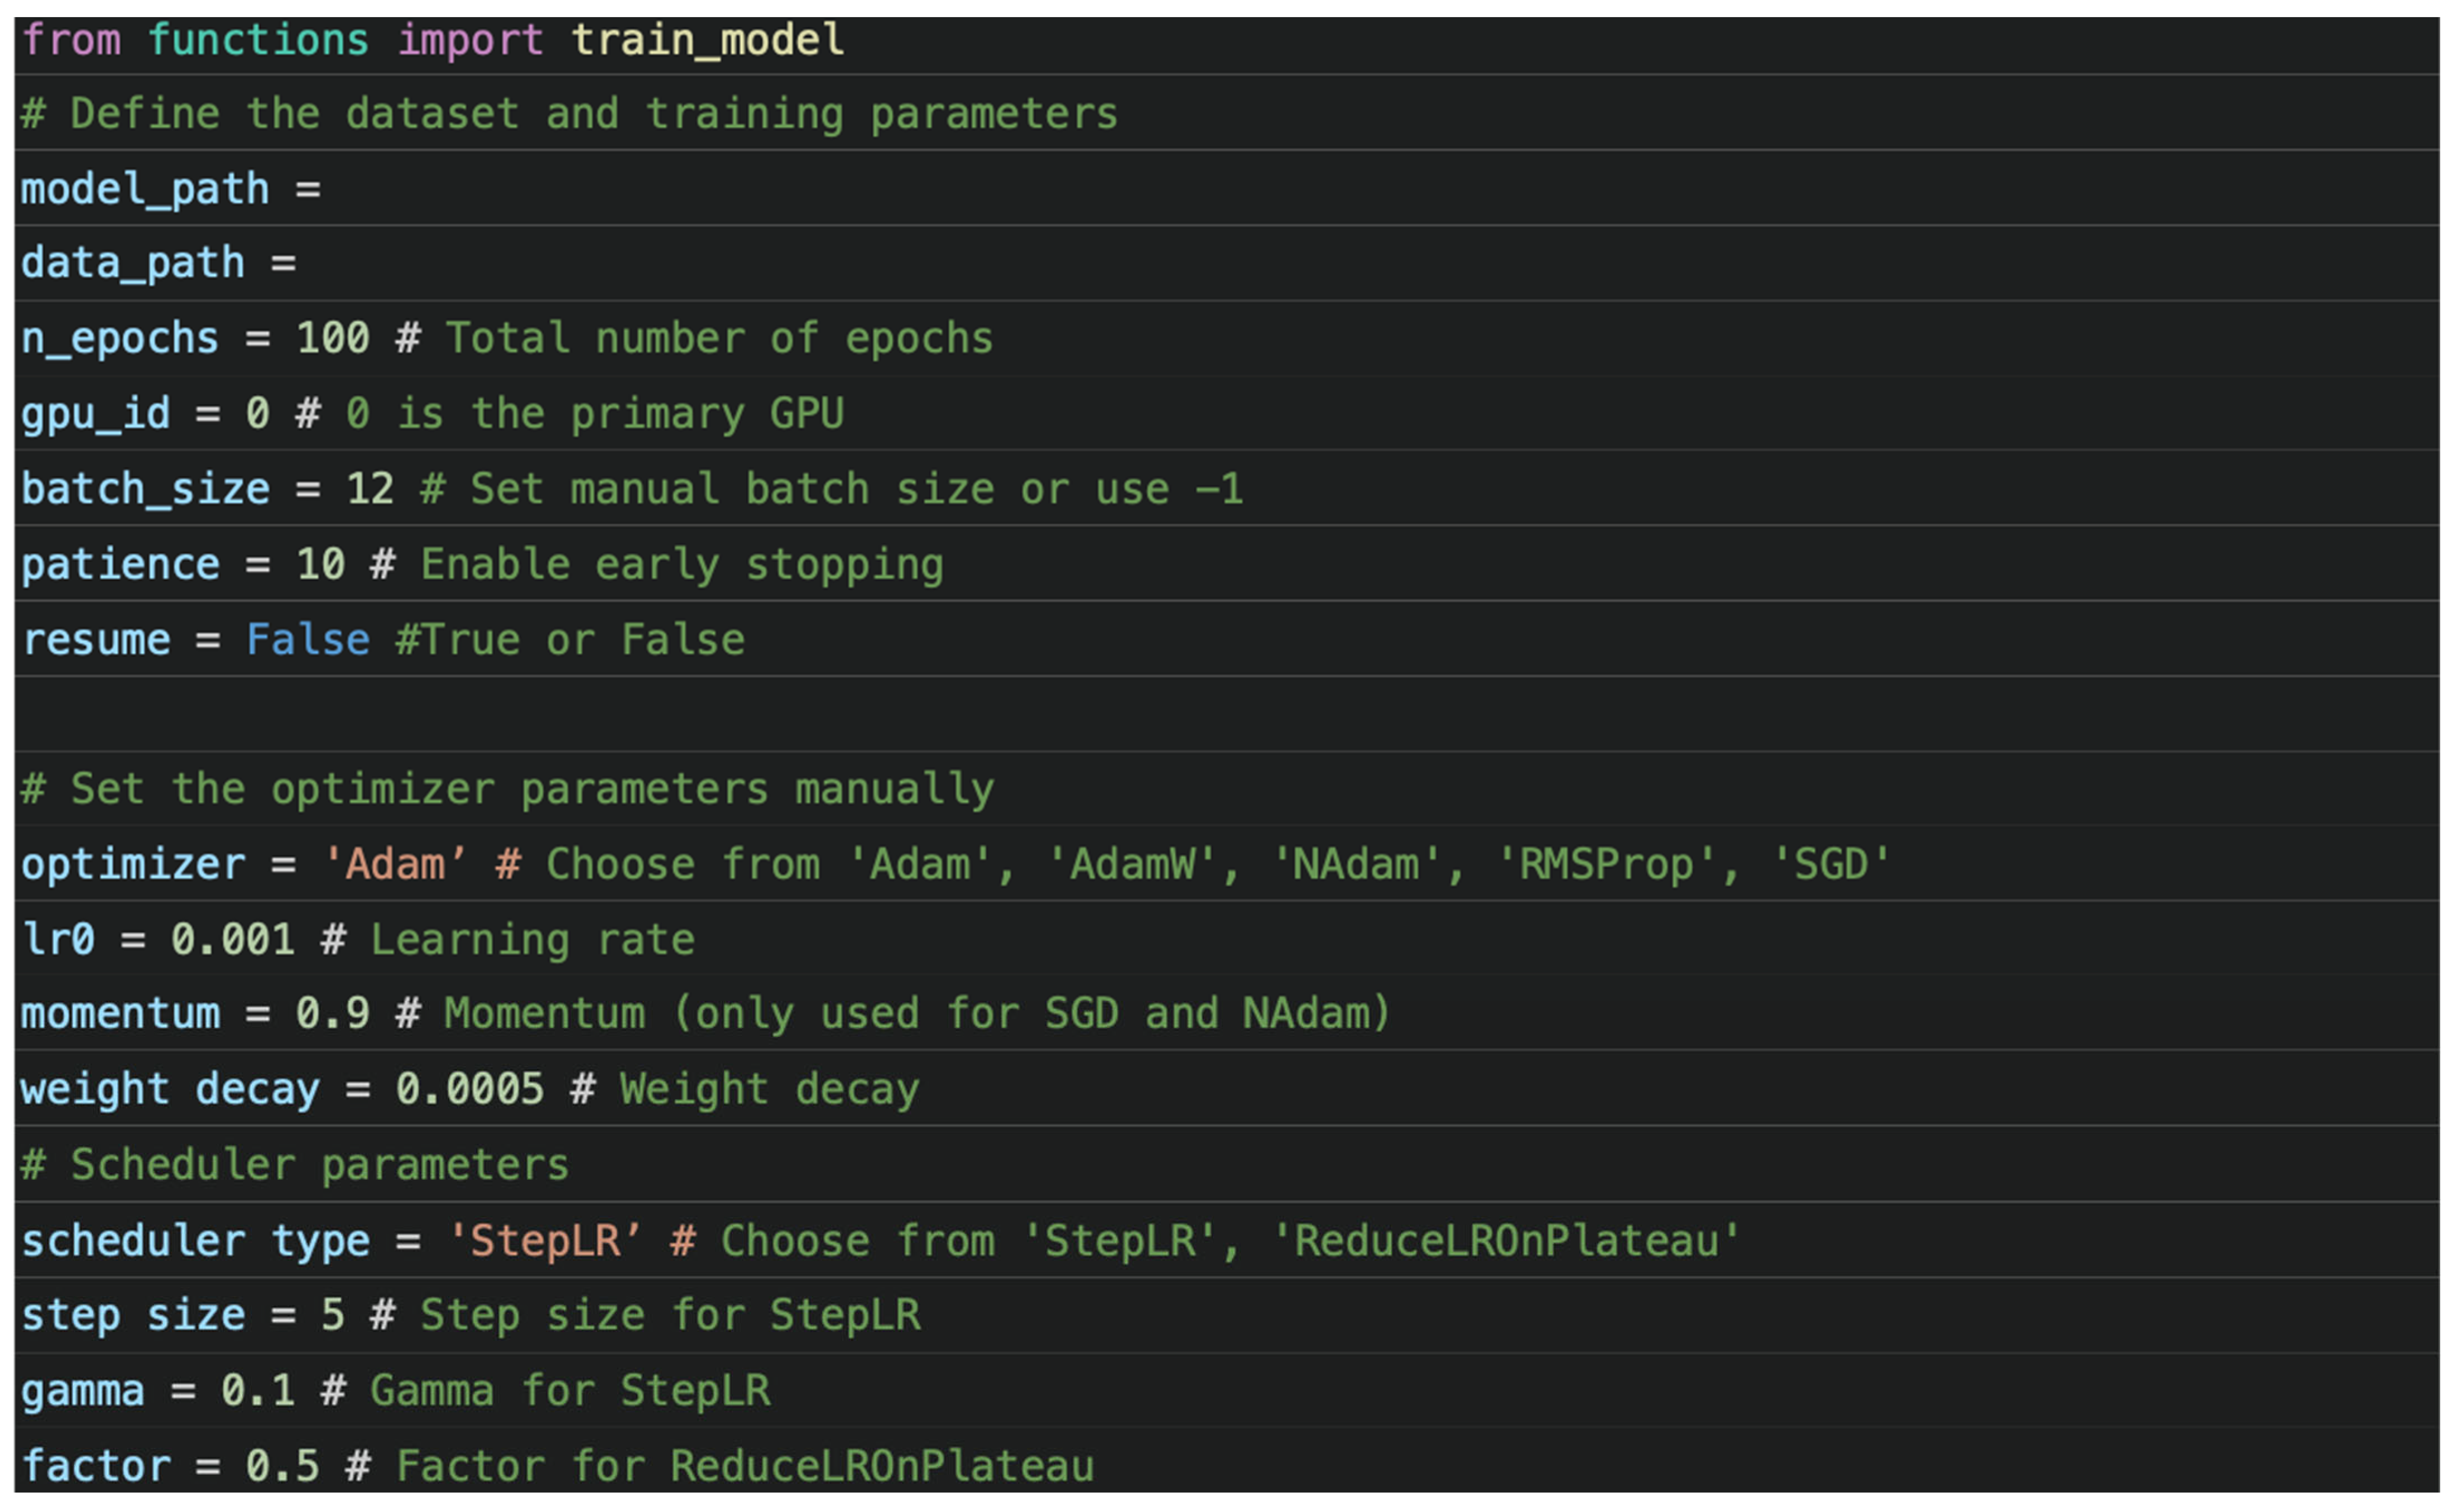
During the training process, YAML files were crucial, as they determined how the algorithm would learn and utilize information from the dataset. The Ultralytics library provides training materials, including the configuration files for YOLOv5 Nano (yolov5n.yaml), YOLOv8 Nano (yolov8n.yaml), YOLOv8 Small (yolov8s.yaml) and YOLOv9 (Compact and Enhanced). These configuration files represent different versions of YOLO, which were used as learning materials for custom-trained models during the study [13]. The Ultralytics GitHub repository [13] initially provided the code used during the training. Modifications were made to suit the specific requirements of this study better. The code is divided into two parts, where “function.py” contains most of the functions that control the parameters of the training process, while the other one, namely “main.py”, allows the user to adjust the value of the perimeters and return it to “function.py”. Figure 3 demonstrates the code in “main.py”.
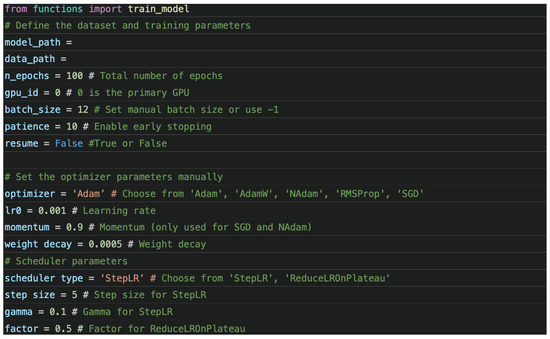

Figure 3.
Code example in “main.py”.
There were several settings that were found in the “main.py”. These are further explained as follows:
- data_path: Specifies the path to the dataset configuration file. This file, typically in YAML format, contains information about the training, validation and testing datasets, as well as the class names and other parameters [14].
- n_epochs: Sets the number of epochs for training. An epoch is one complete pass through the entire training dataset. The number of epochs determines how many times the model will iterate over the dataset during training [1].
- batch_size: Defines the batch size, which is the number of training samples used in one iteration. Batch size impacts the model’s training speed, memory usage and convergence behavior [15].
- patience: Sets the patience parameter for early stopping. This parameter controls how many epochs with no improvement in validation performance will be tolerated before stopping the training early [1].
- optimizer: Specifies the optimizer to be used for training. The optimizer adjusts the model’s parameters based on the computed gradients to minimize the loss function. Common optimizers include “SGD”, “Adam” and “NAdam” [16].
- lr0: Sets the initial learning rate for the optimizer. The learning rate controls the size of the steps the optimizer takes when adjusting the model’s parameters [17].
- momentum: Sets the momentum parameter, which is used to accelerate the optimizer in the relevant direction and dampen oscillations. This parameter is particularly useful for optimizers like SGD and NAdam [18].
- weight_decay: Specifies the weight decay (also known as L2 regularization) parameter, which helps prevent overfitting by adding a penalty to large weights [19].
- device = 0: Specifies the device to be used for training. device = 0 refers to the primary GPU of the computer. This allows users to specify which GPUs to use when there are multiple GPUs available. Setting device = −1 would use the CPU instead of a GPU [20].
- Scheduler: A component used to control the learning rate during model training. A scheduler reduces the learning rate as the training progresses, helping the model make finer updates.
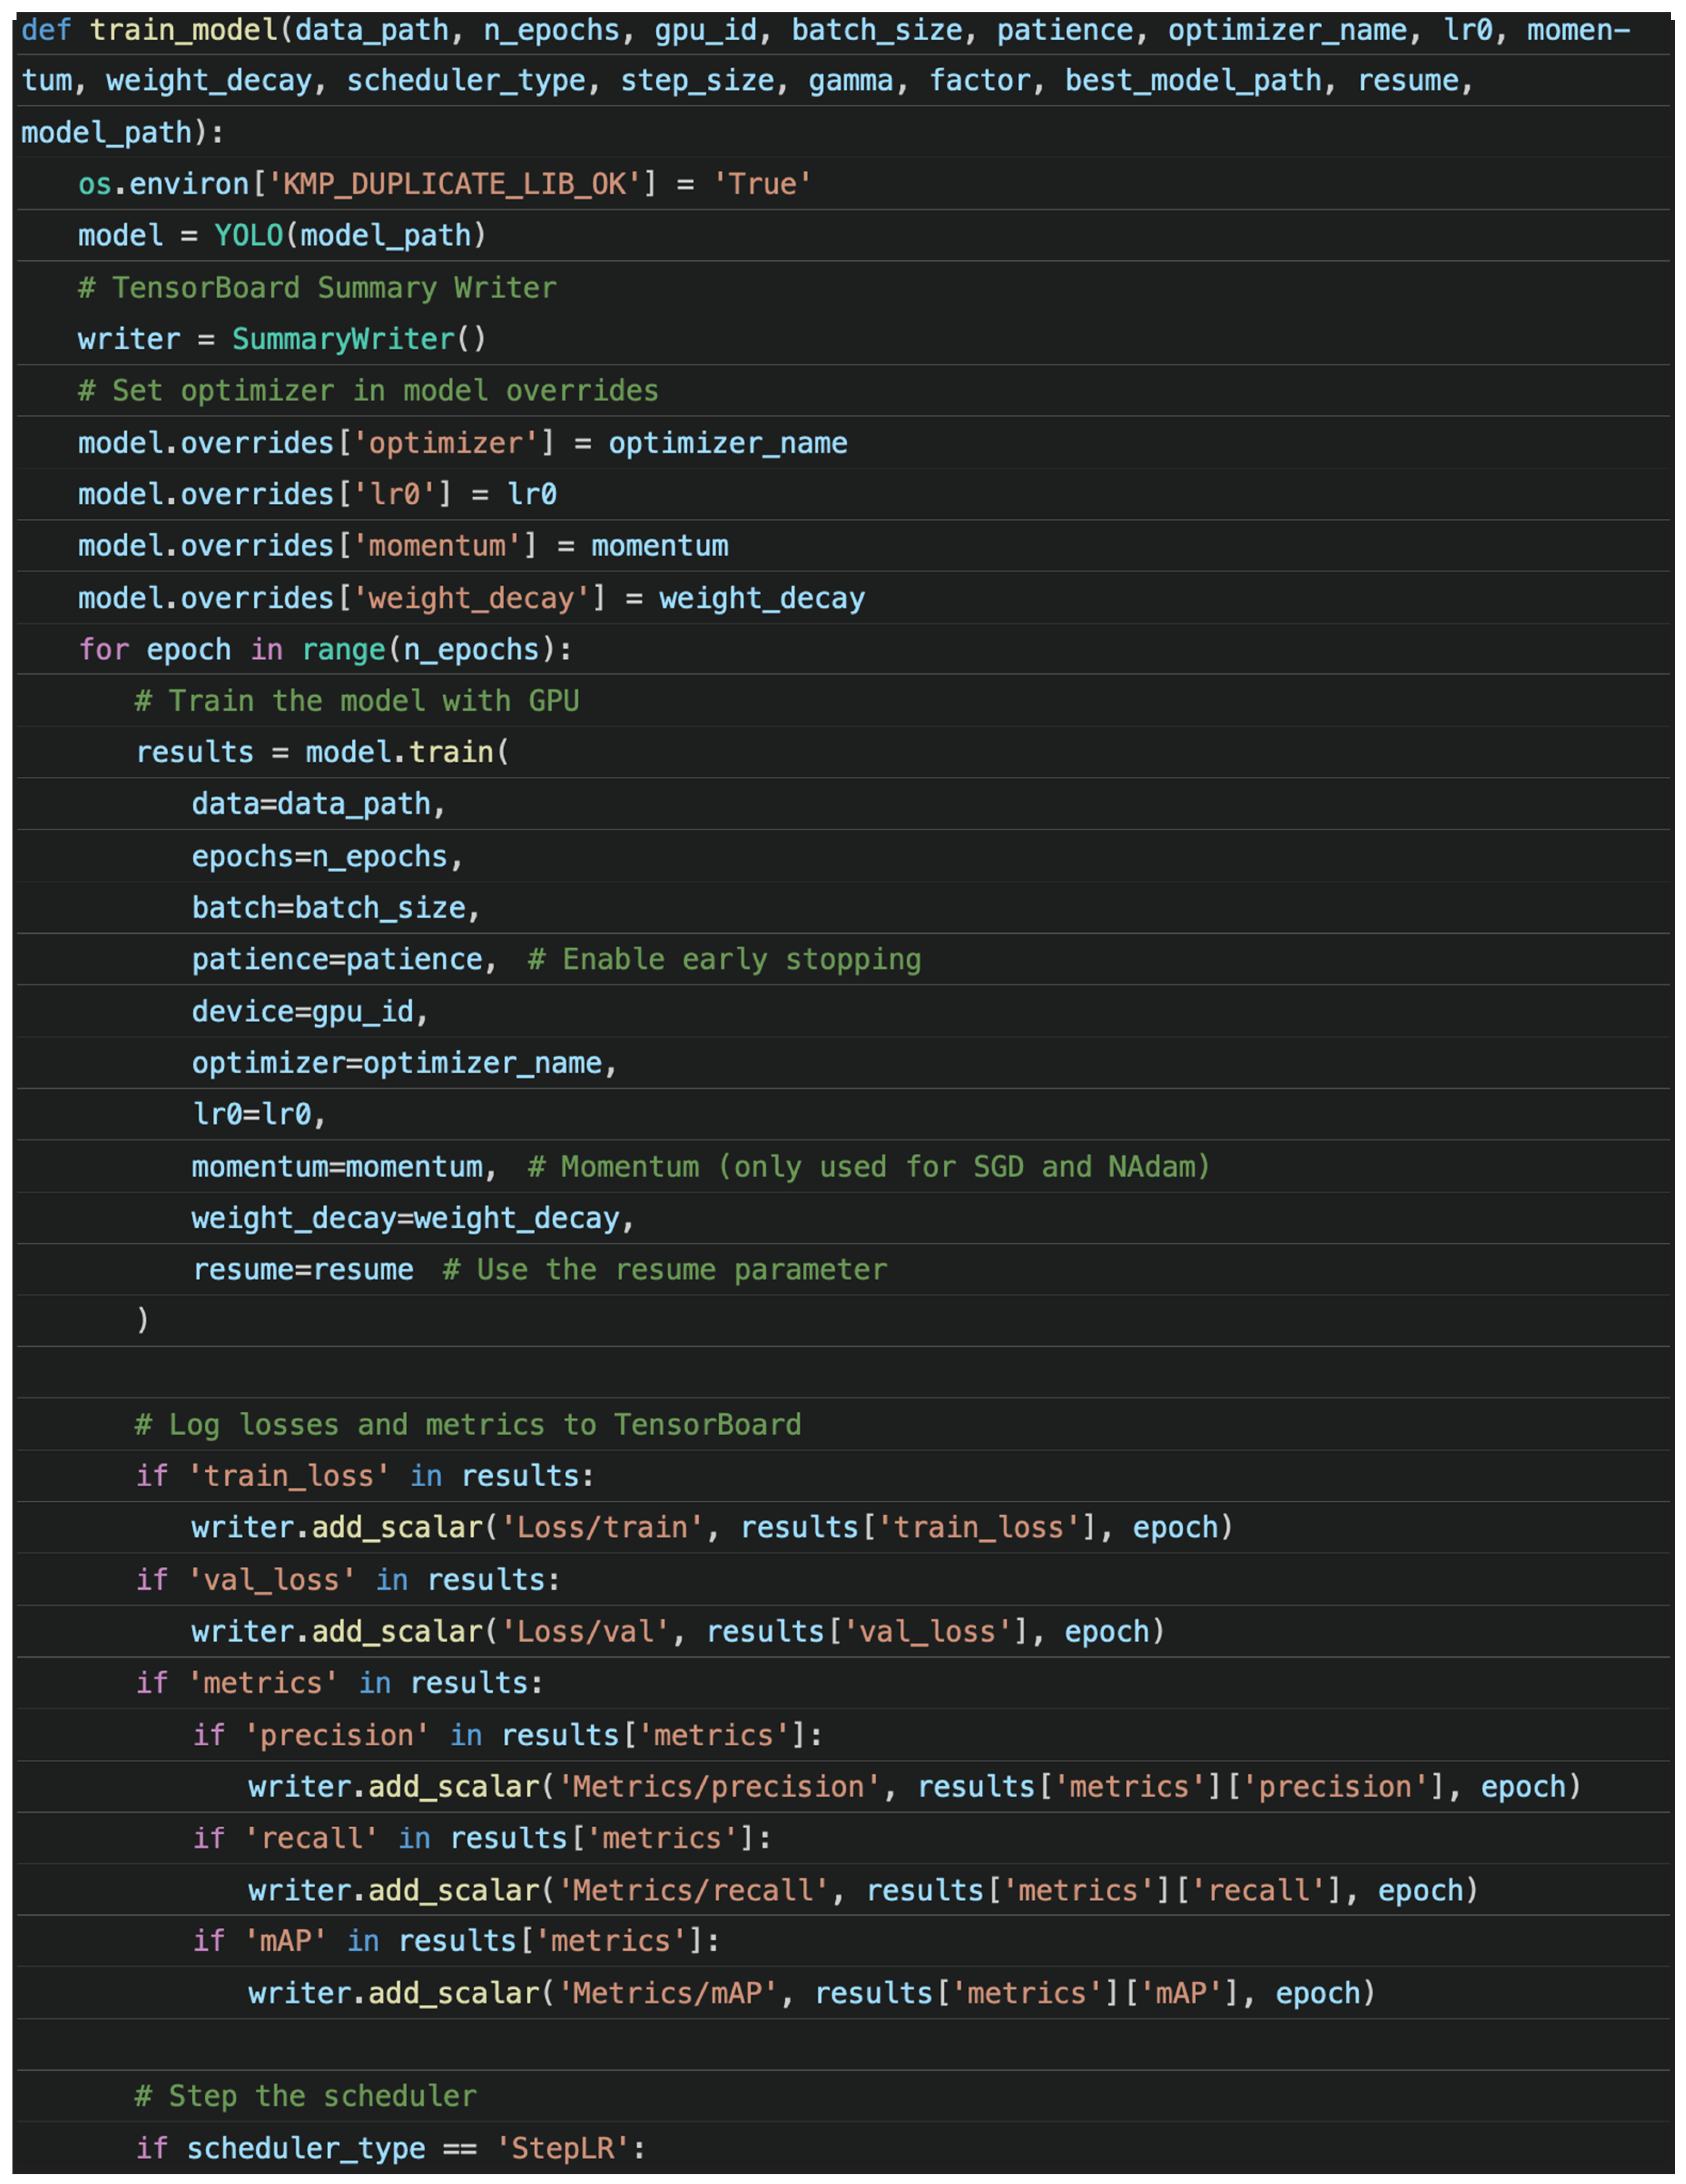
“Main.py” defines the training parameters as global variables—whereby they are named according to the functions in “function.py”—and performs the training process. Figure 4 describes code found in “function.py”.

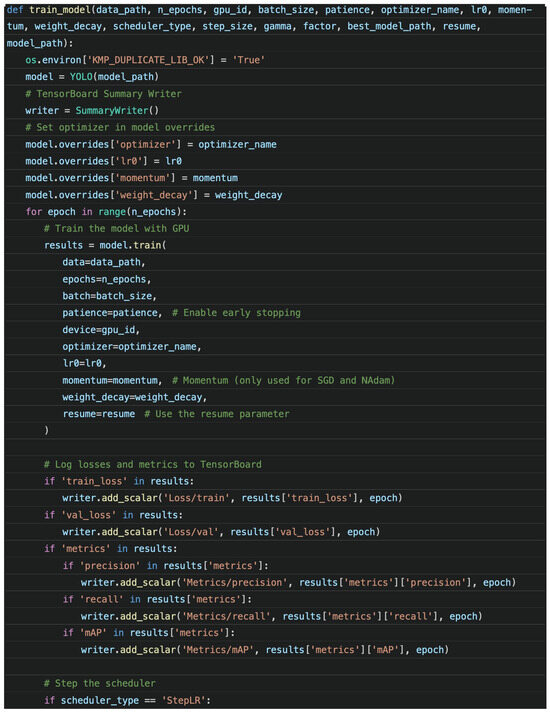

Figure 4.
Code examples in “function.py”.
Tensorboard was included to better observe the training process, where the loss scores, the mAP scores and the change in learning rates generated by the “scheduler” were plotted as graphs, allowing users to determine the quality of the training. In this part of the code, the model.train() function uses the parameters adjusted in “main.py” and undergoes training.
In deep learning and machine learning, especially with frameworks like YOLO, a “data. yaml” file is a configuration file formatted in YAML. This file specifies the dataset paths, class names and other essential parameters needed for model training [14,21]. Several parameters can be defined and may potentially result in different outcomes. The “epoch” parameter specifies the number of times the training process will be repeated. Generally, more epochs allow the model to learn better, given adequate training resources. The “batch size” parameter refers to the number of training samples processed in one iteration. An iteration refers to a single update of the model’s parameters. During one iteration, a batch of data is passed through the neural network; the loss is calculated; and the model’s parameters are adjusted based on the gradients computed from the loss [1]. The calculation for iterations is shown in Equation (1).
where
- it represents the number of iterations;
- bs is the batch size;
- e is the number of epochs;
- N is the total number of training samples.
The choice of batch size significantly impacts the model’s convergence, training time and generalization performance. A smaller batch size can lead to noisy gradient estimates but may result in faster convergence and better generalization. Conversely, a larger batch size provides more accurate gradient estimates, potentially improving the hardware efficiency, but it may lead to poorer generalization and require more memory [1,15,22].
Additional training parameters include box loss, class loss and distribution focal loss (DFL). In neural network training, the loss values gauge how accurately the model’s predictions align with actual outcomes. Box loss assesses the variance between predicted bounding boxes and ground truth boxes, employing intersection over union (IoU) as a standard accuracy metric. The formula for IoU is presented as Equation (2) [23,24].
Class loss measures the error in classifying objects within bounding boxes, commonly utilizing cross-entropy loss to quantify the disparity between the predicted probability distribution and actual distribution. The formula for cross-entropy loss is provided in Equation (3) [1].
DFL focuses on difficult-to-classify samples by assigning them higher weights, thereby aiding the model in learning from challenging cases. The formula for DFL is presented in Equation (4) [25].
where
- Pt is the predicted probability for the true class;
- αt is a scaling factor;
- r is the focusing parameter.
During training, the objective is to minimize the loss function. A lower loss value indicates that the model’s predictions are closer to the actual values, which signifies better performance. Upon completing the training, two output files with the “.pt” extension will be generated: “best.pt” and “last.pt”. A “.pt” file is a PyTorch file that stores tensor information, typically containing the model’s architecture, parameters and any additional information required to recreate the model’s state [20]. Figure 5 shows the terminal output in Visual Studio Code during the training process.

Figure 5.
Terminal readings in Visual Studio Code showing metrics’ values.
Several metrics are stated in the terminal in Figure 5, namely precision, recall and mAP. The calculations for evaluating the model’s performance are shown in Equations (5)–(8) [26].
- Precision (P): The ratio of correctly predicted positive observations to the total predicted positives. It measures the accuracy of the positive predictions made by the model. High precision indicates a low false positive rate.
- Recall (R): The ratio of correctly predicted positive observations to all observations in the actual class. It measures the model’s ability to detect all relevant instances. High recall indicates a low false negative rate.
- Average Precision (AP): The area under the precision–recall curve for a single class.where Rn and Pn are the recall and precision at the nth threshold.
- mAP: The mean of the average precision values for all classes.where N represents the number of classes, and APi denotes the average precision for the ith class. The objective of model training is to achieve the highest possible values for these three metrics with the given dataset. Hyperparameters such as the learning rate, weight decay and momentum can be further fine-tuned to enhance the model’s performance.
In this project, several models were tested to identify the best-fit models for the prepared dataset and equipment specifications. Various models from YOLO version 8 were evaluated, including “nano (n)”, “small (s)”, “medium (m)” and “large (l)”. Table 2 provides basic information on the performances and computational requirements (FLOPs) of the version 8 models.

Table 2.
YOLOv8 model performance metrics [27].
The models underwent a training session using a custom database from Roboflow [7], which included five classes: crack, dent, missing head, paint-off and scratch. The following graphs demonstrate the performance of various YOLO models tested under this environment for 100 epochs, with a batch size of 16 and early stopping patience set to 5 to halt training when no further improvement is achieved. The optimizer was set to “auto”, applying default hyperparameters, such as learning rate = 0.01, momentum = 0.9, weight decay = 0.0001 and optimizer = “SGD”.
2.2. Mobile Devices’ Application Development (iOS)
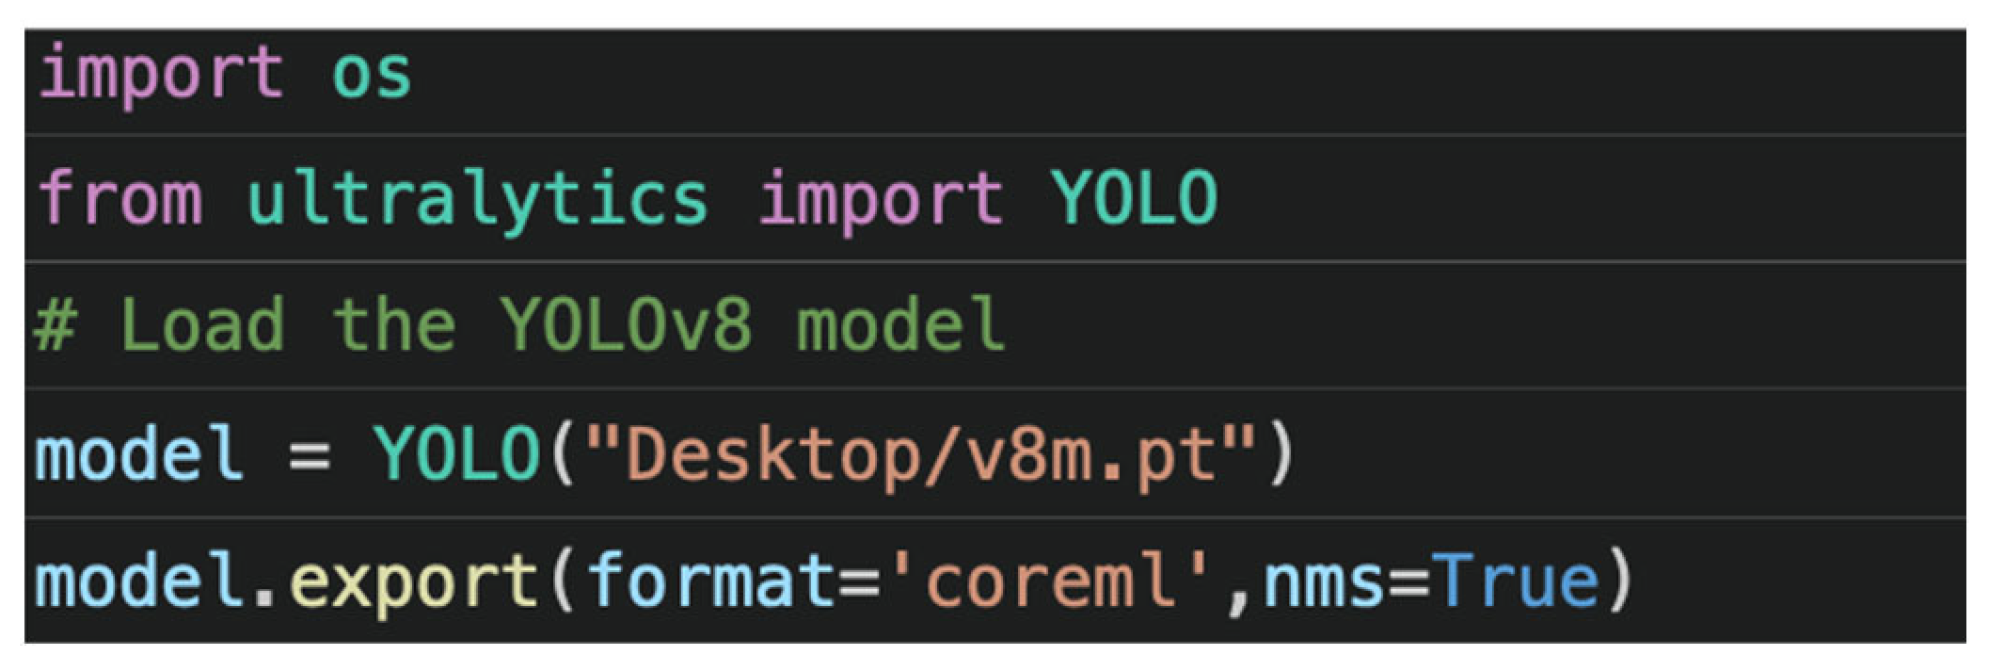
The application developed in this study focused mainly on utilizing the trained model from the training session to detect defects in real-world aircraft. By default, the trained weights are saved in PyTorch format. To make them compatible with an iPhone application, they need to be converted to a format that the iOS can read. Figure 6 shows the code for converting the trained weights to CoreML format [13].
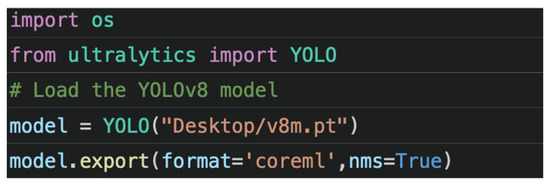
Figure 6.
Python code for converting PyTorch formatted weight to CoreML.
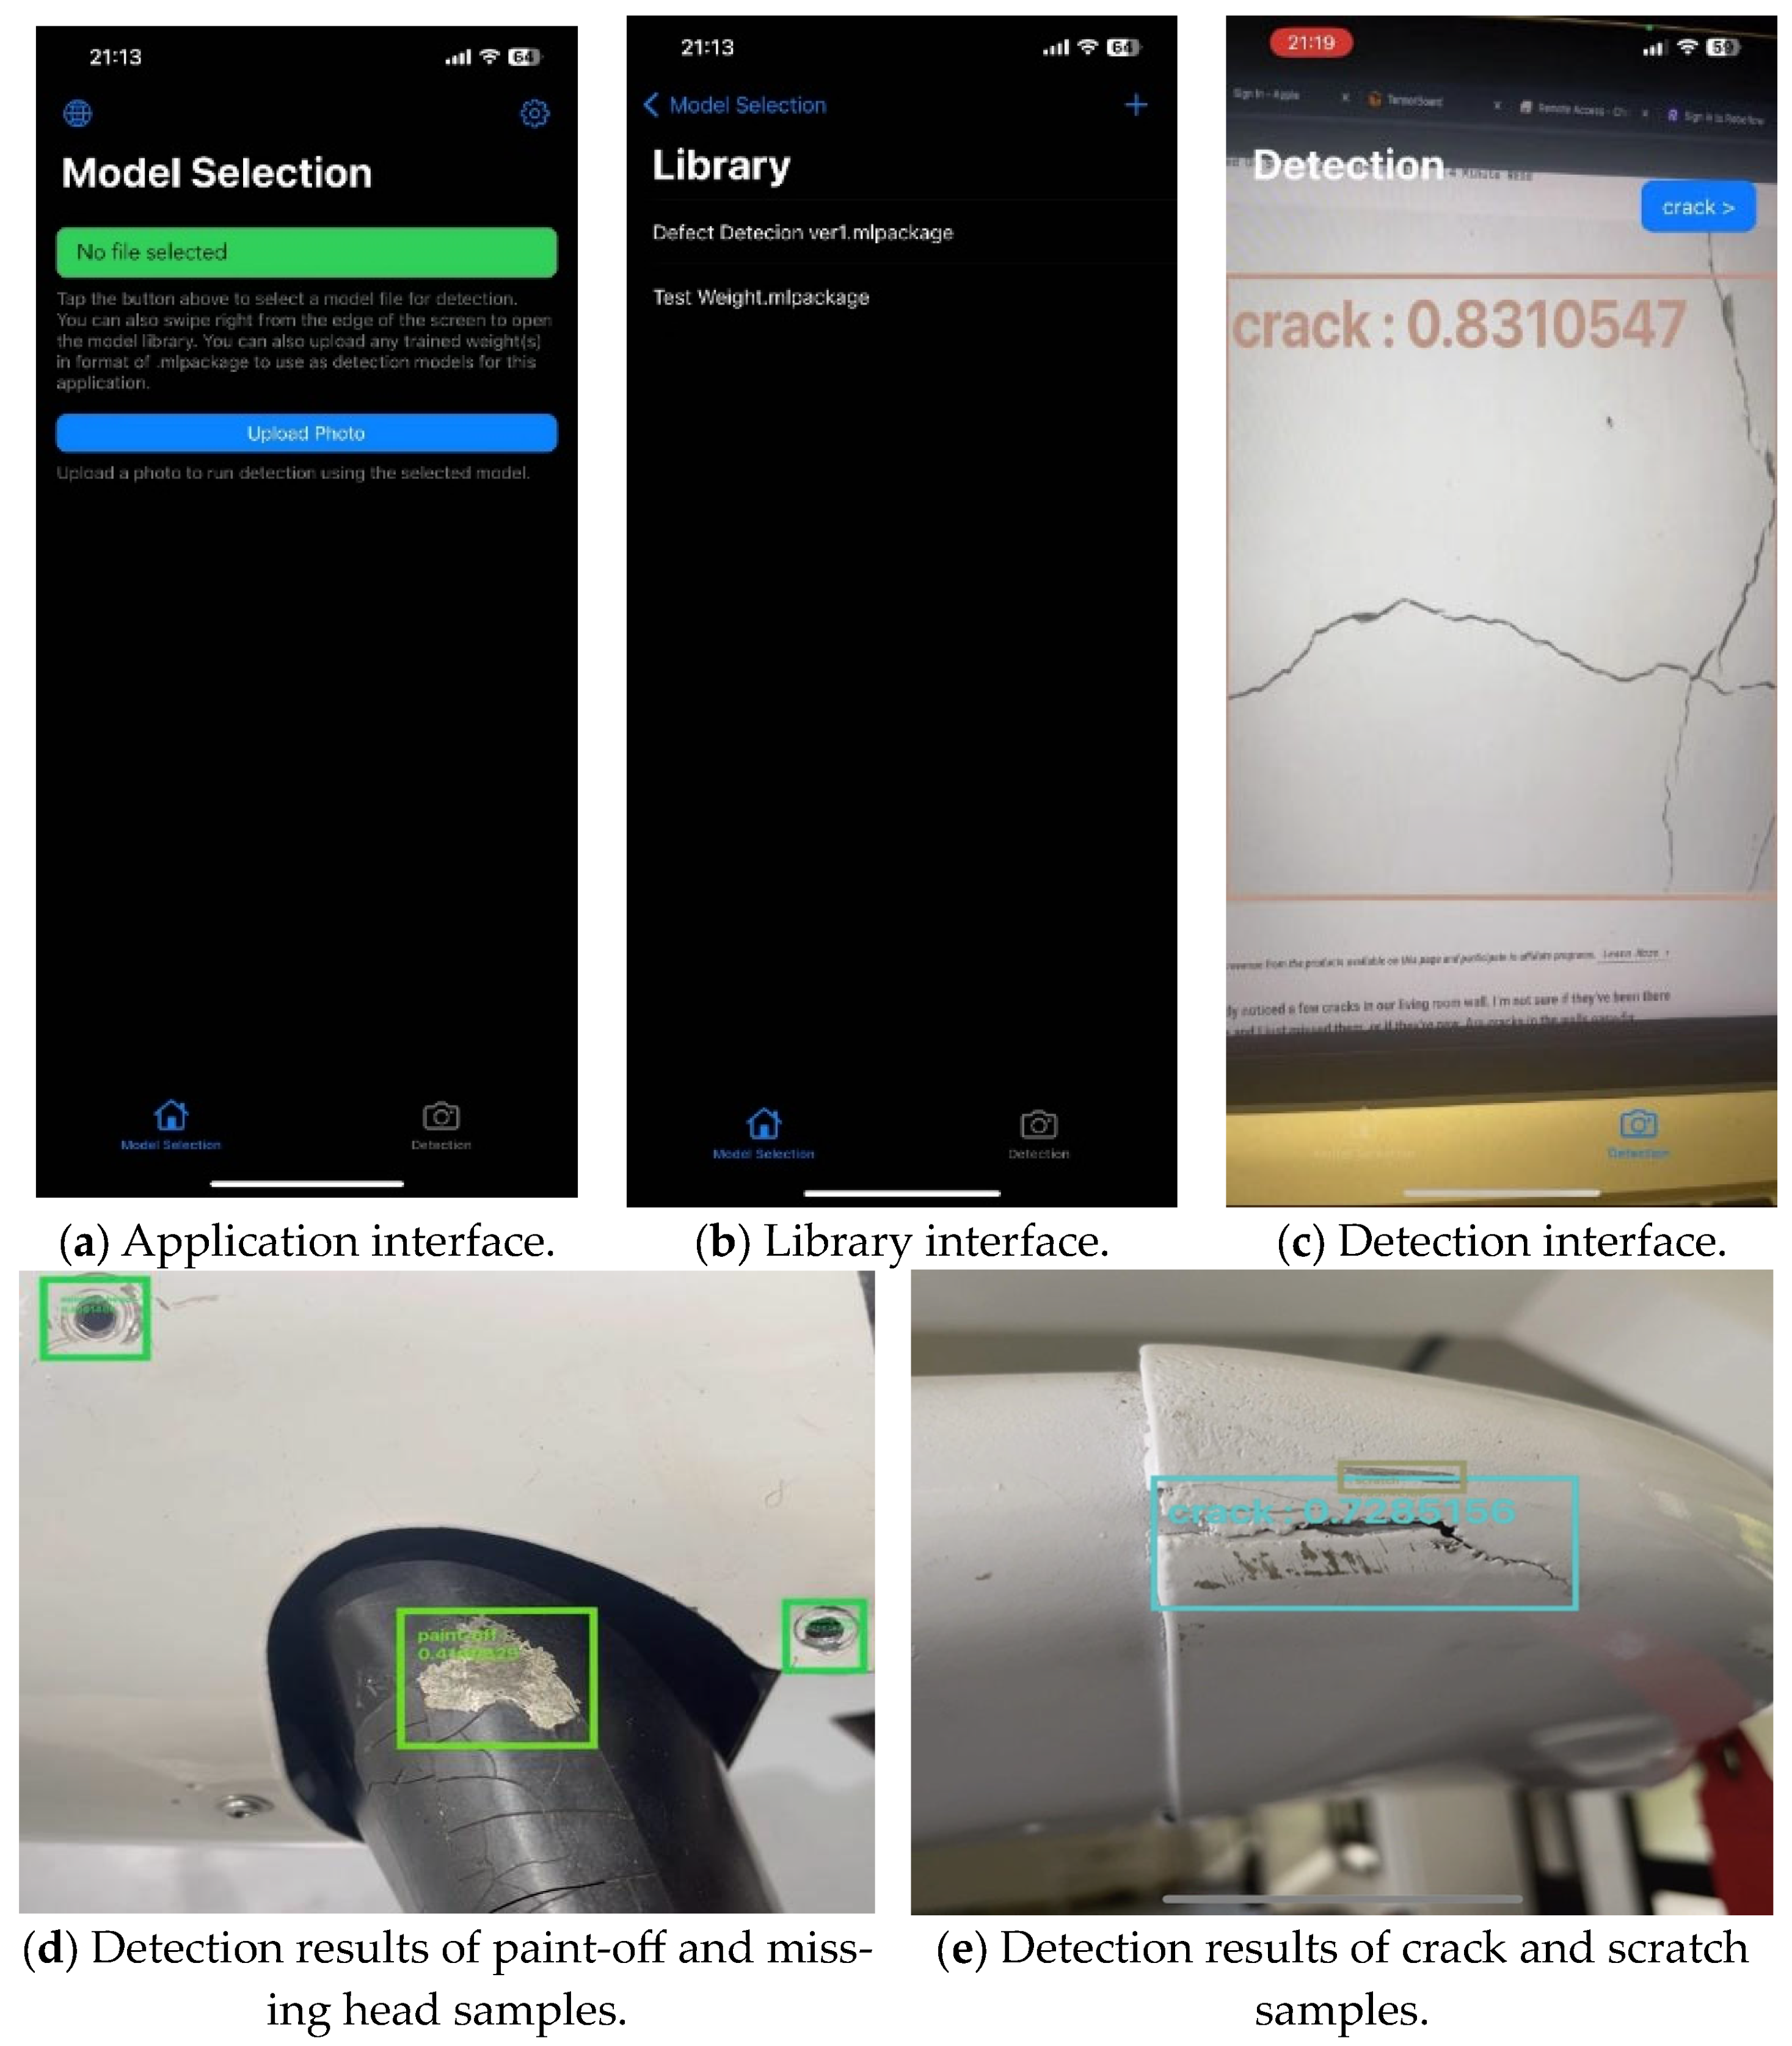
This resulted in a “.mlpackage” file. The detection source code was provided by Majima D. [28]. It was designed to read the data stored in the weight files and perform predictions using imagery input from the device’s built-in cameras. The mentioned source code was further developed and aimed for the users to easily perform detection, also allowing them to freely change the weight for any specific jobs. The following Figure 7a–e show examples of detections utilizing the application.
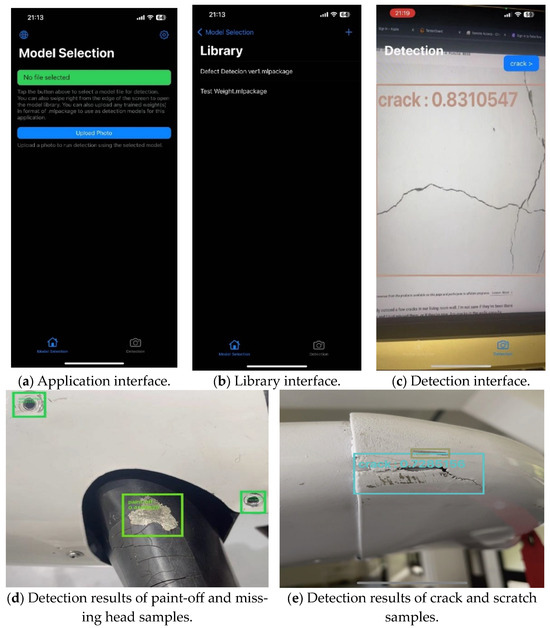
Figure 7.
Example images of detection results.
2.3. RTMP Server Construction
In the server construction section, a Real-Time Messaging Protocol (RTMP) server was chosen as the primary solution due to its low latency and convenience [7]. The server was set up on a Raspberry Pi running Ubuntu operating system (OS) version 22.04 [29]. Ubuntu was selected due to its compatibility with the NGINX software, NGINX_RTMP_Version "1.1.4", which was demonstrated during several test runs, while the Raspberry Pi OS occasionally reported unknown errors. After successfully installing Ubuntu OS, NGINX was installed with the RTMP module. To enable RTMP service on NGINX, the following settings were added to the “nginx.conf” configuration file of the software [7].
| rtmp { server { listen 1935; chunk_size 4096; allow publish 127.0.0.1; # IP address of the device(s) deny publish all; application live { live on; }}} |
Upon the setting, the server would be ready to launch and use for imagery transfer. Figure 8 shows the status window appearing after a successful boot up of the server.

Figure 8.
The terminal of Ubuntu OS reporting status of the server.
After configuring the nginx.conf file, the server was ready for internal network access. User can access the server within the same internal network by using URL: http://IP:1935/live/streamkey, where the device’s IP address can be identified using the ifconfig command. The stream key can be configured according to the user’s needs. The next step involves configuring the firewall to allow access from outside to port 1935 by setting up port forwarding on the router [7]. The port forwarding settings are as follows:
- Access your router’s web interface;
- Navigate to the port forwarding section;
- Create a new port forwarding rule:
- –
- Service Name: RTMP Server
- –
- Protocol: TCP
- –
- External Port: 1935
- –
- Internal IP Address: (IP address of your Raspberry Pi)
- –
- Internal Port: 1935;
- Save the settings.
With the port forwarding settings configured, external access to the server is enabled for publishing or streaming content. For additional security, the “allow publish” setting in the nginx.conf file can be configured to prevent unwanted connections from unknown sources. Ensuring that only trusted IP addresses can publish to the server is essential, reducing the risk of unauthorized access. SSL/TTLS encryption for the RTMP stream can further enhance security by encrypting the data transmitted between the server and the clients. This can be achieved by configuring NGINX to use secure certificates, ensuring all communications are encrypted and safe [30].
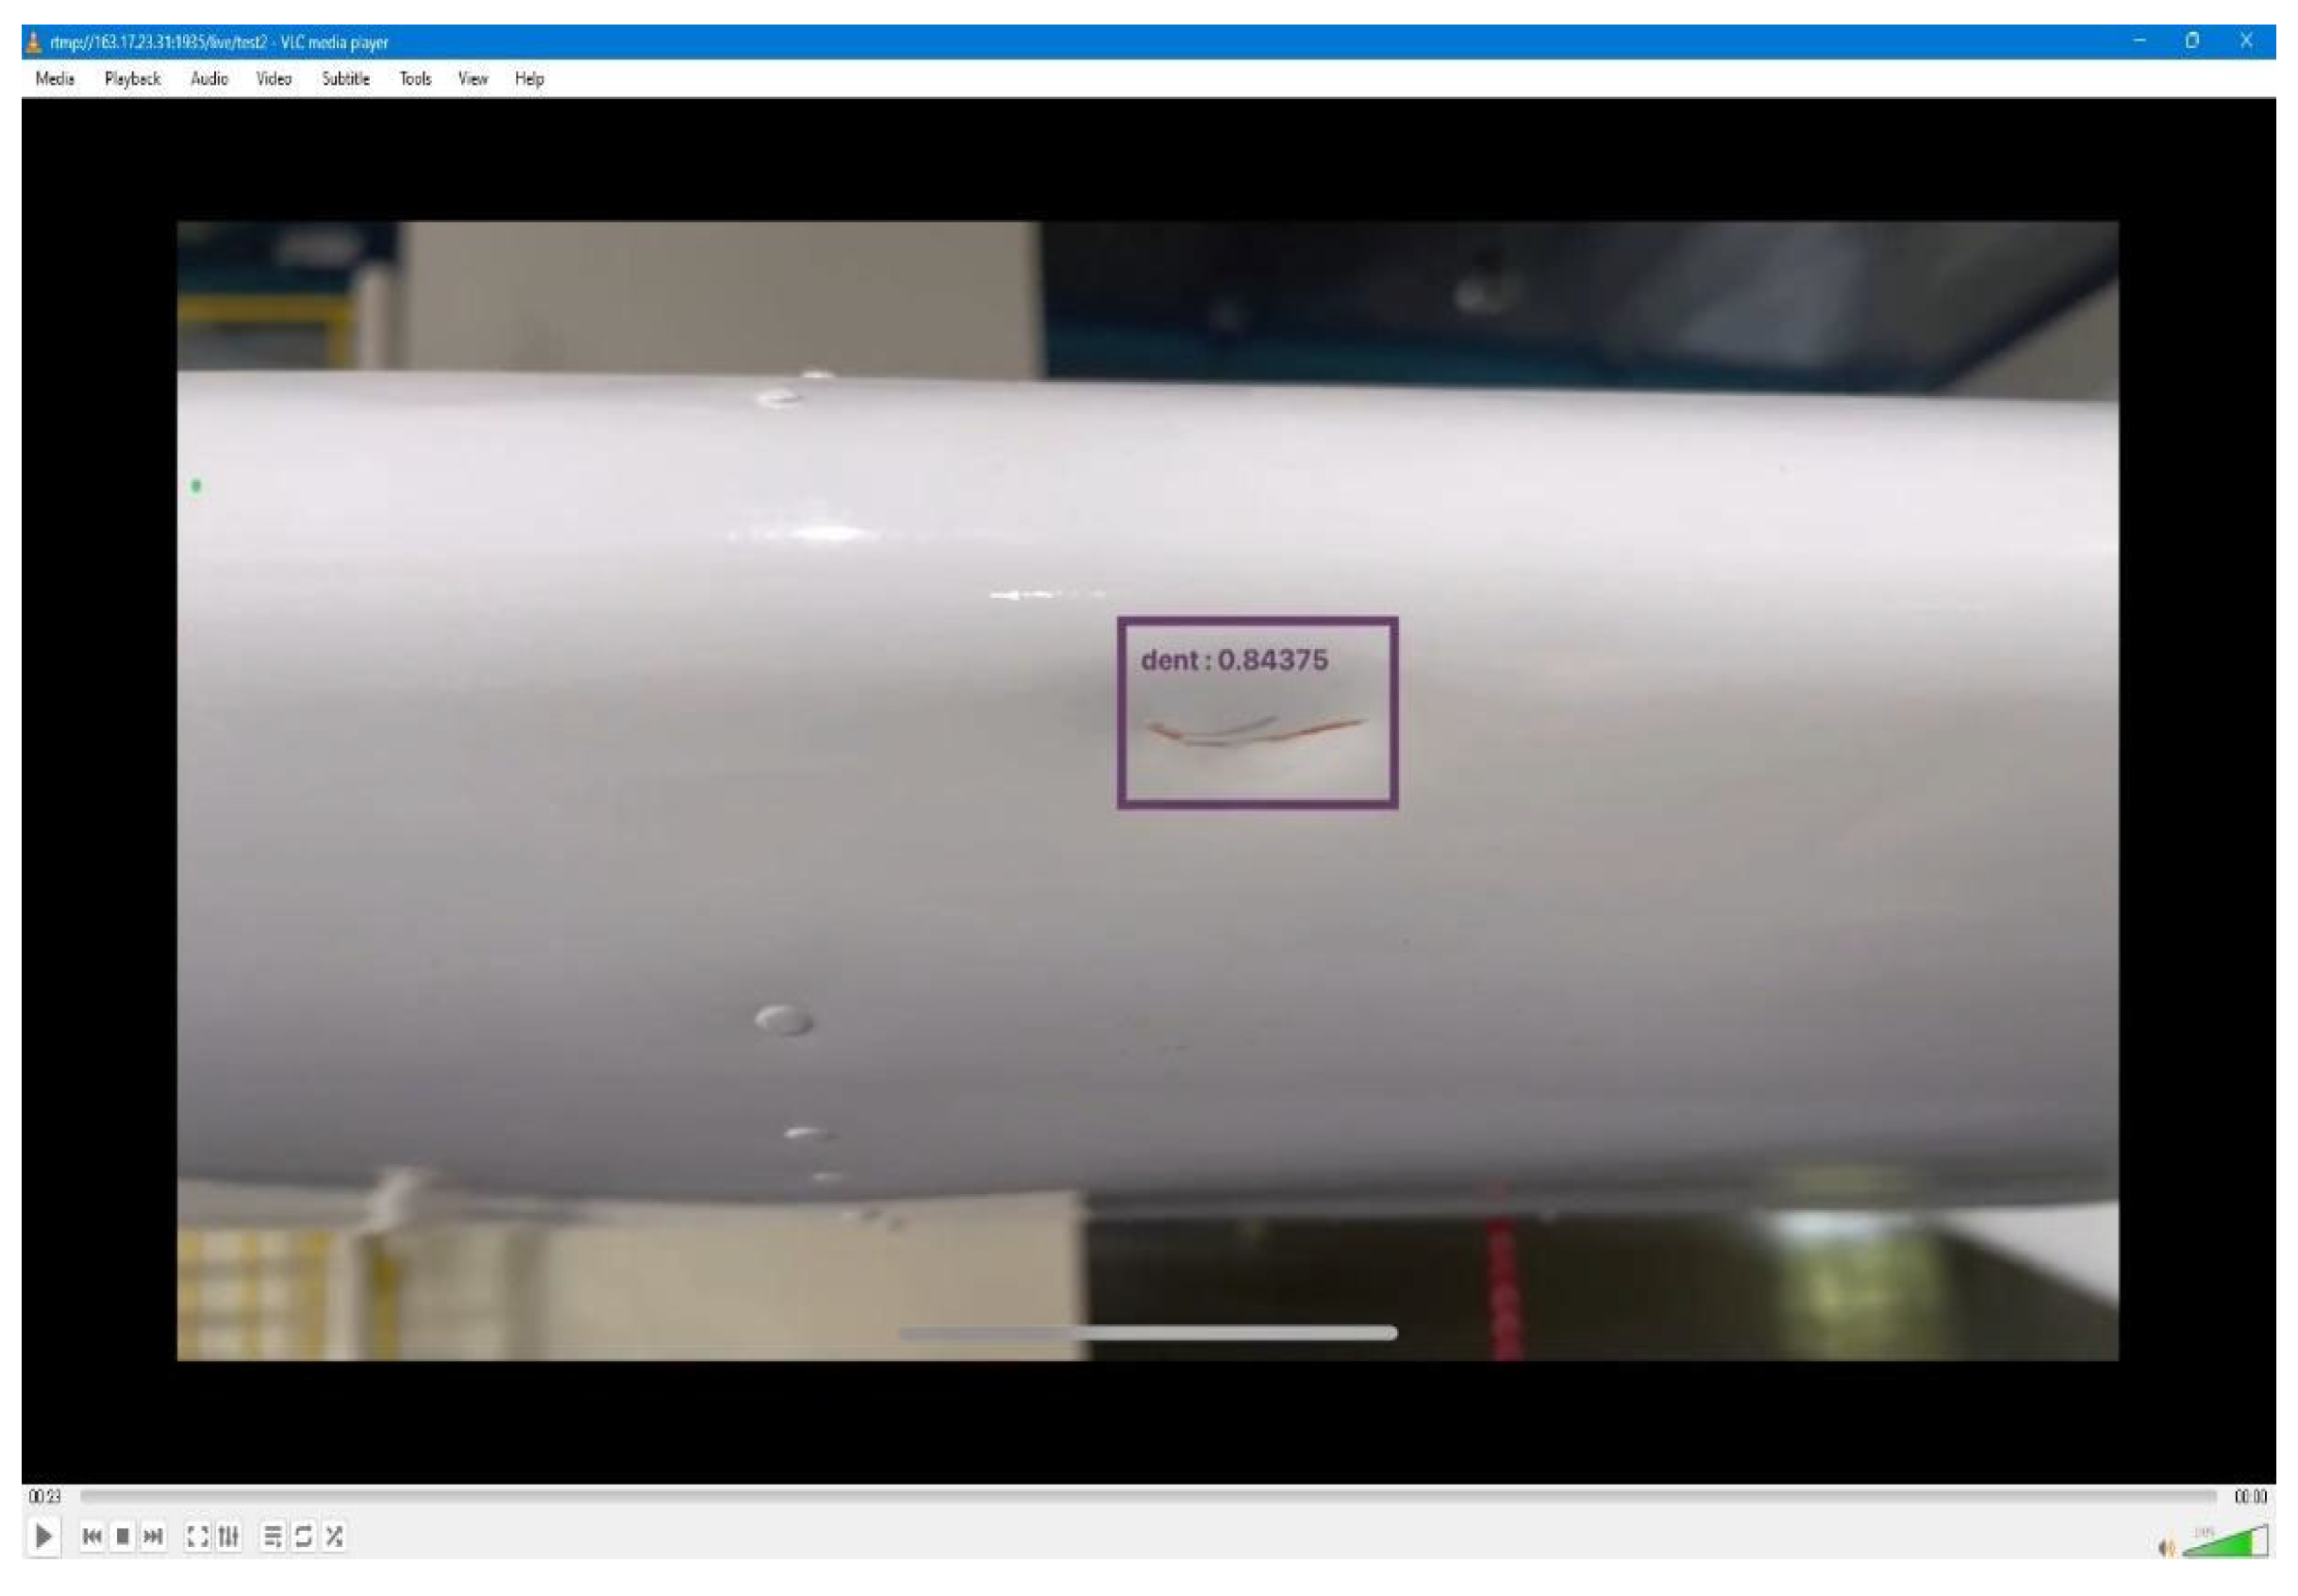
For the imagery transmission between mobile phones and IoT devices, a third-party application called Streamlabs was used to transfer the imagery output to the RTMP server. This application enables users to use the device’s screen-capturing ability and stream it to other online platforms, including any custom RTMP server. Integrating the Streamlabs application into the project allows the output to be streamed and monitored on any other IoT device. The following Figure 9 shows an example of the streaming process with the output results streamed to the server.
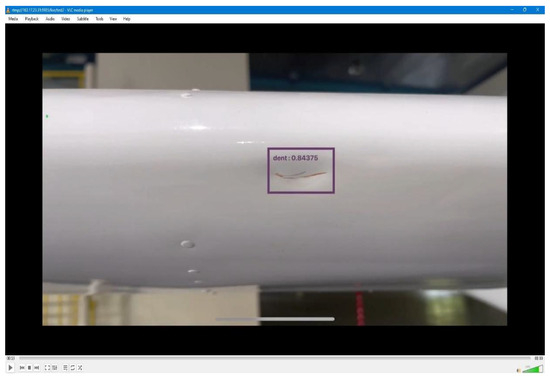
Figure 9.
Streaming session on an IoT device from test devices.
2.4. UAV Detection Process
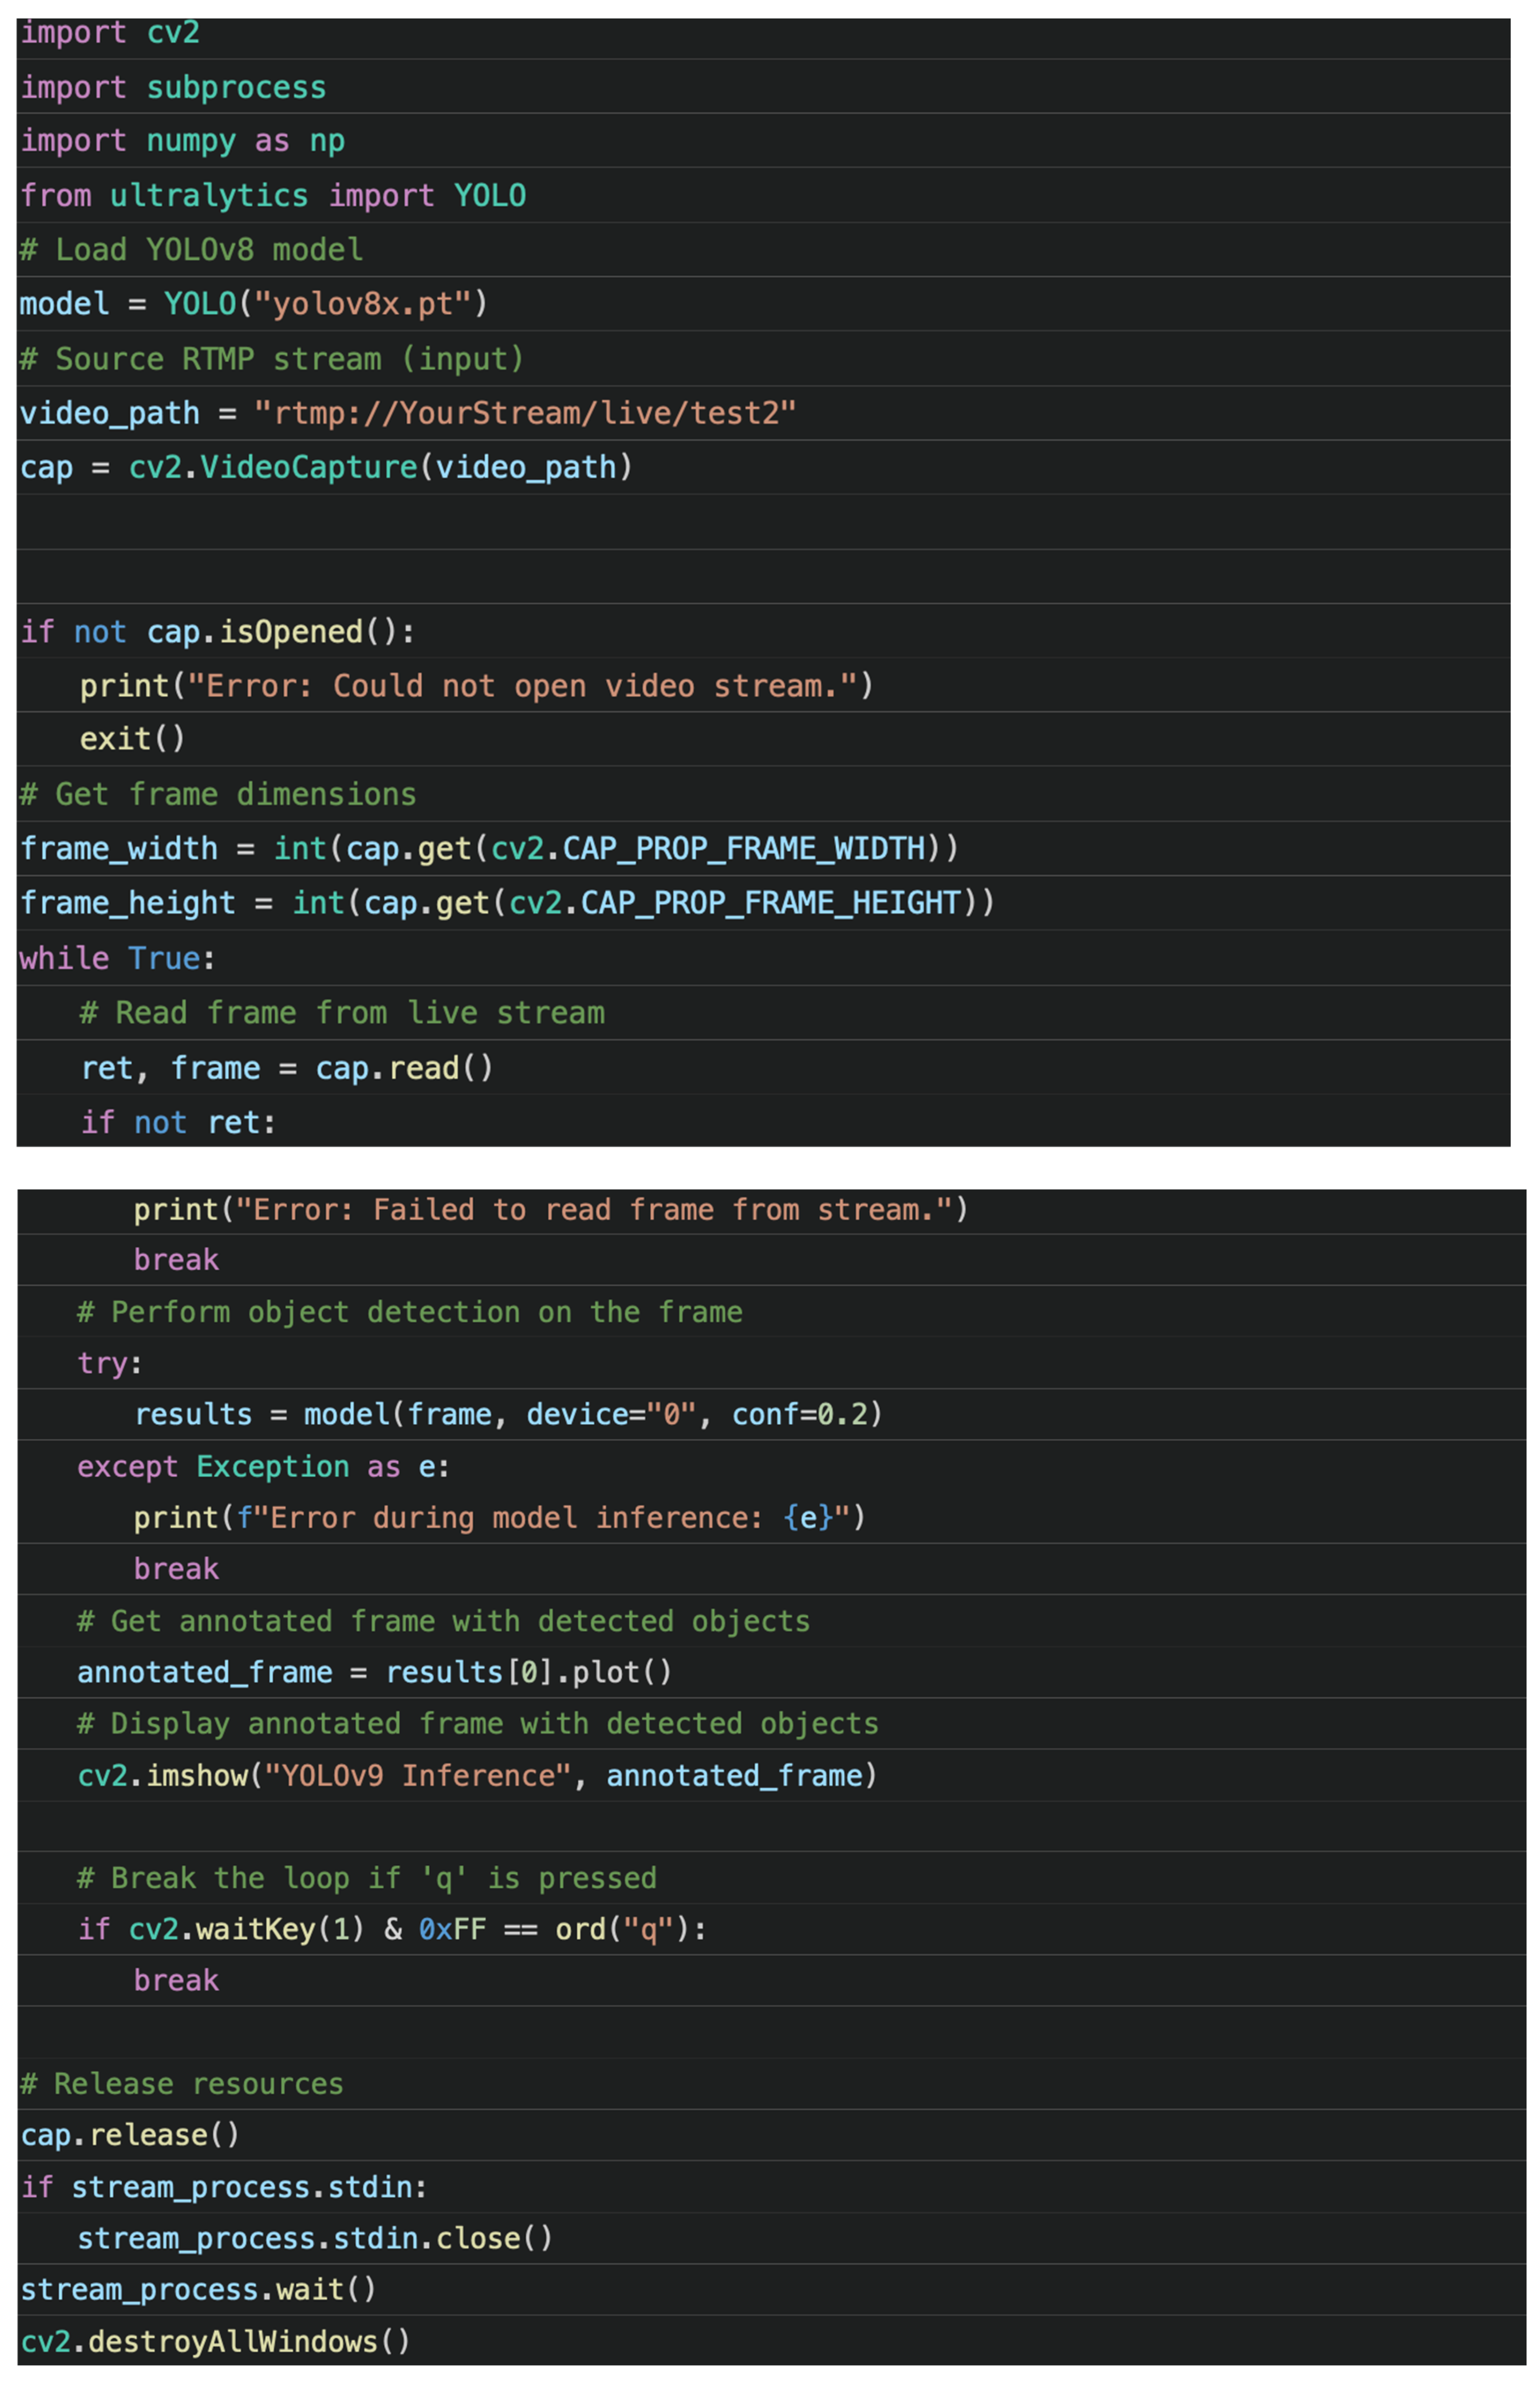
The detections performed by imagery captured from the UAV are relatively indirect, as the identification cannot be performed on the UAV itself. In this study, an application called “DJI Pilot” was used to control the UAV. As a built-in function of the application, it allows the user to stream the imagery captured by UAV cameras in real time. Making use of that, we can utilize a function from the Ultralytics library, which allows the user to run object detection directly on the RTMP live stream. Figure 10 shows the code for the detection process for UAV detection, where the code obtains the imagery input from an RTMP server.
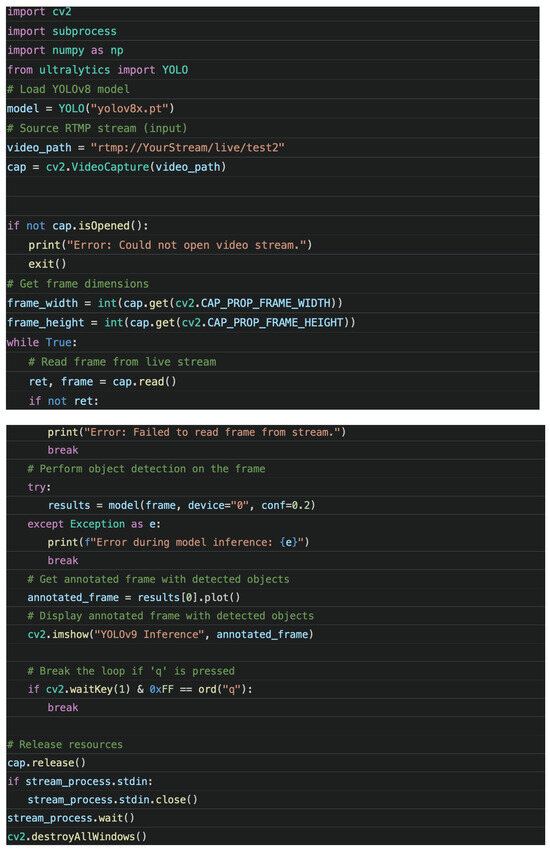
Figure 10.
Code for detection on UAV captured imagery.
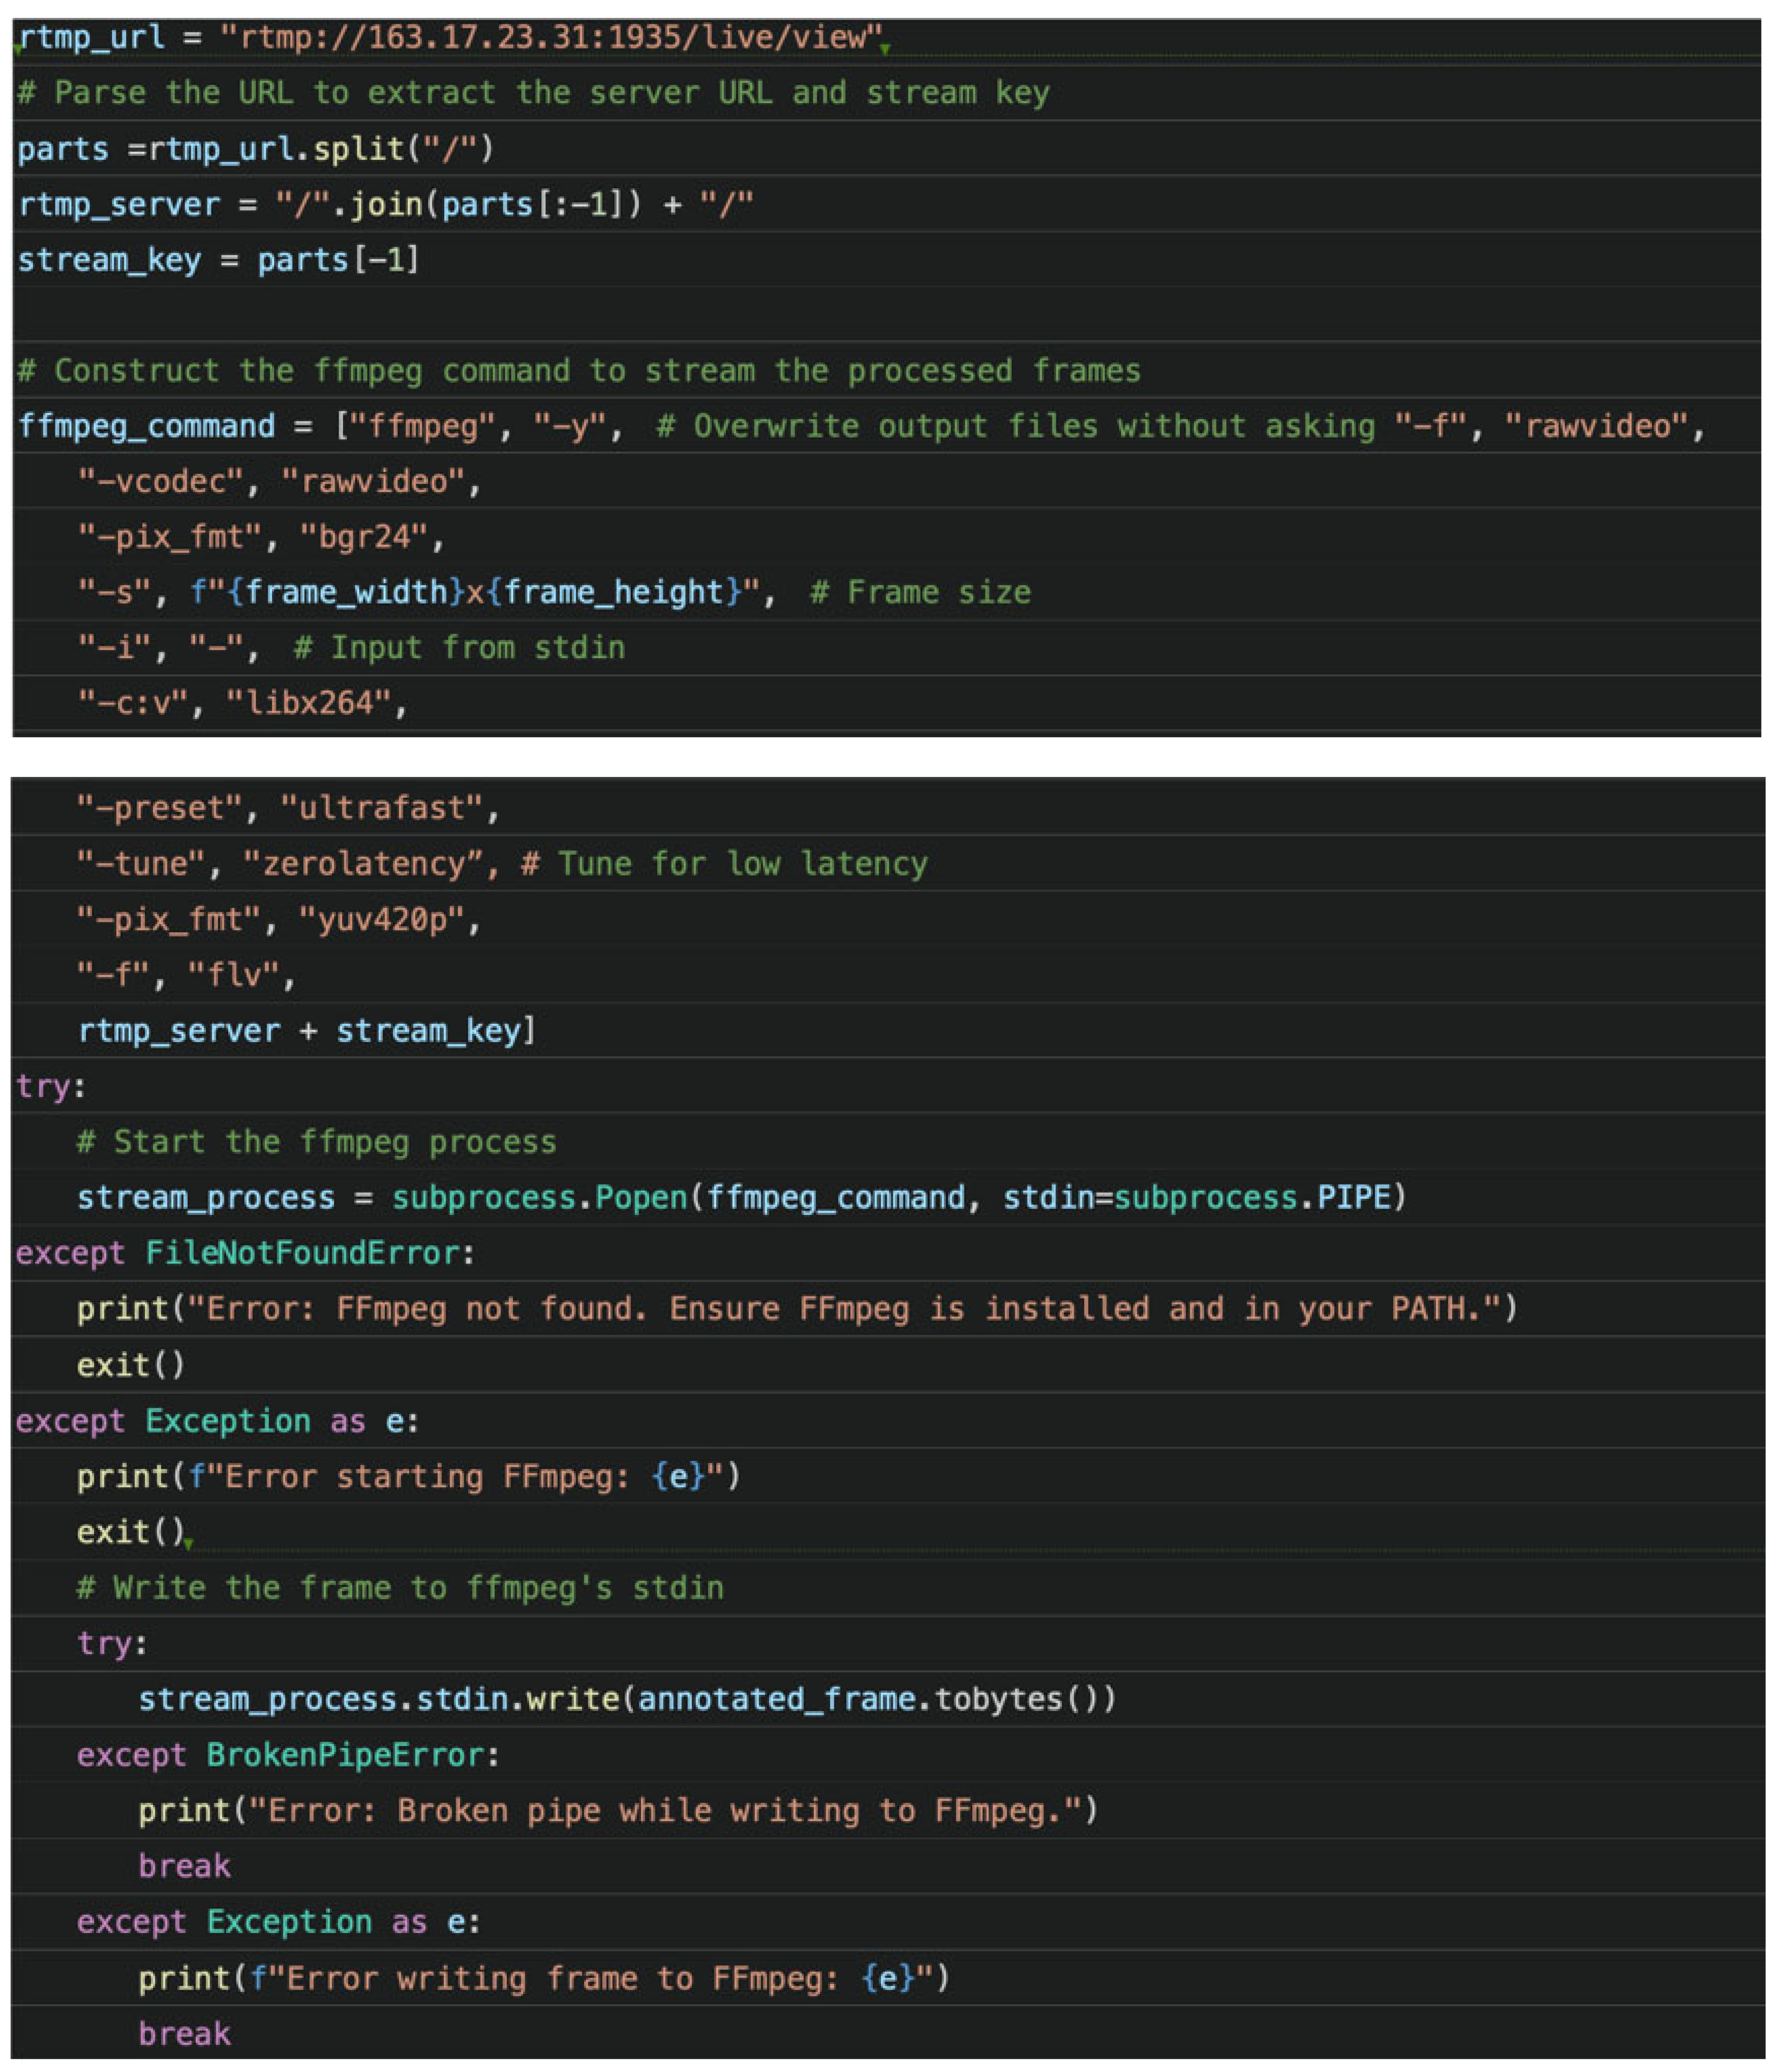
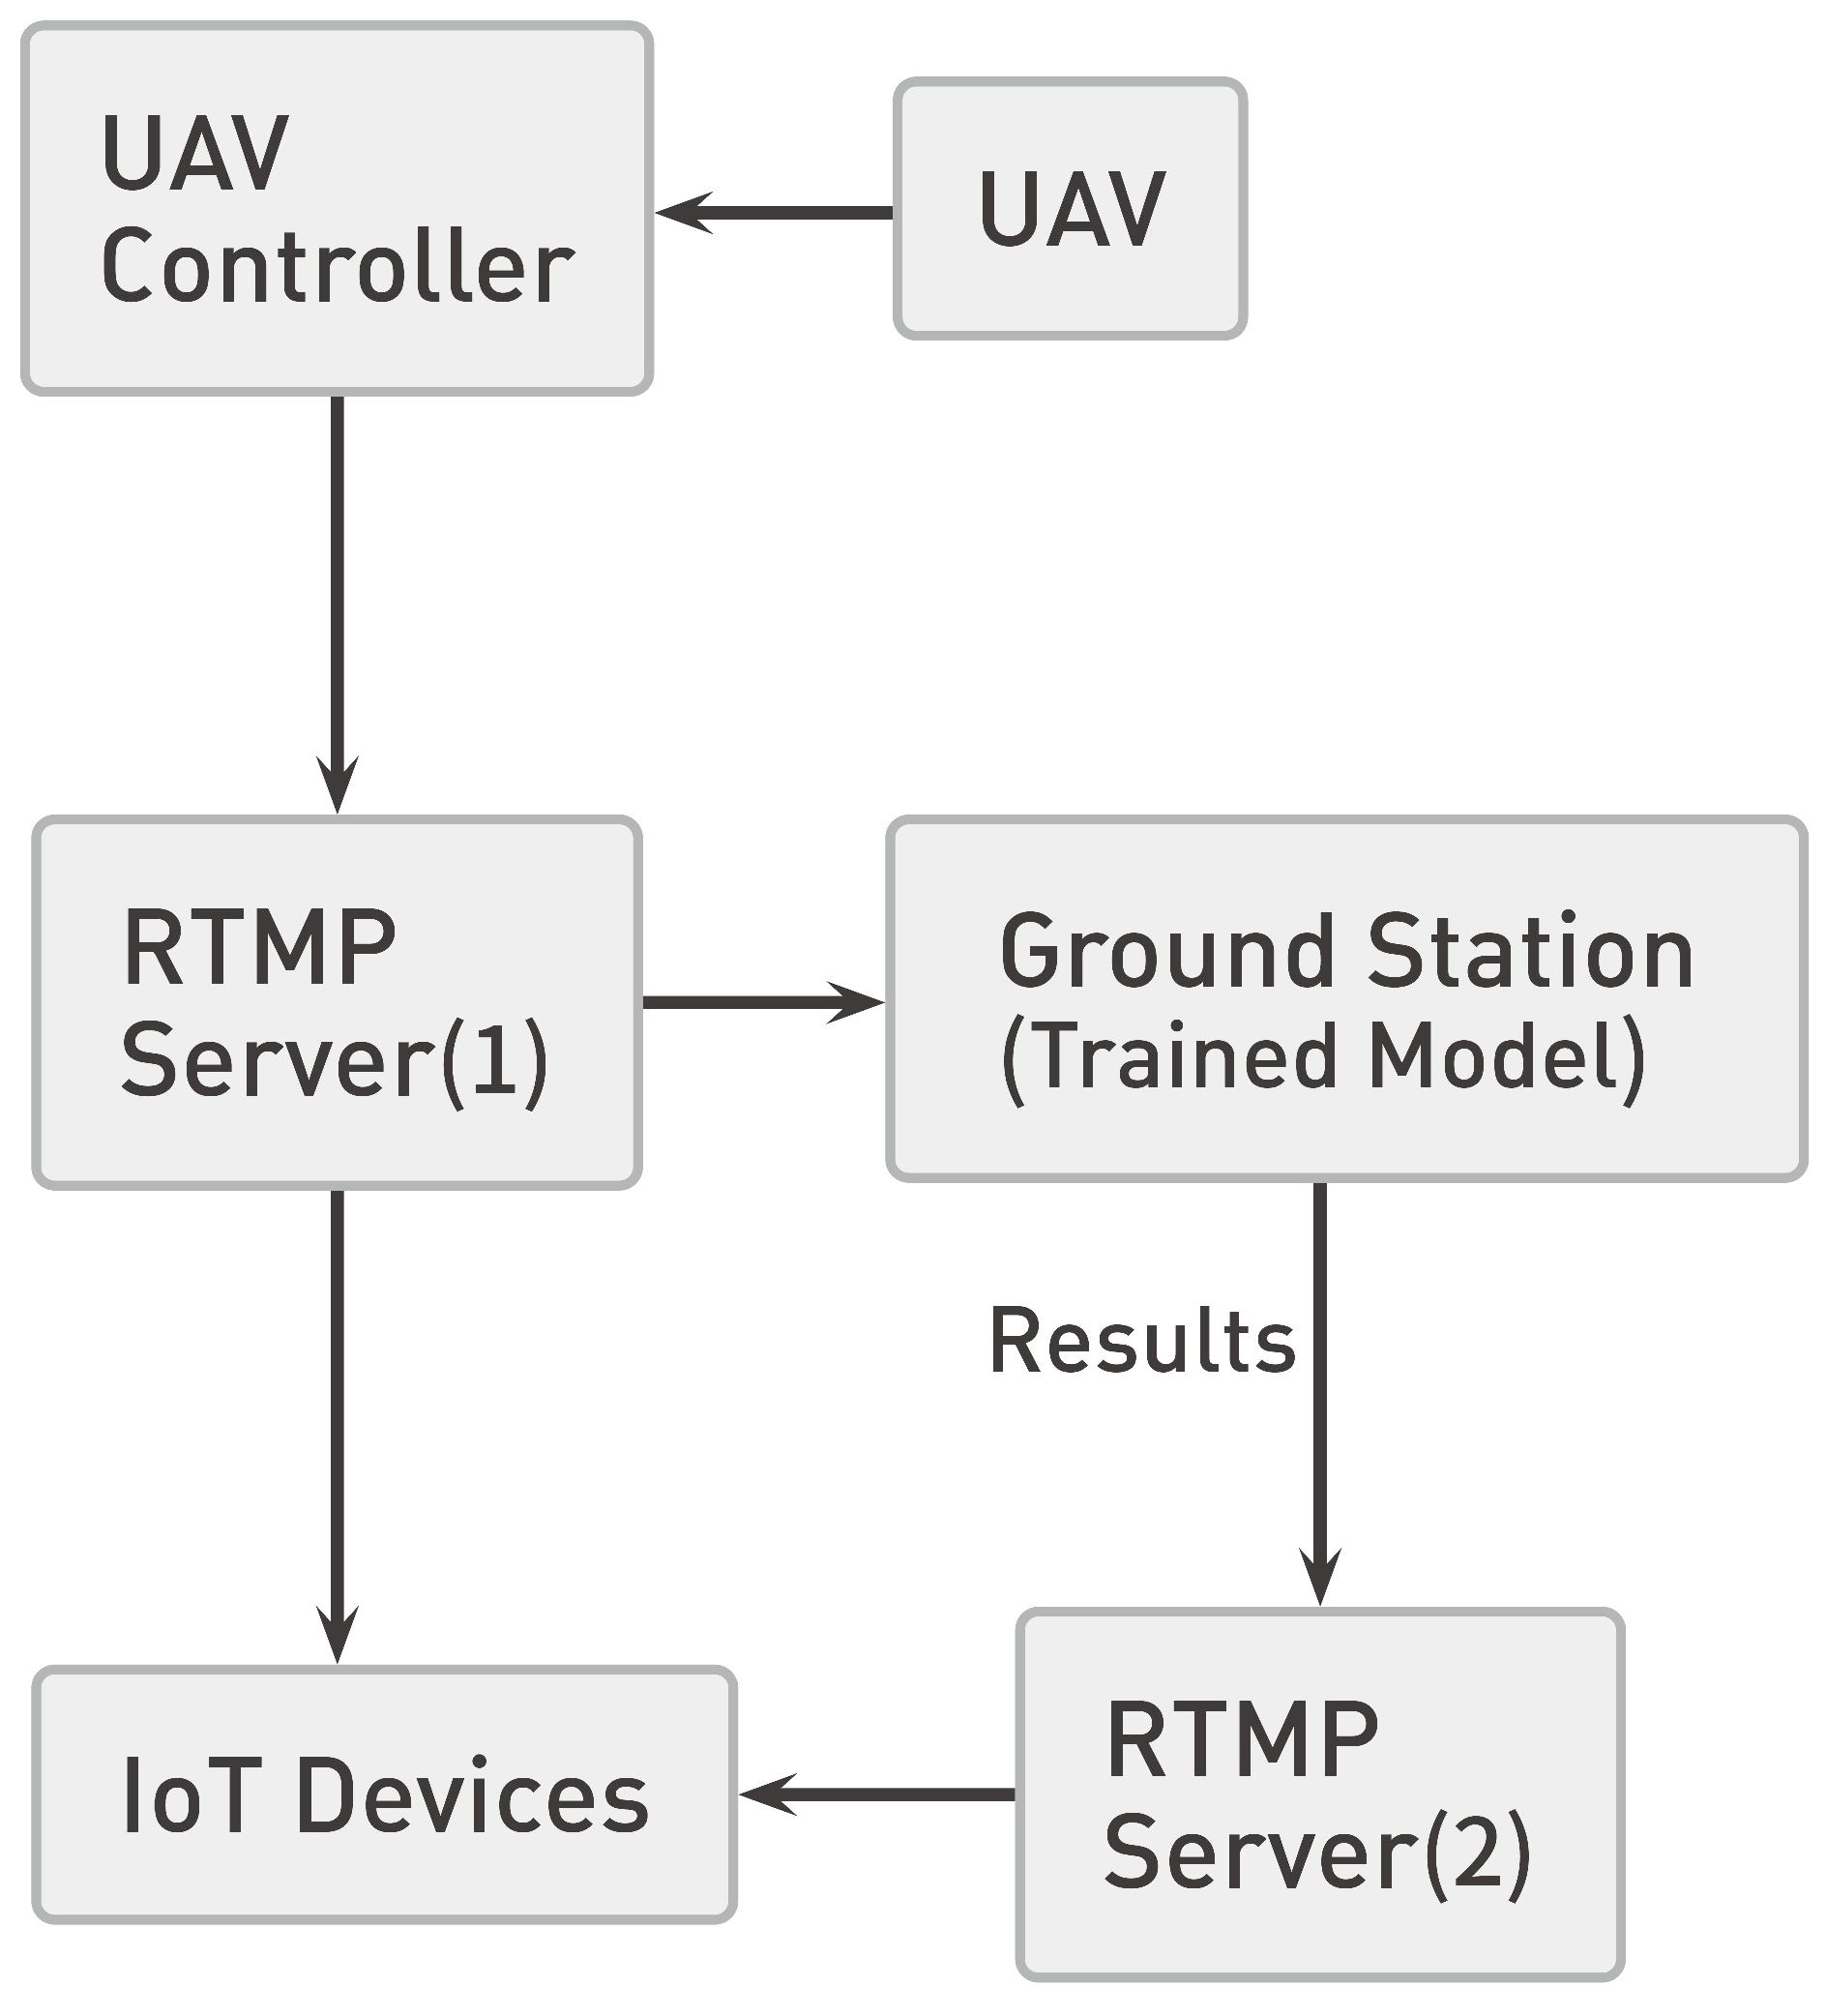
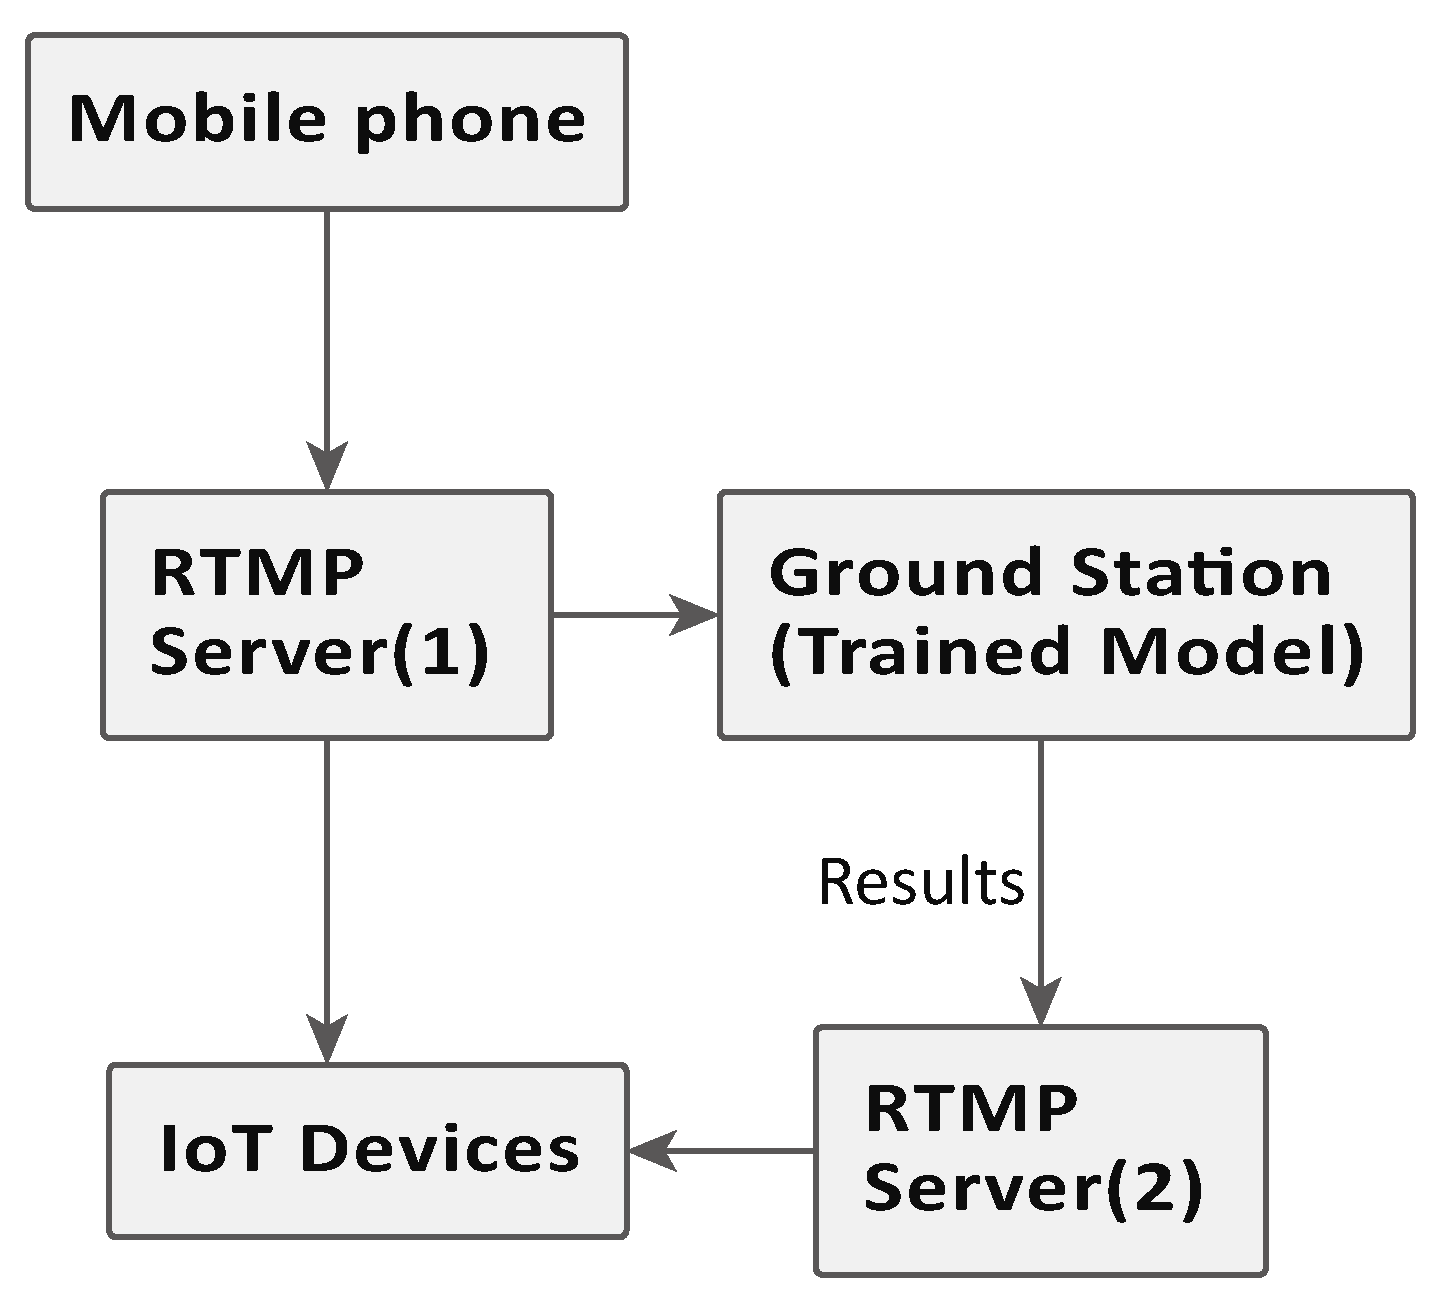
With the code in Figure 10, the result can only be observed on the screen of the ground station computer; therefore, further adjustment is needed to allow reviewing on IoT devices. In this study, ffmpeg was introduced to the code, which captures the results with the “rawvideo” command and upstreams them. Figure 11 shows the other part of the code for upstreaming the results, while Figure 12 features the flowchart of the connection network in this setting.
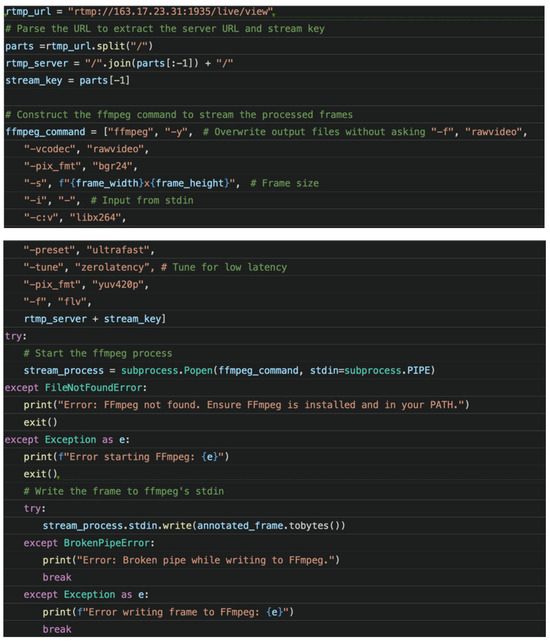
Figure 11.
The code for upstreaming the results to the RTMP server.
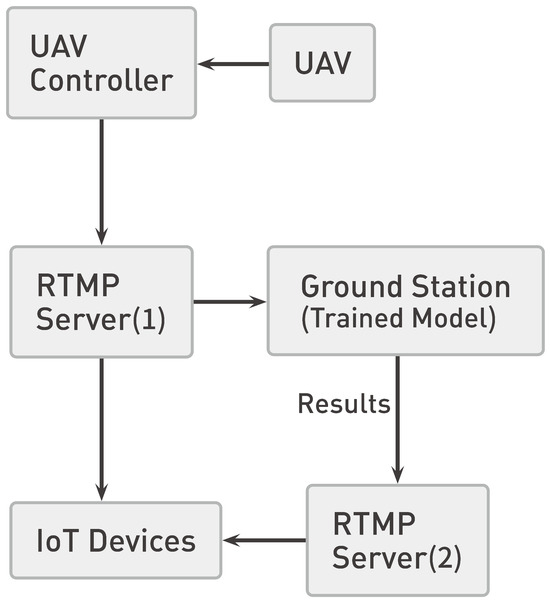
Figure 12.
Connection network of the system for UAV.
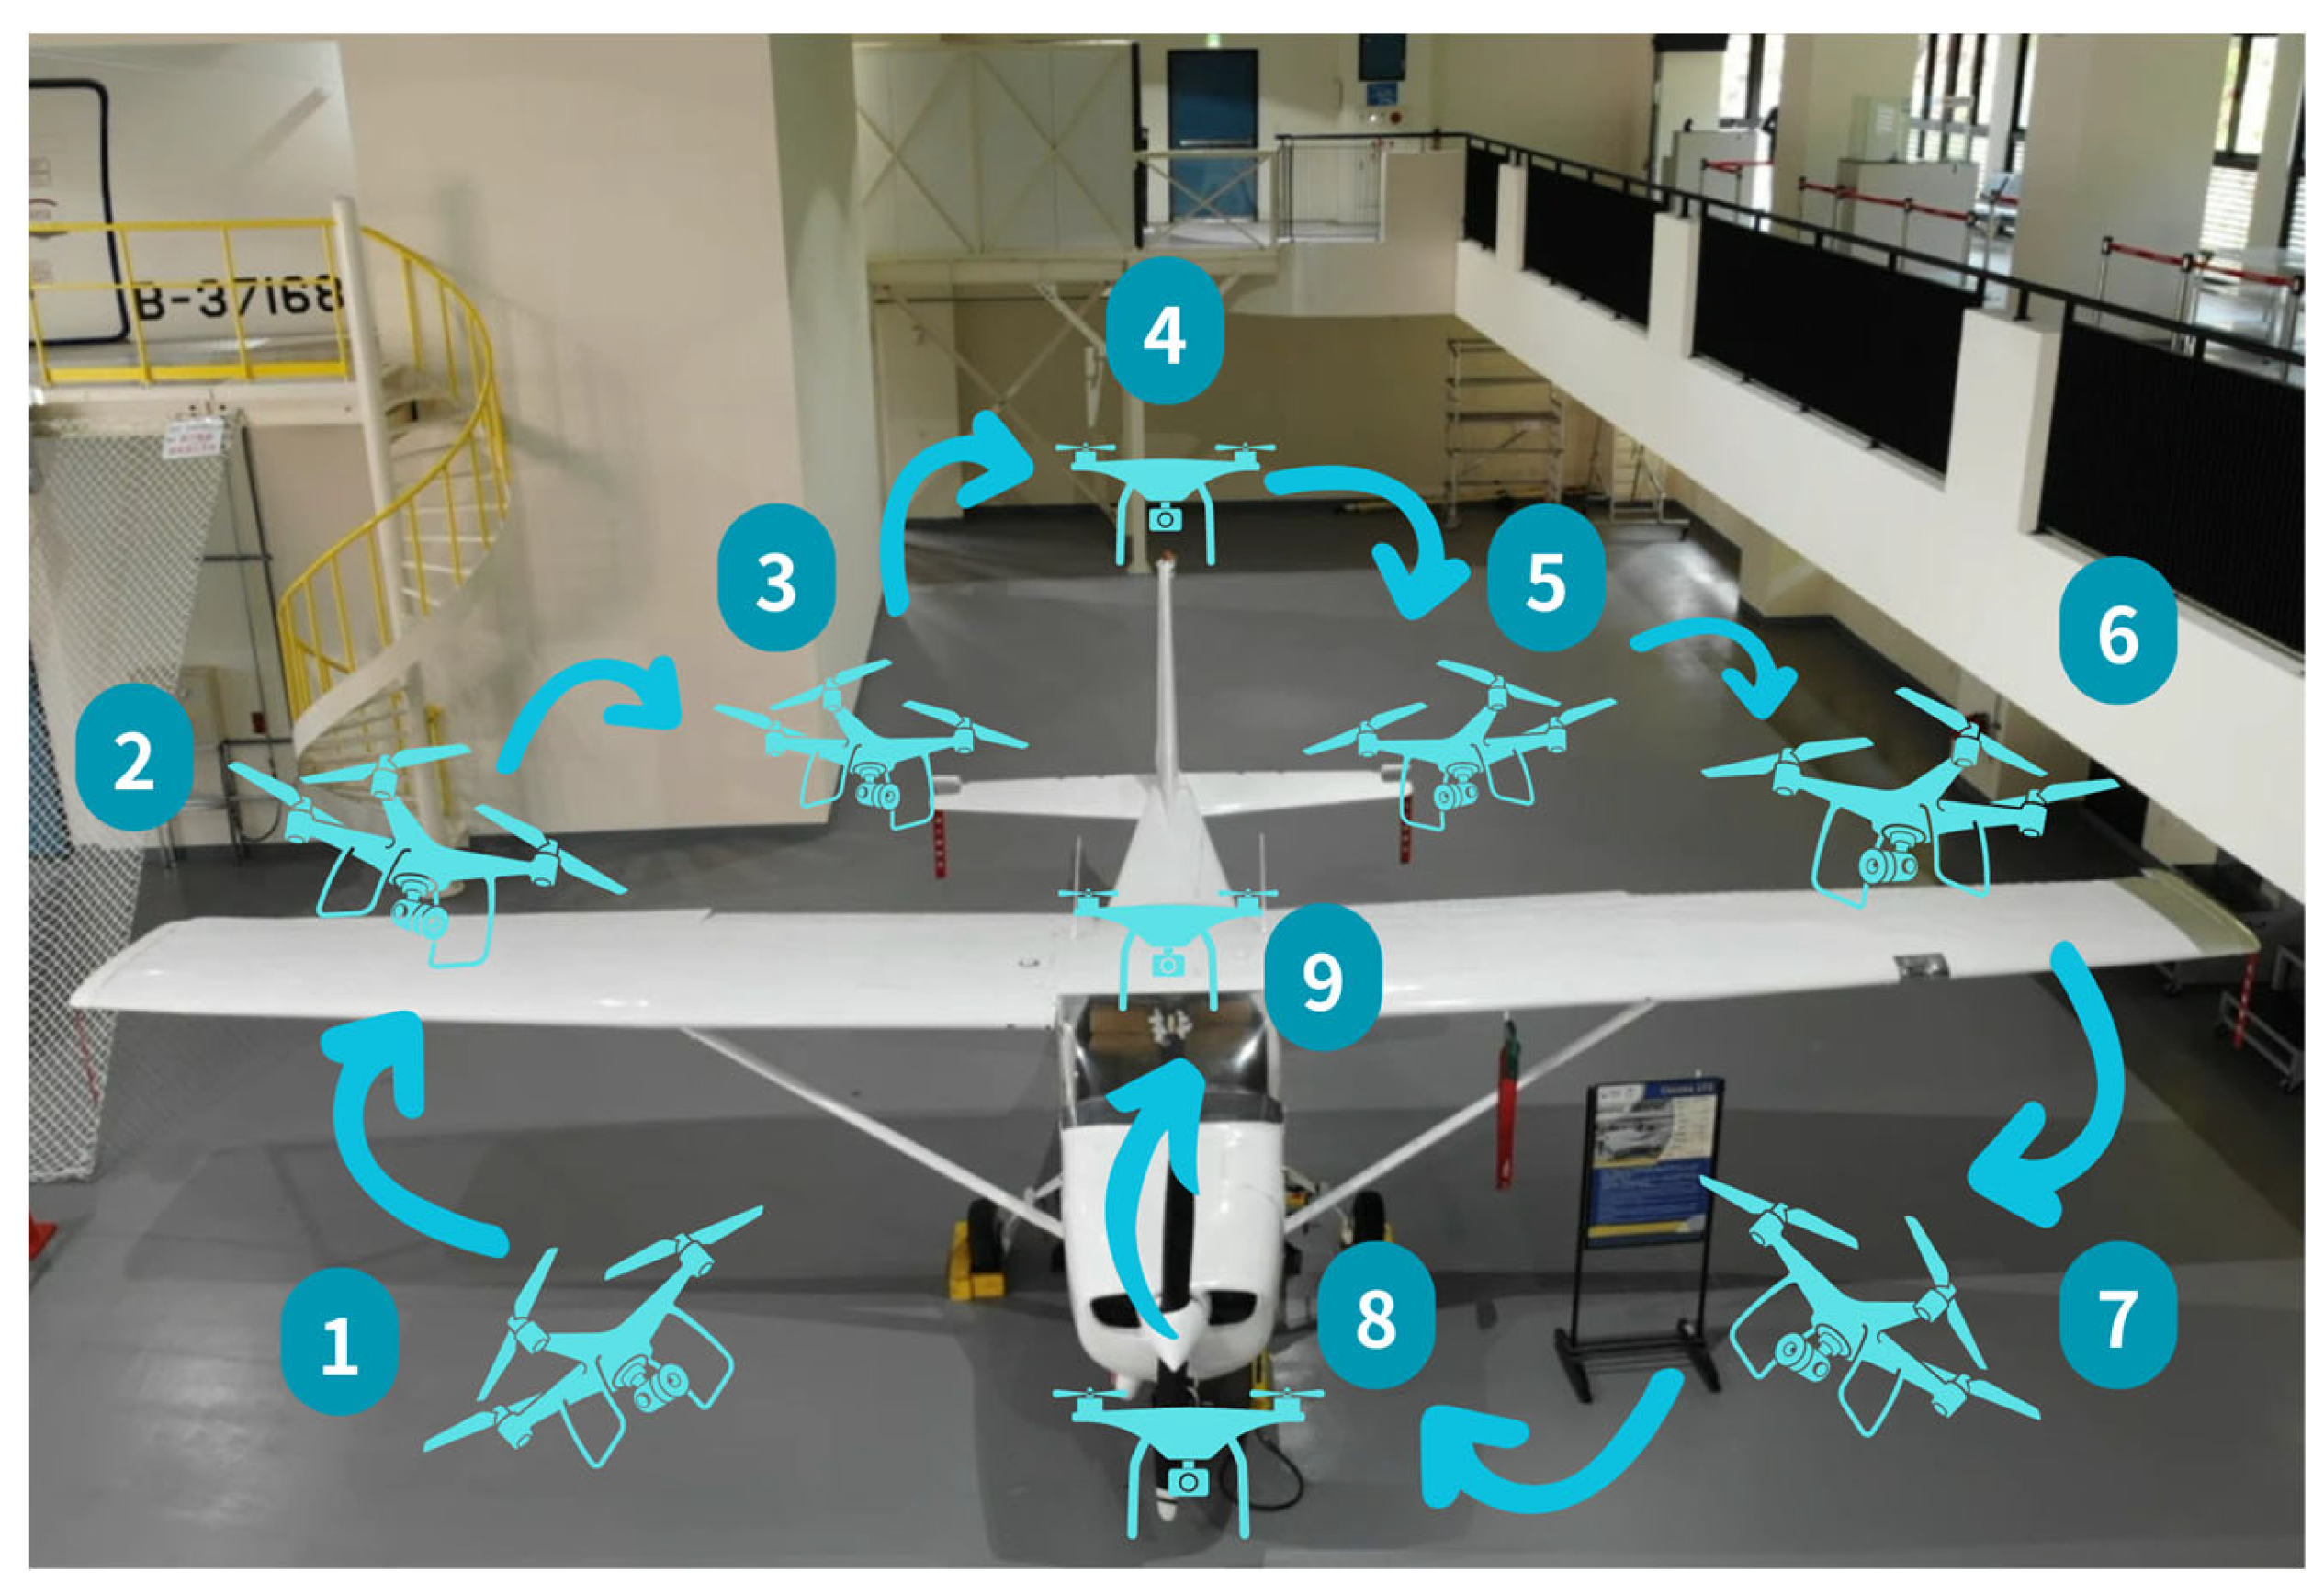
To ensure the accuracy of the results and to make sure the data obtained during the experiment allow us to compare the performance of the test models, flying route routines of the UAV were planned. Figure 13 briefly describes the route used during the model’s test run.
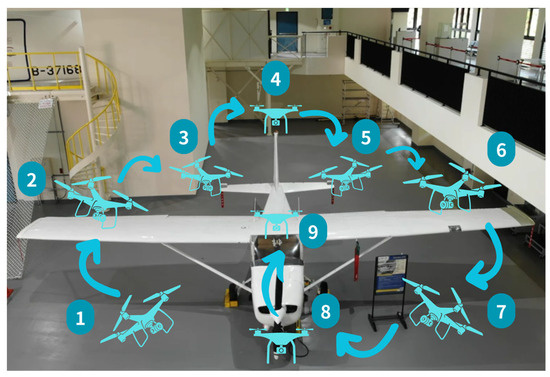
Figure 13.
The route used during the performance test for YOLO models.
As shown in Figure 13, the route was planned, so that the UAV captured covered mostly the perimeter of the aircraft at above eye level at 190 cm from the ground which is about the height of the wings from the ground. and about 30–50 cm away from the aircraft, this is the restriction applied by the DJI program, with the additional area where inspections were difficult to perform, such as the rudders and upper surface of the fuselage.
3. Results
3.1. Training Results
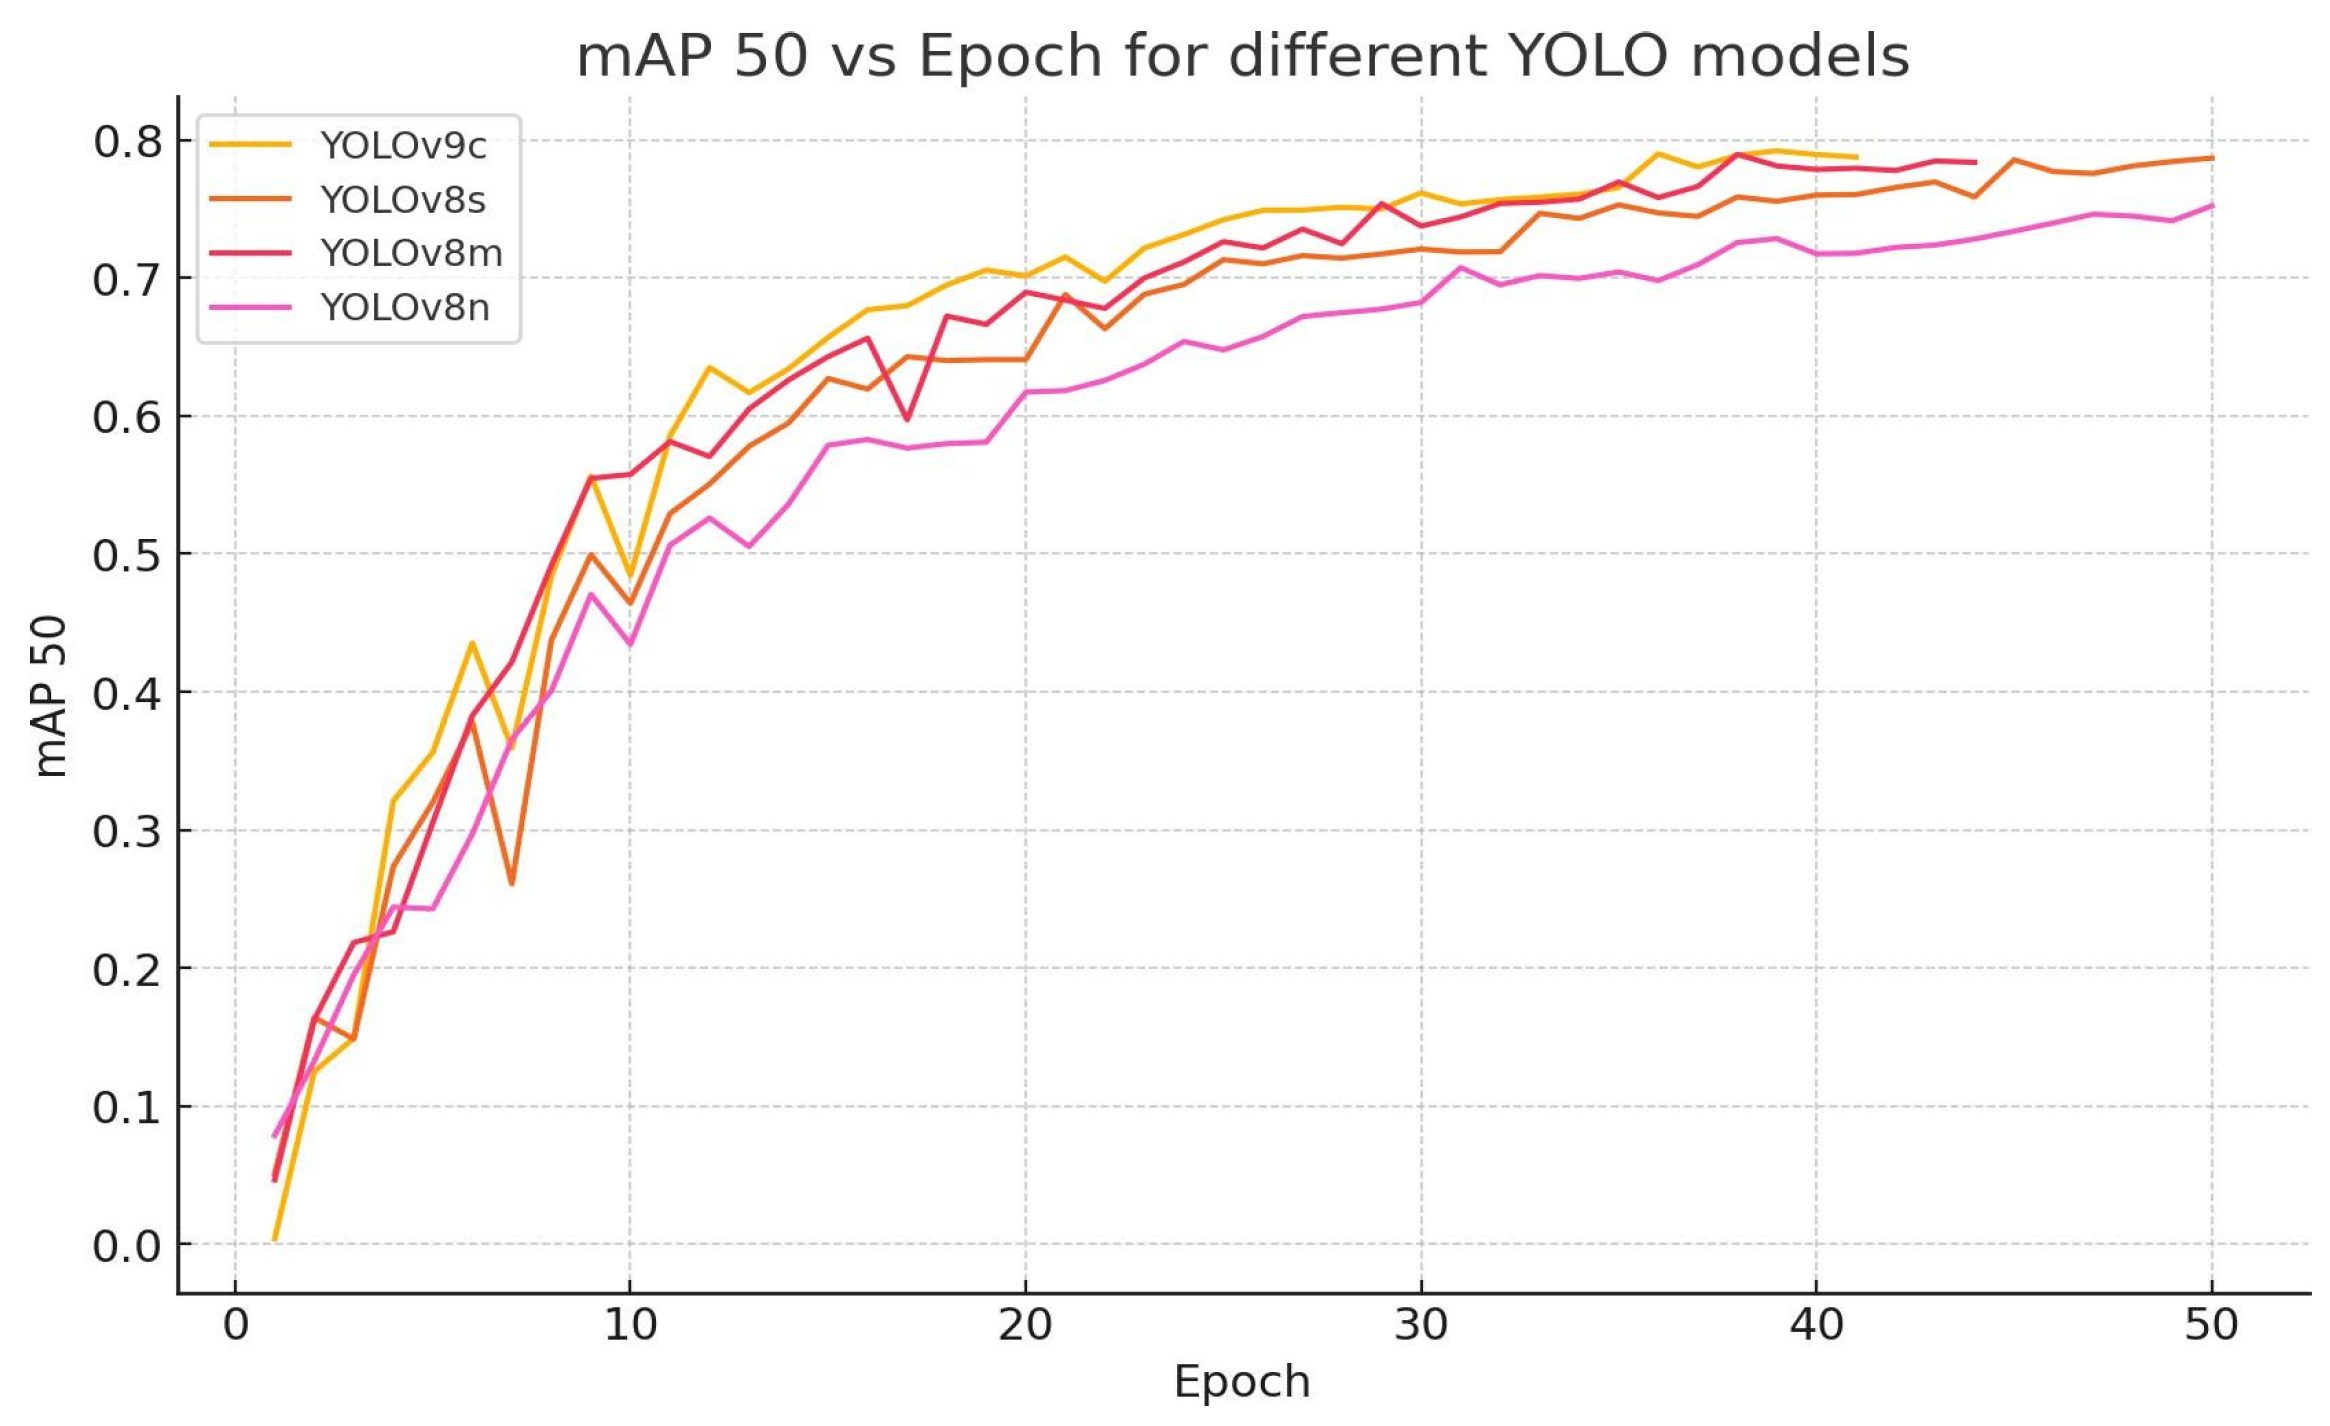
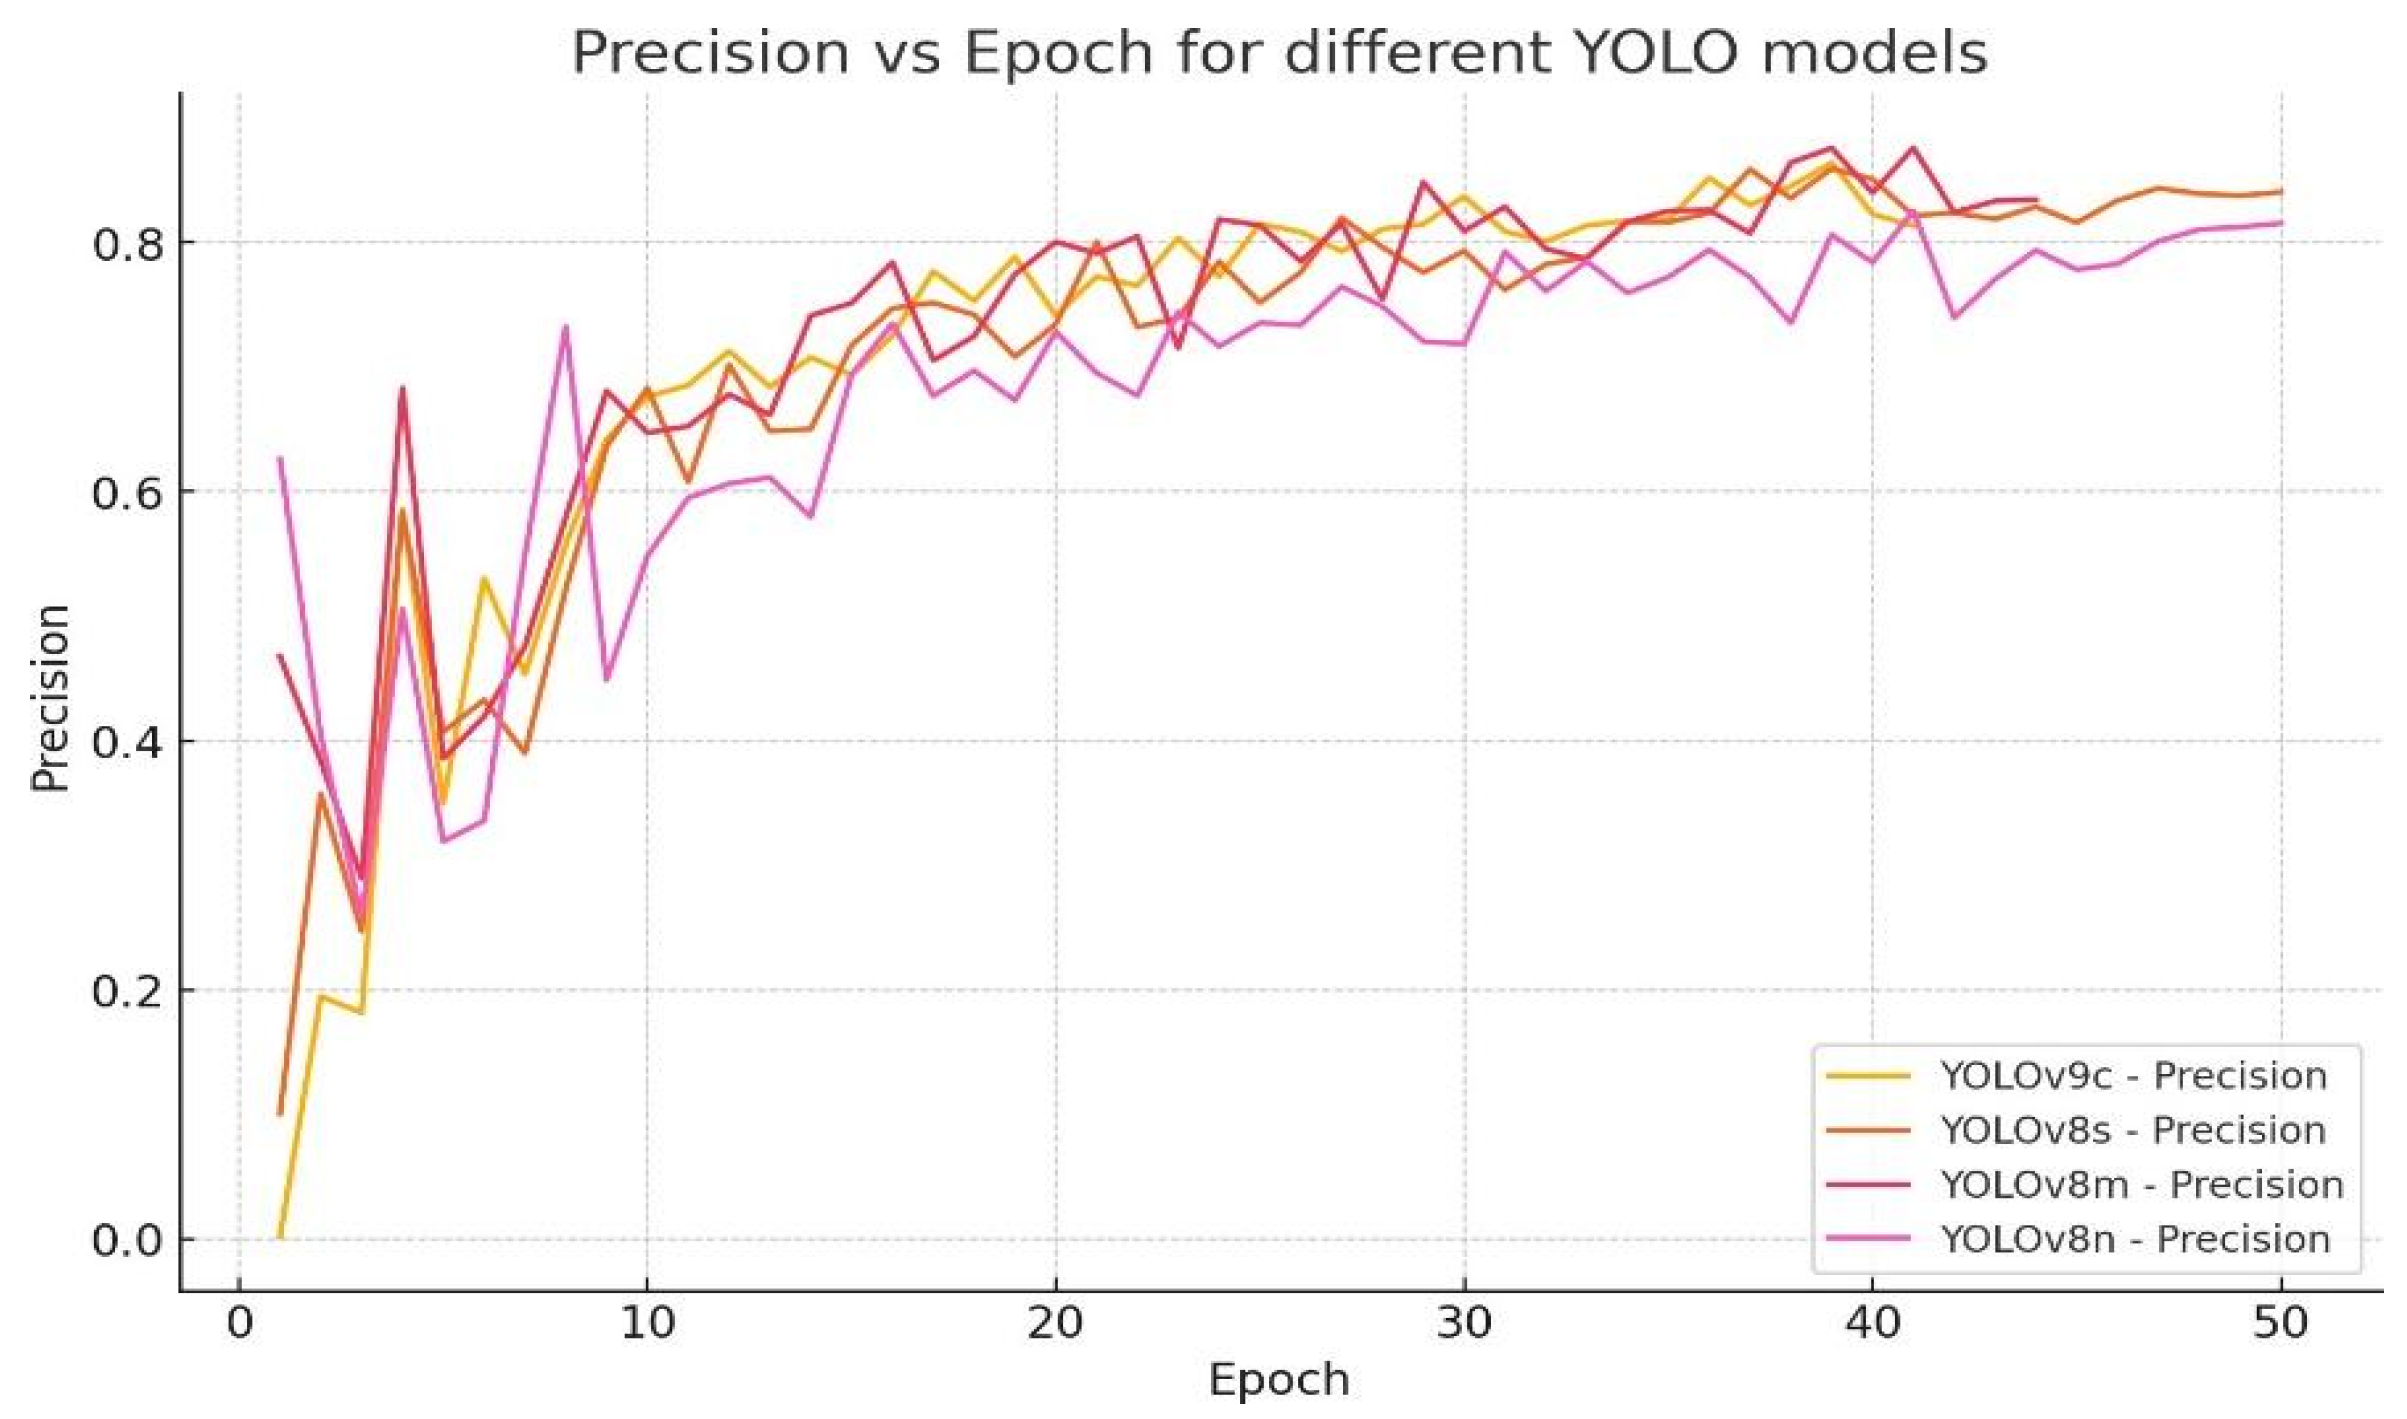
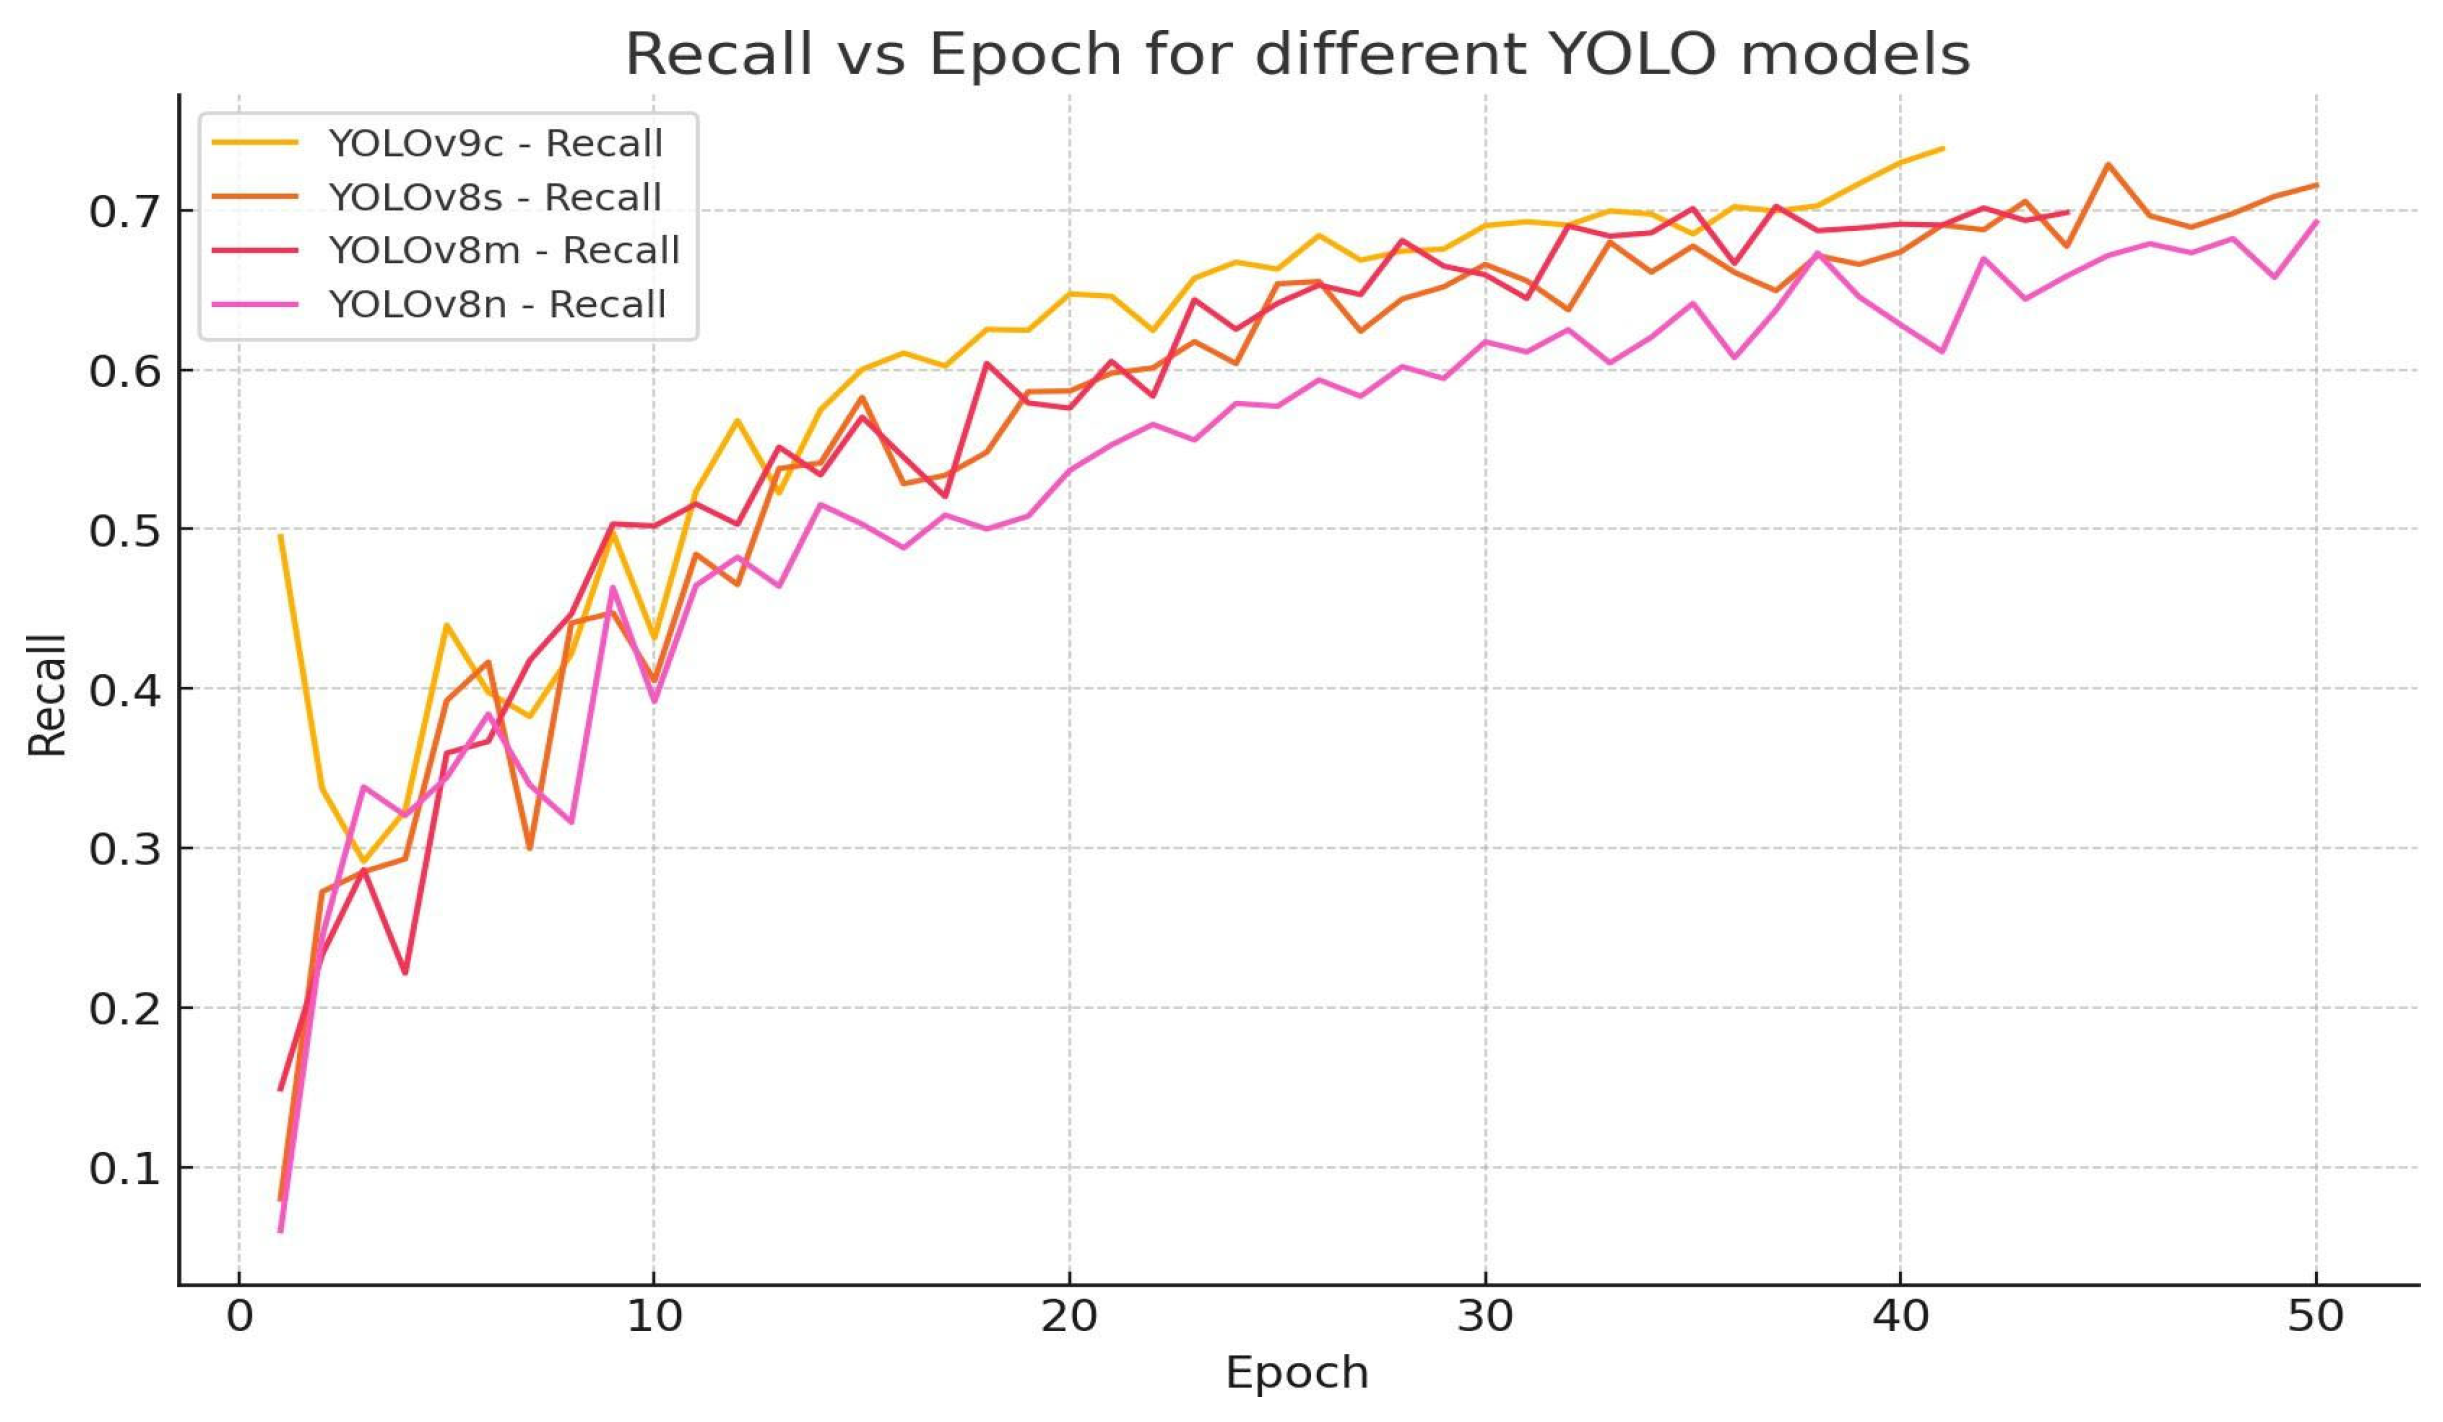
The training was performed on different models, including YOLOv8 Nano, YOLOv8 Small, YOLOv8 Medium and YOLOv9 Compact, under an auto-optimizer environment, as mentioned in the algorithm training section. Figure 14, Figure 15 and Figure 16 describe the training results regarding recall, precision and mAP values for the models, which were trained with a patience rate of 5. These figures provide an easy performance evaluation for each model, allowing users to find the best-suited model for their corresponding project.
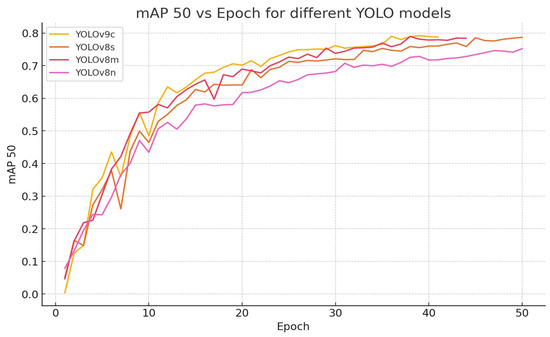
Figure 14.
Comparison of the mAP scores for the trained YOLO models.
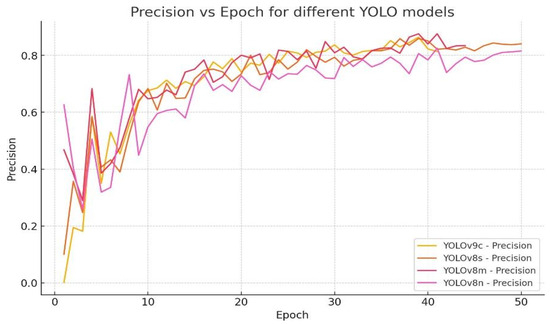
Figure 15.
Comparison of the precision scores for the trained YOLO models.
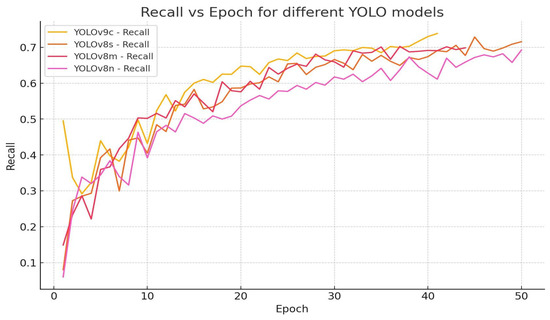
Figure 16.
Comparison of the recall scores for the trained YOLO models.
As shown in Figure 14, Figure 15 and Figure 16, these models scored better per epoch, indicating a well-performed training of the models. After 10 epochs, the rate of increase in the metrics started to drop and overfitted approximately at epoch = 30. The models were forced to stop early after epoch = 40, as no further improvement was observed upon training. As can be observed in Table 3, the bolded numbers represent the best performance in each set of data, where YOLOv9c performed the best in terms of the set criteria, with the highest precision, recall and mAP.

Table 3.
Comparison of performance metrics for different YOLO models.
Since all models were trained using the “auto” optimizer, there was not much difference in terms of metric scores. According to Table 3, among the models, YOLOv8n achieved the highest scores in three types of loss—0.84133, 0.91269 and 0.91250—while YOLOv9c exhibited better performance in precision, recall and mAP.
It is important to note that the overfitting which occurred in model training does not necessarily indicate issues with the dataset; the models could possibly undergo another training process to “fine-tune” the performance. The hyperparameters of YOLOv9c were subsequently further fine-tuned, achieving a more stable and more reliable overall performance. Table 4 demonstrates the results of the fine-tuning of the previous YOLOv9c model.

Table 4.
Performance metrics results upon fine-tuning of YOLOv9c.
3.2. Real-Time Detection
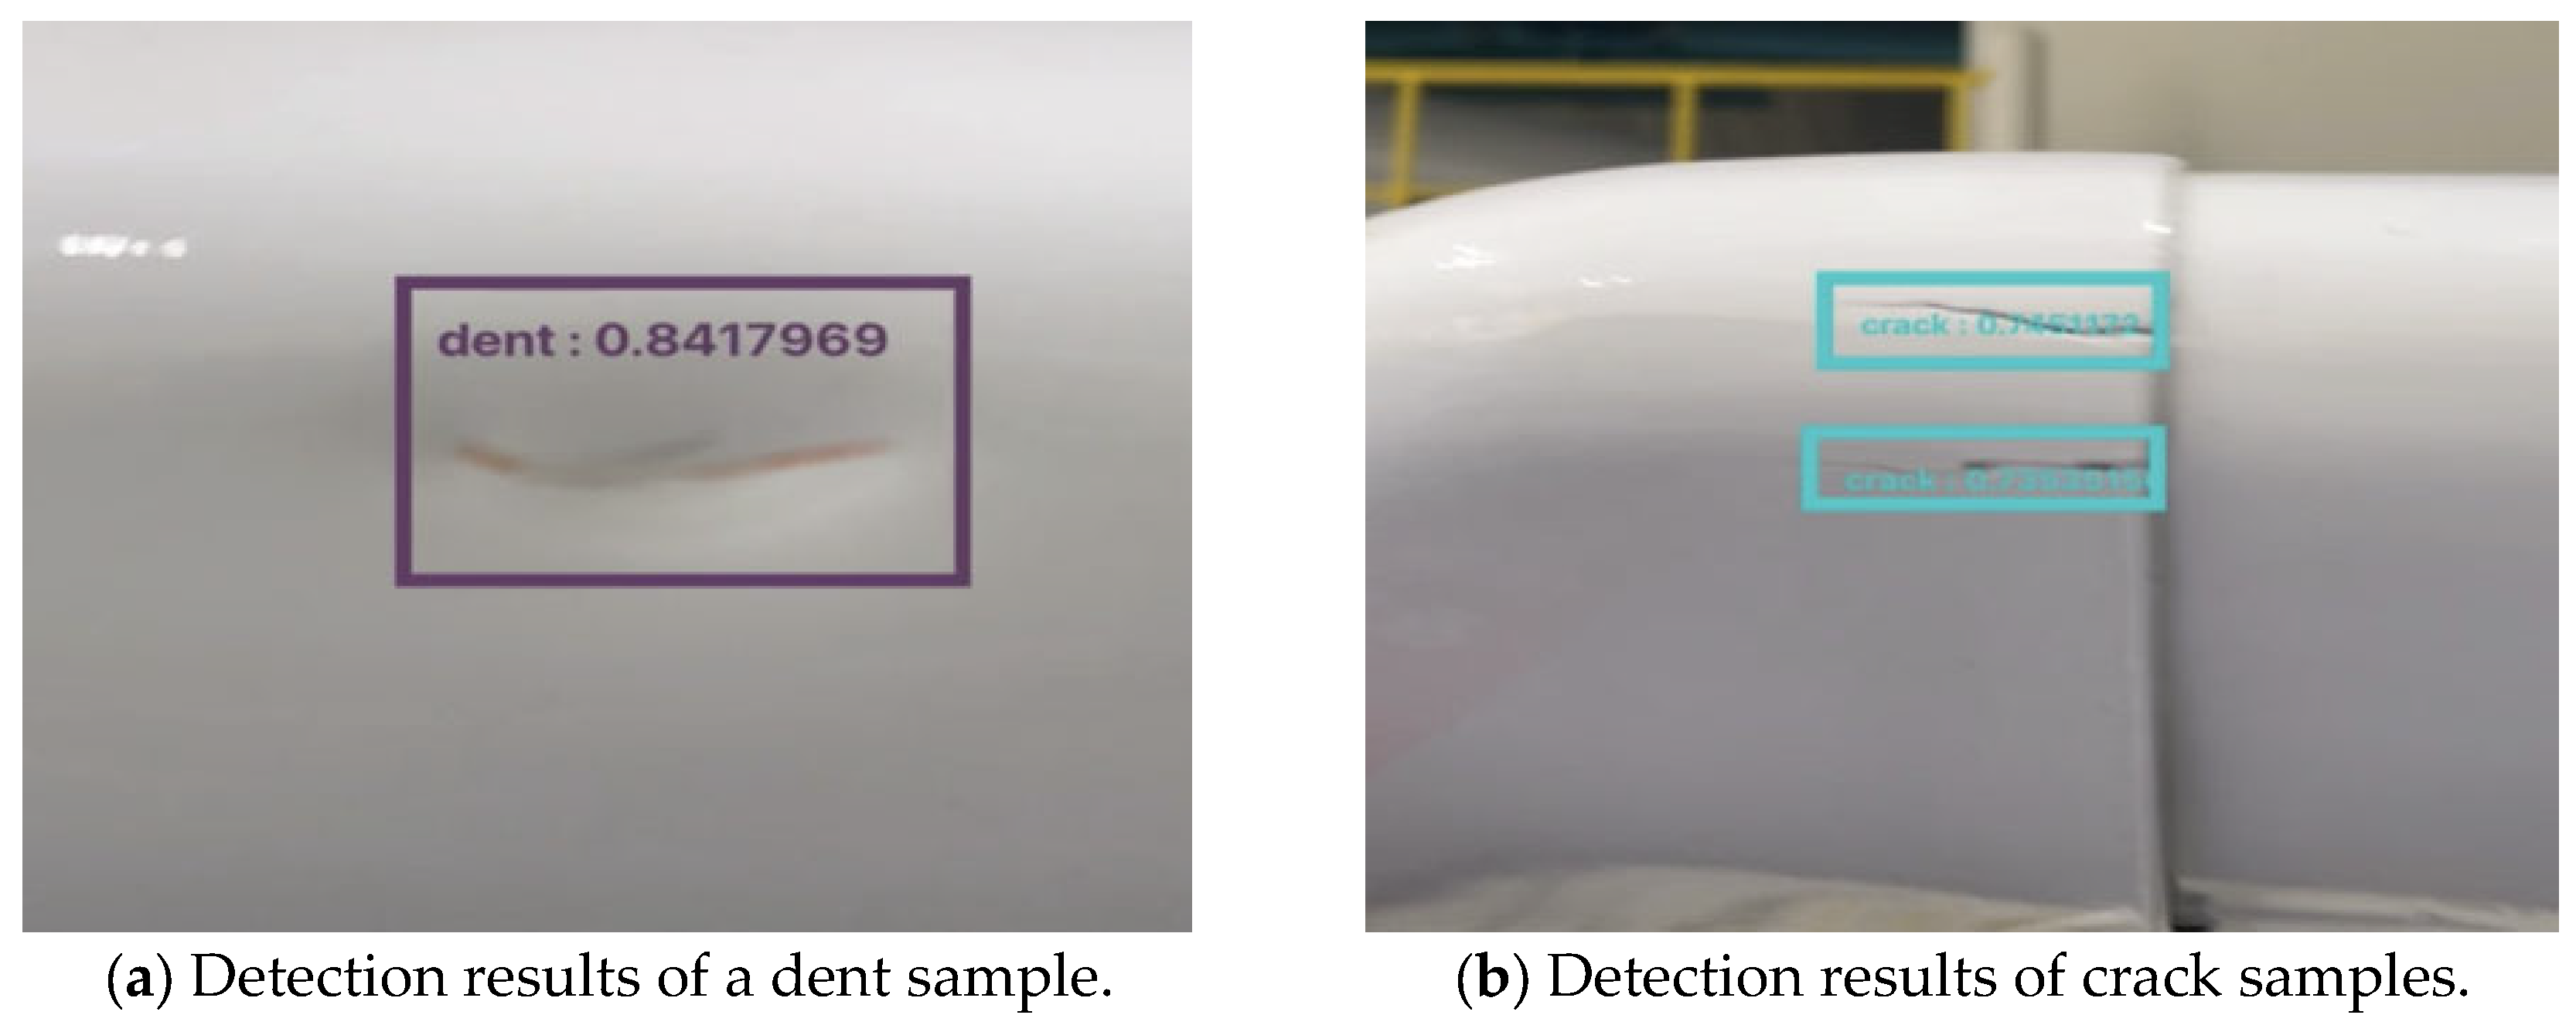
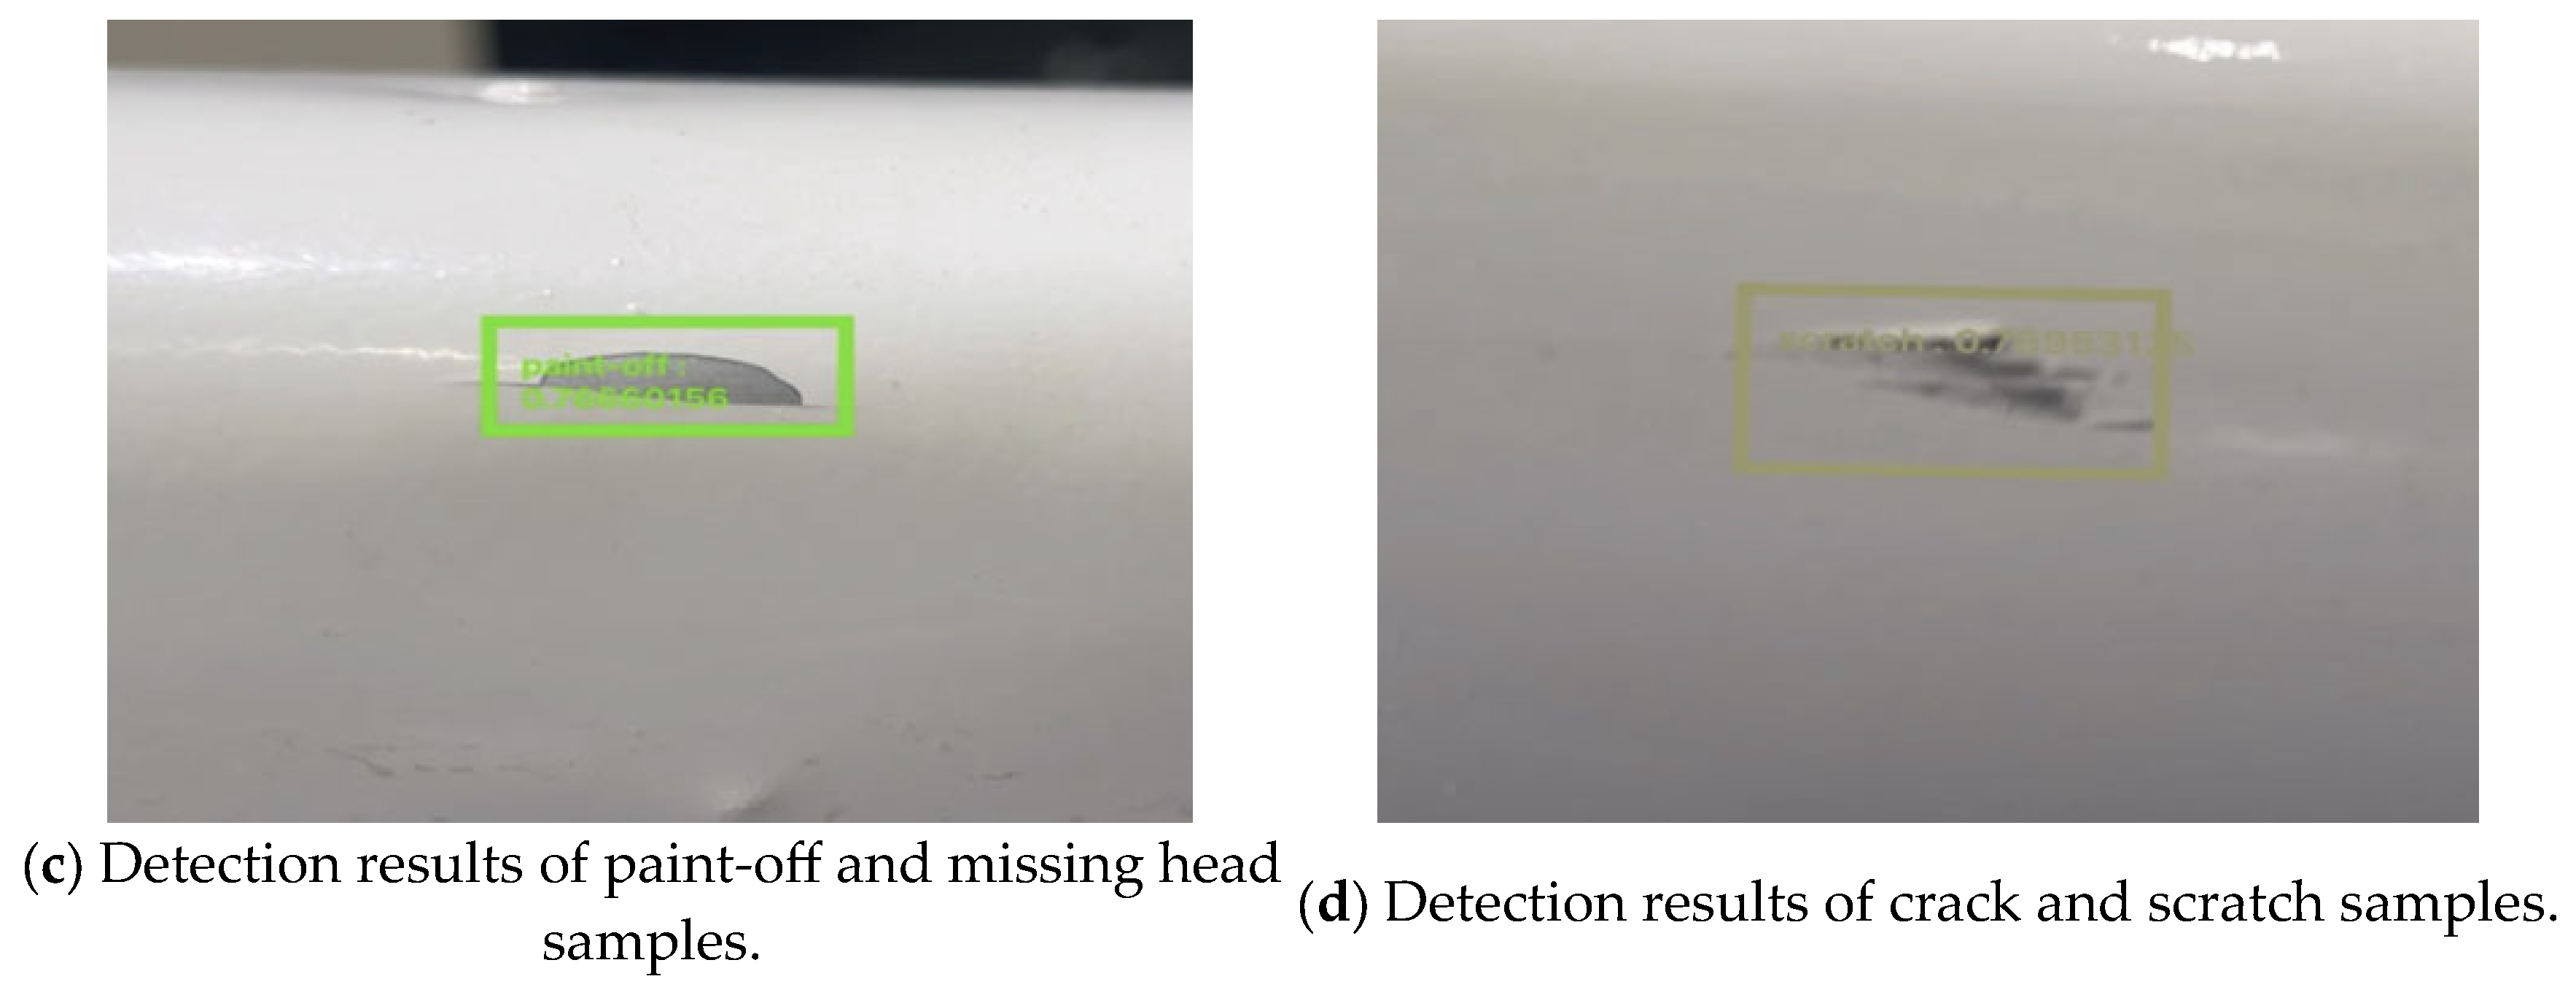
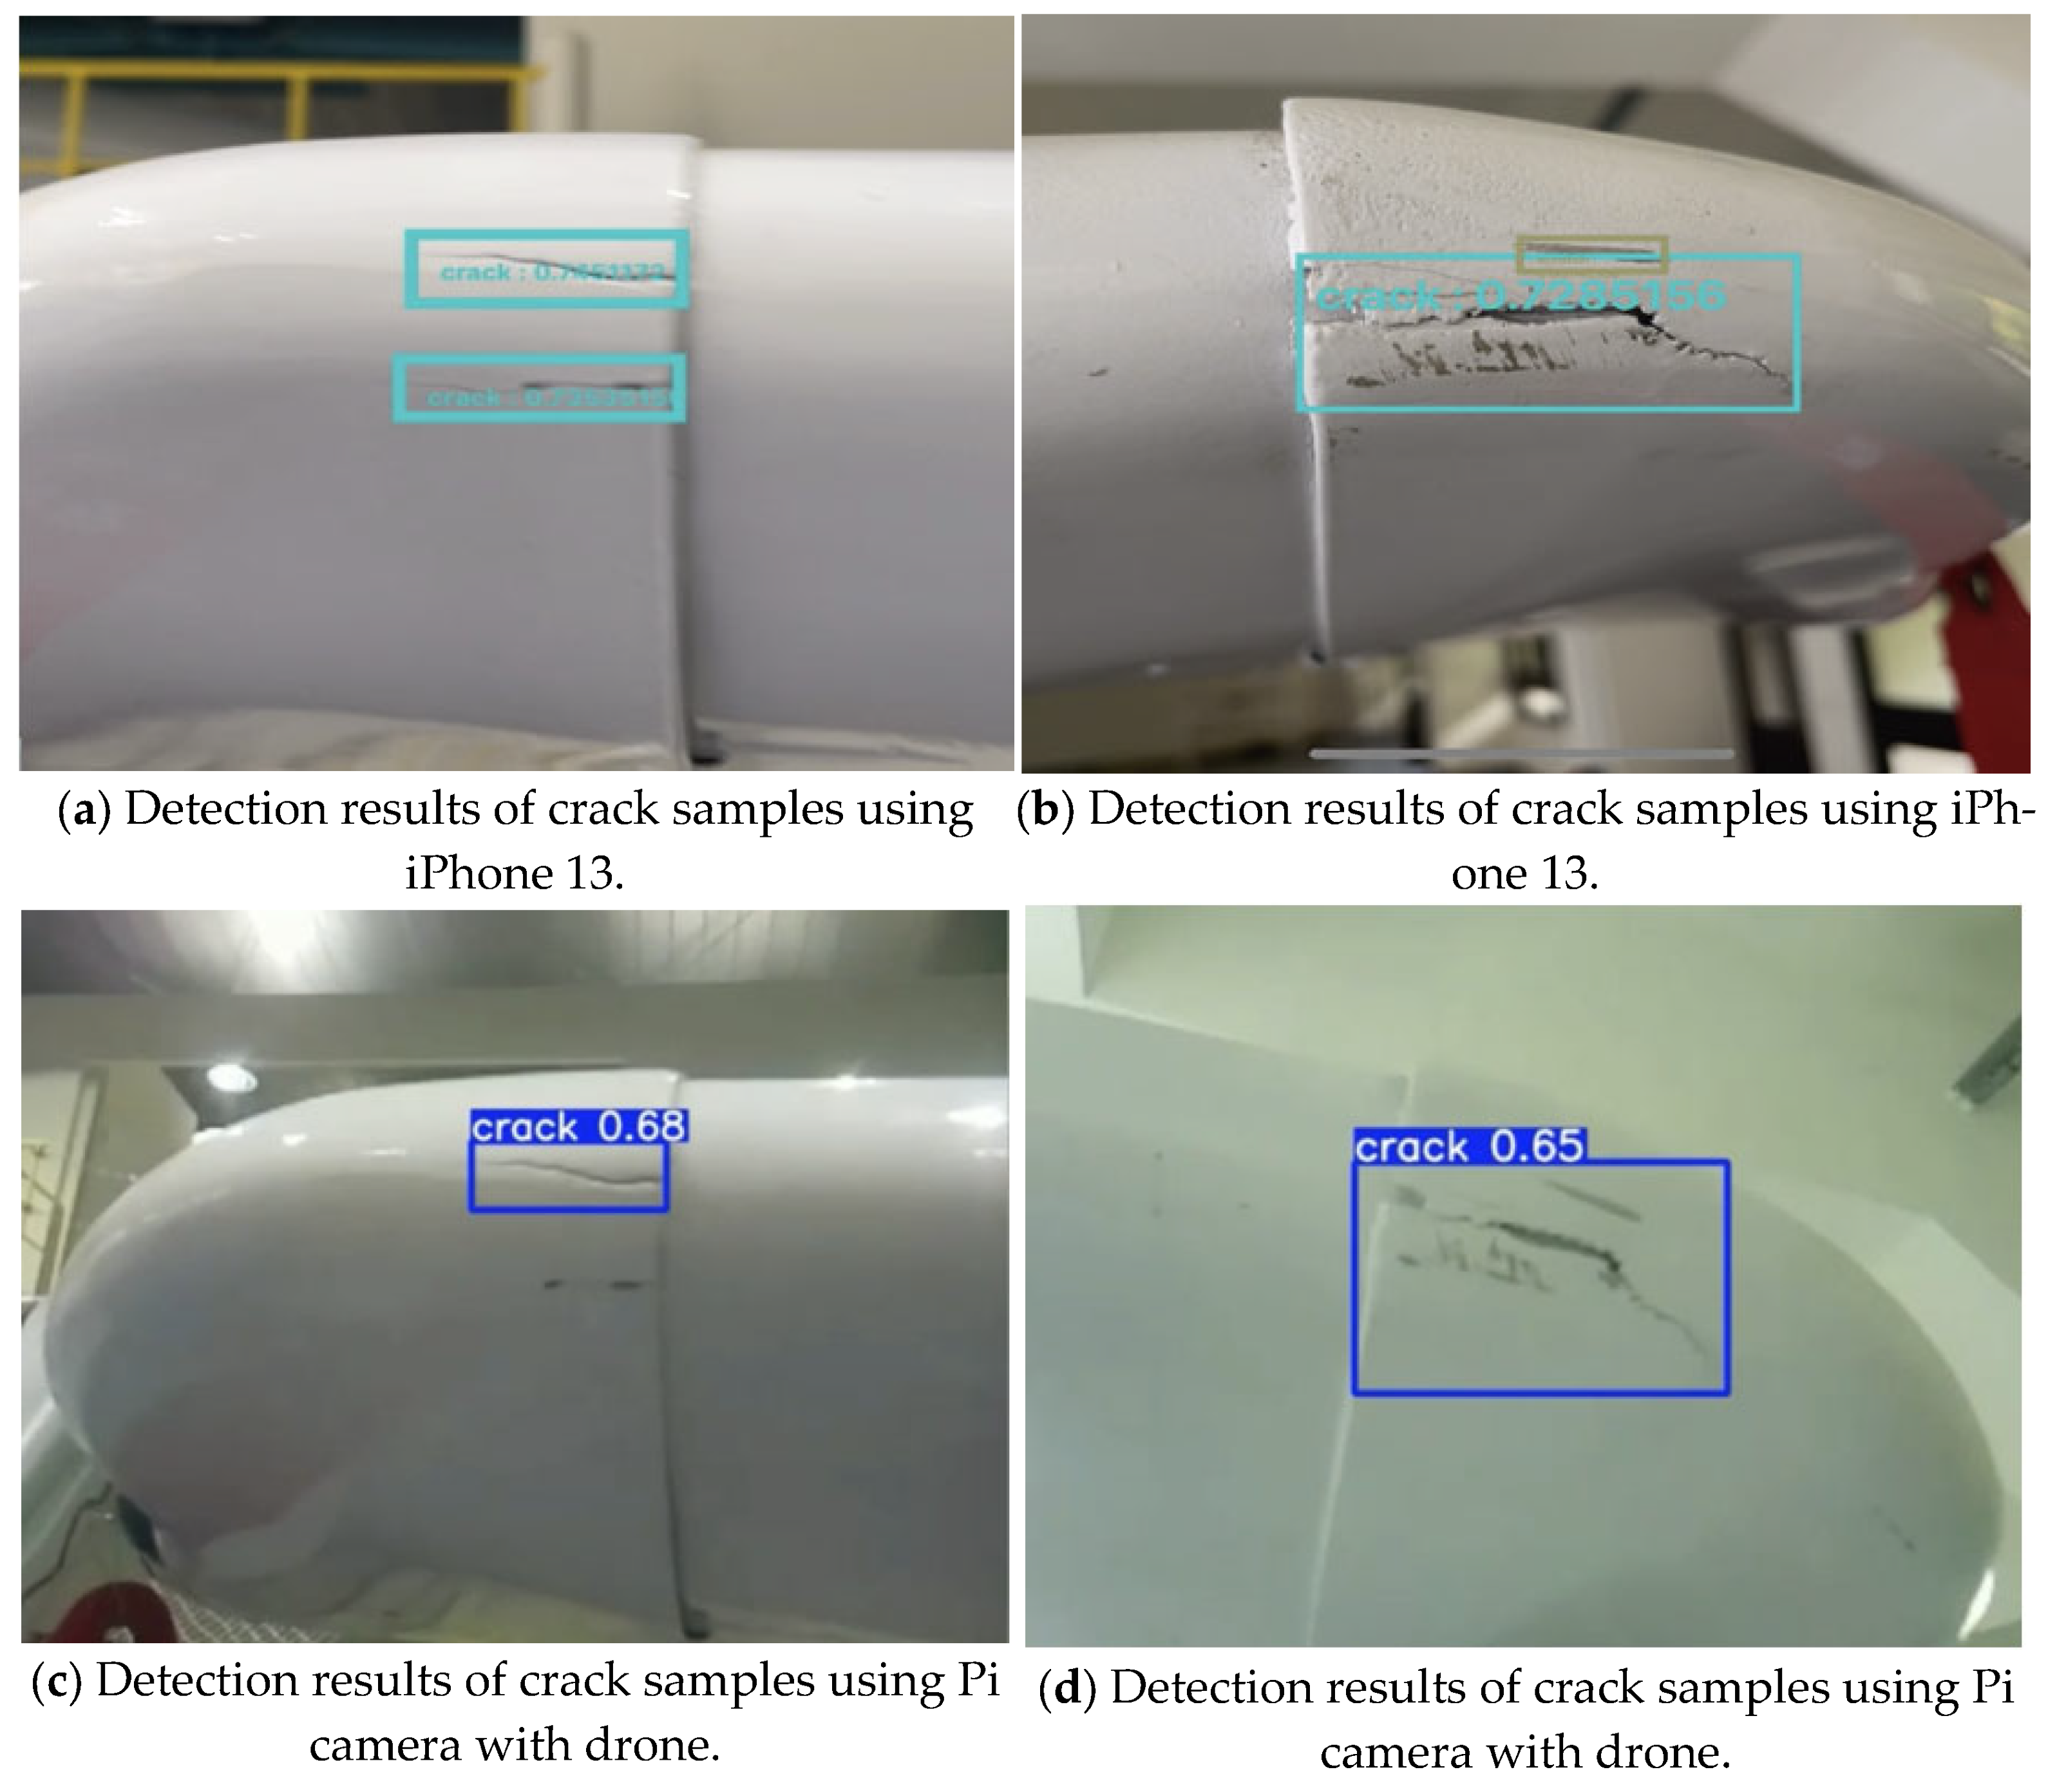
In the practical session, the developed application was installed on the mobile phone mentioned in Table 1. The imagery captured by the device’s built-in camera was used as input to the model to perform image detection. The results were transferred to an RTMP server, and the processed results were then transmitted to other IoT devices. Figure 17a–d show the detection results obtained during the session.
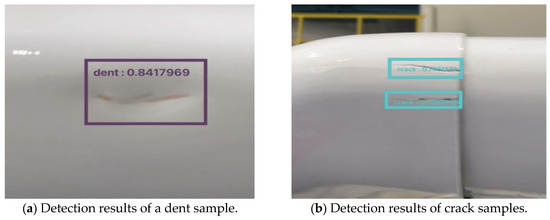
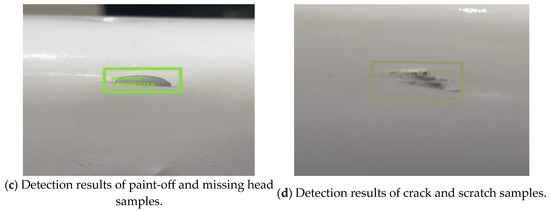
Figure 17.
Examples of detection results.
3.3. RTMP Server Latency
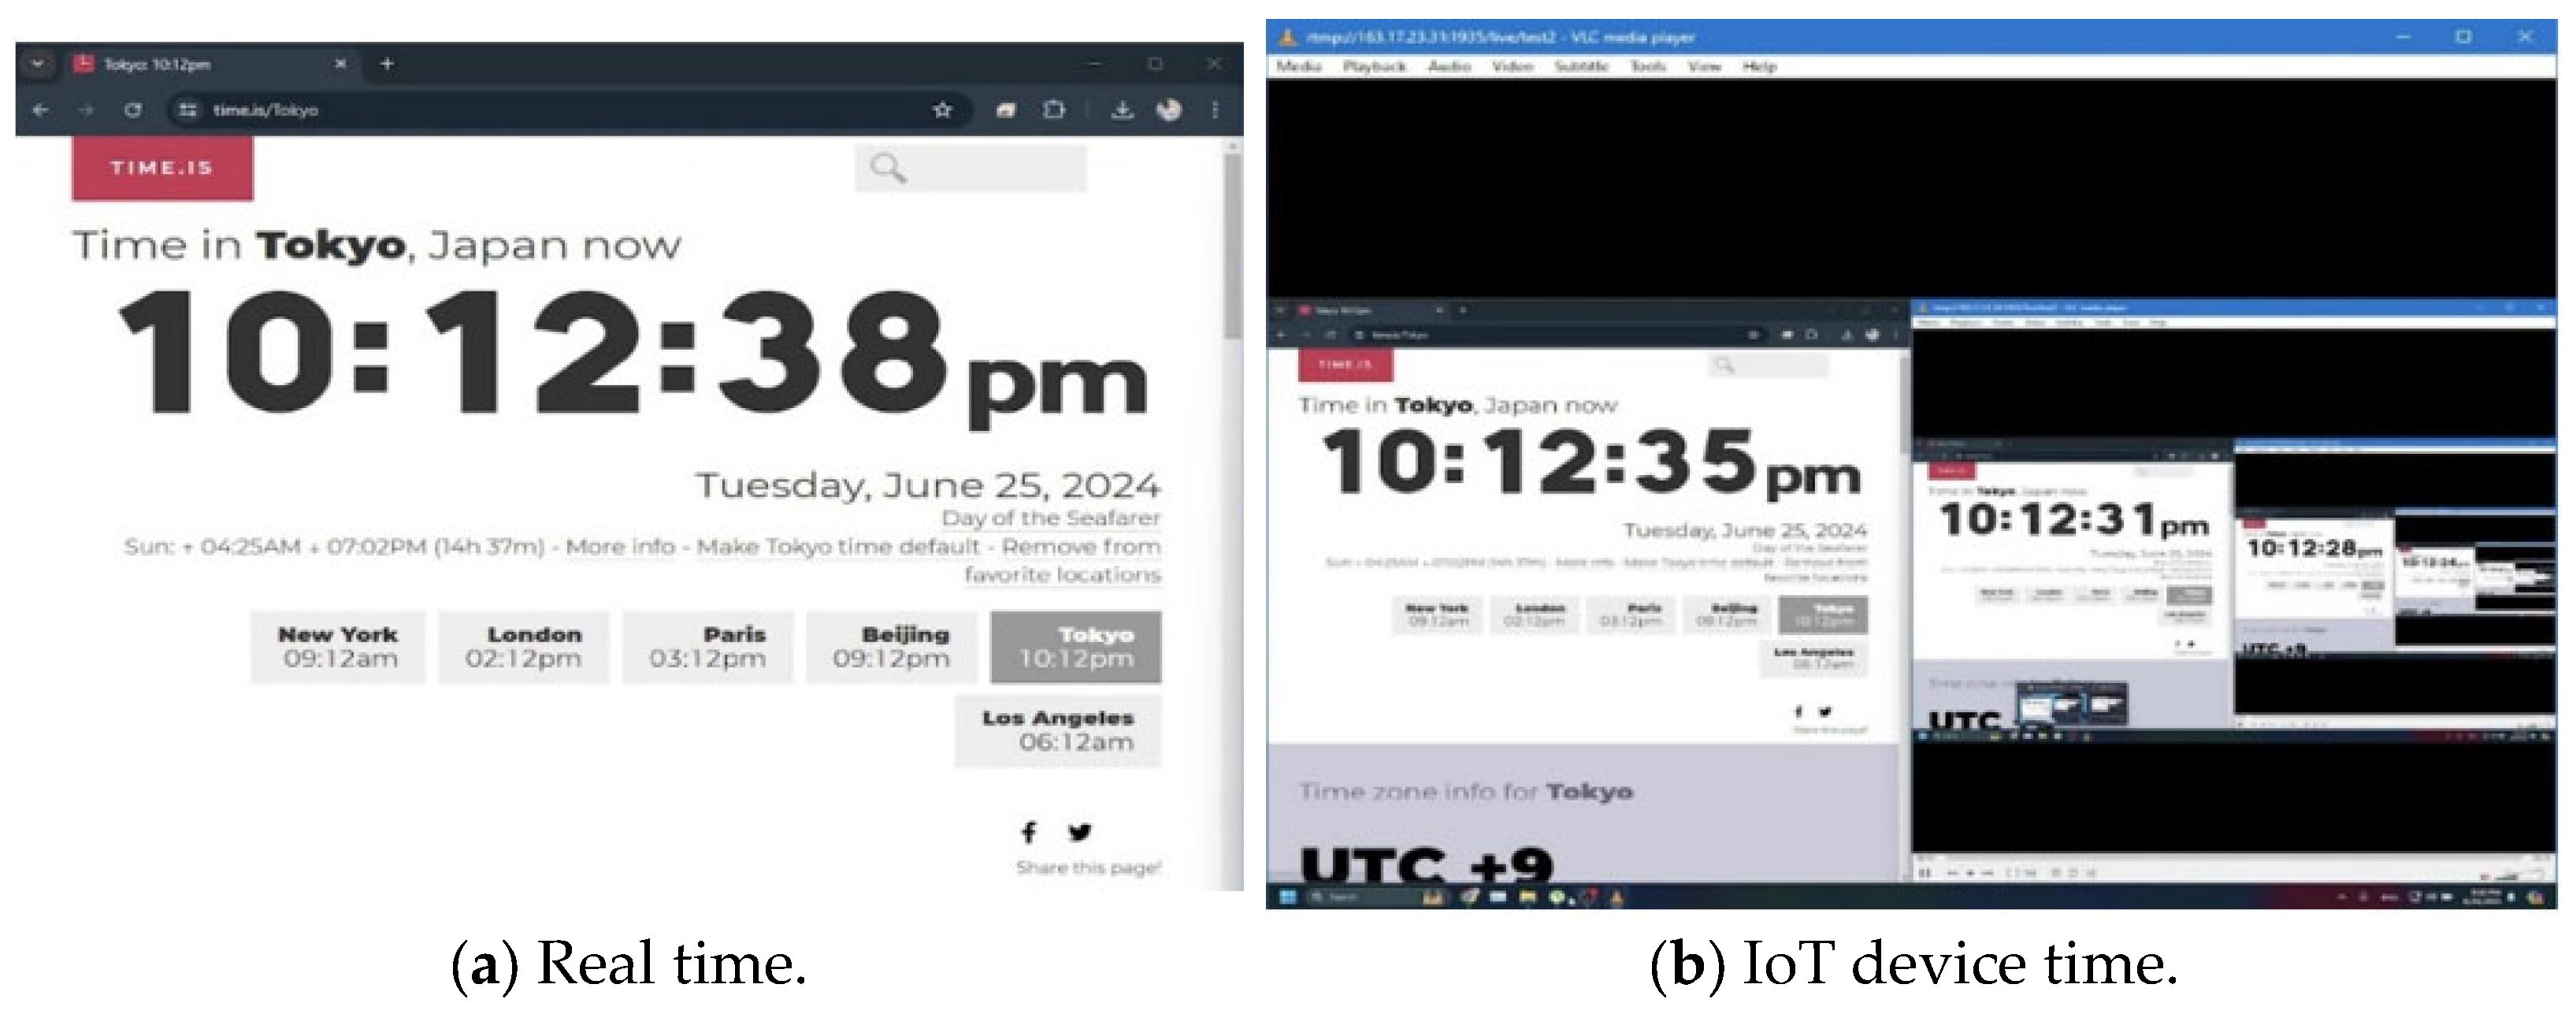
Figure 18 shows the overall latency of the constructed RTMP server in this project. To test the system’s overall latency, a clock was set on the screen (Figure 18a), and the opened window was then streamed to the RTMP server. On an IoT device, the same timer was streamed to test the latency (Figure 18b). As shown in Figure 18, the original clock (Figure 18b) was streamed to the server with an additional latency of 3 seconds under a download speed of 26.62 Mbps and an upload speed of 13.51 Mbps.
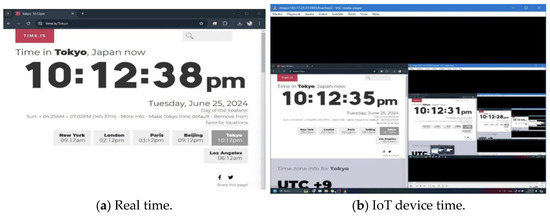
Figure 18.
Latency test results.
4. Discussion
4.1. Application Performance
The model selected in the later stage of the experiment was YOLOv9c. Although the YOLOv9 model had the highest FLOPs among the models discussed in Table 3, it outperformed the others, indicating its powerful ability to detect defects as trained and its good adaptation to the prepared dataset. As the main concern of the study was to design a relatively lightweight device for the operator to use during inspection, we compared the performance of two mobile devices, including an iPhone 13 and a Raspberry Pi 4 with camera module 3. Figure 19a–d show a comparison of the devices mentioned. The comparison was intended solely to identify whether and to what extent the camera specifications affected the detection capability of the application on each device. In Figure 19a,c, the detection is performed on the right wing of a Cessna, where two crack samples can be found adjacent to each other on the same surface. As shown in Figure 19a, the iPhone camera could detect the crack on the surface, while in Figure 19c, only the larger crack was recognized by the Pi camera. The same situation also occurred with the other set of data, in Figure 19b, where a small scratch could be found above the crack, but the Pi camera failed to recognize it in Figure 19d.
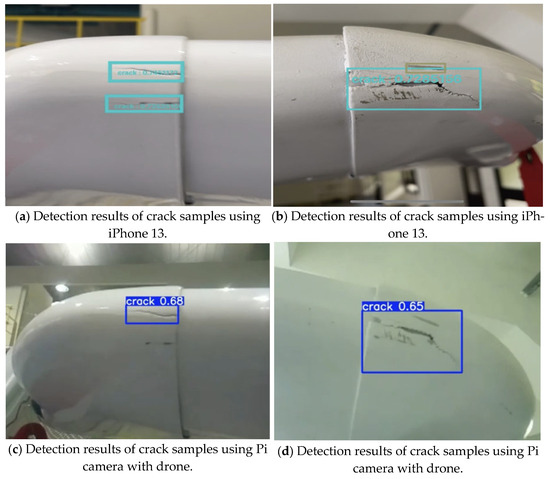
Figure 19.
Comparison of results from different devices.
Despite the fact that the Pi camera is lighter in weight, it was much more difficult to use due to its insufficient computational capability. It often failed to launch, had a high occurrence rate of false negatives and performed poorly on the same sample compared to the iPhone.
4.2. Reliability during Continuous Operation
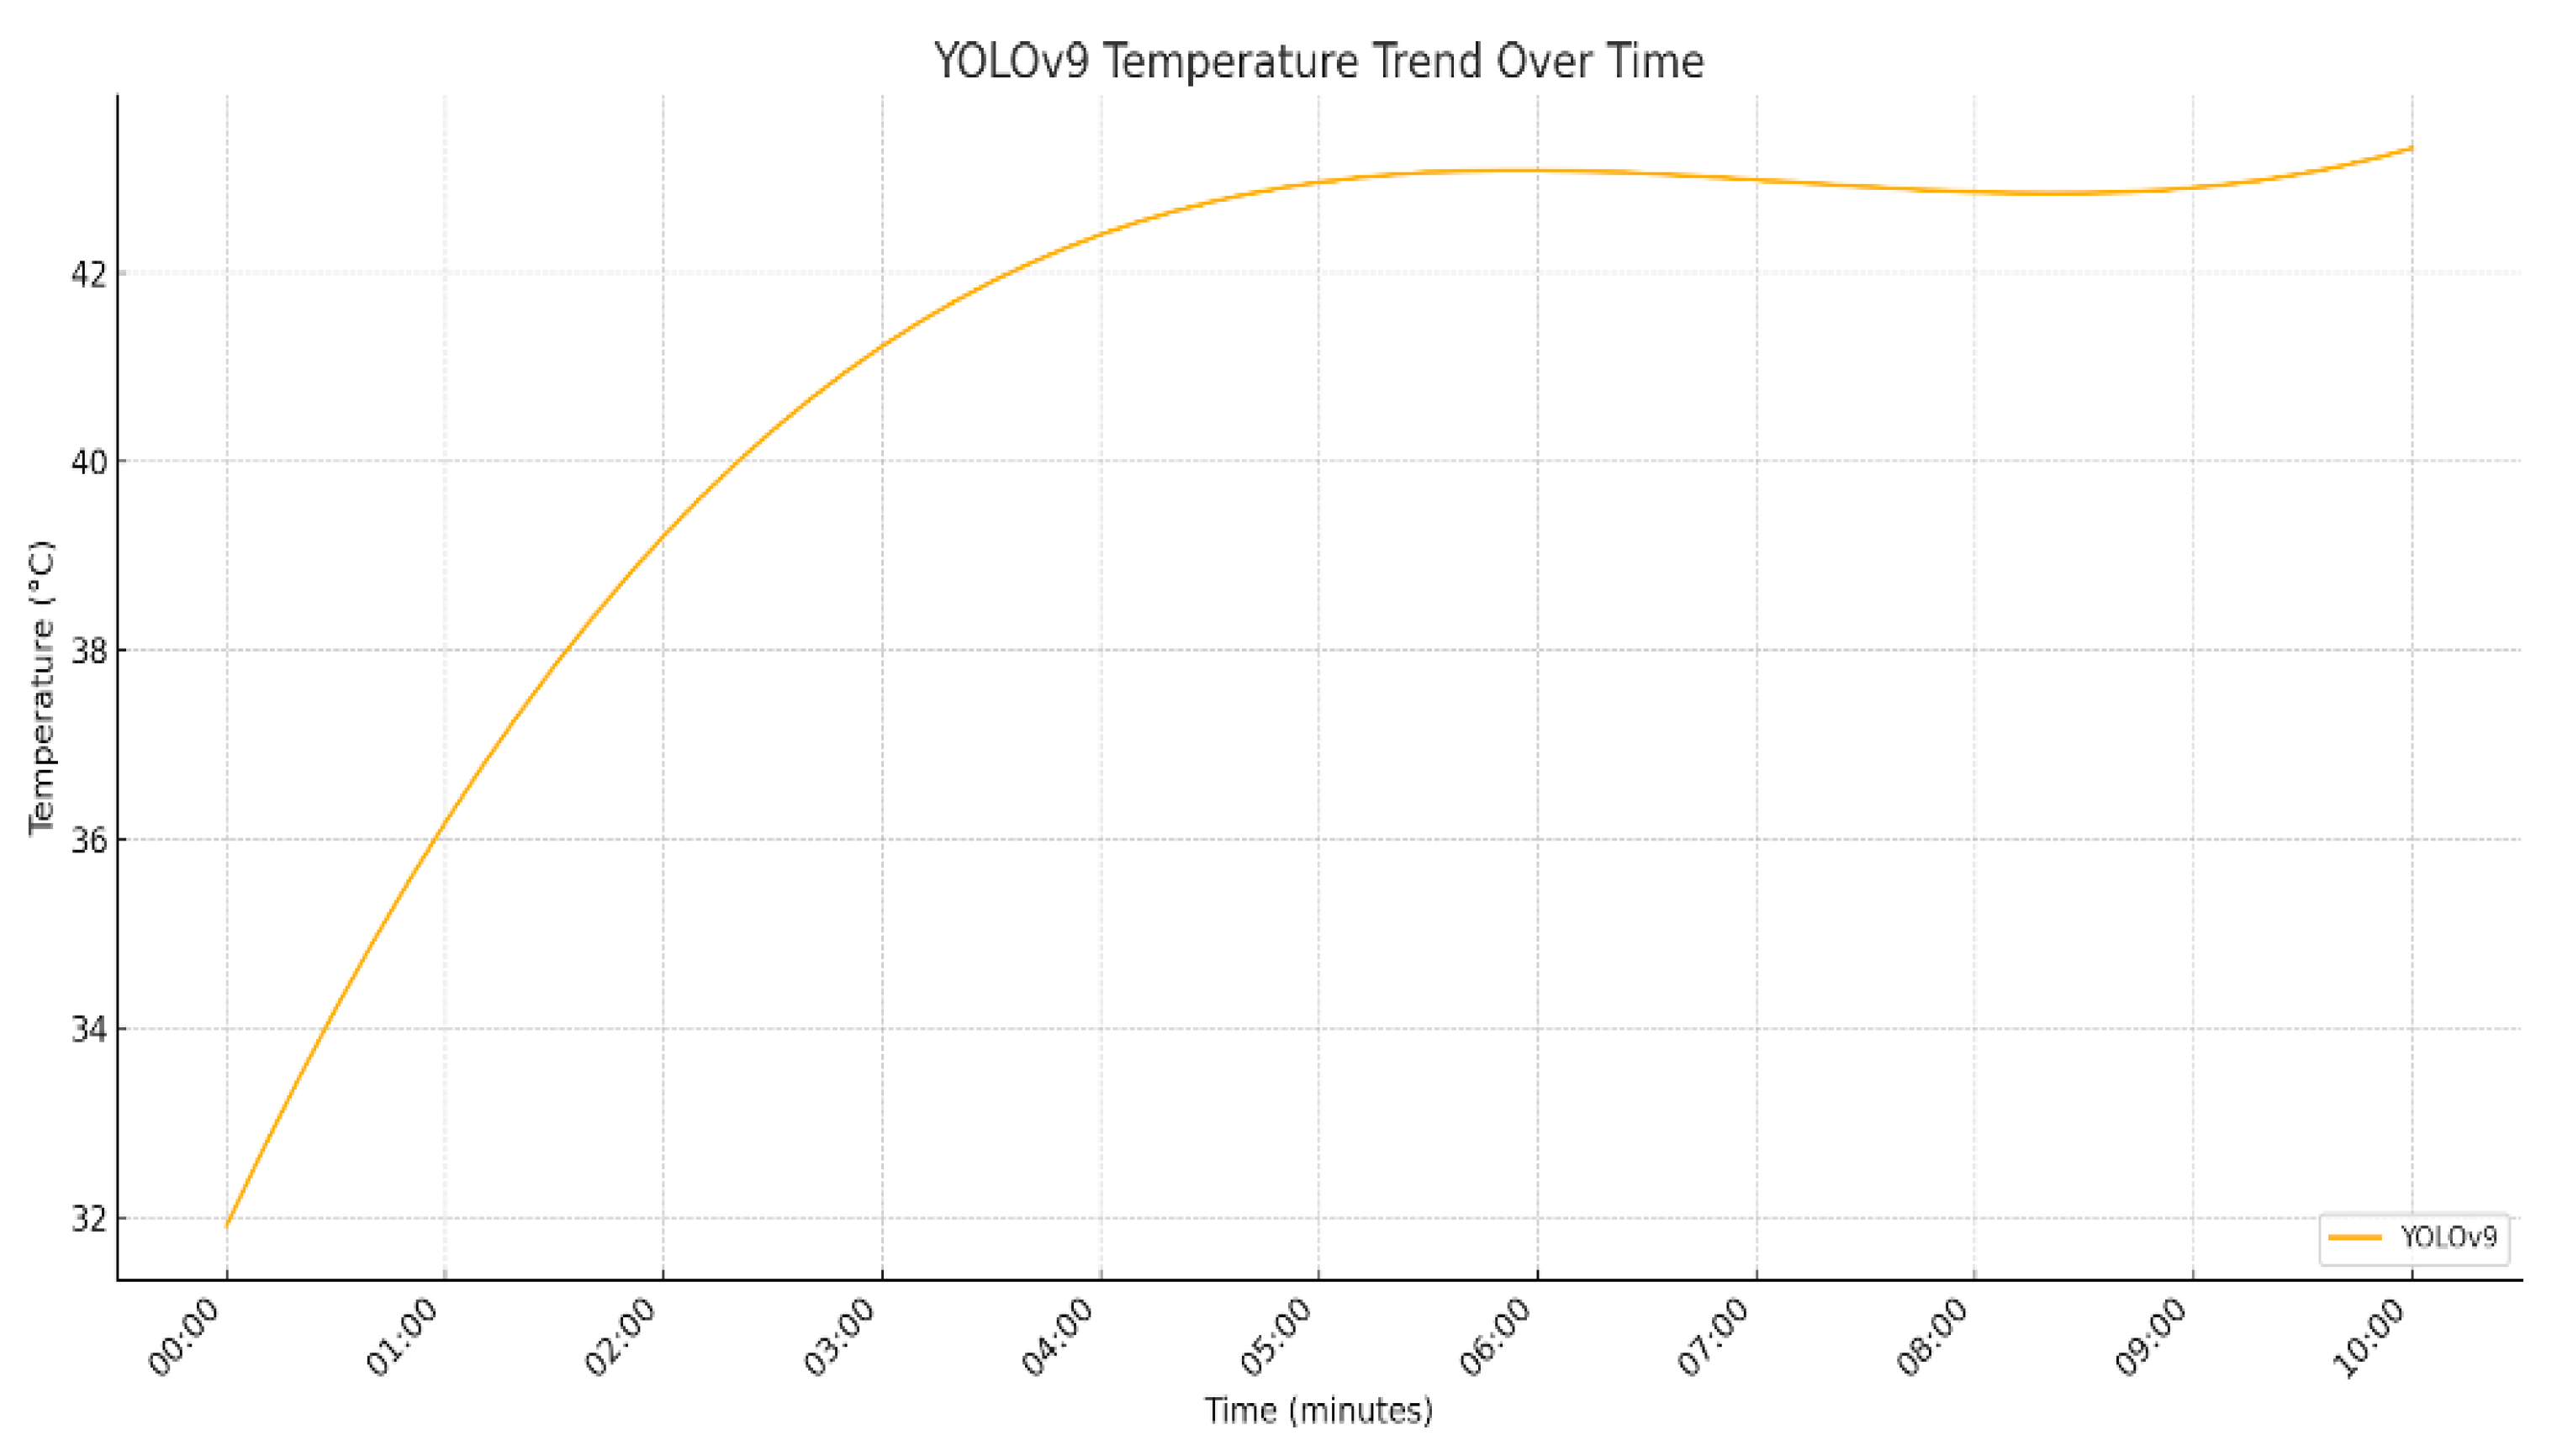
For the lightweight devices, as the computational unit came directly from the mobile phone, the high usage of the chip generated a lot of heat during operation. The figure below shows the increase in the temperature of the iPhone 13 observed during a 10 min detection session, with the room temperature at 32 °C.
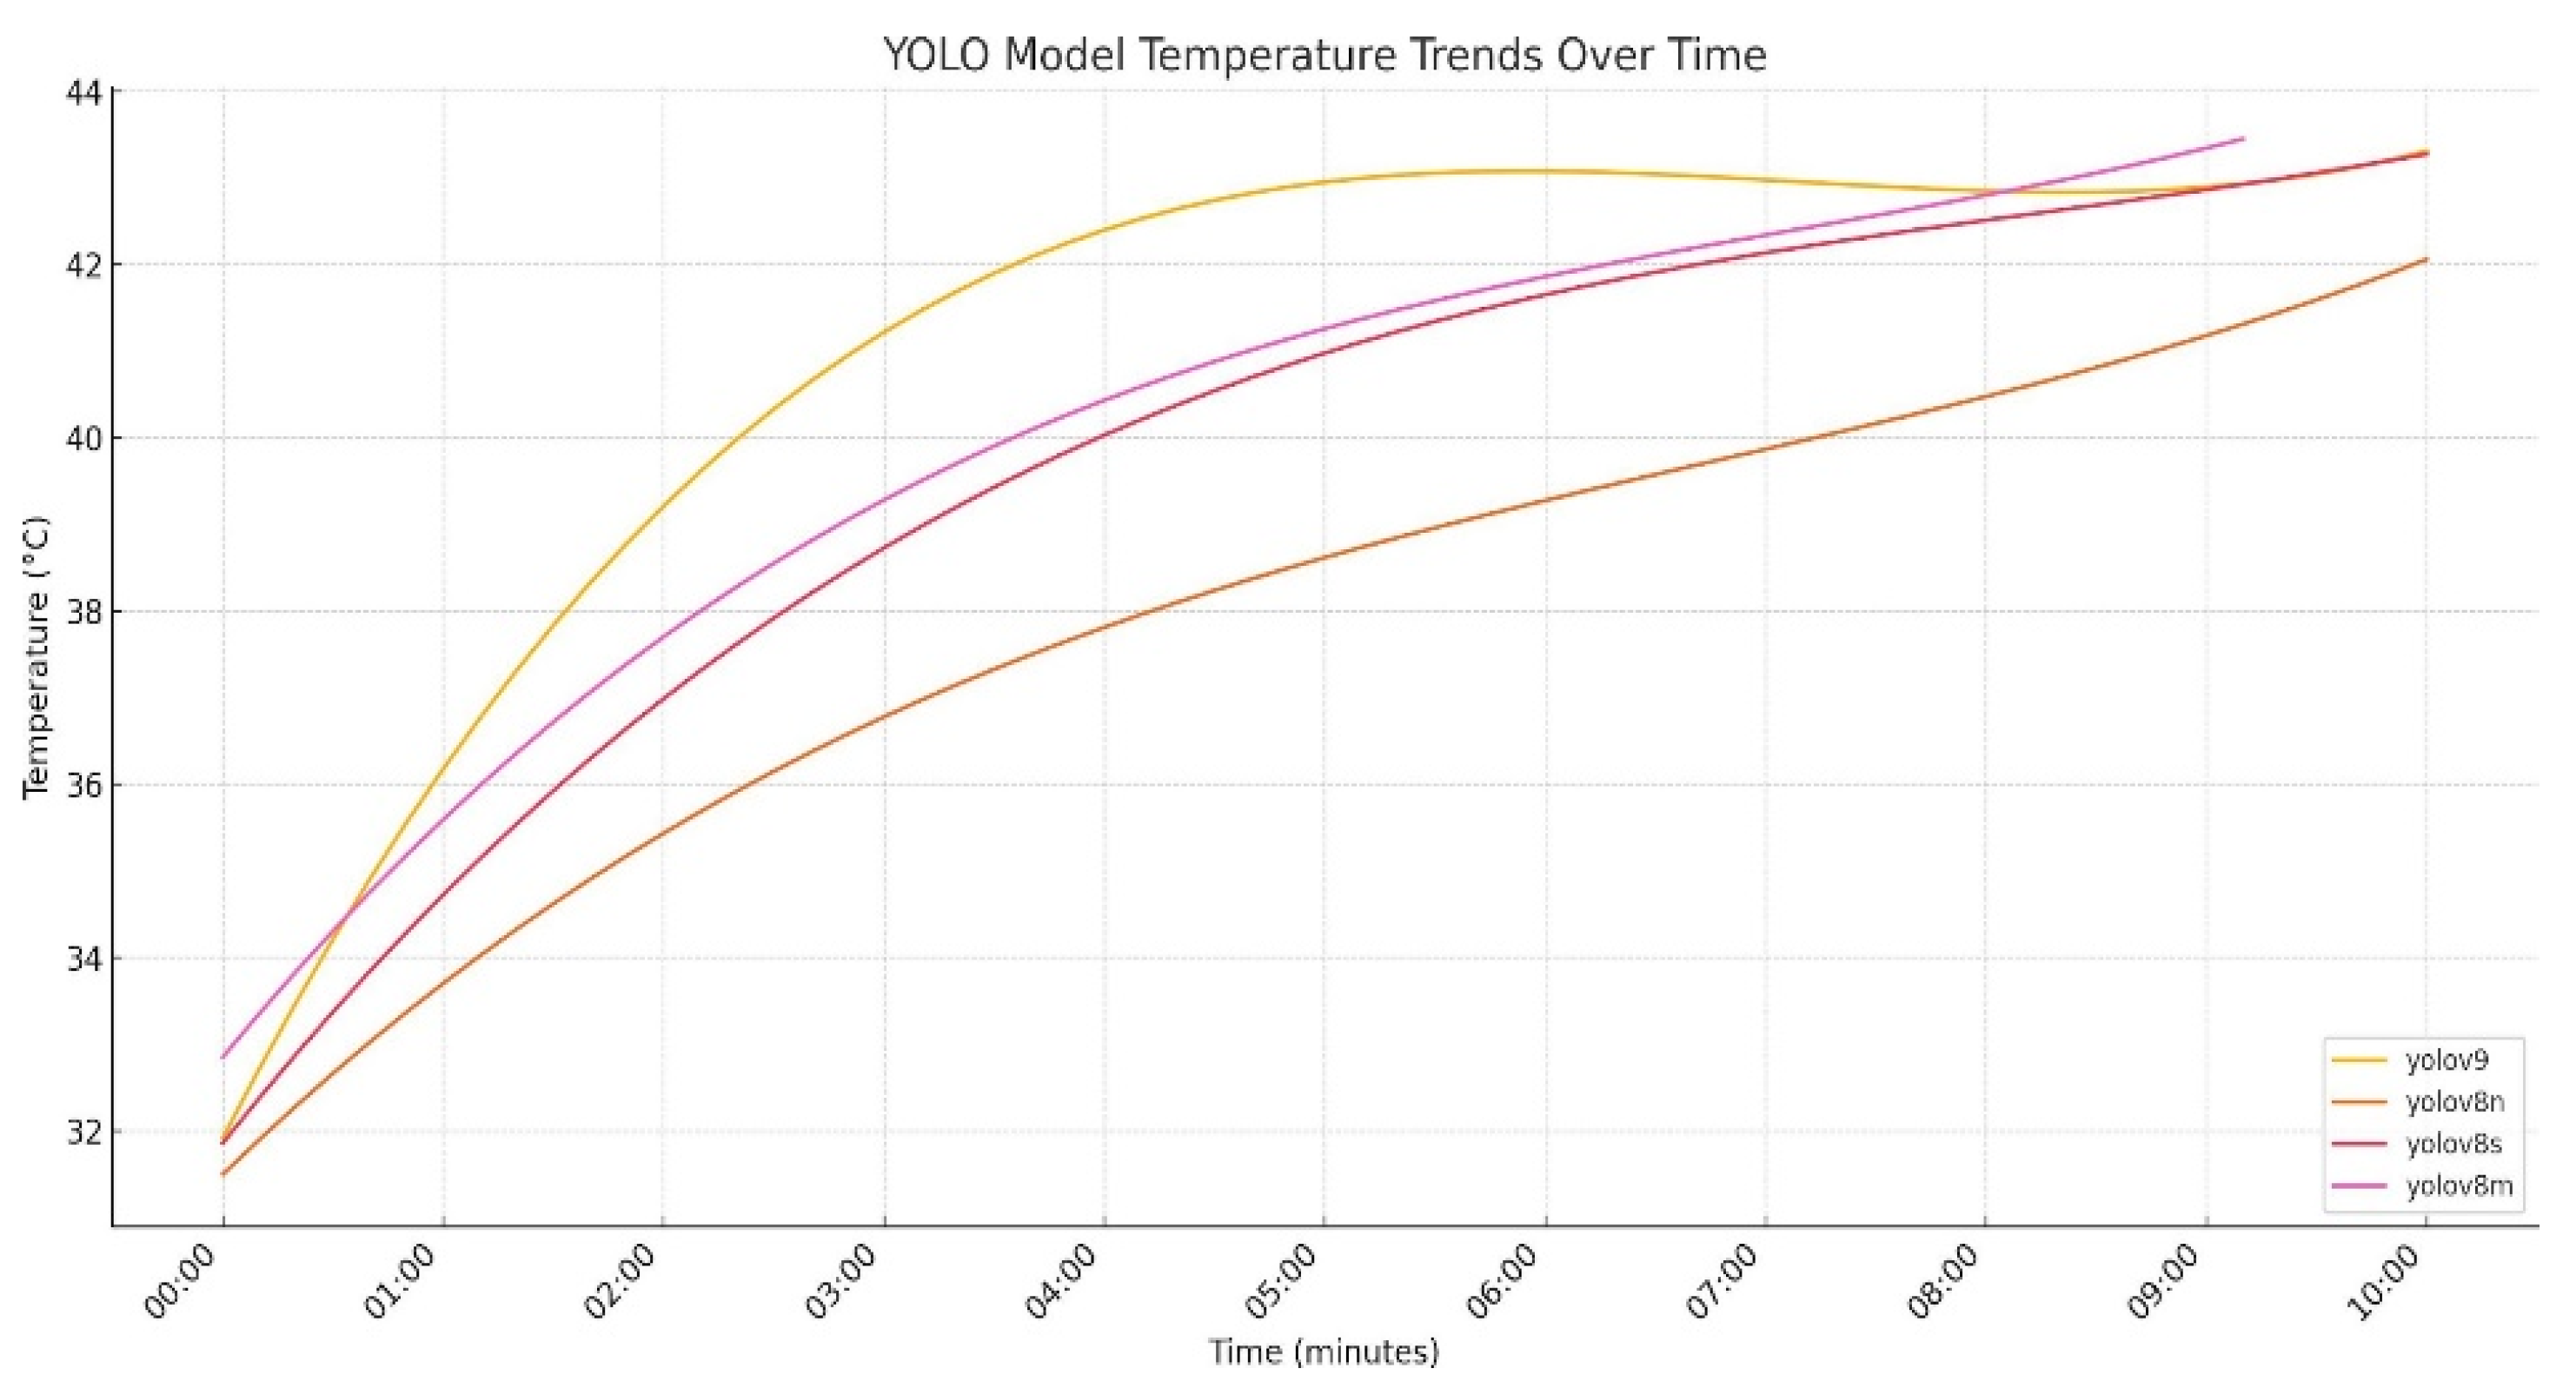
As shown in Figure 20, the temperature rose beyond the operational limit of the camera within the first few minutes of the detection session. This resulted in high latency for the camera and significantly reduced the endurance of the detection system. Since YOLOv9c was the model with the highest FLOPs in this project, the same test was run using the other models to investigate the issue. The figure below shows the results of the test, illustrating the increase in temperature during the first 10 min of operation with YOLOv8 Nano, Small, Medium and YOLOv9 Compact at a room temperature of 32 °C.
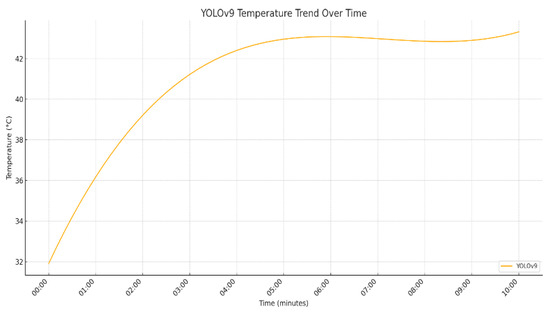
Figure 20.
Temperature change over time using YOLOv9c model on iPhone 13.
As shown in Figure 21, YOLOv9c exhibited the highest rate of temperature increase, while YOLOv8 Nano, the model with the smallest FLOPs, had the lowest rate of temperature increase. Although YOLOv8 Nano showed the lowest rate of temperature rise, all models reached a high temperature after approximately 10 min of operation. This is concerning, as the device’s endurance only lasts about 10 min, regardless of the computational resources used.
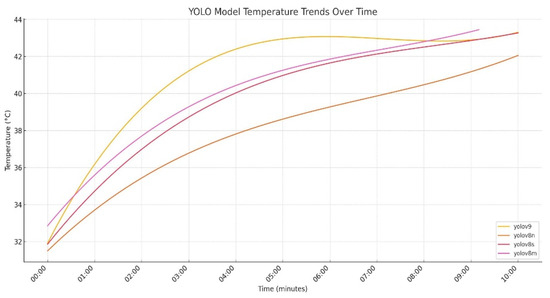
Figure 21.
Temperature change over time using YOLO models on iPhone 13.
4.3. Possible Alternative Approach
Due to the heat produced by the high usage of the computational unit, an alternative approach was designed to transfer the computational workload to other equipment. Instead of using the iPhone to process the input image, the system transfers the input image via an RTMP server, allowing a computer to access and process the imagery input.
The results can then be exported and streamed to another channel of the RTMP server, allowing the user to review the results. By doing so, the system’s endurance can be greatly increased, allowing for a longer operational duration. However, this approach reduces the system’s robustness, as it requires a strong and stable connection on both ends to maintain the flow of the detection process, which may be difficult to achieve. Figure 22 shows the flowchart of the alternative system.
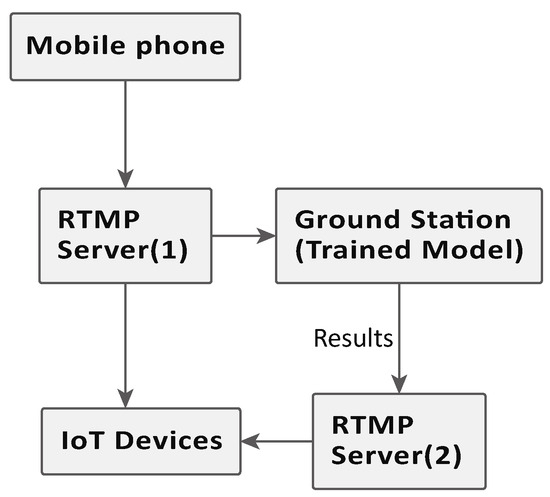
Figure 22.
Flowchart explaining an alternative approach for overheating detection device.
4.4. False Results
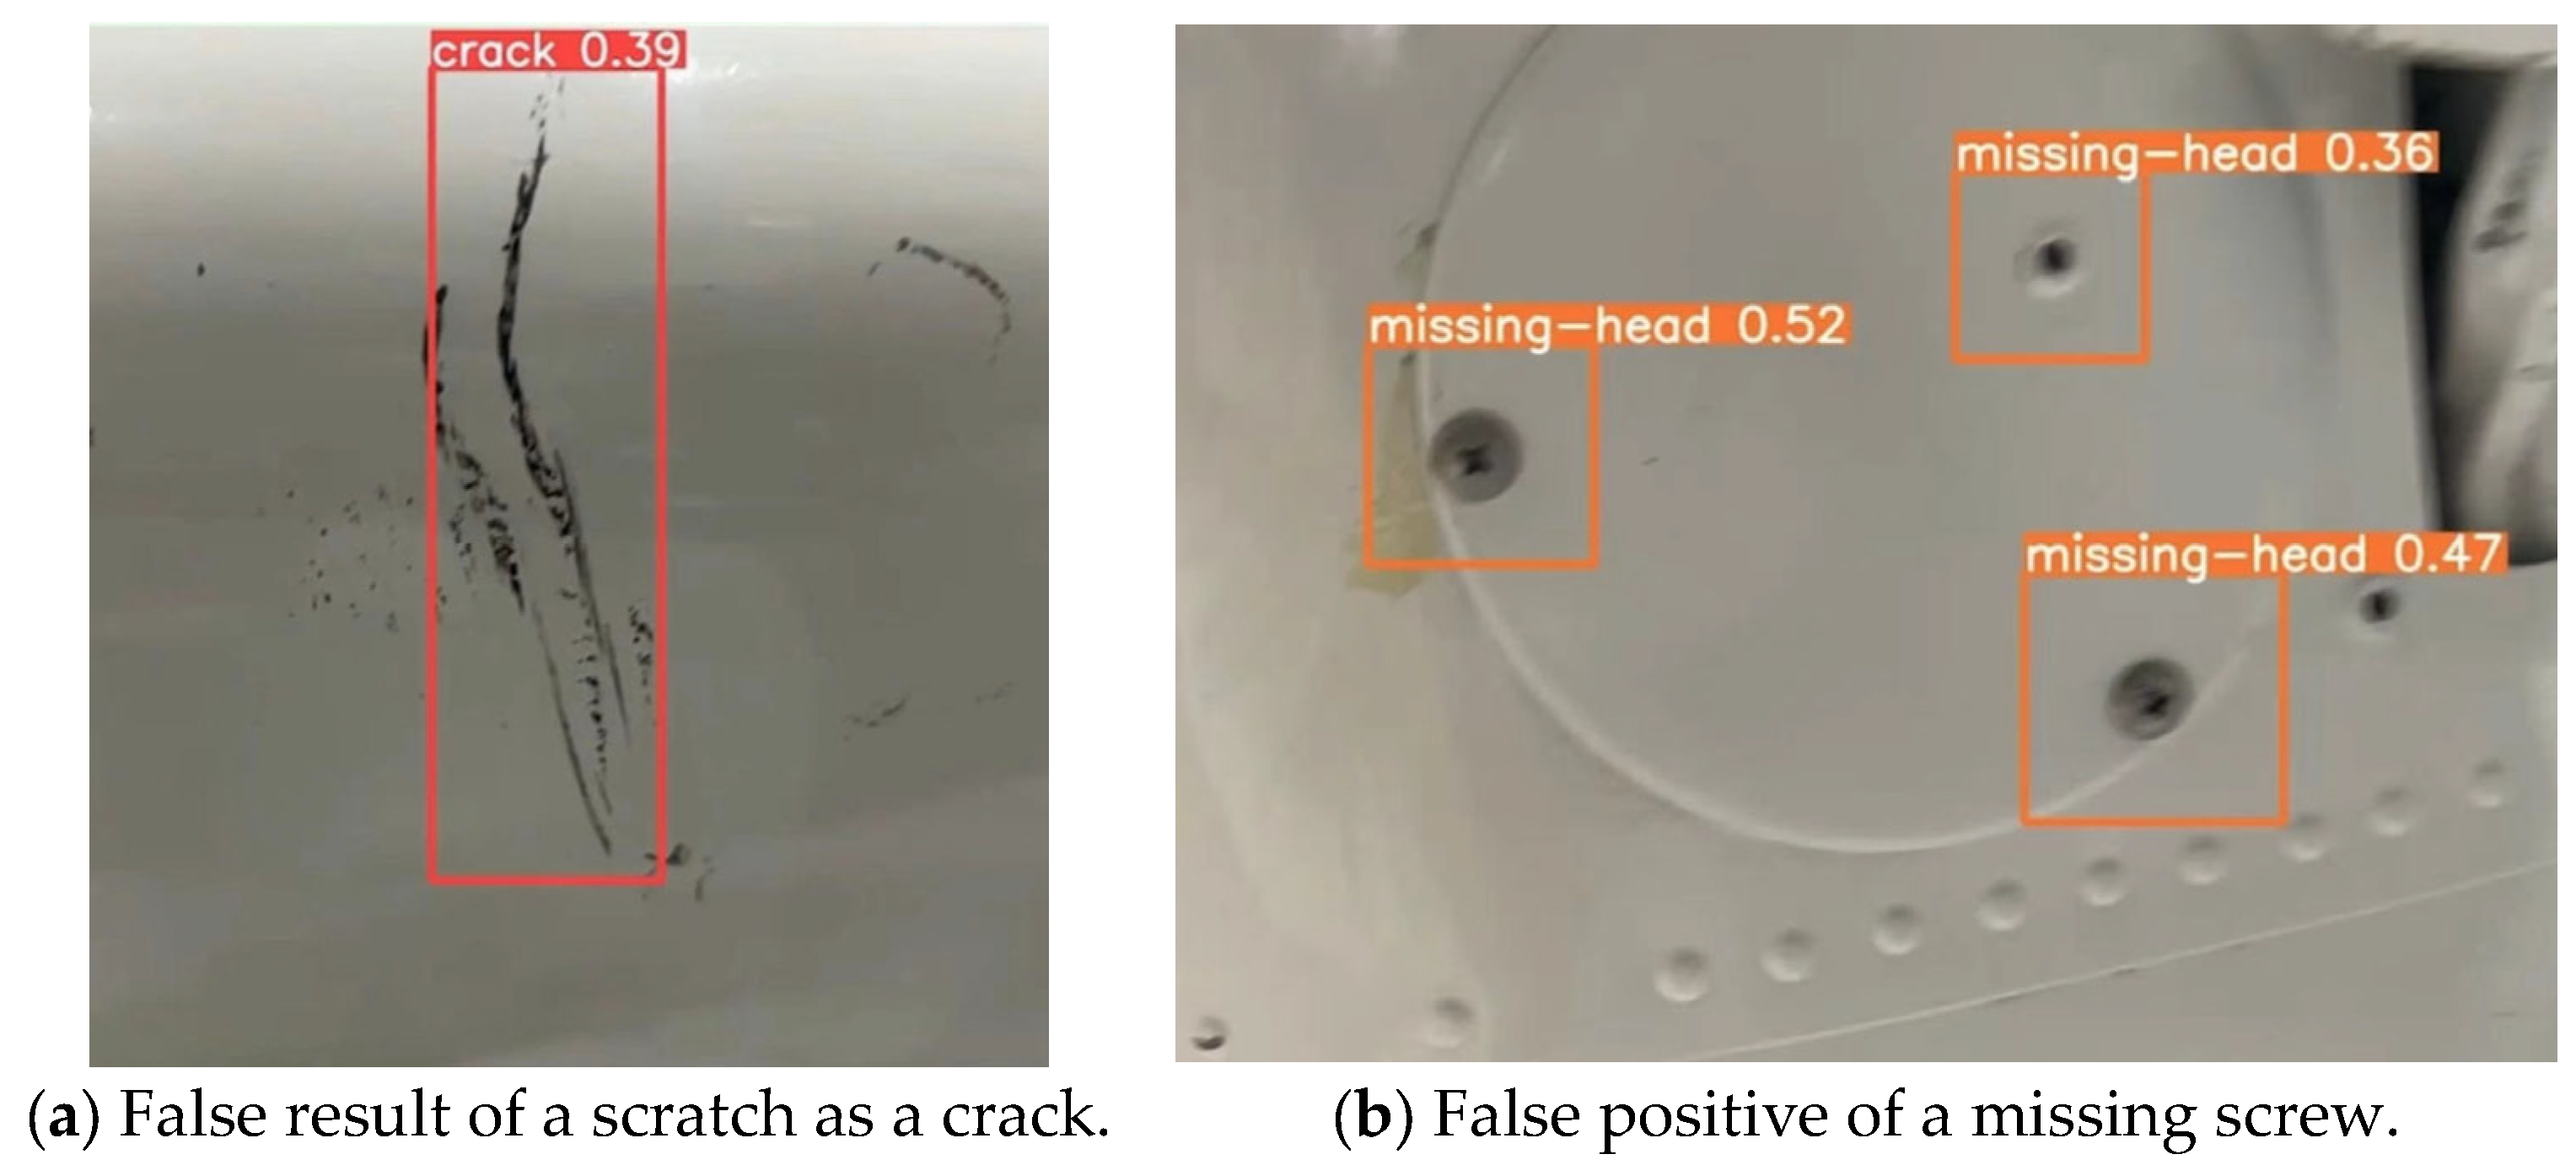
One of the challenges in this project is the false negative, which is due to the low recall rate, and false positive, which may mistakenly identify objects such as cables and shadows as defects or, in most cases, cracks. This may due to the crack being a black line, which can hardly be distinguished from cables. Some issues can also affect the detection. Low light or harsh glare can decrease recognition accuracy. With the tests performed, it is suggested that the condition was due to the low aperture of the UAV camera, as the error did not occur as much when using a mobile phone as the image source under harsh glare. Insufficient or saturated algorithm training could increase error detection. The future approach is aiming to obtain more data on the defects under various light conditions. Figure 23 shows the example of false results recorded during the test.
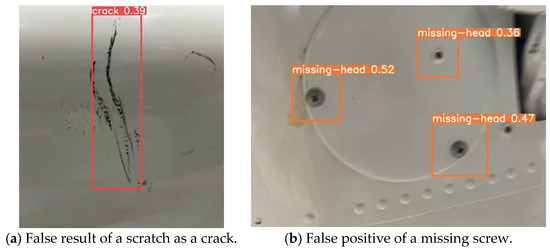
Figure 23.
Examples of false results.
To lower the occurrence rate of false results that may occur due to change in imagery input, including the displacement, scaling and spatial rotation, which are difficult to avoid in the real world, aside from the augmentation process that enhances the dataset, defect samples aim to collect as many features as possible from different perspectives. However, with the limited samples, the challenge still remains, as the defects featured are mostly random in shape and location on the aircraft. Further improvement is needed for the system to be sufficiently reliable for use in the industry.
5. Conclusions
In this study, a system was developed to achieve a real-time detection system using the YOLOv9 algorithm. The system successfully detects various surface defects on the aircraft, such as cracks, dents, missing heads, scratches and paint-offs. Moreover, the development of an RTMP server allows for real-time monitoring and evaluation of the detection results via IoT devices.
Our experimental results demonstrated a high mean average precision (mAP@0.5) of 0.853 across all classes, indicating the system’s robustness and potential for enhancing aircraft safety inspections. However, challenges related to device overheating and latency during continuous operation significantly impact the system’s reliability. To address this, an alternative approach was implemented to transfer the computational workload to other equipment, thereby extending the system’s operational endurance. This alternative approach requires a stable and robust network connection but significantly reduces the risk of overheating.
Overall, the developed detection system presents a promising solution for automating aircraft surface inspections, offering enhanced accuracy, efficiency and reliability. Future work will focus on optimizing the system’s performance in terms of reliability, reducing the demand on the processing unit and improving its scalability and robustness.
Author Contributions
K.-C.L.: Conceptualization, data curation, validation, methodology, visualization; K.-C.L., J.L. and M.H.: Resources, writing—original draft preparation, writing—review and editing. All authors have read and agreed to the published version of the manuscript.
Funding
This research received no external funding.
Informed Consent Statement
Not applicable.
Data Availability Statement
Data are contained within the article.
Acknowledgments
This work was supported by the National Science and Technology Council of Taiwan.
Conflicts of Interest
The authors declare no conflicts of interest.
Abbreviations
The following abbreviations are used in this manuscript:
| UAV | Unmanned Aerial Vehicle |
| CNN | Convolutional Neural Network |
| YOLO | You Only Look Once |
| RTMP | Real-Time Messaging Protocol |
| IoT | Internet of Things |
| mAP | Mean Average Precision |
| CUDA | Compute Unified Device Architecture |
| CUDNN | CUDA Deep Neural Network |
| OS | Operating System |
| SGD | Stochastic Gradient Descent |
| NAdam | Nesterov-Accelerated Adaptive Moment Estimation |
| DFL | Distribution Focal Loss |
| IoU | Intersection Over Union |
| YAML | YAML Ain’t Markup Language |
References
- LeCun, Y.; Bengio, Y.; Hinton, G. Deep Learning: Advances and Perspectives. Nat. Rev. Phys. 2023, 5, 436–444. [Google Scholar]
- Bochkovskiy, A.; Wang, C.-Y.; Liao, H.-Y. YOLOv4: Optimal Speed and Accuracy of Object Detection. arXiv 2022, arXiv:2004.10934. [Google Scholar]
- Liu, W.; Anguelov, D.; Erhan, D.; Szegedy, C.; Reed, S.; Fu, C.; Berg, A.C. SSD: Single Shot MultiBox Detector. In Proceedings of the 14th European Conference, Amsterdam, The Netherlands, 11–14 October 2016; pp. 21–37. [Google Scholar] [CrossRef]
- Ren, S.; He, K.; Girshick, R.; Sun, J. Faster R-CNN: Towards Real-Time Object Detection with Region Proposal Networks. IEEE Trans. Pattern Anal. Mach. Intell. 2017, 39, 1137–1149. [Google Scholar] [PubMed]
- Rodriguez-Gallo, Y.; Escobar-Benitez, B.; Rodriguez-Lainez, J. Robust Coffee Rust detection using UAV-based aerial RGB imagery. AgriEngineering 2023, 5, 1415–1431. [Google Scholar] [CrossRef]
- Wang, X.; Gao, H.; Jia, Z.; Li, Z. BL-YOLOv8: An Impro ved Road Defect Detection Model Based on YOLOv8. Sensors 2023, 23, 8361. [Google Scholar] [CrossRef] [PubMed]
- Arutyunyan, R. GitHub—Arut/Nginx-Rtmp-Module: NGINX-Based Media Streaming Server. Available online: https://github.com/arut/nginx-rtmp-module (accessed on 25 June 2024).
- Apple Inc. iPhone 13—Technical Specifications. Available online: https://support.apple.com/en-us/111872 (accessed on 15 September 2024).
- DJI Enterprise. Support for Mavic 2 Enterprise. Available online: https://www.dji.com/support/product/mavic-2-enterprise (accessed on 15 September 2024).
- Roboflow. What’s New in YOLOv8. 2023. Available online: https://blog.roboflow.com/whats-new-in-yolov8/ (accessed on 25 June 2024).
- Microsoft. Visual Studio Code, Version 1.80. 2024. Available online: https://code.visualstudio.com/ (accessed on 16 June 2024).
- Van Rossum, G.; The Python Development Team. The Python Language Reference Release 3.12.6. Python Software Foundation. 2024. Available online: https://docs.python.org/3/ (accessed on 25 June 2024).
- Jocher, G.; Burhan, Q.; Laughing, Q. YOLOV9. YOLOv9—Ultralytics YOLOv8 Docs. 2024. Available online: https://docs.ultralytics.com/models/yolov8/#can-i-benchmark-yolov8-models-for-performance (accessed on 25 June 2024).
- Evans, C.; döt Net, I.; Ben-Kiki, O. YAML Ain’t Markup Language (YAML). 2023. Available online: https://yaml.org/ (accessed on 25 June 2024).
- Kaplan, J.; McCandlish, S.; Henighan, T.; Brown, T.B.; Chess, B.; Child, R.; Gray, S.; Radford, A.; Wu, J.; Amodei, D. Scaling Laws for Neural Language Models. arXiv 2023, arXiv:2108.04510. [Google Scholar]
- Géron, A. Hands-on Machine Learning with Scikit-Learn, Keras, and TensorFlow, 2nd ed.; O’Reilly Media: Sebastopol, CA, USA, 2022. [Google Scholar]
- Kluska, P.S.; Castelló, A.; Scheidegger, F.; Malossi, C.; Quintana-Ortí, E.S. QAttn: Efficient GPU Kernels for Mixed-precision Vision Transformers. In Proceedings of the IEEE/CVF Conference on Computer Vision and Pattern Recognition (CVPR) Workshops 2024, Seattle, WA, USA, 17–21 June 2024; pp. 3648–3657. [Google Scholar]
- Goyal, P.; Dollár, P.; Girshick, R.; Noordhuis, P.; Wesolowski, L.; Kyrola, A.; Tulloch, A.; Jia, Y.; He, K. Accurate, Large Minibatch SGD: Training ImageNet in 1 Hour. arXiv 2022, arXiv:1706.02677. [Google Scholar]
- Loshchilov, I.; Hutter, F. Decoupled Weight Decay Regularization. arXiv 2023, arXiv:1711.05101. [Google Scholar]
- Gohil, P. PyTorch Recipes: A Problem-Solution Approach; Packt Publishing: Birmingham, UK, 2023. [Google Scholar]
- Ultralytics. YOLOv5 Data YAML File. 2023. Available online: https://docs.ultralytics.com/yolov5/tutorials/train_custom_data/ (accessed on 25 June 2024).
- Bengio, Y. A View of Deep Learning’s Impact on Society. Commun. ACM 2022, 65, 58–63. [Google Scholar]
- Tong, C.; Yang, X.; Huang, Q.; Qian, F. NGIoU Loss: Generalized Intersection over Union Loss Based on a New Bounding Box Regression. Appl. Sci. 2022, 12, 12785. [Google Scholar] [CrossRef]
- Zhang, Y.; Ren, W.; Zhang, Z.; Jia, Z.; Wang, L.; Tan, T. Focal and efficient IOU loss for accurate bounding box regression. Neurocomputing 2022, 506, 146–157. [Google Scholar] [CrossRef]
- Wang, X.; Cheng, P.; Liu, X.; Uzochukwu, B. Focal loss dense detector for vehicle surveillance. In Proceeding of the 2018 International Conference on Intelligent Systems and Computer Vision (ISCV), Fez, Morocco, 2–4 April 2018; pp. 1–5. [Google Scholar] [CrossRef]
- Kaur, R.; Singh, S. A comprehensive review of object detection with deep learning. Digit. Signal Process. 2023, 132, 103812. [Google Scholar] [CrossRef]
- Ultralytics. YOLOv8 Models Performance Metrics. 2023. Available online: https://docs.ultralytics.com/guides/yolo-performance-metrics/ (accessed on 25 June 2024).
- Majima, D. Yolov8 RealTime iOS. 2023. Available online: https://github.com/john-rocky/CoreML-Models (accessed on 26 June 2024).
- Canonical Ltd. Ubuntu 20.04.6 LTS, Desktop-amd64 ISO; Canonical Ltd.: London, UK, 2023; Available online: https://ubuntu.com/download/desktop (accessed on 16 June 2024).
- Nurrohman, A.; Abdurohman, M. High Performance Streaming Based on H264 and Real Time Messaging Protocol (RTMP). In Proceedings of the 2018 6th International Conference on Information and Communication Technology (ICoICT), Bandung, Indonesia, 3–5 May 2018; pp. 174–177. [Google Scholar] [CrossRef]
Disclaimer/Publisher’s Note: The statements, opinions and data contained in all publications are solely those of the individual author(s) and contributor(s) and not of MDPI and/or the editor(s). MDPI and/or the editor(s) disclaim responsibility for any injury to people or property resulting from any ideas, methods, instructions or products referred to in the content. |
© 2024 by the authors. Licensee MDPI, Basel, Switzerland. This article is an open access article distributed under the terms and conditions of the Creative Commons Attribution (CC BY) license (https://creativecommons.org/licenses/by/4.0/).

