Abstract
Timely, objective pain recognition in dairy cattle is essential for welfare assurance, productivity, and ethical husbandry yet remains elusive because evolutionary pressure renders bovine distress signals brief and inconspicuous. Without verbal self-reporting, cows suppress overt cues, so automated vision is indispensable for on-farm triage. Although earlier systems tracked whole-body posture or static grimace scales, frame-level detection of facial micro-expressions has not been explored fully in livestock. We translate micro-expression analytics from automotive driver monitoring to the barn, linking modern computer vision with veterinary ethology. Our two-stage pipeline first detects faces and 30 landmarks using a custom You Only Look Once (YOLO) version 8-Pose network, achieving a 96.9% mean average precision () at an Intersection over the Union (IoU) threshold of 0.50 for detection and 83.8% Object Keypoint Similarity (OKS) for keypoint placement. Cropped eye, ear, and muzzle patches are encoded using a pretrained MobileNetV2, generating 3840-dimensional descriptors that capture millisecond muscle twitches. Sequences of five consecutive frames are fed into a 128-unit Long Short-Term Memory (LSTM) classifier that outputs pain probabilities. On a held-out validation set of 1700 frames, the system records 99.65% accuracy and an F1-score of 0.997, with only three false positives and three false negatives. Tested on 14 unseen barn videos, it attains 64.3% clip-level accuracy (i.e., overall accuracy for the whole video clip) and 83% precision for the pain class, using a hybrid aggregation rule that combines a 30% mean probability threshold with micro-burst counting to temper false alarms. As an early exploration from our proof-of-concept study on a subset of our custom dairy farm datasets, these results show that micro-expression mining can deliver scalable, non-invasive pain surveillance across variations in illumination, camera angle, background, and individual morphology. Future work will explore attention-based temporal pooling, curriculum learning for variable window lengths, domain-adaptive fine-tuning, and multimodal fusion with accelerometry on the complete datasets to elevate the performance toward clinical deployment.
1. Introduction
Detecting pain in dairy cattle accurately is an unresolved and critical problem in animal welfare. Animals can suffer from pain caused by various health conditions, such as mastitis, metritis, lameness, infections, etc., as well as environmental reasons. Pain erodes the quality of life of the animals and silently drains farm productivity through reduced milk yields, impaired immunity, and higher veterinary costs, creating an ethical and economic imperative to intervene early [1]. Evolution, however, has prepared cattle to mask their distress [2]. As prey animals, they minimize conspicuous behaviors that might attract predators, so their overt pain signals are rare, fleeting, and low-amplitude. The conventional tools such as locomotion scoring, heart-rate telemetry, and vocal-sound counting often miss these subtle cues and demand invasive devices or continuous expert oversight, making them impractical for large herds and commercial barns [3].
Researchers from different domains have been exploring into animal welfare and production more in recent years, and lately, both farmers and researchers have been leaning towards automated, non-invasive solutions for dairy cattle management. Identifying and addressing stress and pain in dairy cows from implicit cues by analyzing body movements, gestures, behaviors, and facial expressions are some applications in this domain [4]. Researchers have shown that discomfort or pain in dairy cows can arise for several types of health reasons/diseases, as well as due to farming operations and environmental factors, like crowdedness, heat stress, poor technology, and rough handling [5]. Although manual and sensor-based animal welfare monitoring has been popular for decades, computer-vision-based approaches and multimodal data analyses combining sensor and visual information show significant improvements in automated systems for animal monitoring and emotion recognition [6,7,8,9,10].
Over the past decade, researchers have turned to facial expression analysis as a non-intrusive lens for mammalian nociception (i.e., the process of detecting and transmitting signals in nervous systems for potential damaging stimuli) [11,12]. Studies have been conducted on large domestic animals like horses, pigs, and cows to monitor their facial expressions from images, video frames, and real-time observations during different types of pain (i.e., painful diseases, dental treatments, lameness, castration, laparotomy, farrowing, etc.) and assess and analyze their pain scores using both manual and automated systems [13,14,15]. In sheep, pigs, and horses, discrete Facial Action Units (FAUs) correlate reproducibly with both natural pain and experimentally induced pain, suggesting that rapid cranio-facial reflexes can outsmart voluntary suppression [16,17,18]. The biological rationale is well established: the nociceptive input propagates through cranial nerves V (i.e., the trigeminal nerve) and VII (i.e., the facial nerve), driving reflex contractions in the periocular, perinasal, and perioral muscles that remain difficult to inhibit at will [19,20]. Even species that dampen their lameness or visceral discomfort cannot entirely hide these muscle activations, which arise milliseconds after noxious stimulation [21,22].
Bovine behaviorists have cataloged a repertoire of such markers of long- and short-term discomfort in cattle animals of different breeds and ages [23,24,25]. Ear position asymmetry, orbital tightening, tension above the eye, nostril flare, and mouth-strain geometry all increase after painful procedures like dehorning or mastitis induction [26,27]. The Calf Grimace Scale (CGS) formalizes six FAUs with high inter-observer agreement, giving practitioners a shared lexicon for pain scoring for nonhuman mammals [28,29]. Even with a high volume of exploratory research, these protocols remain fundamentally static. Each frame is paused, examined, and annotated by trained observers, throttling the throughput, embedding subjective bias, and discarding the temporal dynamism that may distinguish short-lived discomfort from benign facial idiosyncrasy [30].
Artificial intelligence (AI) studies have begun to automate facial analysis, but most still use coarse labels such as ‘pain’ or ‘no pain’ assigned to entire images or videos, ignoring the sub-second time structure that characterizes acute distress [31]. This omission is crucial because the most diagnostic events are the involuntary micro-expressions—muscle twitches lasting between 1/25 s and 1/3 s—that psychologists and security agencies have long exploited to unveil concealed emotion in humans [32,33,34,35].
Human-factors engineering has already harnessed micro-expression analytics for driver-state monitoring [36]. In advanced driver-assistance systems, lightweight convolutional–recurrent networks ingest live video, amplify tiny pixel motions through optical flow or Eulerian magnification, and flag drowsiness or aggression with frame-level precision [37]. Architectures such as MobileNetV2 or RM-Xception funnel spatial features into LSTM heads, achieving millisecond responsiveness while running on edge devices [38]. Recent work has enhanced its sensitivity through time-series fusion and attention-weighted pooling, preserving accuracy across faces, lighting modes, and camera angles [39,40].
Our hypothesis states that these temporal-expression architectures can be transplanted to cattle after anatomical calibration. Bovine facial musculature is simpler than human musculature yet still offers enough contractile diversity in the eye, ear, and muzzle regions to betray the nociceptive load through brief asymmetries and aperture changes [41]. Early feasibility studies in livestock vision hinted at this possibility, but they either relied on static landmarks or used frame-level models without explicit temporal reasoning [42,43,44].
To scrutinize the hypothesis, we designed an end-to-end temporal vision system tailored to barn conditions (Figure 1). A YOLOv8-Pose [45] backbone isolated the face and placed thirty anatomically coherent landmarks with real-time throughput and a robust performance in oblique or overhead camera views. Region of Interest (ROI) patches from the eyes, ears, and muzzle were fed into a pretrained MobileNetV2 [46] encoder that condensed each frame into a 3840-dimensional descriptor sensitive to fine-grained gradients. A 128-unit LSTM [47] stitched together five-frame sequences, learning motion trajectories that separated nociceptive twitches from benign facial jitter [48]. At the video level, probability averaging and burst-density heuristics tempered false alarms, borrowing the confidence-weighting logic from driver-monitoring systems.
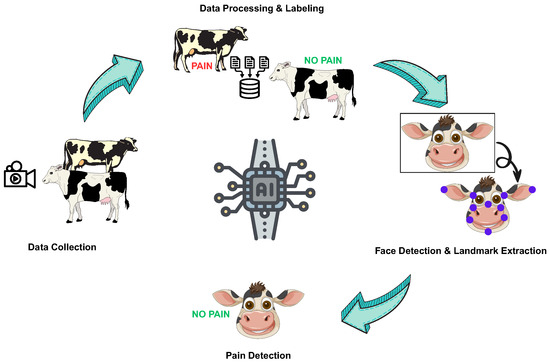
Figure 1.
A simplified and summarized framework for automated pain detection.
This investigation therefore bridges two previously siloed fields: livestock pain phenotyping and human micro-expression AI. This research contributes three advances.
- First, it provides the first systematic evaluation of micro-expression dynamics as a pain biomarker in dairy cattle, bringing a fine-timescale analysis into a domain dominated by static scoring;
- Second, it develops a sequential process for visual data collection and processing and species-specific annotations, creating a foundation for transfer learning across breeds and lighting environments;
- Third, it demonstrates a deployable low-latency pipeline aligned with the compute constraints of on-farm edge devices, moving pain detection from sporadic manual checks to continuous surveillance.
By capturing the vanishingly brief facial echoes of nociception, the system aims to trigger earlier interventions, elevate welfare metrics, and improve both ethical resilience and economic efficiency in the dairy sector. The preliminary study conducted on data collected from Canadian dairy farms showed a promising performance, reflecting the potential for full-scale AI-based solutions for automated and non-invasive cattle discomfort detection to enhance animal welfare and farm productivity.
The rest of this paper is organized as follows: Section 2 discusses the methodology used for the experiments on facial keypoint detection and pain recognition; Section 3 shows and analyzes the experimental results; Section 4 explains the implications of these results; and finally, Section 5 concludes this paper with future research directions.
2. The Automated Pain Detection Pipeline
In this paper, we propose an automated pain detection pipeline for dairy cattle, as shown in the summarized framework in Figure 2. We started our work with image and video data collection from several dairy farms across Canada. Each data point was processed, annotated (as ‘pain’ or ‘no pain’), and stored securely with all of the relevant information. The labeled data was then processed to extract consecutive frames, and cows’ faces were detected in bounding boxes from each frame. Once a face had been detected, 30 facial landmarks (i.e., keypoints) were labeled on the face, and temporal modeling was applied to consecutive frames. Then, the pain detection model analyzed these landmarks to classify the data as ‘pain’ or ‘no pain’. The complete process from data collection to pain detection is explained in this section.
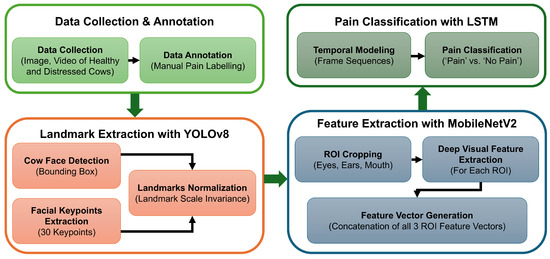
Figure 2.
A workflow diagram for the automated pain detection pipeline.
2.1. Data Collection and Labeling
2.1.1. Dataset Summary
The foundation of this research is a carefully curated, high-quality video dataset collected from over six commercial dairy farms across Atlantic Canada, supplemented by recordings from the Ruminant Animal Centre (RAC) at Dalhousie University, Canada. The primary breed represented is Holstein, with a minority of Jersey cattle included to capture breed-related variability in facial morphology and expression. The dataset encompasses several hundred videos, each capturing the head and facial region of individual cows under naturalistic farm conditions.
The dataset was collected manually with an Apple iPhone 16 sourced in Halifax, NS, Canada to capture high-resolution 4K (3840 × 2160) videos recorded at 30 frames per second (FPS) in 3 color channels (i.e., RGB). The videos were captured at a distance of 2 to 3 feet from the cows and involved the front and both lateral sides of the face to acquire a clear 360 view of the cow’s face. This distance helped us to capture subtle facial indicators of pain (i.e., flared nostrils, a tight muzzle, wrinkled eyelids, etc.) clearly and accurately to ensure the inclusion of the maximum amount of facial expressions. Our data collection process did not involve any sensors or additional equipment other than the iPhone camera.
2.1.2. Dataset Composition and Diversity
The dataset comprises over 8700 high-resolution images and videos representing about 600 individual cows, including both Holstein and Jersey breeds. The images were collected in diverse natural farm environments like barns, pastures, and open yards, reflecting the environmental complexity and physiological variability inherent to commercial dairy operations in Nova Scotia and New Brunswick, Canada. This contextual richness is critical to training models that generalize well across real-world conditions.
2.1.3. Video Acquisition and Processing
All of the videos were recorded with standardized lighting to minimize variability due to illumination changes, and each video contained over 3500 frames. From each video, individual frames were extracted and organized sequentially, preserving the temporal continuity essential for a micro-expression analysis.
2.1.4. Pain Labeling and Categorization
Annotating videos with one of the two simple labels—‘pain’ and ‘no pain’—was required to train and validate the deep learning models for automated classification. Painful states were identified through clinical diagnoses or known painful procedures. Pain labels were assigned based on rigorous veterinary assessments and observations by experienced farm workers. The pain labels for the images and videos were assigned depending on the ongoing health condition of the cow during the data collection process. The farmers and regular veterinarian visits provided the information on the specific cows and the health conditions they suffered from, such as lameness, metritis, treatment for mastitis, and pre-birth labor. The pain durations in the cows differed due to their health issues. For example, if a cow was suffering from lameness, the chances were greater that its pain was momentary and occurred when the cow tried to walk. On the other hand, cows suffering from metritis most likely experienced monotonous pain, as metritis is inflammation of the uterus, and pain originates from the internal organs. Control videos were recorded using healthy cows under similar environmental and lighting conditions to ensure comparability. This binary classification—‘pain’ versus ‘no pain’—forms the basis for supervised learning.
2.1.5. Ethical Considerations
All of the data collection procedures were reviewed and approved by the Dalhousie University Ethics Committee (Protocol 2024-026). The data acquisition was entirely non-invasive, involving passive image and video capture without any physical contact or intervention with the animals. The participating farm owners provided informed written consent after being fully briefed on this study’s objectives and protocols. This adherence to ethical standards ensured that animal welfare was not compromised throughout the data collection and research. The dataset’s scale, diversity, and ethical rigor provide a robust foundation for training and evaluating deep learning models aimed towards subtle pain detection through facial micro-expression analyses in dairy cattle.
2.2. Landmark Extraction and Data Organization
2.2.1. Landmark Extraction
Precise localization of facial landmarks is critical for capturing the subtle muscular movements associated with pain expressions. To achieve this, we developed a customized landmark detection pipeline tailored specifically to bovine facial anatomy. We employed a pose estimation model based on YOLOv8-Pose [45], a state-of-the-art convolutional neural network (CNN) architecture optimized for real-time keypoint detection with high accuracy and efficiency. The model was fine-tuned on a dedicated customized dataset annotated with 30 key facial landmarks per image. These landmarks were strategically selected to cover semantically significant regions implicated in pain expression. The keypoints included the left eye (the extreme right point of the left eye, extreme left point of the left eye, extreme top point of the left eye, and extreme bottom point of the left eye); the right eye (the extreme left point of the right eye, extreme right point of the right eye, extreme top point of the right eye, and extreme bottom point of the right eye); the left ear (the extreme top-right point of the left ear, extreme left point of the left ear, extreme top midpoint of the left ear, extreme bottom midpoint of the left ear, and extreme bottom-right point of the left ear); the right ear (the extreme top-left point of the right ear, extreme left point of the right ear, extreme top midpoint of the right ear, extreme bottom midpoint of the right ear, and extreme bottom-left point of the left ear); the muzzle (top left, top mid, top right, bottom right, bottom mid, and bottom left); the middle of the face (the top center of the face, mid center of the face, and bottom center of the face); and the head (the left side of the head, the extreme top of the head, and the right side of the head) [49]. Figure 3 shows some areas of the face and head; a sample set of keypoints; and a sample image of a cow’s face with keypoints.
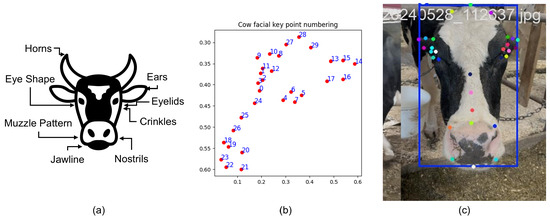
Figure 3.
(a) A few regions of a cow’s face and head. (b) A sample set of 30 keypoints. (c) A sample image of a cow’s face with the keypoints.
Each input video was decomposed into individual frames, which were then processed sequentially by the YOLOv8-Pose model. For each frame, the model outputs included a bounding box delineating the cow’s face and normalized 2D coordinates of the 30 facial landmarks. To ensure detection reliability, frames with confidence scores below 0.5 were discarded. In cases where multiple cows appeared in a frame, only the detection with the highest confidence score was retained to avoid ambiguity in the current framework. Figure 4 shows a sample block diagram for the YOLO model [50].
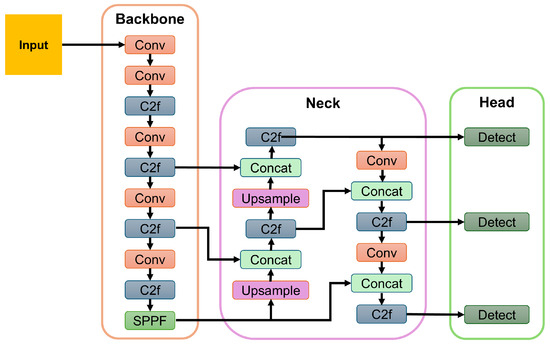
Figure 4.
A sample block diagram of the YOLOv8 model. Here, Conv = Convolutional Layer; C2f = Cross-Stage Partial Fusion; and SPPF = Spatial Pyramid Pooling Fast.
2.2.2. Normalization and Data Organization
To prioritize ROIs and discard other parts of the frames, each frame was cropped according to the bounding box. As both bounding box points and facial landmarks were all coordinates and were identified from the whole frame, their positions were affected by the cropping operation. To maintain scale invariance across videos of varying resolutions, all landmark coordinates were normalized by dividing their pixel values by the frame’s width and height. This normalization facilitated consistent geometric feature extraction regardless of the size of the image or the aspect ratio. All normalized landmarks and corresponding cropped frames were systematically saved in an organized directory structure indexed by source video and frame number. Additionally, a CSV file was generated to associate each video with its binary pain label, enabling efficient batch processing and model training. This automated landmark extraction pipeline enabled a high-resolution, geometrically informative representation of bovine facial features necessary for downstream deep learning models to detect pain-related micro-expressions in unconstrained video footage.
2.3. Feature Extraction and Temporal Modeling
2.3.1. Feature Extraction
Recognizing pain-related micro-expressions requires both spatial details and temporal dynamics to be captured. We designed a two-stage feature extraction and temporal classification pipeline to address this challenge.
- Stage 1: Based on the 30 facial landmarks detected, three anatomically relevant regions were cropped from each frame: the eyes, the ears, and the mouth. These regions are known from ethological studies to exhibit characteristic changes during pain states. The cropping process used the same idea for all 3 ROIs by focusing on the keypoints defined for each of these regions. For each ROI, it considered the two extreme points (minimum and maximum) on the X-axis and added 10 pixels of padding to both sides. After computing the new coordinates for the regions to be cropped based on the padding results, they were extracted and resized to a standardized input dimension of 96 × 96 pixels to maintain uniformity for convolutional processing.
- Stage 2: Each ROI (i.e., cropped region from every 1 of the 3 areas) was passed through a pretrained MobileNetV2 [46] convolutional neural network for deep visual feature extraction, chosen for its lightweight architecture and strong feature extraction capabilities. MobileNetV2 employs depthwise separable convolutions and inverted residual blocks, which reduce the computational complexity while preserving representational power. A sample MobileNetV2 block diagram is shown in Figure 5 [51]. Although MobileNetV2 is a classifier, here, it was used without the classification head for application as a deep visual feature extraction tool. From each of the three ROIs, a 1280-dimensional feature vector was extracted, resulting in a concatenated 3840-dimensional feature vector per frame that encapsulated the detailed local facial information.
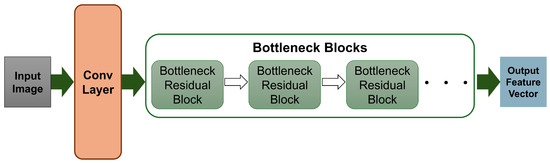 Figure 5. A sample block diagram of MobileNetV2.
2.3.2. Temporal Sequence Construction
To model the temporal evolution of facial expressions, frame-level feature vectors were grouped into fixed-length sequences using a sliding window approach. Each sequence consisted of five consecutive non-overlapping frames, a window size informed by the typical duration of micro-expressions (between 40 and 200 milliseconds). Each sequence inherited the binary pain label from its parent video, yielding a dataset of spatiotemporal samples for model training.
2.3.3. The LSTM Model Architecture
The temporal classification model was implemented using the Keras deep learning framework. It consisted of a single LSTM layer with 128 hidden units, designed to capture temporal dependencies and patterns in the sequential data. The input shape (i.e., shape of one sequence sample) was defined by the number of time steps per sequence (i.e., 5 consecutive frames) and the number of features per time step (i.e., a 3840-dimensional feature vector). To prevent overfitting, a dropout layer was applied after the LSTM layer. The output was then passed through a fully connected dense layer with 64 ReLU-activated units, culminating in a logistic sigmoid activation function to provide the classification probability indicating the presence or absence of pain. Figure 6 shows a block diagram of the LSTM model.
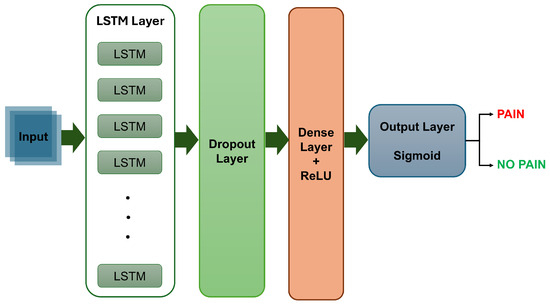
Figure 6.
A sample block diagram of the LSTM model.
2.3.4. Model Training
The LSTM model was trained on ten video recordings: six labeled as ‘pain’ and four as ‘no pain’. The ‘pain’ videos on average contained 3882.5 frames each, while the ‘no pain’ videos had 4804 frames on average, resulting in a mild temporal imbalance that was carefully accounted for in the evaluation metrics. Training was conducted over 30 epochs with a batch size of 32, using the Adam optimizer, binary cross-entropy loss, and a rate of 0.5 dropout. An 80:20 split was used for the training and validation sets. The LSTM’s ability to model temporal dependencies allows the system to detect subtle, transient facial movements indicative of pain that static frame-based classifiers might miss. The combination of MobileNetV2 feature extraction and LSTM temporal modeling balances the computational efficiency with the capacity to capture complex spatiotemporal patterns.
2.4. The Inference Pipeline and Video-Level Classification
The inference pipeline was designed to enable real-time, frame-level pain detection and robust video-level classification. For each incoming video frame, the YOLOv8-Pose model detects the cow’s face and extracts 30 facial landmarks. Using these landmarks, the three predefined ROIs—the eyes, ears, and mouth—are cropped and resized to 96 × 96 pixels. Each ROI is processed through the pretrained MobileNetV2 to extract deep visual feature vectors, which are concatenated into a single descriptor representing the frame. A sliding window buffer stores the five most recent frame descriptors. Once filled, the concatenated sequence is passed to the trained LSTM model, which outputs a probability score indicating the likelihood of pain. A threshold of 0.5 is applied to classifying the sequence as “PAIN” or “NO PAIN”. The predicted label is overlaid onto the video frame, along with a color-coded bounding box around the detected face, providing an intuitive visual indicator.
To produce robust video-level pain classification, the frame-level predictions are aggregated over the entire video duration. The prediction performance is computed by accumulating the performance of all of the frames in a video clip to provide the overall clip-level performance scores. A video is classified as exhibiting pain if more than 30% of its frames are labeled ‘PAIN’, as shown in Equation (1). This threshold was chosen after exploring a few values within a range from 0.2 to 0.5 in the limited data. A value of 0.3 was chosen considering the pain expression ratios in most of the frames, as well as the idea of generalizing the threshold to incorporate the possibility of incorrect pain identification in a few frames due to unclear and/or missing keypoints. This empirically derived threshold balances sensitivity and specificity, reducing false positives while maintaining detection accuracy.
The final predictions, including the pain frame ratio and the raw classification scores, are saved to structured CSV files for a quantitative evaluation. The pipeline supports both offline batch processing and real-time webcam input, facilitating deployment in research settings and commercial farm environments.
3. The Experimental Setup and Results
In this section, we present a comprehensive evaluation of the proposed automated pain detection pipeline with the implementations using Python 3 in Google Colab, encompassing detailed quantitative and qualitative analyses. We systematically examine the performance of each pipeline component, from face and landmark detection to temporal sequence classification and video-level inference, and provide critical insights into the system’s strengths, limitations, and real-world applicability. As part of an ongoing extensive research project on real-time cow pain detection, the purpose of this study is to provide an initial validation of our research concept and to implement and test the validity of the complete pipeline. Hence, this study and implementation focus on a small annotated subset from our data collection and provide limited results. Our full-scale deployment will include the complete annotated dataset with improvements in the parameters and the threshold appropriate for the complete set of data. It will also provide a robust pipeline with complete performance evaluations of the models trained, validated, and tested on the whole dataset before our pilot deployment in dairy farms.
3.1. Performance Metrics
In this experimental setup with the YOLOv8-Pose, MobileNetV2, and LSTM models, the performance metrics that were computed in scores and graphs were the confusion matrix, accuracy, precision, recall, F1-score, and . The graphs were generated by the models using the default legends and notations. The confusion matrix shows four measurements: the true positive (), true negative (), false positive (), and false negative (). These scores indicate
= Accurately predicted positive values;
= Accurately predicted negative values;
= Inaccurately predicted positive values;
= Inaccurately predicted negative values.
The accuracy of a model provides the ratio of correct predictions; precision shows the accuracy of positive predictions; recall represents the ability of the model to identify actual positive values; and F1-score is the harmonic mean of precision and recall. The equations (Equations (2)–(5)) are as follows:
The average precision () shows the area under the precision–recall curve for a class, and the mean average precision () is the mean of the across all of the classes. Equation (6) shows the computation, where C = the total number of classes, = the total number of precision–recall points for class i, and = the precision at the jth recall level for class i.
3.2. Face and Landmark Detection Performance
3.2.1. Model Training and Evaluation
To enable precise localization of the facial regions and extraction of the keypoints from dairy cow videos, the customized YOLOv8-Pose model mentioned earlier was trained on a dataset comprising 1997 manually annotated images of cows’ faces with dimensions of 1080 × 1920. This dataset is an annotated subset of our whole set of collected data. Each annotation included a bounding box for the face and 30 anatomically relevant facial landmarks. The model’s performance was rigorously evaluated using the standard object detection and pose estimation metrics.
3.2.2. Bounding Box Detection
The YOLOv8-Pose model demonstrated exceptional localization capabilities. At a confidence threshold of 0.969, the model achieved a bounding box precision of 1.00, indicating no false positives at this threshold. The recall was 0.96 at a threshold of 0.0, reflecting the model’s ability to detect nearly all true cow faces across the dataset. The F1-score, which balances precision and recall, peaked at 0.95 around a confidence value of 0.505, suggesting a robust performance across varying thresholds. These results are visualized in Figure 7, Figure 8 and Figure 9, which display the precision, recall, and F1-score curves, respectively, as functions of the model’s confidence output.
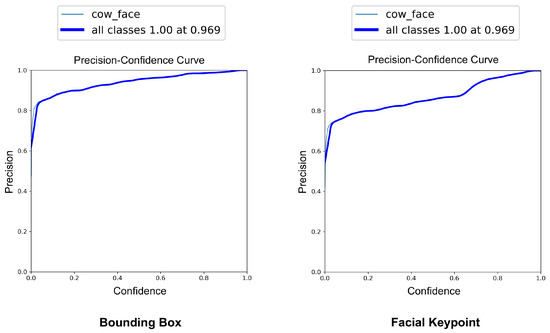
Figure 7.
Precision vs. confidence curves for YOLOv8-based cow face detection and keypoint detection.
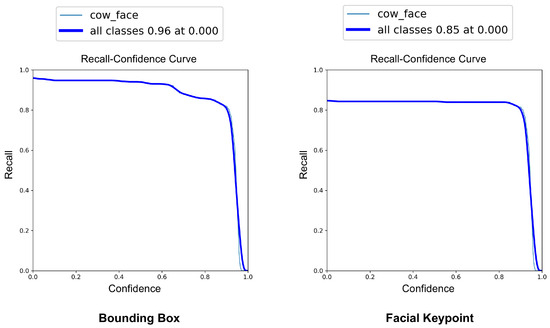
Figure 8.
Recall vs. confidence curves for YOLOv8-based cow face detection and keypoint detection.
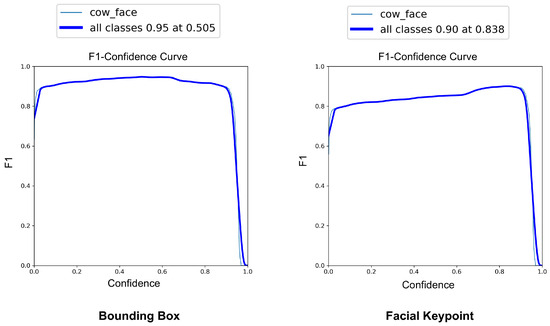
Figure 9.
F1-score vs. confidence curves for YOLOv8-based cow face detection and keypoint detection.
3.2.3. Pose Estimation and Landmark Localization
For pose estimation, the model’s precision and recall both exceeded 0.85 across a wide range of confidence values, with a maximum F1-score of 0.90 at a confidence threshold of 0.838. This indicates reliable and consistent detection of facial landmarks, even under challenging real-world conditions, such as variable lighting, occlusions, and diverse cow postures. The at an IoU = 0.50 reached 0.969 for bounding boxes and 0.838 for keypoint detection. The more stringent @0.50–0.95 scored 0.899 for cow face detection and 0.590 for keypoint detection (Figure 10). These metrics confirm the model’s capability to not only detect cows’ faces with high accuracy but also to precisely localize facial landmarks, critical for downstream pain recognition tasks.
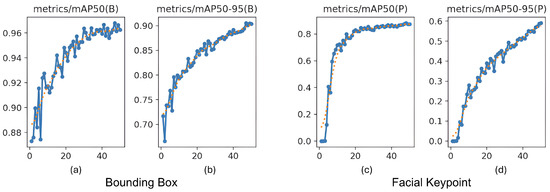
Figure 10.
Mean average precision () progression during training. (a,b) show @0.50 and @0.50–0.95 for bounding boxes for cow face detection, and (c,d) show @0.50 and @0.50–0.95 for keypoint detection, all measured across 50 epochs.
3.2.4. Implications for Downstream Processing
This robust detection and localization performance provided high-quality input for subsequent stages of the pipeline. The YOLOv8-Pose model was deployed as the backbone of the frame-level preprocessing stage, reliably detecting cows’ faces and extracting 30 facial keypoints per frame. These keypoints were then used to define regions of interest (the eyes, ears, and mouth) for feature extraction and temporal sequence modeling, forming the foundation for a micro-expression-based pain analysis.
3.3. LSTM Model Training and Classification Performance
3.3.1. LSTM Convergence and Learning Dynamics
The LSTM model was trained to classify ‘pain’ versus ‘no pain’ sequences based on the extracted facial features. The training and validation accuracy curves (Figure 11a) reveal rapid convergence: the validation accuracy surpassed 98% by epoch 5 and steadily approached 99.5% by epoch 30. The close alignment between the training and validation curves indicates minimal overfitting and suggests that the LSTM model effectively learned to recognize the temporal patterns in pain-related facial behavior while maintaining strong generalization. Although the training and validation performance is promising, we should keep in mind that the model used a limited amount of data, and the frames chosen for training and validation had some similarities, as they were from sequential frames containing a fair amount of similarity.
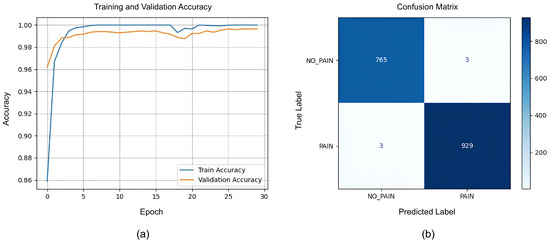
Figure 11.
(a) Training and validation accuracy curves for LSTM model. (b) Confusion matrix for LSTM.
3.3.2. Quantitative Evaluation on Validation Data
The LSTM model’s performance was quantified further using a confusion matrix (Figure 11b), which showed 765 true negatives (TNs) and 929 true positives (TPs), with only 3 false positives (FPs) and 3 false negatives (FNs). Hence, the model achieved 0.9965 accuracy and 0.9968 for all three other metrics: the precision, recall, and F1-score.
These metrics demonstrate that the LSTM model achieved a near-perfect performance on the validation set. The high precision and recall indicate that the model was both highly sensitive to pain sequences and highly specific in avoiding false alarms. The F1-score, harmonizing precision and recall, further confirms balanced and robust classification.
3.3.3. Interpretation and Limitations
It is crucial to note that these metrics were computed on a validation set derived from the same distribution as the training data, using an 80:20 stratified split. While these results confirm the model’s learning capacity and temporal pattern recognition, they do not fully guarantee generalizability to novel, real-world scenarios. Therefore, further evaluations on completely unseen videos were conducted to assess the model’s robustness in practice.
3.4. Qualitative Visualization of the Frame-Level Inference
3.4.1. Frame Analysis for Pain Probability
To elucidate the model’s decision-making process, individual frames from both ‘pain’ and ‘no pain’ videos were visualized and annotated with predicted labels and confidence scores. In a correctly classified ‘pain’ frame (Figure 12a), the model assigned a pain probability of 1.00, with a red bounding box highlighting the detected face. Overlaid landmarks, color-coded by anatomical region, revealed pronounced facial tension and changes around the eyes and muzzle—features consistent with the expression of pain. Conversely, a correctly classified ‘no pain’ frame (Figure 12b) displayed a pain probability of 0.00, with a green bounding box and evenly distributed landmarks indicative of a relaxed facial state. These visualizations underscore the model’s ability to distinguish subtle behavioral cues associated with pain, even in the presence of various types of background noise and other environmental feature variations.
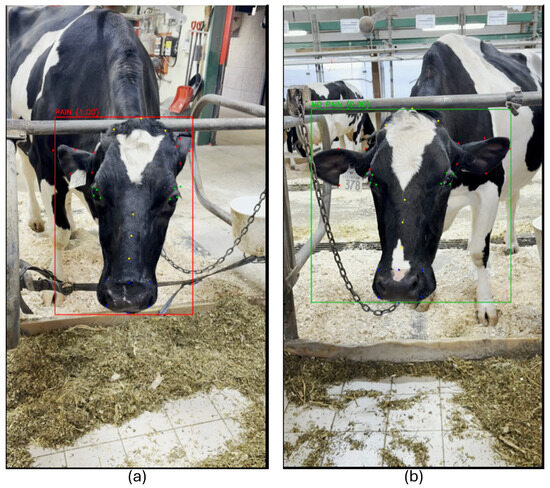
Figure 12.
(a) A correctly predicted ‘pain’ frame with 100% confidence. The red bounding box indicates the model’s classification type (i.e., pain), and facial landmarks guide the extraction of sub-regions for the feature analysis. (b) A correctly predicted ‘no pain’ frame with 0% pain probability. The green bounding box represents the classification type (i.e., no pain), and the consistent keypoint distribution suggests a relaxed facial expression.
3.4.2. Robustness to Environmental Variability
The model’s consistent keypoint localization across diverse frames contributed to the robustness of downstream LSTM-based sequence modeling. Importantly, the system maintained high accuracy despite common farm environment challenges, such as feeding bars, equipment, and fluctuating illumination. This resilience is critical for real-world deployment, where controlled laboratory conditions cannot be assumed.
3.5. Inference Performance on Unseen Videos
To evaluate the generalizability of the trained model beyond the validation set, we conducted inference on a collection of 14 previously unseen videos. These videos were recorded under similar farm conditions but were not used during model training or hyperparameter tuning. The inference pipeline was applied in full, including frame-wise landmark detection, region-based feature extraction, sequential buffering, and classification via the pretrained LSTM model. For each video, the model predicted a binary ‘pain’ or ‘no pain’ label for each sequence of five consecutive frames, and the overall video-level decision was determined by aggregating these predictions. Specifically, a video was classified as ‘pain’ if the proportion of its frame sequences labeled as pain exceeded a fixed threshold of 30% (see Equation (1)).
The detailed inference results are shown in Table 1, which includes per-video statistics such as the total number of analyzed frames, the number of frames predicted as pain, the computed pain ratio, and the final label. Out of the 14 test videos, 9 were annotated as ‘pain’ and 5 as ‘no pain’ based on the expert assessment. The resulting confusion matrix is shown in Figure 13, whereas the detailed classification scores are presented in Table 2. The model correctly predicted 5 out of 9 ‘pain’ videos and 4 out of 5 ‘no pain’ videos, and after aggregating the total correctly predicted ‘pain’ and ‘no pain’ classes (i.e., 9 out of 14), the model provided an overall accuracy of 64.3% at the video level.

Table 1.
Inference results per test video (total frames, pain frames, ratio, final prediction).
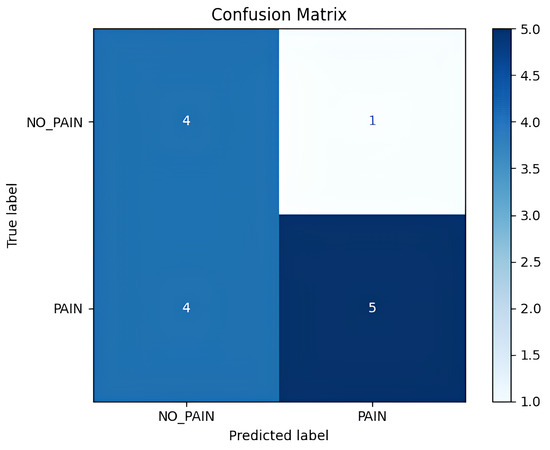
Figure 13.
Confusion matrix showing true vs. predicted video-level labels.
Table 2.
Video-level classification report (precision, recall, and F1-score for both classes; accuracy, macro avg, weighted avg for all classes).
Quantitatively, the inference model achieved a precision of 0.83 for the ‘pain’ class, indicating that when the model predicts ‘pain’, it is often correct. However, the recall was lower at 0.56, suggesting that the model failed to detect a significant fraction of the actual ‘pain’ cases. The F1-score for the ‘pain’ class was 0.67, while the ‘no pain’ class had an F1-score of 0.62. The macro-averaged precision and recall were 0.67 and 0.68, respectively, and the overall weighted F1-score across both classes was 0.65. These values reflect a moderate performance for a continuous ‘pain’/‘no pain’ detection task in a challenging, real-world setting.
A closer look at the misclassified ‘pain’ videos reveals important insights. For instance, pain_421(3) and pain_255(4) were incorrectly classified as ‘no pain’, despite being ground-truth ‘pain’ samples. However, their predicted pain ratios were 24.6% and 23.6%, respectively—hovering just below the decision threshold (i.e., 30%). Pain_255(5), with a pain ratio of only 10.2%, was also misclassified for the same reason. These examples suggest that certain pain expressions were either too brief or too subtle to influence the overall sequence-level predictions sufficiently. The use of a rigid 30% threshold may therefore be too coarse, potentially ignoring pain patterns that are temporally sparse but clinically significant.
To address the challenge of balancing sensitivity and specificity in video-level pain classification, future iterations of the system could move beyond fixed-threshold rules toward more context-aware decision mechanisms. It is also important to consider the impact of domain shifts between the training and test videos. While the environment and camera setup were kept similar, individual differences in the cows’ appearance (i.e., fur color, ear position, facial asymmetry) as well as lighting variation and partial occlusion (i.e., feeding bars) may have affected landmark/keypoint detection and subsequently downstream feature extraction. Such variability can cause slight misalignment in landmark localization and micro-expression analysis, especially for sensitive regions like the eyes and mouth, ultimately affecting the classification accuracy.
Despite these limitations, the model’s ability to correctly classify the majority of the test videos, including several with high confidence, demonstrates the effectiveness of our pipeline under non-ideal conditions. These results also underscore the need for more diverse training data, robust data augmentation, and possibly ensemble decision strategies when deploying the system in production environments.
4. Discussion
4.1. A Summary of Our Observations
Despite using a limited amount of data, the present study demonstrates that automated detection of pain in dairy cattle using facial micro-expression analysis is not only feasible but also highly promising, as evidenced by the strong sequence-level validation accuracy of our LSTM-based system. The primary intention of this small-scale experiment is to use this as a proof-of-concept to support our original hypothesis on transplanting temporal-expression architectures to identify pain in dairy cattle. However, the translation of this high accuracy to a robust, real-world video-level performance remains a significant challenge. The observed drop from nearly perfect sequence-level results to a more moderate 64.3% video-level accuracy on unseen data underscores several fundamental issues that must be addressed for practical deployment and clinical utility.
Our findings suggest that pain in cattle is not merely observable to the trained human eye but is also computationally accessible, even when the animal’s evolutionary instincts drive it to suppress outward signs of discomfort. The ability to detect pain through short sequences of facial micro-expressions—movements lasting only fractions of a second—opens new possibilities for real-time, non-intrusive welfare monitoring. This capability is particularly transformative in large-scale farming environments, where observation of individual animals is often impractical and early intervention can make a profound difference in terms of health outcomes and quality of life.
The implications of this work extend far beyond technical achievement. By providing a scalable, automated means to monitor pain, our system lays the groundwork for individualized welfare baselines, where each cow’s unique pain signature can inform tailored care strategies. In the future, such technology could enable precision interventions, such as the automated administration of analgesics when specific pain patterns are detected or the creation of auditable welfare records that support ethical supply chains and consumer transparency. These advances hold the promise to not only improve animal health and productivity but also address the growing societal demand for humane and responsible livestock management.
However, the deployment of such systems also raises important ethical and practical questions. The potential for false negatives (i.e., instances where pain is present but not detected) reminds us that even the most sophisticated algorithms must be continually refined and validated to minimize suffering. Equally, the challenge of interpretability remains: stakeholders, from farmers to veterinarians, require clear explanations of the system’s decisions, including which facial features or micro-expressions triggered a pain alert. As we move toward greater automation in animal care, it is essential to balance technological innovation with transparency and trust.
Looking ahead, the framework established in this research opens several intriguing avenues. The methods developed here could be adapted to other species and emotional states, potentially enabling the detection of stress, anxiety, or positive welfare indicators in a variety of animals. Integrating a facial micro-expression analysis with other sensing modalities—such as vocalization analysis, thermal imaging, and posture tracking—could provide a more holistic and nuanced understanding of animal well-being. The creation of digital twins or virtual herds, where welfare interventions can be simulated and optimized before real-world application, represents another exciting frontier.
4.2. Current States and Challenges
4.2.1. Temporal Sparsity and Variability in Pain Expression
This is one of the most prominent challenges in cattle pain detection due to minimal overt displays of pain with brief, subtle, and often context-dependent pain expressions [22]. Our findings, such as the misclassification of pain-labeled videos like pain_255(4) that contained only a minority of pain frames, highlight the inadequacy of fixed-threshold aggregation rules. Rigid thresholds—such as labeling a video as ‘pain’ if more than 30% of its frames are classified as pain—fail to accommodate the diversity of the pain expression patterns across individuals and contexts. Similar to the versatility of emotional expression in humans, some cows may exhibit pain as short, intense bursts, while others may display more diffuse or intermittent cues. This diversity is complicated further by environmental influences, such as feeding or resting periods, and by individual differences in pain tolerance and behavioral strategies.
4.2.2. Effects of Domain and Environmental Variations
The limitations of rule-based aggregation are compounded by the impact of domain shifts and environmental variation. Our system’s performance was affected by factors such as individual cows’ appearance and environmental conditions. Even minor misalignments in landmark localization can propagate through the feature extraction and temporal modeling pipeline, ultimately degrading the classification accuracy. These findings emphasize the necessity of more diverse and representative training data, as well as robust data augmentation strategies that simulate real-world variability. The use of advanced augmentation techniques, such as synthetic occlusion, random cropping, and brightness variation, could help the model generalize more effectively to the heterogeneous conditions encountered in commercial dairy environments.
4.3. A Comparison with the Existing Literature
The comparative analysis with the existing literature further contextualizes the strengths and limitations of our approach. Previous studies in automated cattle pain and lameness detection have often relied on gross locomotor changes, utilizing 3D CNNs or ConvLSTM2D architectures to achieve video-level accuracies in the range of 85–90%. However, these approaches are typically limited to overt, late-stage pathologies and require the animal to be walking or moving in a controlled manner. In contrast, our focus on facial micro-expressions enables continuous monitoring and has the potential to detect pain at earlier and less severe stages. Nevertheless, the moderate video-level accuracy observed in our study reflects the inherent difficulty of the task and the impact of environmental and subject variability, which are less pronounced in controlled locomotion-based studies.
The relevance of our approach to the ongoing development of grimace scales in animal welfare research is also noteworthy. Manual grimace scales, such as the CGS, have become widely used for pain assessments across species, including rodents, equines, and bovines. These scales rely on the manual annotation of static facial features, such as orbital tightening, ear position, and nostril dilation. While effective in controlled settings, manual scoring is labor-intensive, subject to observer bias, and limited in its temporal resolution. Automated systems like ours offer the potential for scalable, objective, and continuous pain assessments but must overcome the challenges of subtlety, temporal sparsity, and environmental complexity. Our system’s ability to capture and classify brief, transient pain-related facial movements represents a significant advance, yet the moderate recall on unseen videos suggests that certain pain expressions—especially those that are brief, subtle, or confounded by environmental noise—remain difficult to detect reliably. This observation aligns with recent studies indicating that even trained human observers can struggle to consistently assess facial expressions and ear positions, particularly when micro-expressions are fleeting or ambiguous [52].
4.4. Future Research Directions and the Pilot Deployment Plan
Addressing the limitations of our small-scale implementation and the research gaps in the existing literature requires a shift from rigid, rule-based decision mechanisms to more adaptive, context-aware strategies. Future iterations of our system should move beyond fixed-threshold rules toward decision mechanisms that are informed by intra-video distributional features, such as variance, local burst density, and score skewness. Adaptive thresholds could provide a more nuanced signal than global averages, while the incorporation of high-confidence frame clusters when sufficiently dense, temporally coherent, or strongly predicted could enhance the detection sensitivity. Conversely, burst-to-frame ratio gating or temporal consistency checks could filter out sporadic false positives that may arise in long ‘no pain’ videos. Ultimately, integrating learned metaclassifiers or video-level neural decision heads that consume frame-wise predictions may allow the system to recognize subtle, context-dependent pain patterns that rule-based heuristics cannot capture.
From a methodological perspective, the adoption of advanced temporal modeling architectures, such as attention-based transformers, holds promise for improving the system’s ability to capture sparse and discontinuous pain events. Unlike traditional LSTM models, transformers can assign variable attention weights to different frames, highlighting those that are most informative for pain detection. This capability is particularly relevant for micro-expression analysis, where the most critical signals may be temporally isolated and easily overlooked by models that rely on fixed-length sequences or uniform weighting. In addition, multi-scale feature extraction and ensemble approaches could help capture a broader range of facial expression dynamics, further enhancing the system’s robustness.
Expanding and diversifying the training dataset are another critical priority. Including a wider variety of cow breeds, ages, and pain contexts such as metabolic pain, parturition, and breed-specific facial patterns would help mitigate the risk of overfitting and improve the generalizability. The use of self-supervised pretraining on large volumes of unlabeled video data, as well as generative augmentation techniques to synthesize rare pain expressions, could enhance the model’s capacity to recognize diverse and subtle pain indicators further [53].
Interpretability remains a key concern for the adoption of automated pain detection systems in practice. While our use of keypoint-based micro-expression detection provides some transparency at the frame level, the temporal decision boundaries produced by the LSTM are less interpretable. The development of visual explanation tools, such as Grad-CAM, could help elucidate which facial regions and time intervals are most influential in the model’s decisions. Such tools would not only improve the system’s trustworthiness for veterinarians and animal welfare inspectors but also facilitate the identification of potential failure modes and biases.
The integration of a facial micro-expression analysis with other non-invasive sensing modalities represents a promising direction for future research. Combining facial analysis with posture, gait, and physiological signals could provide a more holistic assessment of pain and welfare in dairy cattle. Multimodal fusion approaches combining sensor data, images, videos, and audios may help disambiguate ambiguous cases; improve the sensitivity and specificity; and enable the detection of pain states that are not readily apparent from facial cues alone.
The clinical and economic implications of automated pain detection are substantial. The early detection of pain can prevent production losses, reduce treatment costs, and improve overall herd health. For example, timely intervention in mastitis cases can reduce antibiotic usage and the associated costs, while early detection of lameness can prevent declines in milk yield and reproductive performance [54]. Ethically, the deployment of such systems aligns with the growing emphasis on animal welfare and precision livestock farming, supporting the goal of individualized, real-time monitoring and proactive care.
As mentioned earlier, this research is a preliminary part of our ongoing research into developing a completely annotated benchmark dataset including facial images and videos of healthy cows and cows in pain. The complete dataset will be used to develop a modified version of the proposed model that will incorporate both images and videos to detect the pain state of a cow in real time and provide alerts to assist farmers and veterinarians with animal welfare assessments and monitoring. The complete system’s results and performance will be tested, compared, and presented with different visualizations for an easier analysis. Our complete dataset will additionally include thermal images of both healthy cows and cows in pain to provide a baseline for our application. Our solution will be available to users through mobile applications that they (i.e., farmers, producers, farming staff, veterinarians, etc.) will be able to use by simply taking images or videos of cows for pain state identification. Our pilot application will be deployed for a performance evaluation and improvements before launching it to everyone. The detections generated by our pilot application will be verified by animal welfare professionals to assess the performance through accurate classifications, false positives, false negatives, and other performance measurements. The model will be adjusted to rectify and test performance issues several times to optimize its accuracy, specificity, and sensitivity by incorporating professional human intervention. The improved model will then be deployed on farms, while the performance will be closely monitored. The proposed model and the improved application are designed to serve as a decision support tool for farmers, producers, and clinicians to alert them early to cows’ discomfort and complement their expertise. Our application is not intended to replace clinicians or other animal welfare professional.
Our study establishes micro-expression analysis as a viable paradigm for automated pain detection in dairy cattle while also highlighting the complexities and challenges inherent in translating this technology to real-world farm environments. Achieving reliable, real-time pain monitoring on a large-scale farm will require ongoing innovation in the data collection, model architecture, interpretability, and multimodal integration. Future systems must embrace biologically informed temporal modeling, continual domain adaptation, and sensor fusion to fully realize the potential of precision welfare ecosystems. By addressing these challenges, automated pain detection systems can transform animal welfare from reactive intervention to proactive, individualized care, fulfilling both scientific and ethical imperatives in modern agriculture.
5. Conclusions
This research marks a significant step forward in the field of animal welfare technology by demonstrating that facial micro-expressions in dairy cattle can serve as reliable, quantifiable indicators of pain. By adapting advanced computer vision and temporal modeling techniques, originally developed for human micro-expression analysis, to the unique morphology and behavioral context of cows, we have shown that pain—a deeply subjective and often concealed experience—can be objectively inferred from subtle, fleeting facial movements. The system we developed, integrating a custom-trained YOLOv8-Pose model for precise facial landmark detection with a MobileNetV2 and LSTM-based temporal classifier, achieved remarkable sequence-level accuracy. This not only validates the technical feasibility of such an approach but also challenges the traditional boundaries of animal pain assessments, which have long relied on coarse behavioral scoring or invasive physiological monitoring.
This research highlights the profound potential of AI to enhance our understanding and stewardship of animals. By giving a voice to the silent signals of pain, we not only advance the science of animal welfare but also reaffirm our ethical commitment to those in our care. From the fleeting tension of a muscle, the brief narrowing of an eye, or the subtle twitch of an ear, these micro-movements, once invisible and unmeasurable, now become the foundation of a new era of compassionate, data-driven animal husbandry. As we refine and expand these technologies, we must do so with humility and imagination, always guided by the principle that to care for animals is to listen deeply, measure wisely, and act with empathy. At the convergence of technology and compassion lies the promise of a future where animal suffering is not only seen but prevented and where our relationship with the creatures who share our world is marked by understanding, respect, and care.
Author Contributions
Conceptualization, S.N.; methodology, S.Z. and K.S.; validation, S.Z., K.S. and S.N; formal analysis, S.Z.; investigation, S.Z; resources, S.N.; writing—original draft preparation, S.Z.; writing—review and editing, S.Z., K.S. and S.N.; visualization, S.Z. and K.S.; supervision, K.S. and S.N.; project administration, S.N.; funding acquisition, S.N. All authors have read and agreed to the published version of the manuscript.
Funding
This work is kindly sponsored by the Natural Sciences and Engineering Research Council of Canada (RGPIN 2024-04450), the Net Zero Atlantic Canada Agency (300700018), Mitacs Canada (IT36514), and the Department of New Brunswick Agriculture, Aquaculture and Fisheries (NB2425-0025).
Data Availability Statement
Data is contained within the article: The original contributions presented in this study are included in the article. Further inquiries can be directed to the corresponding author.
Acknowledgments
The authors thank the Dairy Farmers of New Brunswick, Canada, for the access to over six farms for data collection and for consultation and advice on the on-farm daily operations of dairy farming.
Conflicts of Interest
The authors declare no conflicts of interest.
Correction Statement
This article has been republished with a minor correction to the Data Availability Statement. This change does not affect the scientific content of the article.
References
- Zoltick, A.H.; Mann, S.; Coetzee, J.F. Pain pathophysiology and pharmacology of cattle: How improved understanding can enhance pain prevention, mitigation, and welfare. Front. Pain Res. 2024, 5, 1396992. [Google Scholar] [CrossRef]
- Carbone, L. Do “Prey Species” hide their pain? implications for ethical care and use of laboratory animals. J. Appl. Anim. Ethics Res. 2020, 2, 216–236. [Google Scholar] [CrossRef]
- McLennan, K.M. Why pain is still a welfare issue for farm animals, and how facial expression could be the answer. Agriculture 2018, 8, 127. [Google Scholar] [CrossRef]
- Steagall, P.V.; Bustamante, H.; Johnson, C.B.; Turner, P.V. Pain management in farm animals: Focus on cattle, sheep and pigs. Animals 2021, 11, 1483. [Google Scholar] [CrossRef]
- Jurkovich, V.; Hejel, P.; Kovács, L. A review of the effects of stress on dairy cattle behaviour. Animals 2024, 14, 2038. [Google Scholar] [CrossRef]
- Broomé, S.; Feighelstein, M.; Zamansky, A.; Carreira Lencioni, G.; Haubro Andersen, P.; Pessanha, F.; Mahmoud, M.; Kjellström, H.; Salah, A.A. Going deeper than tracking: A survey of computer-vision based recognition of animal pain and emotions. Int. J. Comput. Vis. 2023, 131, 572–590. [Google Scholar] [CrossRef]
- Ledoux, D.; Veissier, I.; Meunier, B.; Gelin, V.; Richard, C.; Kiefer, H.; Jammes, H.; Foucras, G.; de Boyer Des Roches, A. Combining accelerometers and direct visual observations to detect sickness and pain in cows of different ages submitted to systemic inflammation. Sci. Rep. 2023, 13, 1977. [Google Scholar] [CrossRef] [PubMed]
- Chiavaccini, L.; Gupta, A.; Anclade, N.; Chiavaccini, G.; De Gennaro, C.; Johnson, A.N.; Portela, D.A.; Romano, M.; Vettorato, E.; Luethy, D. Automated acute pain prediction in domestic goats using deep learning-based models on video-recordings. Sci. Rep. 2024, 14, 27104. [Google Scholar] [CrossRef]
- Benedict, S.; Subair, R. Deep learning-driven edge-enabled serverless architectures for animal emotion detection. Informatica 2025, 49, 33–48. [Google Scholar] [CrossRef]
- PK, S.P.; Santhoshraja, S.; Kumar, A.; Dhanush, B.; Muthamilselvan, S. VETCARE+: A deep learning application for early detection of lameness in dairy cattle. In Proceedings of the 2025 International Conference on Advanced Computing Technologies (ICoACT), Sivalasi, India, 14–15 March 2025; IEEE: Piscataway, NJ, USA, 2025; pp. 1–6. [Google Scholar] [CrossRef]
- Ginger, L.; Aubé, L.; Ledoux, D.; Borot, M.; David, C.; Bouchon, M.; Leach, M.; Durand, D.; des Roches, A.D.B. A six-step process to explore facial expressions performances to detect pain in dairy cows with lipopolysaccharide-induced clinical mastitis. Appl. Anim. Behav. Sci. 2023, 264, 105951. [Google Scholar] [CrossRef]
- Chiavaccini, L.; Gupta, A.; Chiavaccini, G. From facial expressions to algorithms: A narrative review of animal pain recognition technologies. Front. Vet. Sci. 2024, 11, 1436795. [Google Scholar] [CrossRef]
- Fischer-Tenhagen, C.; Meier, J.; Pohl, A. “Do not look at me like that”: Is the facial expression score reliable and accurate to evaluate pain in large domestic animals? a systematic review. Front. Vet. Sci. 2022, 9, 1002681. [Google Scholar] [CrossRef]
- Söderlind, M.; Ask, K.; Leclercq, A.; Åkesson, T.; Valarcher, J.F.; Hernlund, E.; Andersen, P.H.; Rhodin, M. Evaluation of a composite pain scale including facial expressions for detecting orthopedic pain in lame dairy cows. J. Dairy Sci. 2025, 108, 5153–5169. [Google Scholar] [CrossRef] [PubMed]
- Tomacheuski, R.M.; de Oliveira, A.R.; Trindade, P.H.E.; Lopez-Soriano, M.; Merenda, V.R.; Luna, S.P.L.; Pairis-Garcia, M.D. Real-time and video-recorded pain assessment in beef cattle: Clinical application and reliability in young, adult bulls undergoing surgical castration. Sci. Rep. 2024, 14, 15257. [Google Scholar] [CrossRef] [PubMed]
- Mota-Rojas, D.; Whittaker, A.L.; Coria-Avila, G.A.; Martínez-Burnes, J.; Mora-Medina, P.; Domínguez-Oliva, A.; Hernández-Avalos, I.; Olmos-Hernández, A.; Verduzco-Mendoza, A.; Casas-Alvarado, A.; et al. How facial expressions reveal acute pain in domestic animals with facial pain scales as a diagnostic tool. Front. Vet. Sci. 2025, 12, 1546719. [Google Scholar] [CrossRef] [PubMed]
- Andersen, P.H.; Broomé, S.; Rashid, M.; Lundblad, J.; Ask, K.; Li, Z.; Hernlund, E.; Rhodin, M.; Kjellström, H. Towards machine recognition of facial expressions of pain in horses. Animals 2021, 11, 1643. [Google Scholar] [CrossRef]
- Zhang, F.; Zhao, X.; Wang, S.; Qiu, Y.; Fu, S.; Zhang, Y. Research on herd sheep facial recognition based on multi-dimensional feature information fusion technology in complex environment. Front. Vet. Sci. 2025, 12, 1404564. [Google Scholar] [CrossRef]
- Henssen, D.J.; Kurt, E.; Kozicz, T.; Van Dongen, R.; Bartels, R.H.; van Cappellen van Walsum, A.M. New insights in trigeminal anatomy: A double orofacial tract for nociceptive input. Front. Neuroanat. 2016, 10, 53. [Google Scholar] [CrossRef]
- Gothard, K.M. The amygdalo-motor pathways and the control of facial expressions. Front. Neurosci. 2014, 8, 43. [Google Scholar] [CrossRef]
- Matsumoto, D.; Willingham, B. Spontaneous facial expressions of emotion of congenitally and noncongenitally blind individuals. J. Personal. Soc. Psychol. 2009, 96, 1–10. [Google Scholar] [CrossRef]
- Gleerup, K.B.; Andersen, P.H.; Munksgaard, L.; Forkman, B. Pain evaluation in dairy cattle. Appl. Anim. Behav. Sci. 2015, 171, 25–32. [Google Scholar] [CrossRef]
- Farghal, M. Pain assessment in cattle during castration using facial expressions as a promising tool. Anim. Behav. Welf. Cases 2024, 2024, abwcases20240008. [Google Scholar] [CrossRef]
- Parra Cerezo, M.; Brusin, V.; Esteves Trindade, P.H.; Hernandez, A.; Jung, J.; Berg, C.; Paranhos da Costa, M.J.R. Limited short-term effects of tactile stimulation on the welfare of newborn nellore calves. Vet. Sci. 2025, 12, 393. [Google Scholar] [CrossRef]
- Müller, B.R.; Soriano, V.S.; Bellio, J.C.B.; Molento, C.F.M. Facial expression of pain in Nellore and crossbred beef cattle. J. Vet. Behav. 2019, 34, 60–65. [Google Scholar] [CrossRef]
- Farghal, M.; Pajor, E.; Luna, S.P.; Pang, D.; Windeyer, M.C.; Ceballos, M.C. Development of the calf grimace scale for pain and stress assessment in castrated Angus beef calves. Sci. Rep. 2024, 14, 25620. [Google Scholar] [CrossRef]
- Tschoner, T.; Mueller, K.R.; Zablotski, Y.; Feist, M. Pain assessment in cattle by use of numerical rating and visual analogue scales—A systematic review and meta-analysis. Animals 2024, 14, 351. [Google Scholar] [CrossRef]
- Lu, Y.; Mahmoud, M.; Robinson, P. Estimating sheep pain level using facial action unit detection. In Proceedings of the 2017 12th IEEE International Conference on Automatic Face & Gesture Recognition (FG 2017), Washington, DC, USA, 30 May–3 June 2017; IEEE: Piscataway, NJ, USA, 2017; pp. 394–399. [Google Scholar] [CrossRef]
- Evangelista, M.C.; Monteiro, B.P.; Steagall, P.V. Measurement properties of grimace scales for pain assessment in nonhuman mammals: A systematic review. Pain 2022, 163, e697–e714. [Google Scholar] [CrossRef]
- McLennan, K.M.; Miller, A.L.; Dalla Costa, E.; Stucke, D.; Corke, M.J.; Broom, D.M.; Leach, M.C. Conceptual and methodological issues relating to pain assessment in mammals: The development and utilisation of pain facial expression scales. Appl. Anim. Behav. Sci. 2019, 217, 1–15. [Google Scholar] [CrossRef]
- Rashid, M. Towards Automatic Visual Recognition of Horse Pain. University of California. Ph.D. Thesis, University of California, Davis, Davis, CA, USA, 2021. [Google Scholar]
- Zhang, L. MicroEmo: Time-sensitive multimodal emotion recognition with micro-expression dynamics in video dialogues. arXiv 2024, arXiv:2407.16552. [Google Scholar] [CrossRef]
- Chen, J.; Zhao, X.; Xiong, Z.; Liu, G. EEG-based micro-expression recognition: Flexible brain network reconfiguration supporting micro-expressions under positive emotion. Psychol. Res. Behav. Manag. 2025, 18, 781–796. [Google Scholar] [CrossRef]
- Dong, Z.; Wang, G.; Lu, S.; Li, J.; Yan, W.; Wang, S.J. Spontaneous facial expressions and micro-expressions coding: From brain to face. Front. Psychol. 2022, 12, 784834. [Google Scholar] [CrossRef] [PubMed]
- Xu, F.; Zhang, J.; Wang, J.Z. Microexpression identification and categorization using a facial dynamics map. IEEE Trans. Affect. Comput. 2017, 8, 254–267. [Google Scholar] [CrossRef]
- Qu, Y.; Hu, H.; Liu, J.; Zhang, Z.; Li, Y.; Ge, X. Driver state monitoring technology for conditionally automated vehicles: Review and future prospects. IEEE Transact. Instrum. Meas. 2023, 72, 3000920. [Google Scholar] [CrossRef]
- Bai, M.; Goecke, R. Investigating LSTM for micro-expression recognition. In Proceedings of the Companion Publication of the 2020 International Conference on Multimodal Interaction, Virtual Event, The Netherlands, 25–29 October 2020; Association for Computing Machinery: New York, NY, USA; 2020; pp. 7–11. [Google Scholar] [CrossRef]
- Yu, Z.; Liu, G.; Liu, Q.; Deng, J. Spatio-temporal convolutional features with nested LSTM for facial expression recognition. Neurocomputing 2018, 317, 50–57. [Google Scholar] [CrossRef]
- Pu, Y.; Zhao, Y.; Ma, H.; Wang, J. A lightweight pig aggressive behavior recognition model by effective integration of spatio-temporal features. Animals 2025, 15, 1159. [Google Scholar] [CrossRef]
- Pennington, Z.T.; Dong, Z.; Feng, Y.; Vetere, L.M.; Page-Harley, L.; Shuman, T.; Cai, D.J. ezTrack: An open-source video analysis pipeline for the investigation of animal behavior. Sci. Rep. 2019, 9, 19979. [Google Scholar] [CrossRef]
- Cain, B. Facial Expressions in Cattle in Different Affective States; SLU, Institutionen för Husdjurens Biovetenskaper, Sweden: Uppsala, Sweden, 2024. [Google Scholar]
- Shibanoki, T.; Yamazaki, Y.; Tonooka, H. A system for monitoring animals based on behavioral information and internal state information. Animals 2024, 14, 281. [Google Scholar] [CrossRef] [PubMed]
- Parivendan, S.C.; Sailunaz, K.; Neethirajan, S. Socializing AI: Integrating social network analysis and deep learning for precision dairy cow monitoring—A critical review. Animals 2025, 15, 1835. [Google Scholar] [CrossRef]
- Mahato, S.; Neethirajan, S. Integrating artificial intelligence in dairy farm management- biometric facial recognition for cows. Inf. Process. Agric. 2024, in press. [Google Scholar] [CrossRef]
- Explore Ultralytics YOLOv8. Available online: https://docs.ultralytics.com/models/yolov8/ (accessed on 9 July 2025).
- Sandler, M.; Howard, A.; Zhu, M.; Zhmoginov, A.; Chen, L.C. MobileNetV2: Inverted residuals and linear bottlenecks. arXiv 2018, arXiv:1801.04381. [Google Scholar] [CrossRef]
- Hochreiter, S.; Schmidhuber, J. Long short-term memory. Neural Comput. 1997, 9, 1735–1780. [Google Scholar] [CrossRef]
- Guo, Q.; Pei, D.; Sun, Y.; Langenhuizen, P.P.; Orsini, C.A.; Martinsen, K.H.; Nordbø, Ø.; Bolhuis, J.E.; Bijma, P. Multi-object keypoint detection and pose estimation for pigs. In Proceedings of the 20th International Joint Conference on Computer Vision, Imaging and Computer Graphics Theory and Applications, Porto, Portugal, 26–28 February 2025; Volume 3, pp. 466–474. [Google Scholar] [CrossRef]
- Mahato, S.; Bi, H.; Neethirajan, S. Dairy digiD ~ a deep learning-based, non-invasive biometric identification system for dairy cattle using Detectron2. bioRxiv 2025. [Google Scholar] [CrossRef]
- Liu, Y.; Fu, Z.; Song, L.; Sui, H.; Li, B. Improved YOLOv8-pose algorithm for albacore tuna (Thunnus alalunga) fork length extraction and weight estimation. J. Mar. Sci. Eng. 2024, 12, 784. [Google Scholar] [CrossRef]
- Hussain, D.; Ismail, M.; Hussain, I.; Alroobaea, R.; Hussain, S.; Ullah, S.S. Face mask detection using deep convolutional neural network and MobileNetV2-based transfer learning. Wirel. Commun. Mob. Comput. 2022, 2022, 1536318. [Google Scholar] [CrossRef]
- Porter, S.; Ten Brinke, L. Reading between the lies: Identifying concealed and falsified emotions in universal facial expressions. Psychol. Sci. 2008, 19, 508–514. [Google Scholar] [CrossRef] [PubMed]
- Caron, A.; Angel Barasona, J.; Miguel, E.; Michaux, J.; De Garine-Wichatitsky, M. Characterisation of wildlife-livestock interfaces: The need for interdisciplinary approaches and a dedicated thematic field. In Diseases at the Wildlife—Livestock Interface; Springer International Publishing: Cham, Switzerland, 2021; pp. 339–367. [Google Scholar] [CrossRef]
- Rollin, E.; Dhuyvetter, K.C.; Overton, M.W. The cost of clinical mastitis in the first 30 days of lactation: An economic modeling tool. Prev. Vet. Med. 2015, 122, 257–264. [Google Scholar] [CrossRef]


Disclaimer/Publisher’s Note: The statements, opinions and data contained in all publications are solely those of the individual author(s) and contributor(s) and not of MDPI and/or the editor(s). MDPI and/or the editor(s) disclaim responsibility for any injury to people or property resulting from any ideas, methods, instructions or products referred to in the content. |
© 2025 by the authors. Licensee MDPI, Basel, Switzerland. This article is an open access article distributed under the terms and conditions of the Creative Commons Attribution (CC BY) license (https://creativecommons.org/licenses/by/4.0/).