Optical Properties of Alkali Halides in Ultraviolet Spectral Regions

Abstract
1. Introduction
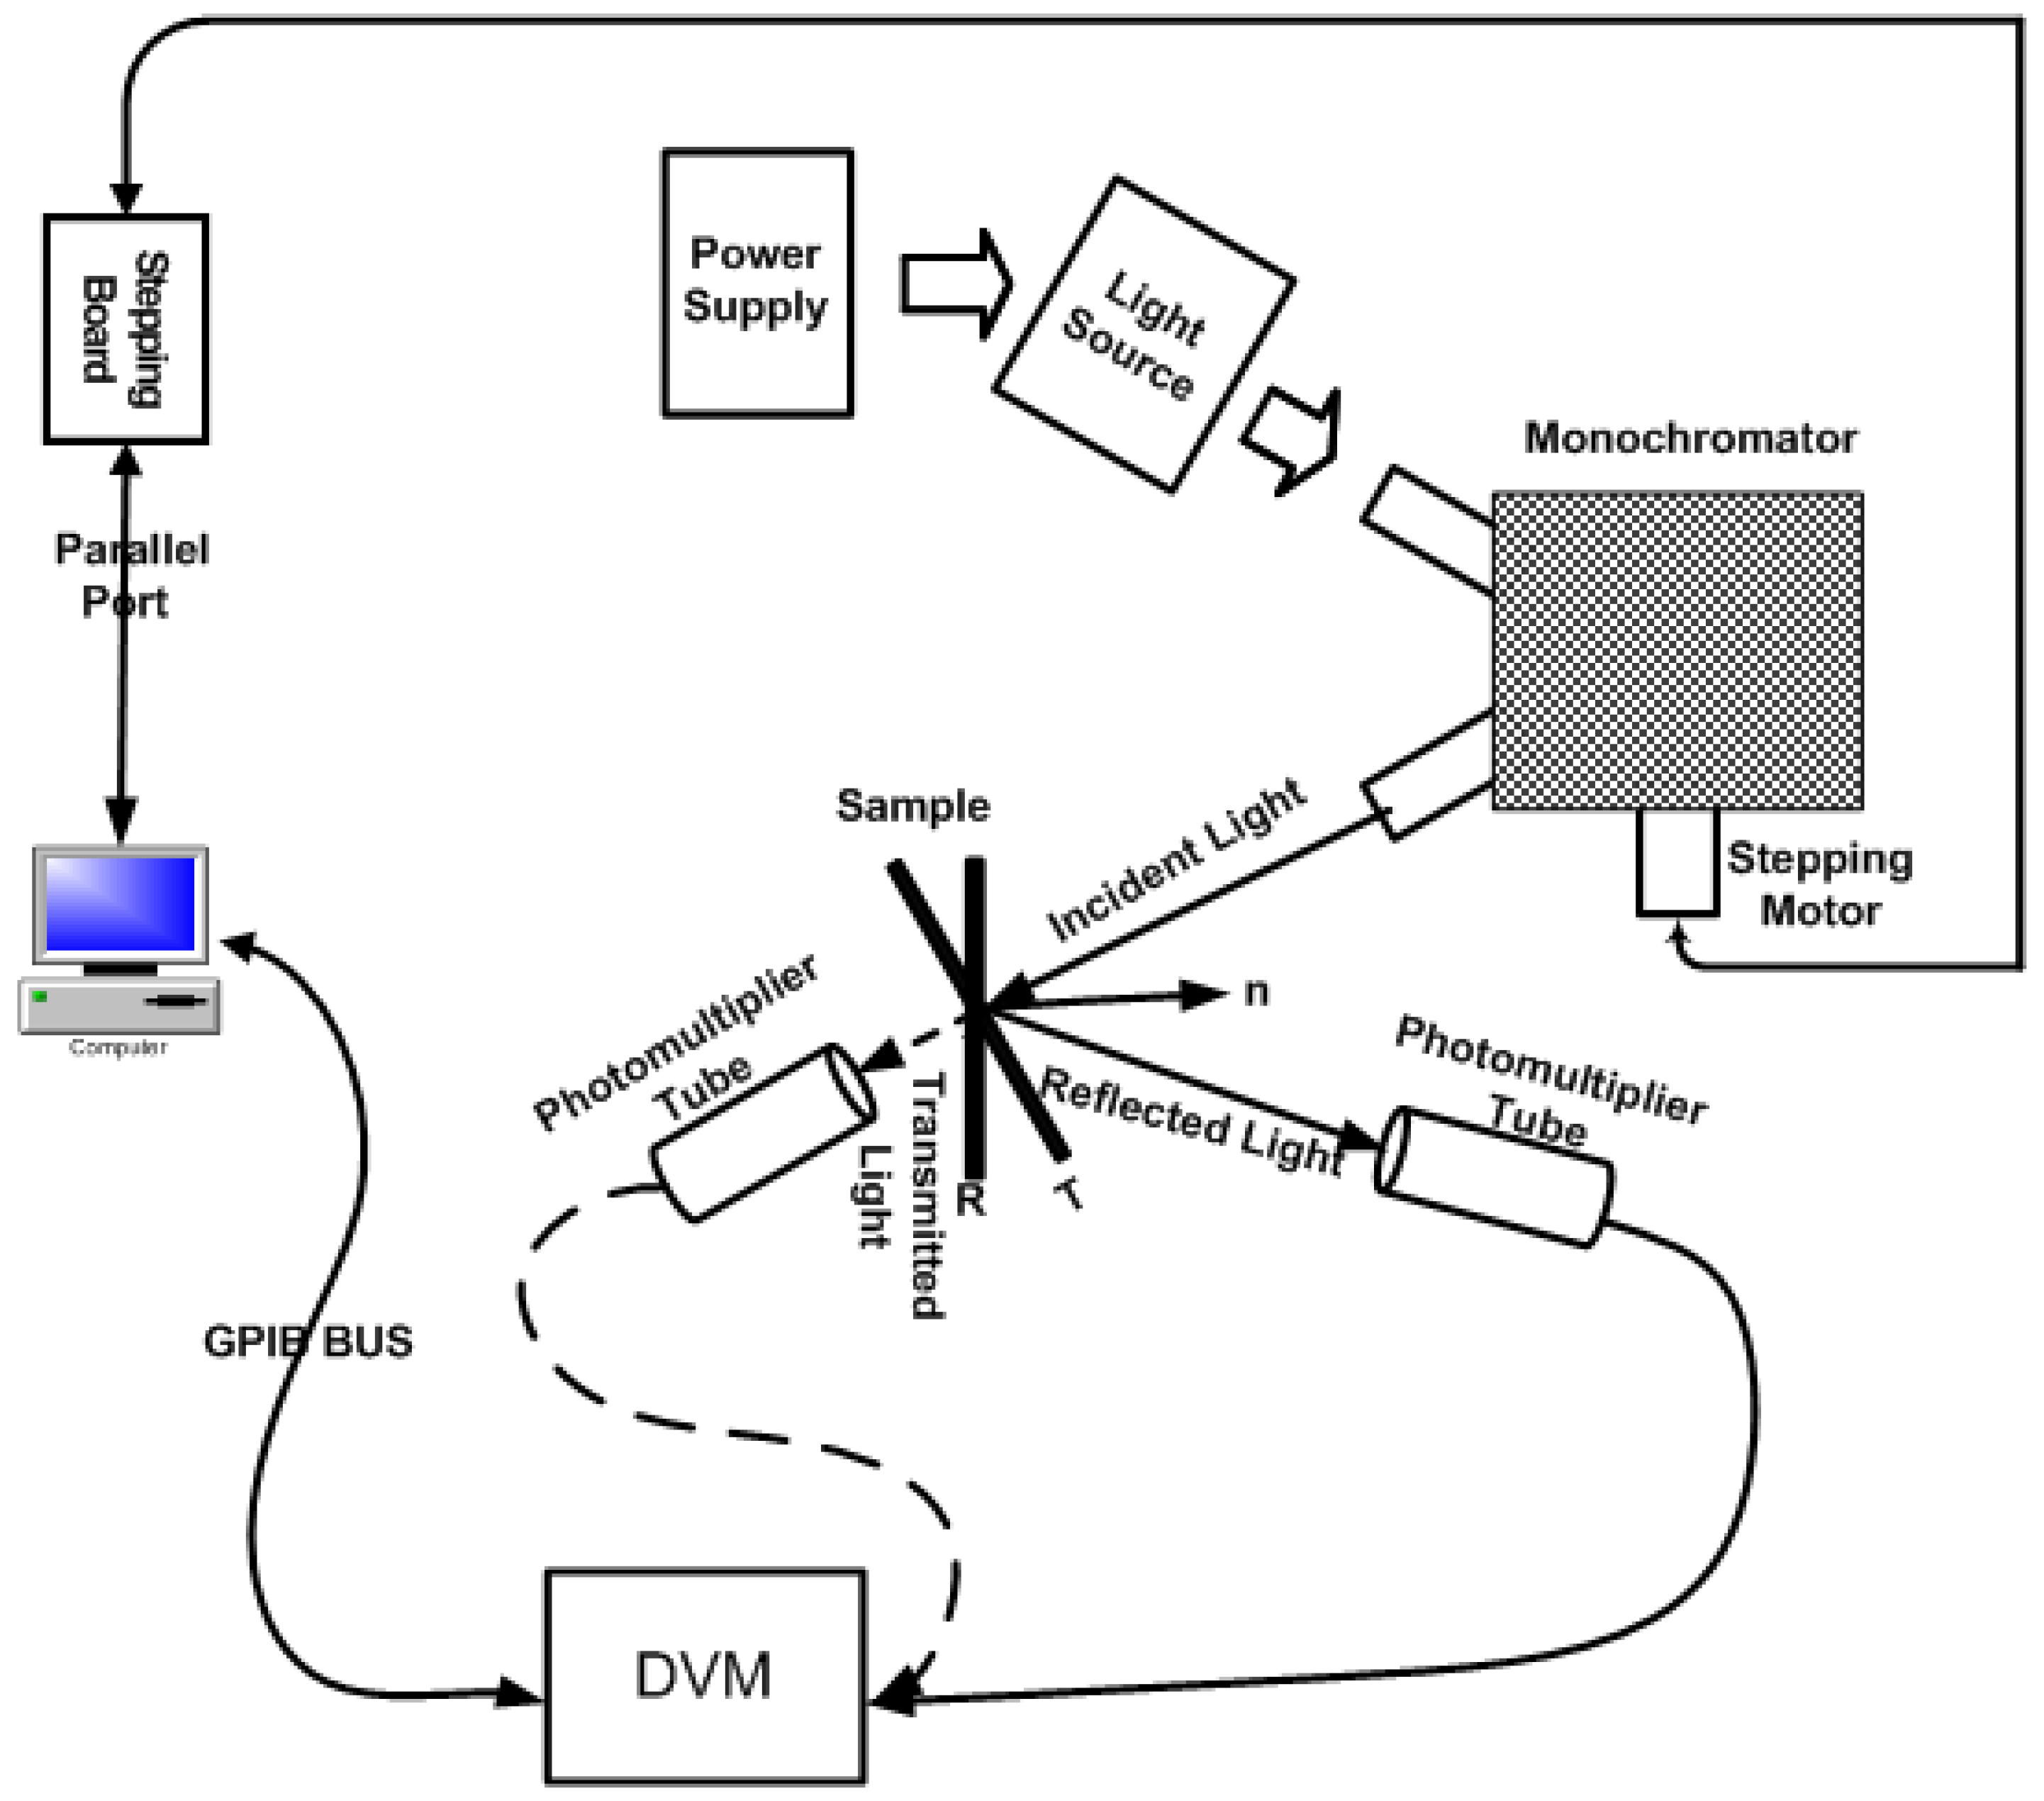
2. Apparatus
3. Experimental Methods
4. Theory
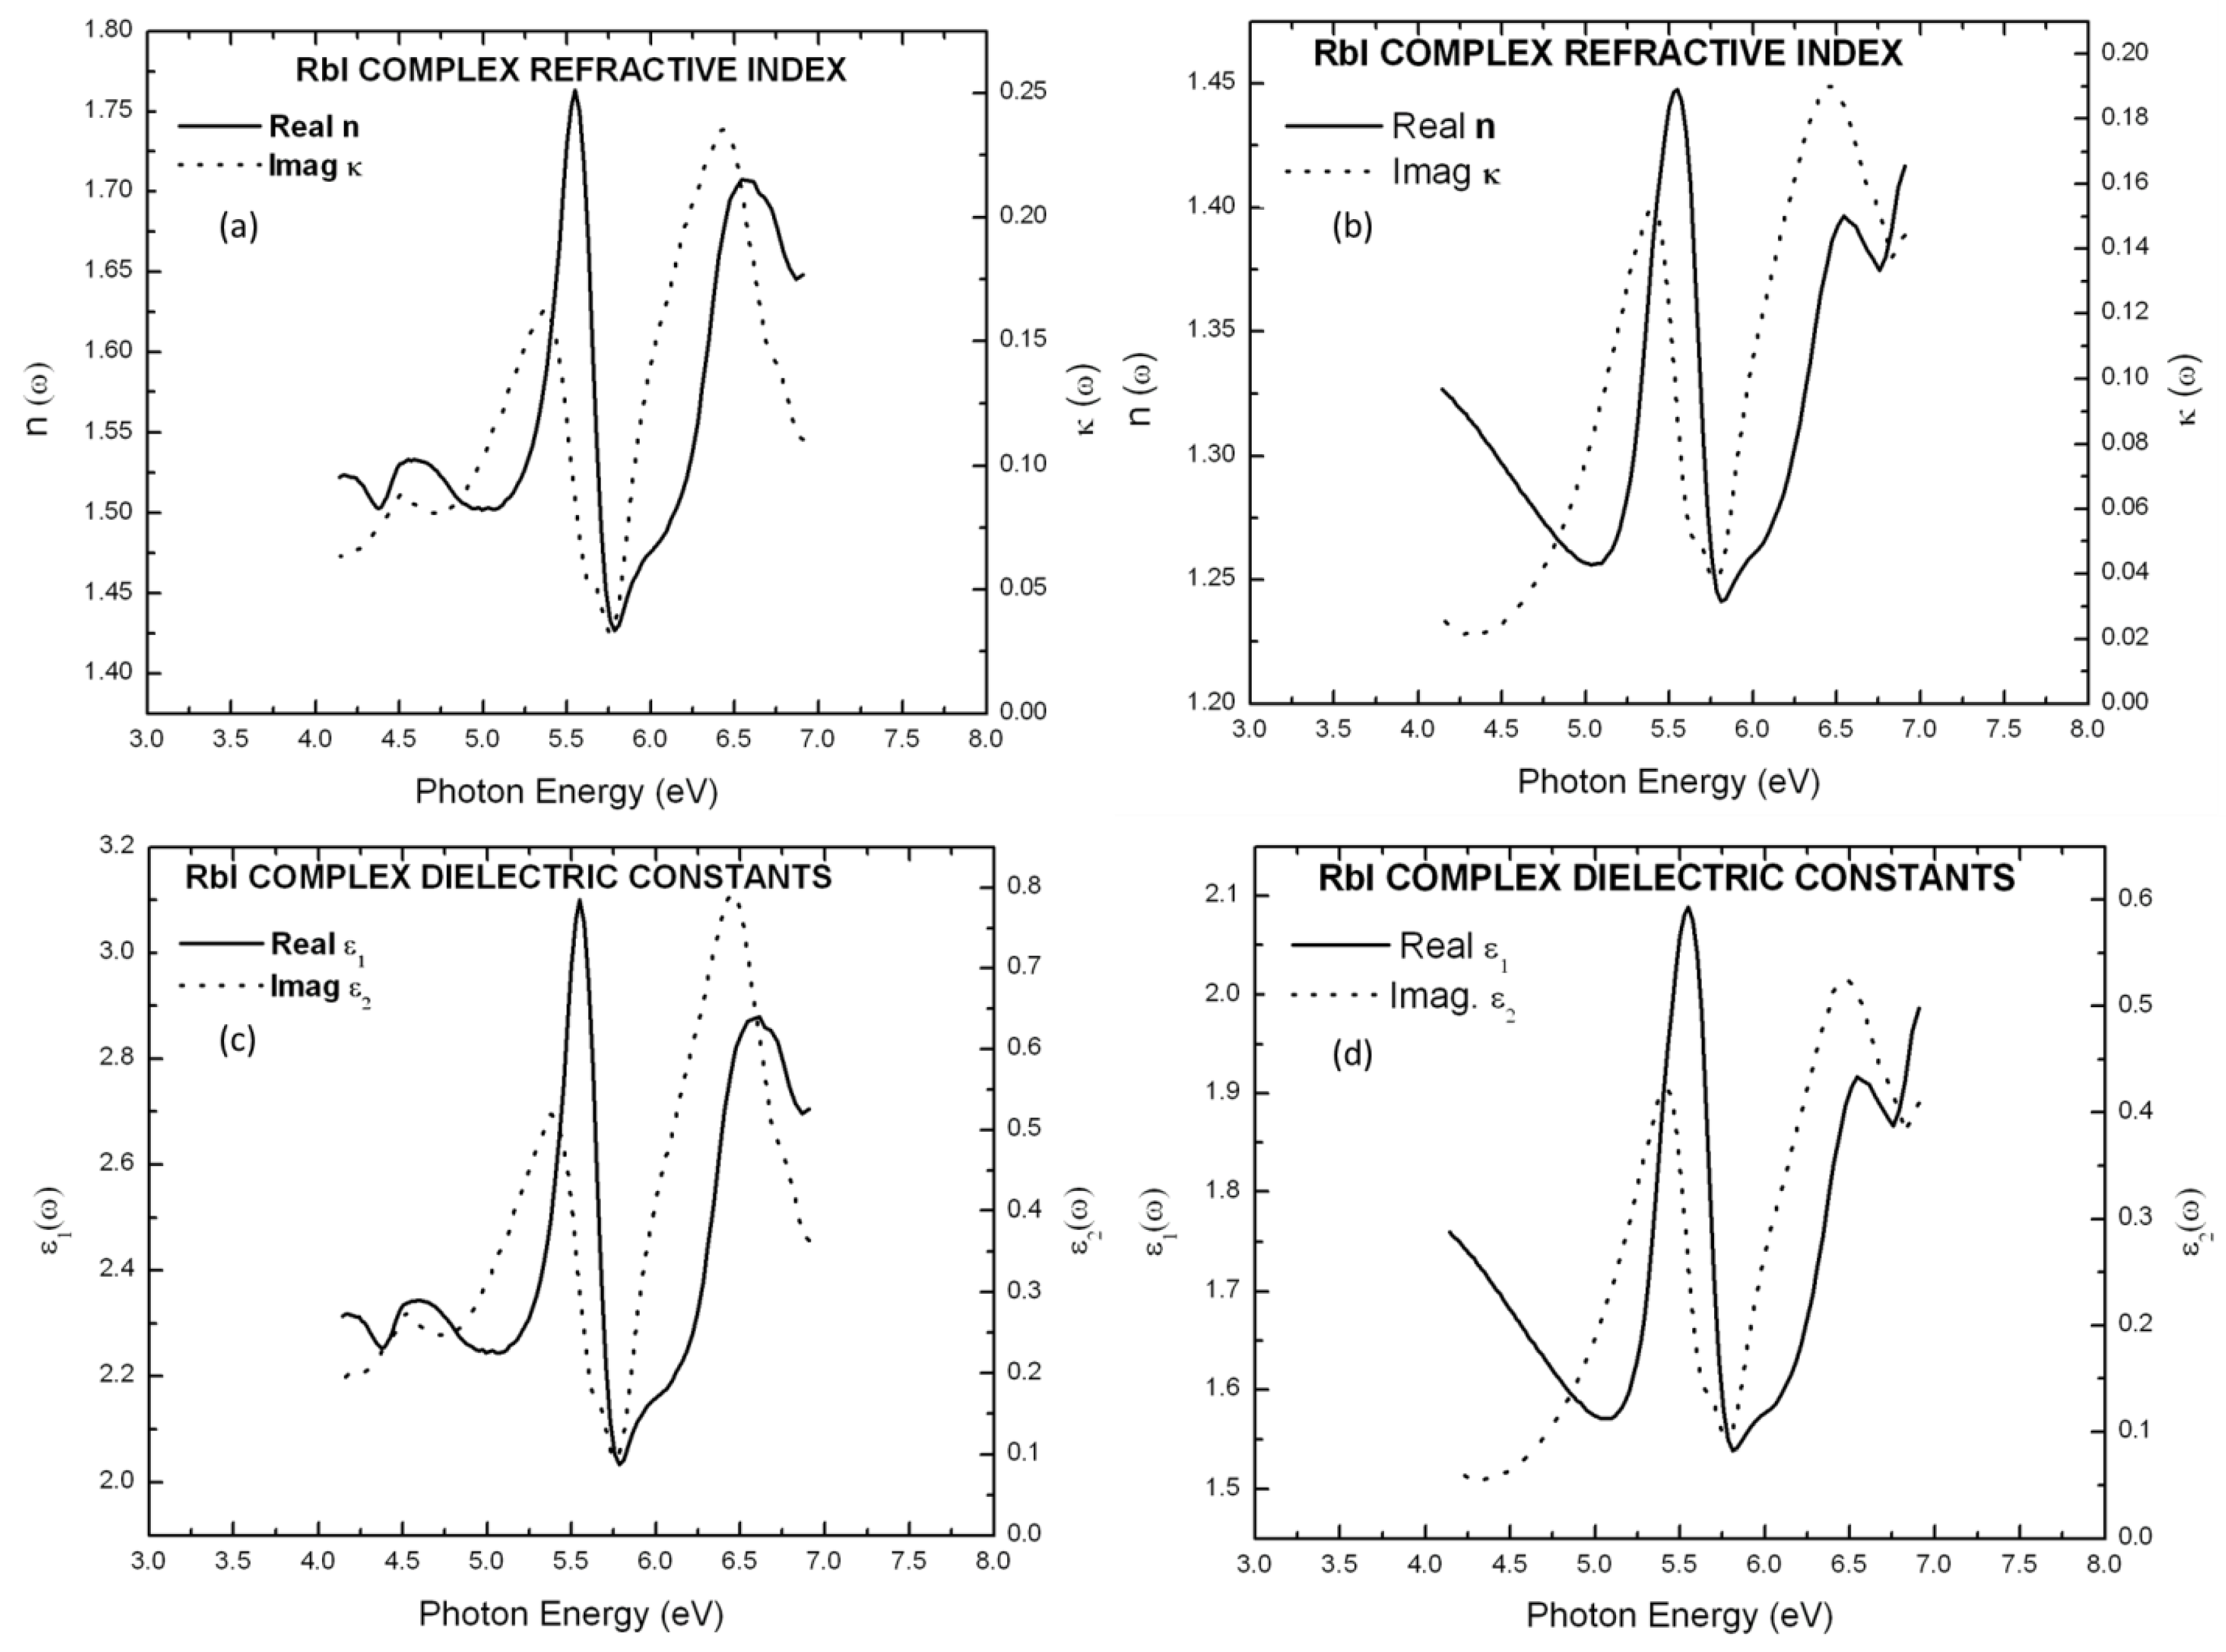
5. Results and Discussion
6. Conclusions
Funding
Acknowledgments
Conflicts of Interest
References
- Louis, C.N.; Iyakutti, K. Electronic band structure and metallization of KI and RbI under high pressure. Phys. Status Solidi 2002, 233, 339–350. [Google Scholar] [CrossRef]
- Howland, L. Band structure and cohesive energy of potassium chloride. Phys. Rev. 1958, 109, 1927. [Google Scholar] [CrossRef]
- Onodera, Y.; Okazaki, M.; Inui, T. Relativistic electronic structure of KI crystal. J. Phys. Soc. Jpn. 1966, 21, 2229–2238. [Google Scholar] [CrossRef]
- Oyama, S.; Miyakawa, T. Conduction band structure of KCl. J. Phys. Soc. Jpn. 1966, 21, 868–874. [Google Scholar] [CrossRef]
- Phillips, J. Ultraviolet absorption of insulators. III. fcc alkali halides. Phys. Rev. 1964, 136, A1705. [Google Scholar] [CrossRef]
- Amirthakumari, R.M.; Pari, G.; Rita, R.; Asokamani, R. Phase transformation and metallisation studies of some of the alkali iodides through high pressure electronic structure calculations. Phys. Status Solidi 1997, 199, 157–164. [Google Scholar] [CrossRef]
- Ching, W.; Gan, F.; Huang, M.Z. Band theory of linear and nonlinear susceptibilities of some binary ionic insulators. Phys. Rev. B 1995, 52, 1596. [Google Scholar] [CrossRef]
- Ketterson, J.B. The Physics of Solids. MRS Bull. 2018, 43, 68–69. [Google Scholar]
- Dayal, B. The specific heats of the alkali halides. Proc. Indian Acad. Sci.Sect. A 1944, 20, 77–86. [Google Scholar] [CrossRef]
- Dayal, B. Theory of the thermal expansion of the alkali halides. Proc. Indian Acad. Sci.Sect. A 1944, 20, 145–154. [Google Scholar] [CrossRef]
- White, G. The thermal expansion of alkali halides at low temperatures. Proc. R. Soc. Lond. A 1965, 286, 204–217. [Google Scholar]
- Doll, K.; Stoll, H. Cohesive properties of alkali halides. Phys. Rev. B 1997, 56, 10121. [Google Scholar] [CrossRef]
- Slater, J.C. Compressibility of the Alkali Halides. Phys. Rev. 1924, 23, 488–500. [Google Scholar] [CrossRef]
- Basu, A.N.; Sengupta, S. Lattice Dynamics of Alkali Halides. Phys. Rev. B 1973, 8, 2982. [Google Scholar] [CrossRef]
- Woods, A.; Cochran, W.; Brockhouse, B. Lattice dynamics of alkali halide crystals. Phys. Rev. 1960, 119, 980. [Google Scholar] [CrossRef]
- Verma, M.; Dayal, B. Fuchs’s Relations in Alkali Halides and Their Application to the Lattice Dynamics of Lithium Fluoride. Phys. Status Solidi 1966, 13, 251–256. [Google Scholar] [CrossRef]
- Singh, R.; Verma, M. Effect of Three-Body Forces on the Shell Model of Alkali Halides: Application to KBr and KI. Phys. Status Solidi 1969, 36, 335–343. [Google Scholar] [CrossRef]
- Jesser, W.A.; Matthews, J.W. Growth of copper, silver, and gold on twelve Alkali halides cleaved in vacuum. J. Cryst. Growth 1969, 5, 83–89. [Google Scholar] [CrossRef]
- Lord, D.G.; Prutton, M. Electrons and the epitaxial growth of metals on alkali halides. Thin Solid Films 1974, 21, 341–356. [Google Scholar] [CrossRef]
- Mobus, M.; Karl, N.; Kobayashi, T. Structure of perylene-tetracarboxylic-dianhydride thin films on alkali halide crystal substrates. J. Cryst. Growth 1992, 116, 495–504. [Google Scholar] [CrossRef]
- Gupta, S.C. Optoelectronic Devices and Systems; PHI Learning Pvt. Ltd.: Delhi, India, 2014. [Google Scholar]
- Hilsch, R.; Pohl, R.W. Einige Dispersionsfrequenzen der Alkalihalogenidkristalle im Schumanngebiet. Z. Phys. 1930, 59, 812–819. [Google Scholar] [CrossRef]
- Baldini, G.; Bosacchi, B. Optical properties of alkali-halide crystals. Phys. Rev. 1968, 166, 863. [Google Scholar] [CrossRef]
- Baldini, G.; Bosacchi, A.; Bosacchi, B. Exciton-phonon interaction in alkali halides. Phys. Rev. Lett. 1969, 23, 846. [Google Scholar] [CrossRef]
- Said, K.I.; Green, G.W. Optical properties of caesium iodide in the vacuum ultraviolet. J. Phys. C 1977, 10, 479–488. [Google Scholar] [CrossRef]
- Philipp, H.R.; Ehrenreich, H. Intrinsic Optical Properties of Alkali Halides. Phys. Rev. 1963, 131, 2016. [Google Scholar] [CrossRef]
- Blechschmidt, D.; Klucker, R.; Skibowski, M. Dielectric properties of KCl, KBr, and KI single crystals in the extreme ultraviolet up to 35 eV. Phys. Status Solidi 1969, 36, 625–634. [Google Scholar] [CrossRef]
- Tomiki, T.; Miyata, T.; Tsukamoto, H. Temperature Dependence of the Fundamental Spectra of Potassium-Halides in the Schumann Ultraviolet Region (4.4~13.5 eV). J. Phys. Soc. Jpn. 1973, 35, 495–507. [Google Scholar]
- Tomiki, T.; Miyata, T.; Tsukamoto, H. The Urbach rule for the sodium-and potassium-halides. Z. Naturforsch. A 1974, 29, 145–157. [Google Scholar] [CrossRef]
- Antinori, M.; Balzarotti, A.; Piacentini, M. High-resolution reflection spectra of alkali halides in the far ultraviolet. Phys. Rev.B 1973, 7, 1541. [Google Scholar] [CrossRef]
- Tomiki, T. Optical constants and Excton States in KCl Single Crystals. II. The Spectra of Reflectivity and Absorption Constant. J. Phys. Soc. Jpn. 1967, 23, 1280–1296. [Google Scholar] [CrossRef]
- Eby, J.E.; Teegarden, K.J.; Dutton, D.B. Ultraviolet Absorption of Alkali Halides. Phys. Rev. 1959, 116, 1099–1105. [Google Scholar] [CrossRef]
- Teegarden, K.; Baldini, G. Optical Absorption Spectra of the Alkali Halides at 10 K. Phys. Rev. 1967, 155, 896–907. [Google Scholar] [CrossRef]
- Saito, H.; Saito, S.; Onaka, R.; Ikeo, B. Extreme ultraviolet absorption of alkali halides. J. Phys. Soc. Jpn. 1968, 24, 1095–1098. [Google Scholar] [CrossRef]
- O’Connel-Bronin, A. Influence of cleavage in liquid helium on the shape of the n = 1 exciton reflection band in KI and RbI crystals. J. Phys. 1994, 6, 2847. [Google Scholar] [CrossRef]
- Kondo, S.I.; Nakamura, K. Strain Effects on the Fundamental Absorption in Alkali Iodides. J. Phys. Soc. Jpn. 1970, 28, 1381. [Google Scholar] [CrossRef]
- Takahashi, S.; Kobayashi, M.; Misu, A. Piezoreflectivity Studies on Excitons and Band to Band Transitions in Alkali Bromides and Iodides under Uniaxial Stress. J. Phys. Soc. Jpn. 1990, 59, 4547–4553. [Google Scholar] [CrossRef]
- Hashimoto, S.; Itoh, M. Excitonic structures of very thin RbI crystals. J. Phys. Soc. Jpn. 1986, 55, 739–741. [Google Scholar] [CrossRef]
- Cardona, M.; Lynch, D. Optical Properties of the Rubidium and Cesium Halides in the Extreme Ultraviolet. Phys. Rev. B 1970, 2, 1117. [Google Scholar] [CrossRef]
- Hashimoto, S.; Tomi-ie, N.; Itoh, M. Interference effect and dispersion in thin RbI crystals. Solid State Commun. 1985, 54, 1081–1084. [Google Scholar] [CrossRef]
- Peimann, C.J.; Skibowski, M. Dielectric Properties of the Rubidium Halide Crystals in the Extreme Ultraviolet up to 30 eV. Phys. Status Solidi 1971, 46, 655–665. [Google Scholar] [CrossRef]
- Roessler, D.M.; Walker, W.C. Exciton structure in the ultraviolet spectra of KI and RbI. J. Opt. Soc. Am. 1967, 57, 677–682. [Google Scholar] [CrossRef]
- Hutchings, D.C.; Sheik-Bahae, M.; Hagan, D.J.; van Stryland, E.W. Kramers-Krönig relations in nonlinear optics. Opt. Quantum Electron. 1992, 24, 1–30. [Google Scholar] [CrossRef]
- Kronig, R.D.L. On the theory of dispersion of X-rays. Josa 1926, 12, 547–557. [Google Scholar] [CrossRef]
- Lucarini, V.; Saarinen, J.J.; Peiponen, K.E.; Vartiainen, E.M. Kramers-Kronig Relations in Optical Materials Research; Springer Science & Business Media: Berlin, Germany, 2005; Volume 110. [Google Scholar]
- Aspnes, D.; Kelso, S.; Logan, R.; Bhat, R. Optical properties of Al x Ga1-x As. J. Appl. Phys. 1986, 60, 754–767. [Google Scholar] [CrossRef]
- Weast, R.C.; Astle, M.J.; Beyer, W.H. CRC Handbook of Chemistry And Physics; CRC press: Boca Raton, FL, USA, 1988; Volume 69. [Google Scholar]
- Michael, B. Properties of crystals and glasses. In Handbook of Optics: Volume IV—Optical Properties of Materials, Nonlinear Optics, Quantum Optics, 3rd ed.; The McGraw Hill Companies, Inc.: New York, NY, USA, 2010. [Google Scholar]
- Pankove, J.I. Optical Processes in Semiconductors; Dover Publicatins Inc.: New York, NY, USA, 1975. [Google Scholar]
- Portis, A.M. Electromagentic Fields: Souces and Media, 1st ed.; John Eiley & Sons Inc.: New York, NY, USA, 1978. [Google Scholar]
- Stern, F. Elementary theory of the optical properties of solids. Solid State Phys. 1963, 15, 299–408. [Google Scholar]
- Taft, E.; Philipp, H. Photoelectric emission from the valence band of some alkali halides. J. Phys. Chem. Solids 1957, 3, 1–6. [Google Scholar] [CrossRef]
- Arms, D.A.; Graber, T.J.; Macrander, A.T.; Simmons, R.O.; Schwoerer-Böhning, M.; Zhong, Y. Excitons in bulk liquid He 4. Phys. Rev. B 2005, 71, 233107. [Google Scholar] [CrossRef]
- Beaglehole, D. Reflection Studies of Excitons in Liquid and Solid Xenon. Phys. Rev. Lett. 1965, 15, 551–553. [Google Scholar] [CrossRef]
- Rowe, E.; Otte, R.; Pruett, C.; Steben, J. Operation and Performance of the University of Wisconsin-Physical Sciences Laboratory Electron Storage Ring. IEEE Trans. Nucl. Sci. 1969, 16, 159–164. [Google Scholar] [CrossRef]
- Rubloff, G.; Fritzsche, H.; Gerhardt, U.; Freeouf, J. Far ultraviolet spectroscopy of solids in the range 6–36 eV using synchrotron radiation from an electron storage ring. Rev. Sci. Instrum. 1971, 42, 1507–1513. [Google Scholar] [CrossRef]
- DeCicco, P.D. Self-Consistent Energy Bands and Cohesive Energy of Potassium Chloride. Phys. Rev. 1967, 153, 931–938. [Google Scholar] [CrossRef]
- Kunz, A. Electronic Energy Bands for Rubidium Chloride and the Face-Centered Cubic Alkali Bromides. Phys. Status Solidi 1968, 29, 115–120. [Google Scholar] [CrossRef]
- Bachrach, R.Z. The Optical Absorption of Lithium Iodide. Phys. Lett. A 1969, 30, 318–319. [Google Scholar] [CrossRef]


| Materials | Maximum | Minimum |
|---|---|---|
| KI | 2.04 (5.63 eV) | 1.55 (5.86 eV) |
| RbI | 1.76 (5.63 eV) | 1.43 (5.78 eV) |
| Materials | Maximum | Minimum |
|---|---|---|
| KI | 1.93 (5.65 eV) | 1.49 (5.86 eV) |
| RbI | 1.45 (5.55 eV) | 1.24 (5.81 eV) |
| Materials | Maximum | Minimum |
|---|---|---|
| KI | 4.14 (5.63 eV) | 2.40 (5.86 eV) |
| RbI | 3.10 (5.55 eV) | 2.03 (5.78 eV) |
| Materials | Maximum | Minimum |
|---|---|---|
| KI | 3.71 (5.65 eV) | 2.21 (5.86 eV) |
| RbI | 2.09 (5.55 eV) | 1.54 (5.81 eV) |
| Materials | First Peak | Second Peak | Difference |
|---|---|---|---|
| KI | 5.80 eV | 6.68 eV | 0.88 eV |
| RbI | 5.70 eV | 6.47 eV | 0.77 eV |
| NaI | 5.56 eV | 6.73 eV | 1.17 eV |
| CsI | 5.76 eV | 5.91 eV | 0.15 eV |
| LiI | uncertain | uncertain |
© 2019 by the author. Licensee MDPI, Basel, Switzerland. This article is an open access article distributed under the terms and conditions of the Creative Commons Attribution (CC BY) license (http://creativecommons.org/licenses/by/4.0/).
Share and Cite
Bhandari, K.P. Optical Properties of Alkali Halides in Ultraviolet Spectral Regions. Optics 2020, 1, 18-31. https://doi.org/10.3390/opt1010002
Bhandari KP. Optical Properties of Alkali Halides in Ultraviolet Spectral Regions. Optics. 2020; 1(1):18-31. https://doi.org/10.3390/opt1010002
Chicago/Turabian StyleBhandari, Khagendra P. 2020. "Optical Properties of Alkali Halides in Ultraviolet Spectral Regions" Optics 1, no. 1: 18-31. https://doi.org/10.3390/opt1010002
APA StyleBhandari, K. P. (2020). Optical Properties of Alkali Halides in Ultraviolet Spectral Regions. Optics, 1(1), 18-31. https://doi.org/10.3390/opt1010002