Article

Biochemical Profiles of In Vivo Oral Mucosa by Using a Portable Raman Spectroscopy System

by
Marcelo Saito Nogueira
1,2,*,
Victoria Ribeiro
3,
Marianna Pires
4,
Felipe Peralta
5 and
Luis Felipe das Chagas e Silva de Carvalho
3,4
1
Tyndall National Institute, University College Cork, Lee Maltings Complex, Dyke Parade, T12R5CP Cork, Ireland
2
Department of Physics, University College Cork, College Road, T12R5CP Cork, Ireland
3
Departamento de Odontologia, Centro Universitário Braz Cubas, Mogi das Cruzes 08773-380, Brazil
4
Departamento de Odontologia, Universidade de Taubaté, Taubaté 12020-270, Brazil
5
Departamento de Odontologia, UNISOCIESC, Centro Universitário Tupy, Campus Marquês de Olinda, Joinville 89203-400, Brazil
*
Author to whom correspondence should be addressed.
Optics 2021, 2(3), 134-147; https://doi.org/10.3390/opt2030013
Submission received: 17 May 2021 / Revised: 24 June 2021 / Accepted: 6 July 2021 / Published: 16 July 2021

Abstract

:
Most oral injuries are diagnosed by histopathological analysis of invasive and time-consuming biopsies. This analysis and conventional clinical observation cannot identify biochemically altered tissues predisposed to malignancy if no microstructural changes are detectable. With this in mind, detailed biochemical characterization of normal tissues and their differentiation features on healthy individuals is important in order to recognize biomolecular changes associated with early tissue predisposition to malignant transformation. Raman spectroscopy is a label-free method for characterization of tissue structure and specific composition. In this study, we used Raman spectroscopy to characterize the biochemistry of in vivo oral tissues of healthy individuals. We investigated this biochemistry based on the vibrational modes related to Raman spectra of four oral subsites (buccal, gingiva, lip and tongue) of ten volunteers as well as with principal component (PC) loadings for the difference between the four types of oral subsites. Therefore, we determined the biochemical characteristics of each type of healthy oral subsite and those corresponding to differentiation of the four types of subsites. In addition, we developed a spectral reference of oral healthy tissues of individuals in the Brazilian population for future diagnosis of early pathological conditions using real-time, noninvasive and label-free techniques such as Raman spectroscopy.

1. Introduction

Currently, there is an increasing need for techniques capable of providing biochemical characterization of tissues in real time. A range of applications requires development of those techniques in order to improve the accuracy of tissue identification, disease detection and surgical guidance. One of these applications is oral cancer diagnosis. During the progression of cancer, biochemical changes occur within the cancer cells [1], altering the levels of nucleic acids, lipids and carbohydrates that can serve as biomarkers for monitoring diseases [2,3,4,5,6,7,8,9].
Although histopathological examination is currently the most accurate and reliable method of diagnosis, this examination has several limitations. For example, surgical biopsies are invasive, require sample preparation and take a long time to analyze, which can cause anxiety and discomfort to patients, resulting in treatment delays. In addition, histopathological analysis is associated with interobserver variability. For all the aforementioned reasons, a non-invasive, real-time point-of-care method to detect and accurately diagnose cancer and premalignancies at early stages could benefit patients as well as decrease the risk of oral cancer incidence and mortality. One of the most cost-effective methods to diagnose cancer is the optical biopsy [1,3,10,11,12,13,14,15,16,17,18]. The term optical biopsy is widely used in optical spectroscopy [6,14,19,20,21,22,23,24], which assists in the diagnostic process and analyzes optical properties [19,25,26,27] associated with tissue biochemistry [3,4,5,6,7,8,9,14,16,23,24,25,28,29,30,31,32,33,34,35,36,37,38,39,40,41,42,43,44,45,46,47,48,49,50,51]. Among optical spectroscopic techniques, Raman spectroscopy is highlighted as one of the most molecular-specific methods which does not suffer interference from water absorption.
Raman spectroscopy is a non-invasive optical technique based on inelastic light scattering (Raman scattering), which changes the wavelength of the incident light depending on the structure of vibrational energy levels of tissue biomolecules such as lipids, proteins and nucleic acids [11,12,52,53,54]. Raman spectroscopy has the ability to extract molecular-specific information of tissue constituents and their functional groups and molecular conformations based on the vibrational modes of tissue biomolecules [13,52,55]. This spectroscopic technique can provide a molecular-level signature of the biochemical composition and cell structure with submicrometric spatial resolution and can be useful for monitoring changes in composition for the diagnosis of early and non-invasive cancer in ex vivo and in vivo tissues. The qualitative and quantitative analysis of Raman spectra allows rapid detection of subtle biochemical changes during the onset of diseases (e.g., early tissue predisposition to malignant transformation) which cannot be identified with conventional clinical observation and other methods relying on tissue microstructural alterations [13,52,55]. Furthermore, early biochemical changes without microstructural manifestation may even be overlooked by the gold-standard histopathological analysis [56,57].
In our previous work [42] using the same raw data as this paper, we have characterized the biochemical content of each type of healthy oral subsite, and built a tissue classifier for comparison of these subsites based on Raman spectra in order to identify the correct tissue location for future comparison with potentially malignant tissues. However, the description of features of biological sources of tissue differentiation is not clear from average quantities of biochemical compounds reported in our previous study. Understanding of sources of tissue differentiation requires multivariate analysis specifically designed for feature extraction which is exploited in our present study.
With the above in mind, our aim in the present study is to contribute to the elucidation of the biochemical components identified from Raman spectra of in vivo normal oral tissues. In particular, we have identified the biochemical compounds associated with Raman vibrational modes most responsible for differentiation among buccal mucosa, lip, gingiva and tongue tissues. We believe that this article will serve as a basis for future studies using Raman spectroscopy to diagnose oral lesions.

2. Materials and Methods

2.1. Clinical Protocol and Research Ethics

The study was approved by the Research Ethics Committee of Universidade do Vale do Paraíba (UNIVAP) via submission to Plataforma Brasil Brazil (number 1132237-2015). Informed consent was obtained for all patients participating in the study. All methods involving human participants were carried out in accordance with relevant guidelines and regulations, including the ethical standards of the institutional and/or national research committee, and with the 1964 Helsinki declaration and its later amendments or comparable ethical standards.
Our study included 10 healthy volunteers. In these volunteers, we collected three Raman spectra of each oral subsite, including lip, buccal mucosa, tongue and gingiva. Therefore, the dataset of this study consists of 120 spectra in total (30 spectra per oral subsite).

2.2. Raman Spectroscopy Equipment and Data Collection

Our Raman spectroscopic measurements were performed by using a laser emitting in the 785 nm wavelength (60 mW of power) coupled to a fiber optic probe (EMVision, Loxahatchee, FL, USA) responsible for delivering the excitation light to biological tissues and sending the collected backscattered light to a Raman spectrometer (Kaiser Optical Systems imaging spectrograph Holospec, f/1.8i-NIR, Ann Arbor, MI, USA). Our probe comprised a central 100 μm fiber with a band-pass filter at its tip for 785 nm laser excitation laser surrounded by six 100 μm fibers with long-pass filter at the probe tip for collection of the diffuse reflected light. The excitation and collection fibers were separated following a Y style so that the diffuse reflected light which propagated through a tissue volume was sent to the detection module. In this module, this light passed through a dichroic mirror and a holographic notch filter before being focused on the entrance aperture of the spectrometer so that only the filtered Raman scattered light reached the spectrometer. In the spectrometer, the Raman signal was obtained by using a CCD detector (Andor IDUs 420 Series) with approximately 95% of quantum efficiency. All components of our Raman spectroscopy system including dichroic mirror, a holographic notch filter, band-pass filter and customized fiber optic probe were part of the commercial Holospec Raman spectrometer system and Andor Solis detector. The Raman spectroscopy instrumentation used to collect the Raman spectra tissue of this study is shown in Figure 1. In this study, Raman spectra were acquired through the average of 20 iterations (repetitions) of 2 s per spectrum.
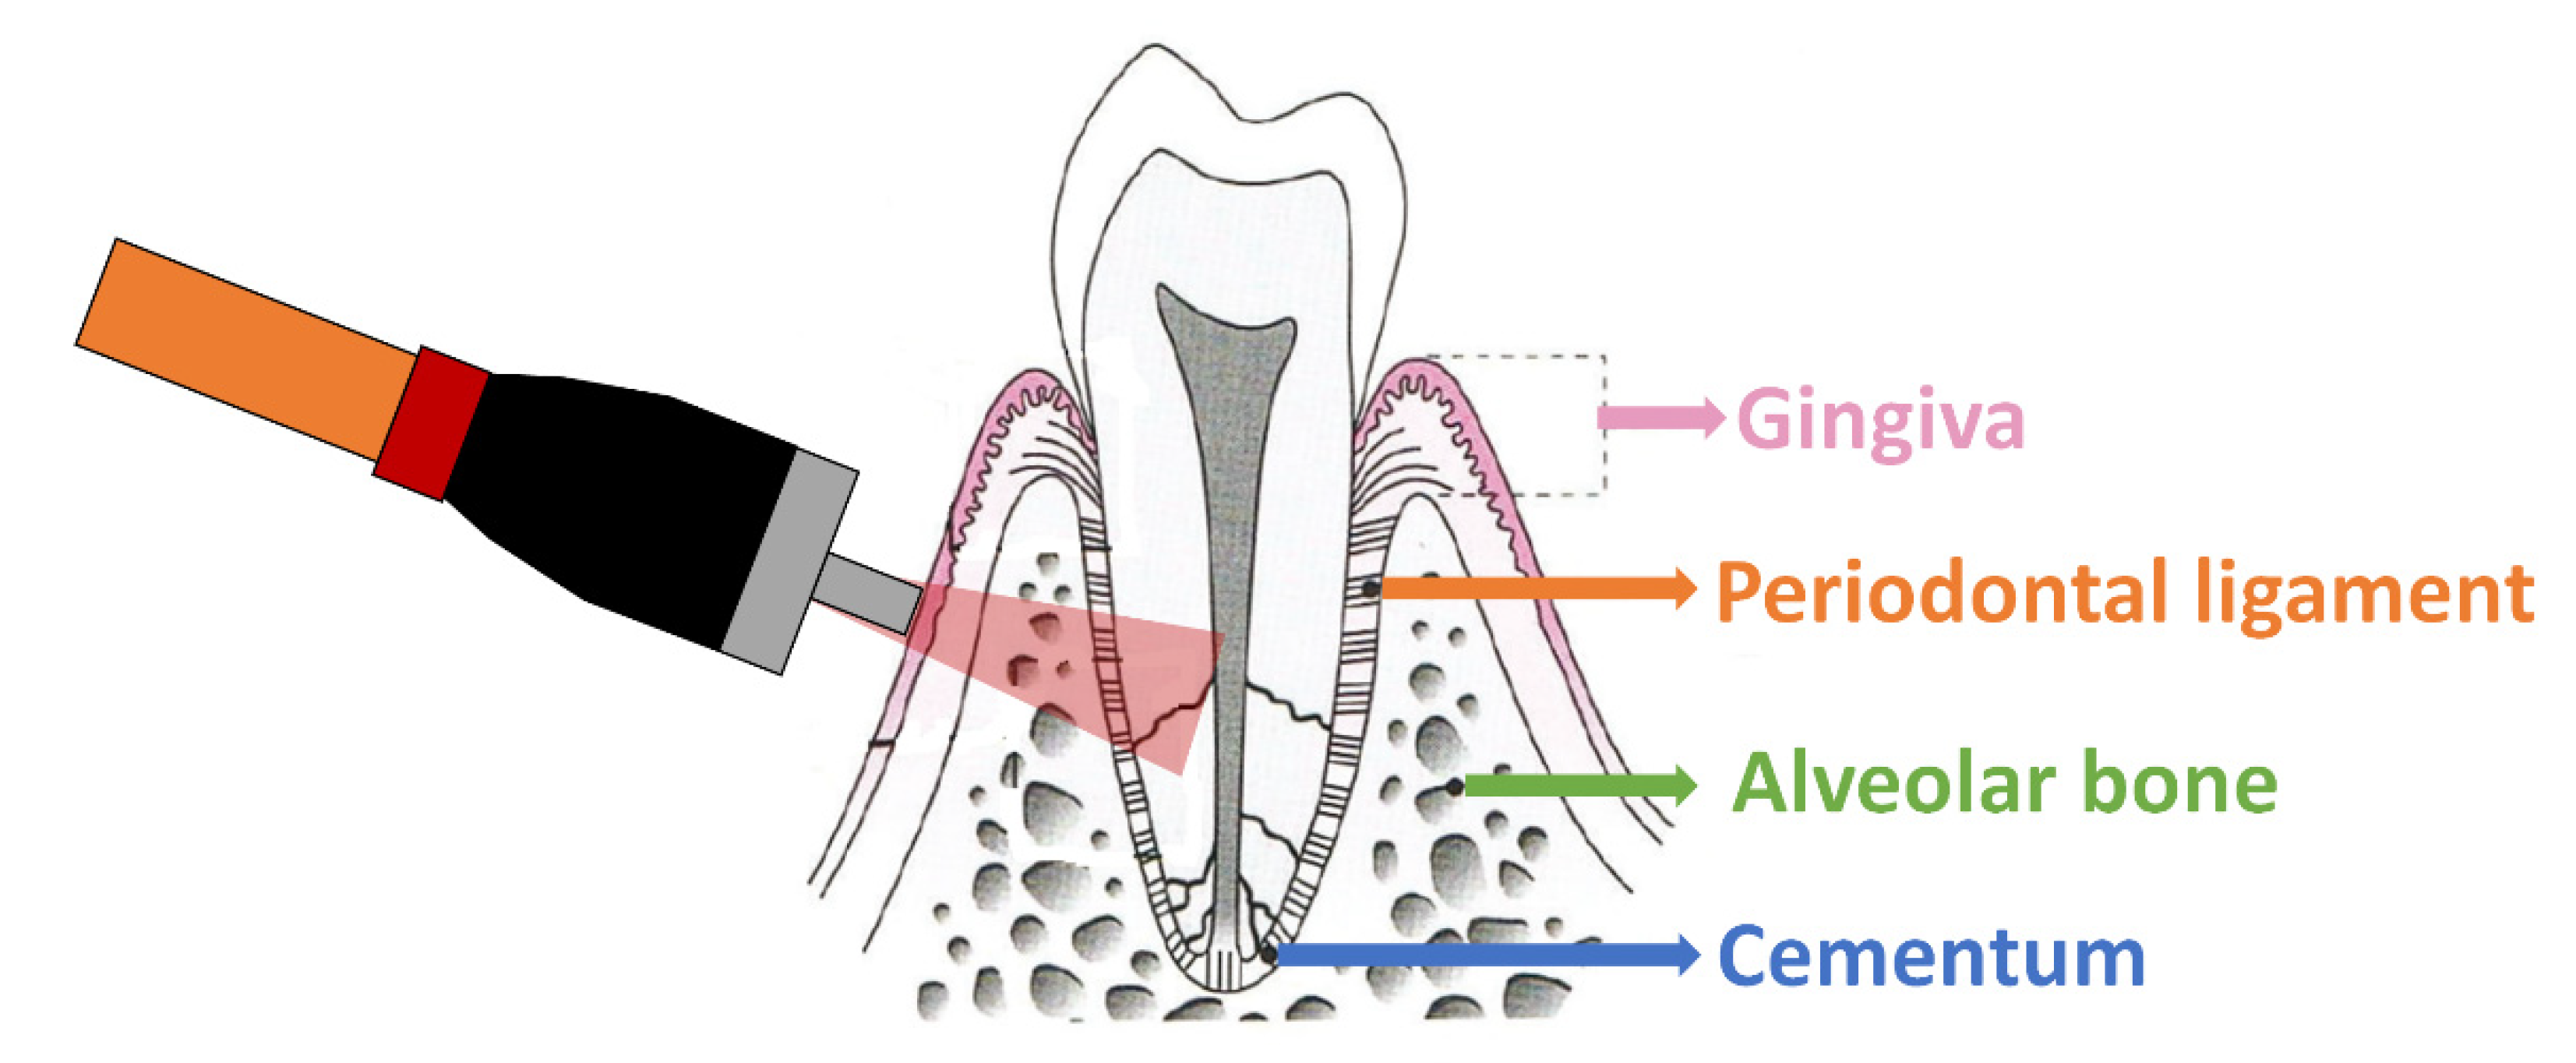
In this study, Raman spectra collected from gingiva tissue included signals from alveolar bone, teeth, periodontal ligament and gingiva, as illustrated in Figure 2.

2.3. Data Analysis

Once Raman spectra were collected, the Raman spectra had their baseline removed by subtracting a polynomial of order five from the local minima of each spectrum. Next, the spectra were smoothed by using a Savitsky–Golay filter (5th order, frame size 7). The wavenumber range between 800 and 1730 cm−1 was chosen for analysis, as the Raman background of silica/quartz fibers is strong from 600 cm−1 up to the quartz peak at 800 cm−1 [59,60], and the range 1730–1800 cm−1 was considered irrelevant for differentiation of tissues in this study. In fact, Raman vibrational modes are tabulated only up to 1756 cm−1 by Talari et al. and Movasaghi et al. [61]. We used the tabulated data by Talari et al. and Movasaghi et al. for assignment of the Raman vibrational modes of spectra of principal component (PC) loadings obtained from the principal component analysis (PCA) used in this study. Briefly, PCA created a new set of linearly independent variables based on linear combinations of the original variables (wavenumbers) so that maximum variance of the dataset is explained. The new variables (principal components or PCs) were ordered from the highest to the lowest explained variance (relative to the total variance of the dataset). With this in mind, first order components (e.g., PC1, PC2 and PC3) represent the dimensions where Raman tissue data are most “spread”. Since Raman data vary mostly across these dimensions, first order components contain the information about the wavenumbers where tissue of all oral subsites (lip, buccal mucosa, tongue and gingiva) are most spread, and, thus, have a higher chance of being differentiated. In order to not bias data on wavenumbers where the amplitude of the Raman signal is higher, the data were scaled by z-scoring each value of Raman intensity at each wavenumber. The z-scores for each wavenumber were centered to have mean 0 and scaled to have standard deviation 1. Once PCA was performed, the new coordinates of each sample (PC scores) were composed of a weighted sum of Raman intensities at each wavenumber and could be used to check the differentiation among oral subsites. The weight (loading) of each original variable (wavenumber) on the composition of a PC determined the importance each wavenumber was given at each PC. Then, the combination of weights (PC loadings) showed the wavenumber ranges influencing most of the variance in the dataset. By excluding the wavenumbers out of the spectral region of interest (800–1730 cm−1), we could evaluate indicators of tissue differentiation using vibrational modes within this range by looking at PC scores and cumulative explained variance by PCs. A flowchart illustrating the steps of Raman spectral analysis is shown in Figure 3.

3. Results

3.1. Biological Variability and Tissue Heterogeneity

Figure 4 suggests that the average Raman spectra of buccal mucosa, lip, gingiva and tongue have similar characteristics to those found in previous studies [62,63]. Prominent characteristics include the peaks at 938 cm−1 and 1130 cm−1 most prominent in tongue tissues, the phosphate peak at 960 cm−1 in gingiva and the peaks at 1271 cm−1, 1303 cm−1, 1447 cm−1 and 1657 cm−1 in buccal mucosa and lip. On the other hand, the characteristic peaks of certain tissues may not be useful for the understanding of the tissue differentiation in terms of biochemical content due to the biological intra- and inter-patient variability. This variability is one of the sources of confusion when discriminating diseased and healthy tissues. Insights into the biological variability or heterogeneity of the healthy oral subsites investigated can be drawn from the progression of cumulative explained variance upon consideration of increasing numbers of PCs.
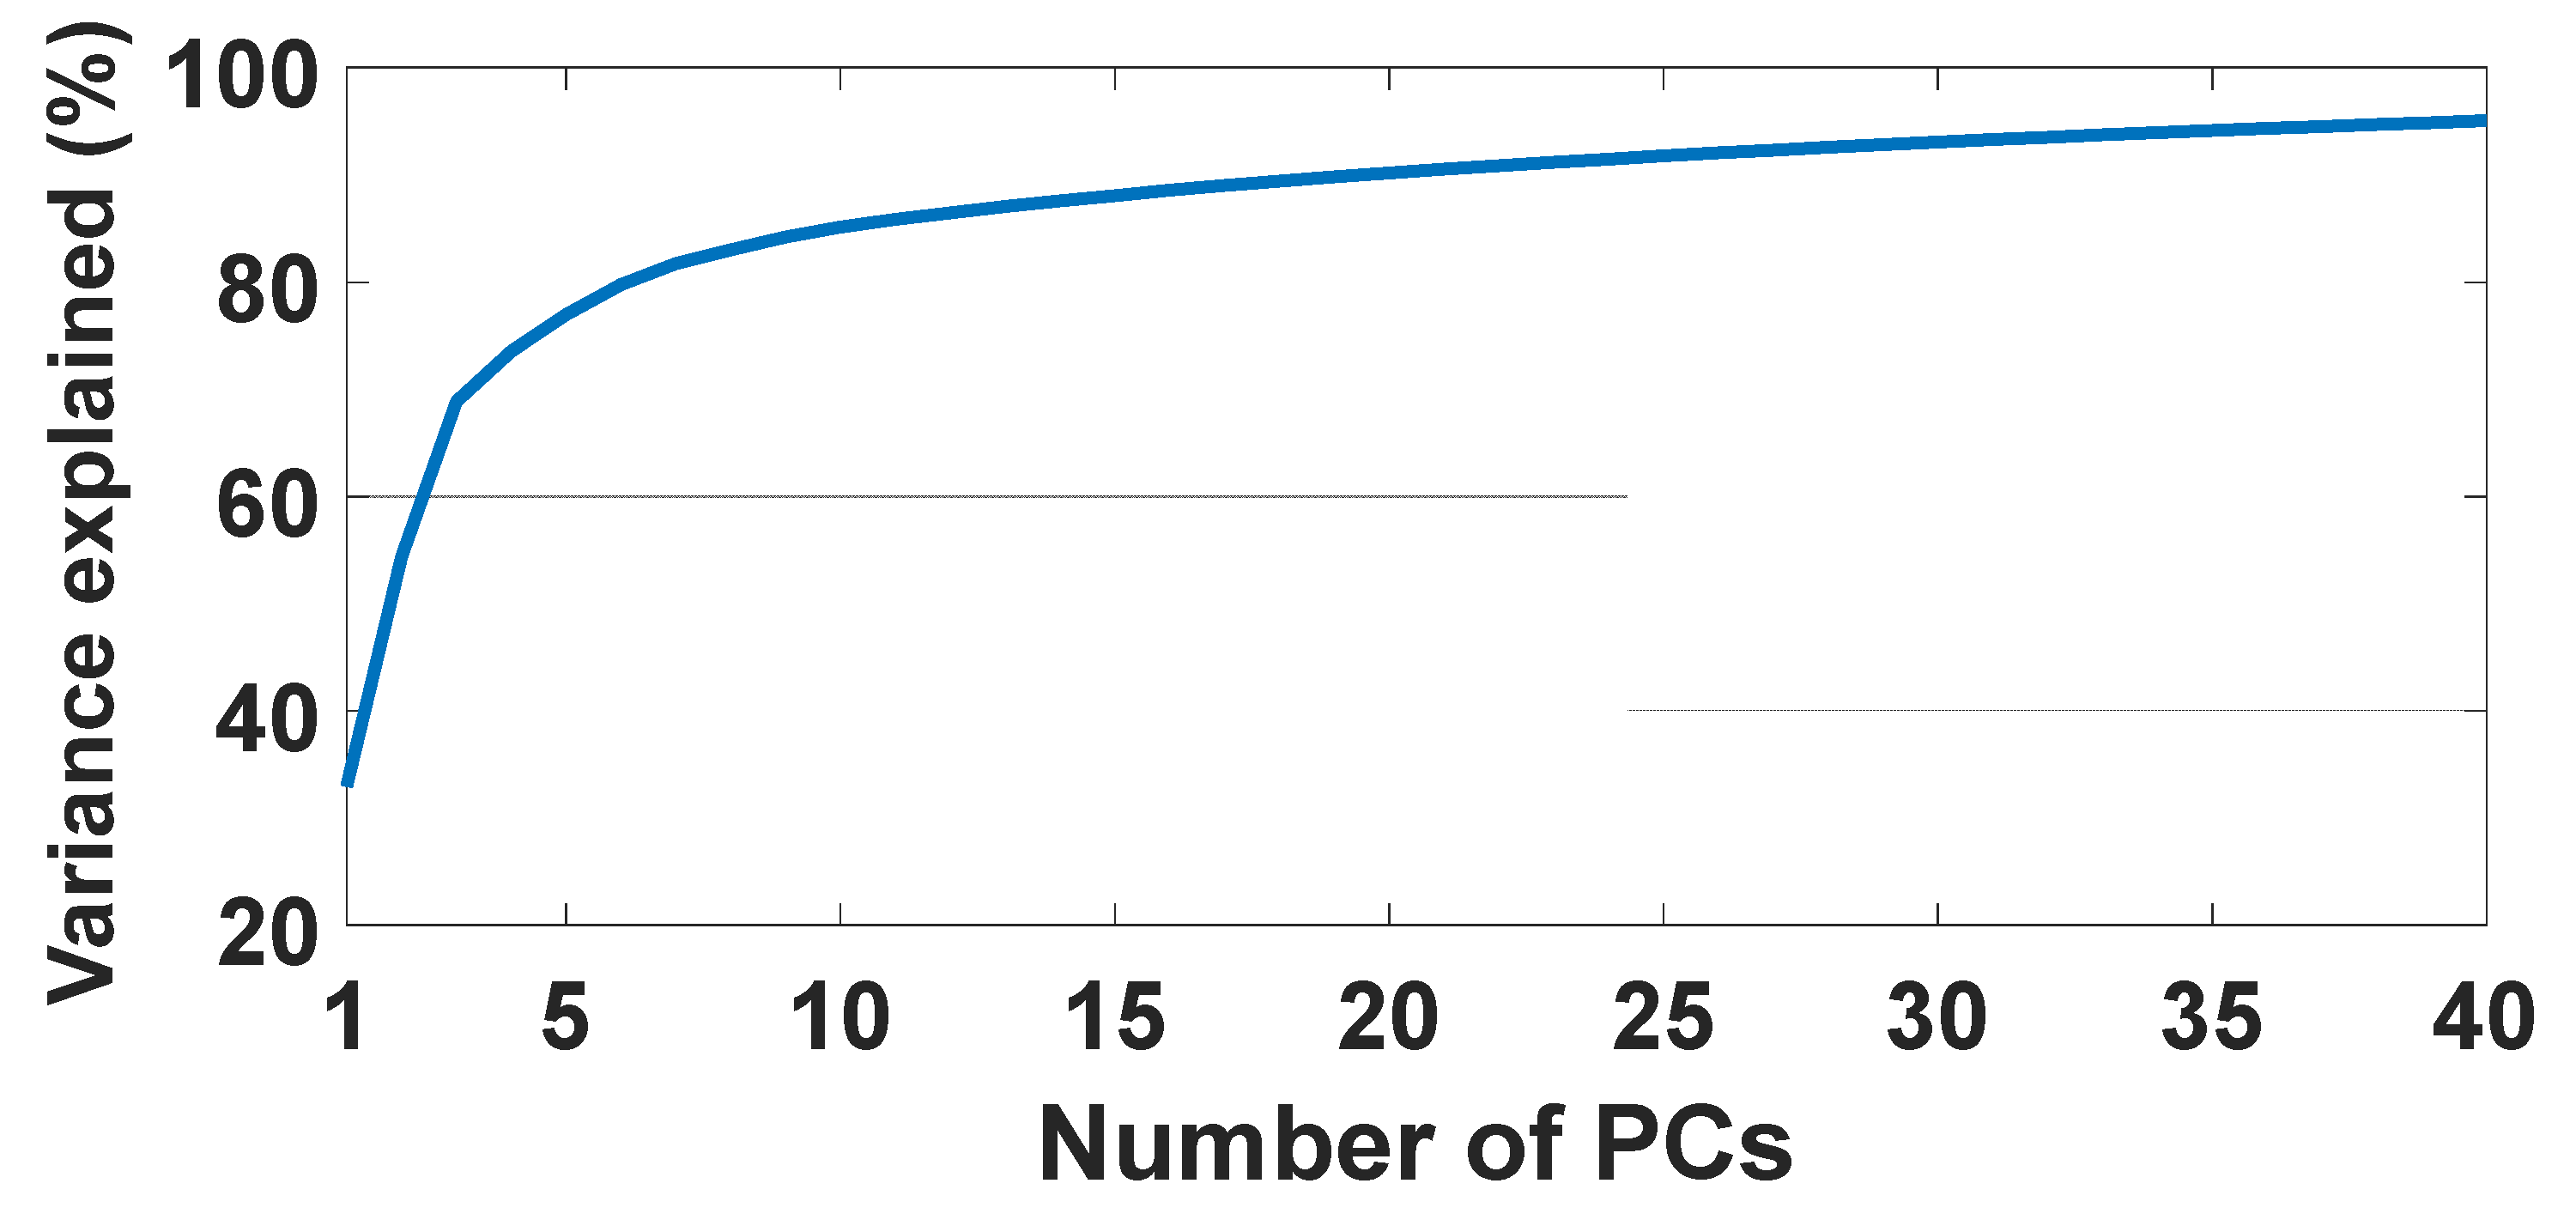
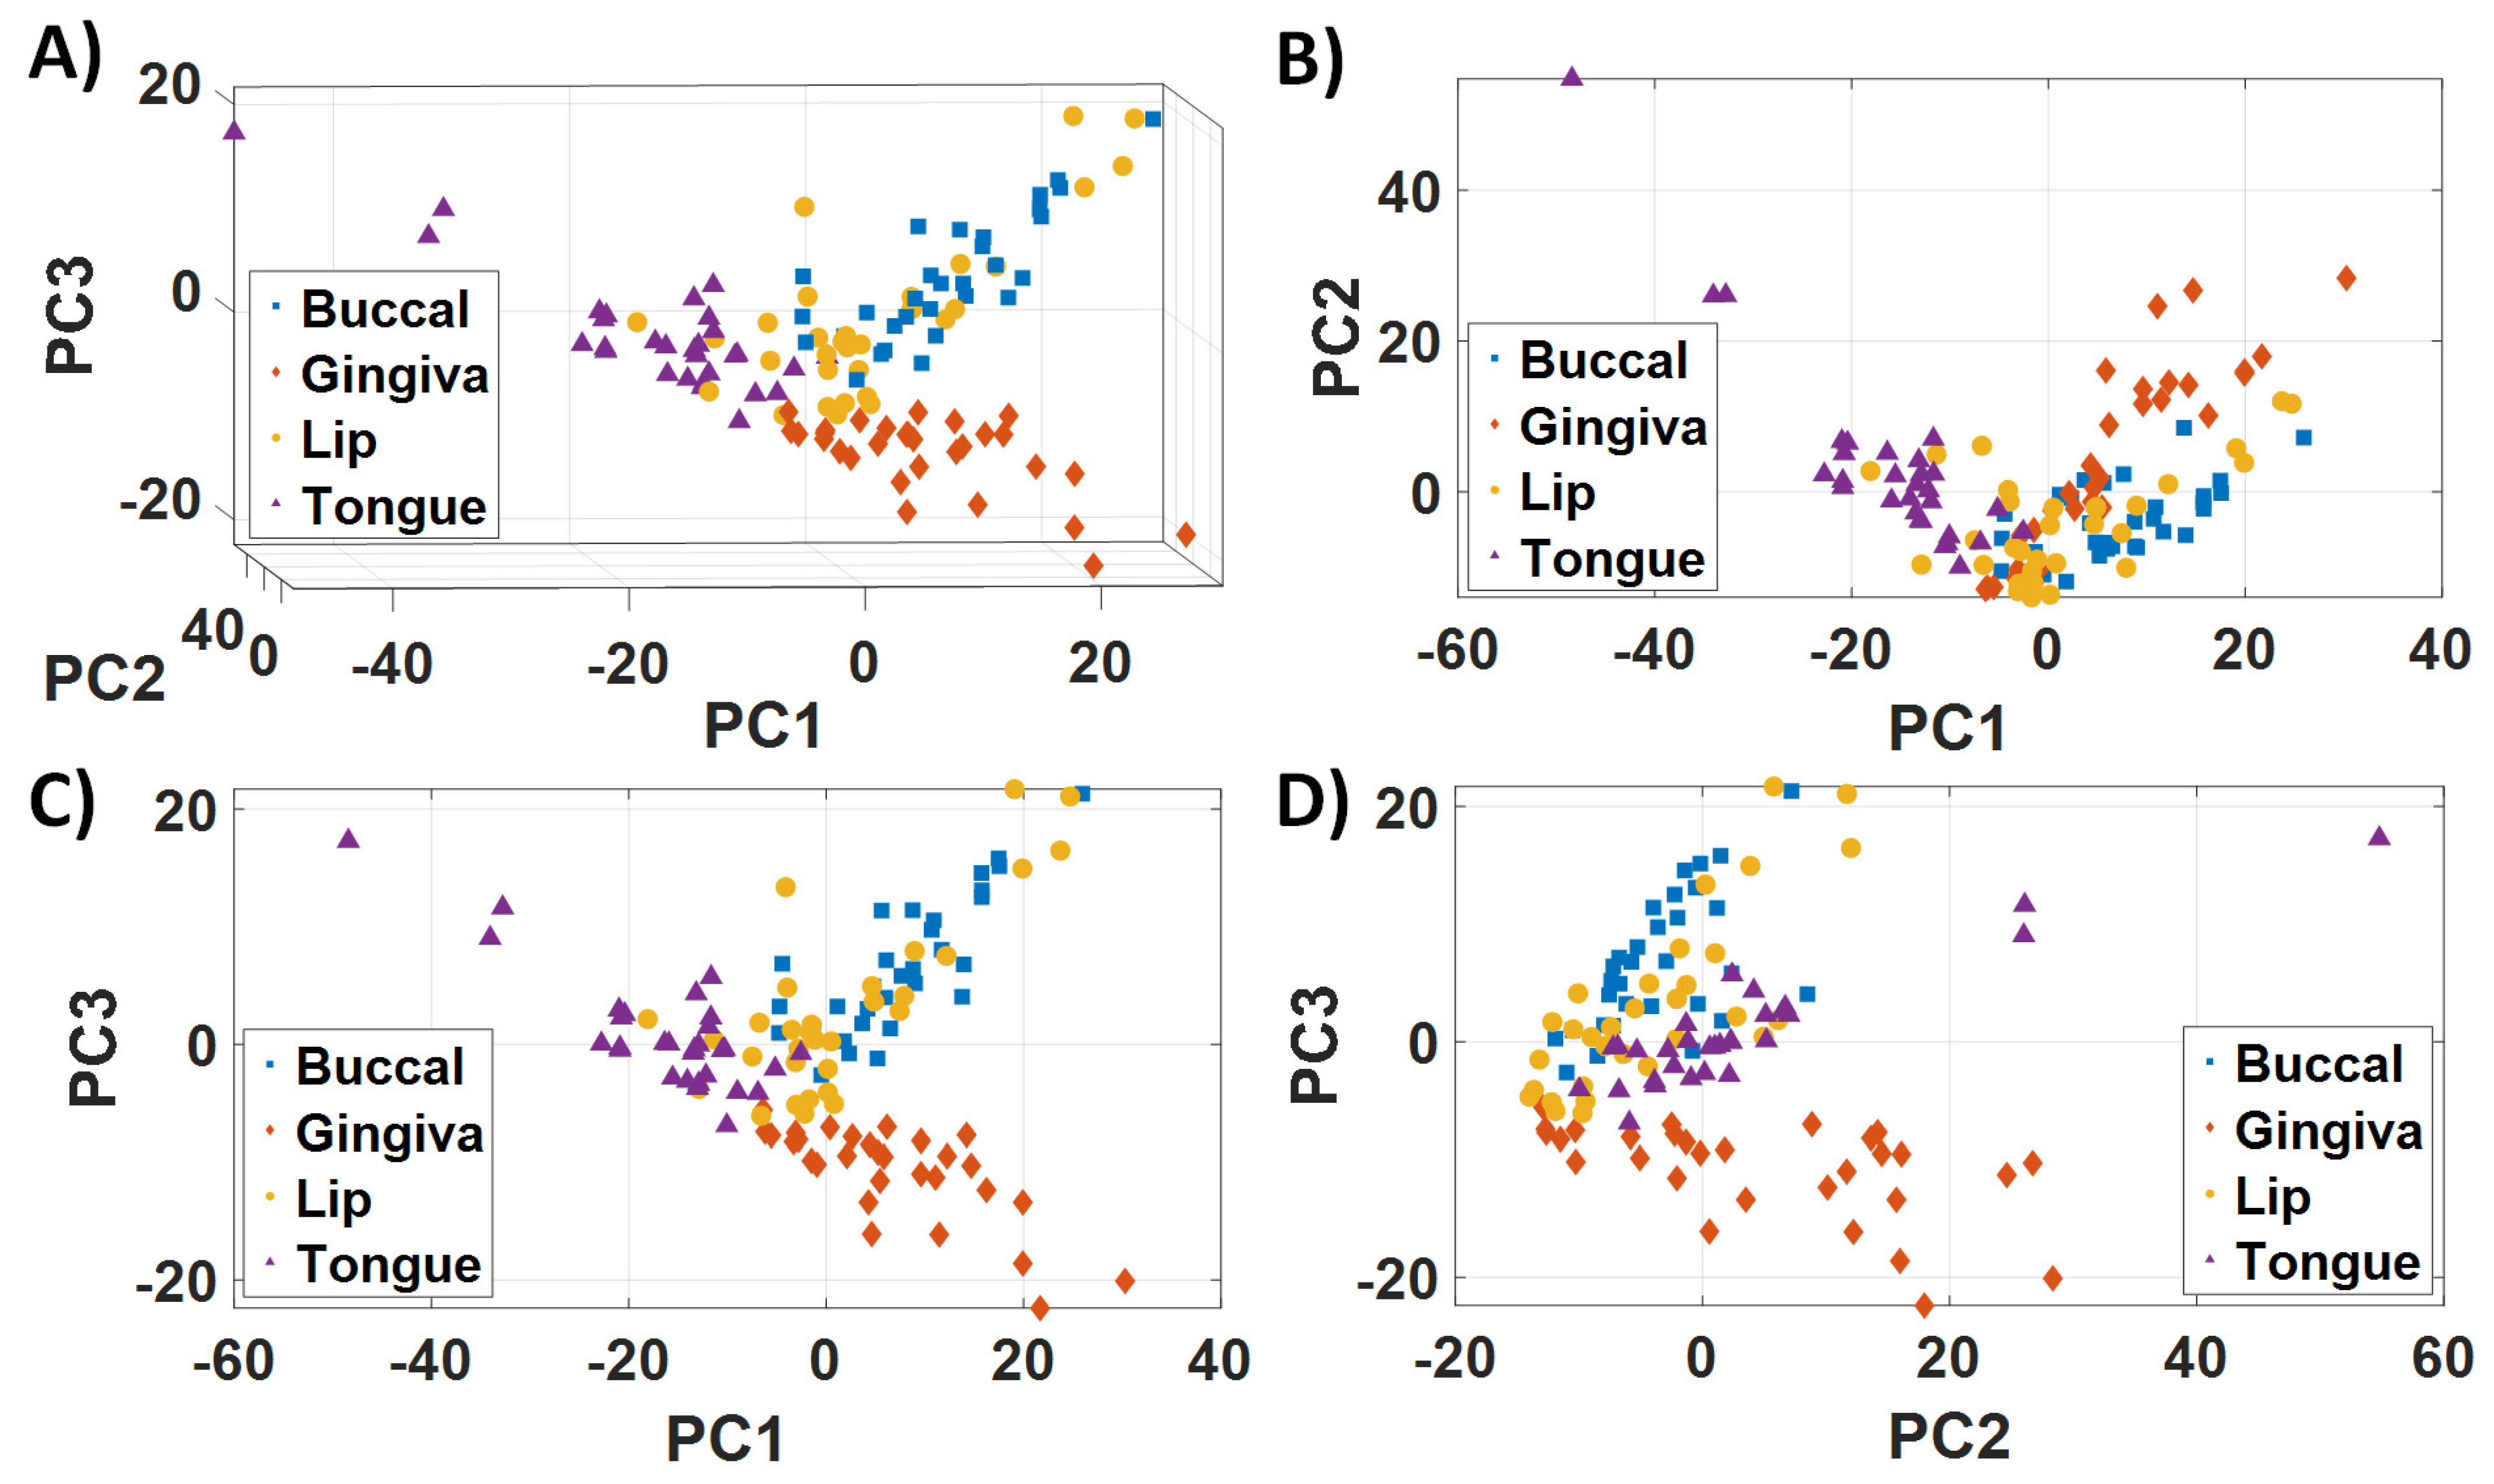
The relatively slow progression of the cumulative variance explained as we increase the number of considered PCs (Figure 5) suggests high biological variability among the oral subsites considered in this study. The first 3 PCs (PC1, PC2 and PC3) explained 68.9% of the variance of the dataset, whereas 81.7% was explained with 7 PCs, 85.1% with 10 PCs, 90% with 20 PCs and 95% with 40 PCs. Still, the PC scores plot (Figure 6) indicates PC1, PC2 and PC3 lead to a clear separation of buccal mucosa, gingiva and tongue tissues, whereas lip may be confused with the other three tissues due to its high heterogeneity.

3.2. Raman Vibrational Modes Leading to Differentiation of Healthy Oral Subsites

Accurate characterization of each oral subsite regardless of biological variability requires complete understanding of biochemical compounds leading to the tissue differentiation among subsites. Therefore, we have identified the peaks of absolute values of PC loadings, which correspond to the wavenumbers leading to the larger variance in the analyzed dataset and, as shown in Figure 6, highest differentiation among buccal mucosa, gingiva, lip and tongue tissues.
Figure 7 shows the loadings of PC1 (32.9% of total variance of the dataset) as a function of wavenumber. Here, we showed both positive and negative loadings in order to retain fidelity to which wavenumber ranges were considered independent when calculating PCs. Vibrational modes were assigned to peaks of absolute amplitude of PC1 loadings according to Table 1. The relationship between vibrational modes assigned to peaks of PC1, PC2 and PC3 loadings and oral biology and biochemistry has been included in the discussion section.
In contrast to the PC1 loadings, Figure 8 indicates that the loadings of PC2 (21.4% of total variance of the dataset) as a function of wavenumber were mostly positive values. As can be observed, bands corresponding to tissue differentiation occur in completely different wavelength ranges compared to those of loadings of PC1 and PC3, which confirms that the PCs are independent and contain complementary information for that differentiation. Vibrational modes were assigned to peaks of absolute amplitude of PC2 loadings according to Table 2.
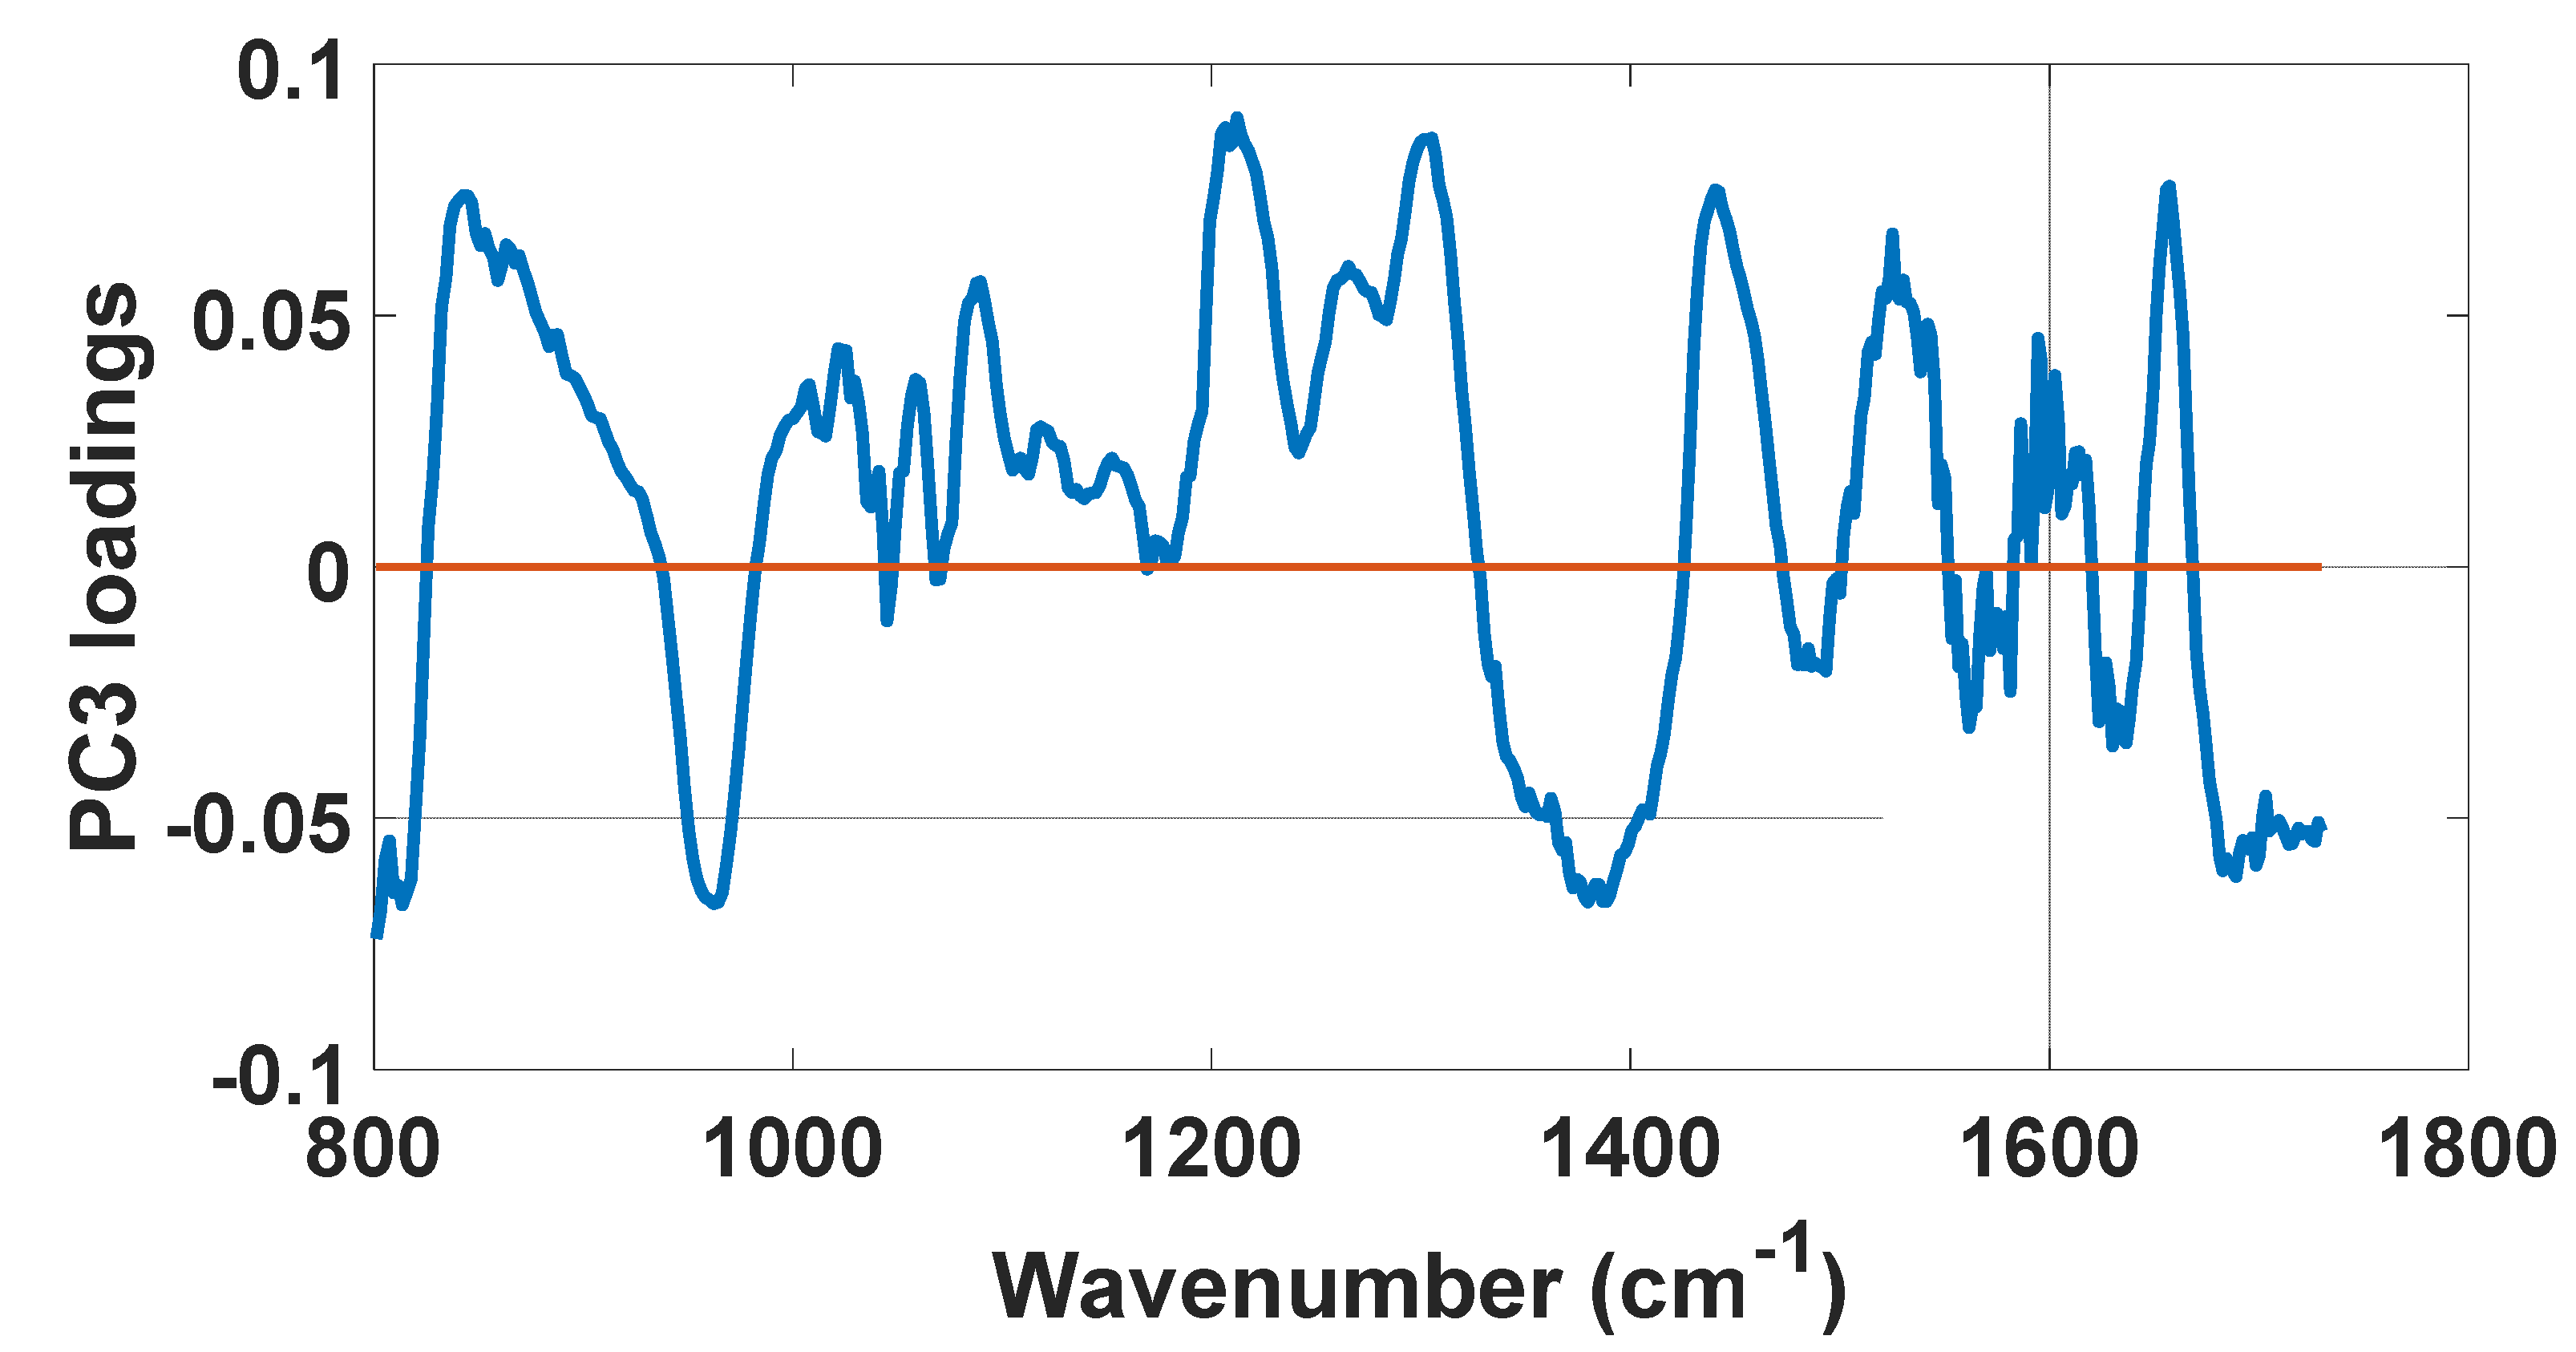
Compared to the loadings of PC1 and PC2, those of PC3 (14.5% of total variance of the dataset) have a much higher frequency of variation and narrower peaks (Figure 9), which suggests that a large range of biomolecules contributes to small variations of the Raman signal of healthy oral subsites. Vibrational modes were assigned to peaks of absolute amplitude of PC3 loadings according to Table 3.

4. Discussion

The clinical aspects of the healthy gingival mucosa appear in a pale pink color, firm, soft consistency and dotted surface, similar to an orange peel. According to Lascala et al. [64], in the histological point of view, the periodontium consists of connective tissue, covered by stratified parakeratinized squamous epithelium, which can vary with the degrees of keratinization (Figure 9). When the gingiva has abnormalities in its structure, there may be an increase in the thickness of the epithelium.
Berkovitz et al. [65] stated that the jugal mucosa is composed of stratified non-keratinized squamous epithelial tissue, containing cells rich in glycogen and loose connective tissue, underlying the epithelium. However, in the lingual mucosa tissue, we find connective tissue with blood and lymph vessels, nerve ganglia, nerves, adipose tissue and lymphoid tissue, filiform papillae, fungiform papillae and circumvented papillae. The portion of the tongue facing the palate is called the lingual dorsum and the portion facing the buccal floor is called the lingual belly. Berkovitz et al. [66] also indicated that in this region, the lining epithelium is a keratinized stratified pavement. In the connective tissue below, we find hair, sweat glands and sebaceous glands. The intermediate portion, known as the red zone of the lip, has a stratified squamous epithelium slightly keratinized (1133 cm−1; Table 1), and whose adjacent connective tissue (1212 cm−1, 1245 cm−1, 1335 cm−1, 1641 cm−1, 1688 cm−1; Table 1, Table 2 and Table 3) is richly capillary. Finally, the inner lining of the lips and cheeks (mucous membrane of the oral cavity) is covered by the buccal mucosa. In this case, the epithelium is stratified, non-keratinized, with a lamina of loose connective tissue.
Considering the results obtained in this research, in the epidermis, the lipids (1064 cm−1, 1074 cm−1, 1305 cm−1, 1380 cm−1 and 1440 cm−1; Table 1, Table 2 and Table 3) that make up the barrier cell membranes consist mainly of cholesterol, free fatty acids and ceramides (1064 cm−1, 1074 cm−1, 1305 cm−1, 1380 cm−1 and 1440 cm−1; Table 1, Table 2 and Table 3) [67]. The palate epithelium and gingiva appear to be more similar to the epidermis, and both areas are keratinized and produce flat scales on the surface, and there are particles of membrane lining in their nucleated cells [65,68].
The observed distribution of lipids in the epidermis and the different regions of the oral epithelium is in accordance with the water permeability data [69]. The epidermis, palate and gingiva, all of which are keratinized (1133 cm−1; Table 1), contain acylceramides and ceramides (1064 cm−1, 1074 cm−1, 1305 cm−1, 1380 cm−1 and 1440 cm−1; Table 1, Table 2 and Table 3), which have been associated with barrier function [70,71].
Cytosine is an important part of DNA and RNA (813.6 cm−1, 824 cm−1, 906 cm−1, 970.3 cm−1, 1335 cm−1 and 1428 cm−1; Table 1, Table 2 and Table 3), as it is one of the nitrogenous bases which encode the genetic information of these molecules, and may be modified in different bases to carry epigenetic information. In DNA, adenine and thymine are present in the same percentages and are always paired with each other. Watson and Crick showed that the DNA molecule is a double helix made up of two paired strands, held together by weak chemical bonds, known as hydrogen bonds, each with its nucleotide sequence—adenine, thymine, cytosine and guanine, which can be referred to as A, T, C and G—complementing the other. That is, adenine is paired with thymine and cytosine with guanine.
Currently, more than 600 specimens of carotenoids (1525 cm−1, Table 3) have been identified, structurally classified into seven different types and distributed in various isomeric forms [72]. The name “carotenoids” is derived from the scientific name of the carrot. According to Krinsky et al. [72], carotenoids (1525 cm−1, Table 3) in the human body are partially converted to vitamin A (retinol), playing an important nutritional role, in addition to exercise and other actions. In this way, carotenoids can reduce the risk of chronic non-communicable diseases, prevent cataract formation and reduce aging-related macular degeneration. In addition, carotenoids (1525 cm−1, Table 3) play a fundamental role as a protector against photooxidation.
Mesquita et al. [73] suggested that natriuretic peptides type B (BNP) and amino terminal fraction of proBNP (NT-proBNP) are considered standard biomarkers in decompensated heart failure. Some materials correlated with calcium phosphate have generated interest in researchers. What motivates this interest is the chemical compatibility and similarity that exists between minerals (calcium phosphates and apatites (962.3 cm−1; Table 3)) and different parts of the human body, such as bone and dental tissues [64].
Schnieders et al. [74] discussed the porous morphology of calcium phosphates (962.3 cm−1; Table 3), presenting the possibility of incorporating drugs on its surface. Upon drug adsorption on the surface of calcium phosphates, it is possible to generate a biomaterial that can be used in denture coating and even as cement material in a dental restoration procedure.
Kuroki et al. [75] carried out a comparative study and have showed that to maintain the proliferation of human cells, palmitic acid (1133 cm−1; Table 1) is essential as energy storage. The epithelium of the oral mucosa (both basal and suprabasal layers) showed a significantly higher percentage composition of palmitic acid (1133 cm−1; Table 1) than the epidermis, but no difference in its distribution between the two layers. These results suggested a much higher energy metabolism in the oral mucosa. The percentage composition of palmitic acid (1133 cm−1; Table 1) was significantly higher in keratinocytes (1133 cm−1; Table 1) of the oral mucosa (non-keratinization; 28.58 ± 5.25) and the gingiva (parakeratinization; 23.00 ± 1.40) compared to in the epidermis (orthokeratinization; 17.54 ± 0.37).
Finally, it is worth mentioning that Raman spectroscopy could be combined with other optical techniques enabling qualitative tissue evaluation through structural analysis. One of these techniques is optical coherence tomography, which could potentially be used to ensure the Raman signals are captured only from the tissue of interest [76,77].

5. Conclusions

In this study, we have analyzed the vibrational modes of peaks of absolute loading amplitudes of principal components (PCs) of Raman spectra in order to determine the biochemical compounds leading to the differentiation of buccal mucosa, lip, gingiva and tongue tissues. In addition, we have provided insight into the biological variability and heterogeneity of healthy oral tissues, as well as the biochemical characteristics for differentiation and accurate characterization of the four types of oral subsites (buccal mucosa, lip, gingiva and tongue). Upon definition of the tissue biochemistry of healthy oral subsites, we developed a spectral reference of oral healthy tissues of individuals in the Brazilian population for future diagnosis of early pathological conditions using real-time, noninvasive and label-free techniques such as Raman spectroscopy.

Author Contributions

Conceptualization, M.S.N., F.P. and L.F.d.C.e.S.d.C.; methodology, M.S.N., V.R., F.P. and L.F.d.C.e.S.d.C.; software, M.S.N.; validation, M.S.N. and L.F.d.C.e.S.d.C.; formal analysis, M.S.N. and L.F.d.C.e.S.d.C.; investigation, M.S.N., M.P. and L.F.d.C.e.S.d.C.; resources, M.S.N. and L.F.d.C.e.S.d.C.; data curation, M.S.N. and L.F.d.C.e.S.d.C.; writing—original draft preparation, M.S.N., V.R., M.P., F.P. and L.F.d.C.e.S.d.C.; writing—review and editing, M.S.N. and L.F.d.C.e.S.d.C.; visualization, M.S.N. and L.F.d.C.e.S.d.C.; supervision, M.S.N. and L.F.d.C.e.S.d.C.; project administration, M.S.N. and L.F.d.C.e.S.d.C.; funding acquisition, L.F.d.C.e.S.d.C. All authors have read and agreed to the published version of the manuscript.

Funding

The authors express their gratitude for research funding to the CAPES (Brazilian Federal Agency for Support and Evaluation of Graduate Education within the Ministry of Education of Brazil). Luis Felipe CS Carvalho is funded by PNPD Odontologia UNITAU and Scientific Initiation Program—Centro Universitário Braz Cubas. Marcelo Saito Nogueira received a scholarship from Science Foundation Ireland which is not related to the research of this paper. The work was supported by the Fundação de Amparo à Pesquisa do Estado de São Paulo (FAPESP-2014/05978-1) through Luis Felipe CS Carvalho’s scholarship. Luis Felipe das Chagas and Silva de Carvalho also thank FAPESP—2018/03636-7 and Coordenação de Aperfeiçoamento de Pessoal de Nível Superior (CAPES) PNPD Odontologia Universidade de Taubaté and Centro Universitário Braz Cubas for the Scientific Initiation Program.

Institutional Review Board Statement

The study was approved by the Research Ethics Committee of Universidade do Vale do Paraíba (UNIVAP) via submission to Plataforma Brasil, Brazil (number 1132237-2015).

Informed Consent Statement

Informed consent was obtained from all subjects involved in the study.

Data Availability Statement

The data presented in this study are available on request from the corresponding author. The data are not publicly available due to expansion of the study and data analysis, possibly leading to commercial applications.

Acknowledgments

The authors would like to acknowledge Eric Marple from EmVision LLC.

Conflicts of Interest

The authors declare no conflict of interest. The funders had no role in the design of the study; in the collection, analyses or interpretation of data; in the writing of the manuscript; or in the decision to publish the results.

References

  1. Carvalho, L.F.C.S.; Dos Santos, L.; Bonnier, F.; O’Callaghan, K.; O’Sullivan, J.; Flint, S.; Neto, L.P.M.; Martin, A.A.; Lyng, F.M.; Byrne, H.J. Can ethanol affect the cell structure? A dynamic molecular and Raman spectroscopy study. Photodiagn. Photodyn. Ther. 2020, 30, 101675. [Google Scholar] [CrossRef]
  2. Mousavi, M.; Moriyama, L.T.T.; Grecco, C.; Nogueira, M.S.; Svanberg, K.; Kurachi, C.; Andersson-Engels, S. Photodynamic therapy dosimetry using multiexcitation multiemission wavelength: Toward real-time prediction of treatment outcome. J. Biomed. Opt. 2020, 25, 063812. [Google Scholar] [CrossRef] [Green Version]
  3. Carvalho, L.F.C.S.; Nogueira, M.S.; Neto, L.P.M.; Bhattacharjee, T.T.; Martin, A.A. Raman spectral post-processing for oral tissue discrimination—A step for an automatized diagnostic system. Biomed. Opt. Express 2017, 8, 5218–5227, Erratum in 2018, 9, 649. [Google Scholar] [CrossRef] [PubMed]
  4. Pires, L.; Nogueira, M.S.; Pratavieira, S.; Moriyama, L.T.; Kurachi, C. Time-resolved fluorescence lifetime for cutaneous melanoma detection. Biomed. Opt. Express 2014, 5, 3080–3089. [Google Scholar] [CrossRef] [PubMed] [Green Version]
  5. Nogueira, M.S.; Cosci, A.; Pratavieira, S.; Takahama, A., Jr.; Azevedo, R.S.; Kurachi, C. Evaluation of Actinic Cheilitis Using Fluorescence Lifetime Spectroscopy. In Proceedings of the SPIE 9703 Optical Biopsy XIV: Toward Real-Time Spectroscopic Imaging and Diagnosis, San Francisco, CA, USA, 15–17 February 2016; Volume 9703. [Google Scholar]
  6. Cosci, A.; Nogueira, M.S.; Prataviera, S.; Takahama, A.; de Souza Azevedo, R.; Kurachi, C. Time-resolved fluorescence spectroscopy for clinical diagnosis of actinic cheilitis. Biomed. Opt. Express 2016, 7, 4210–4219, Erratum in 2018, 9, 648. [Google Scholar] [CrossRef] [PubMed] [Green Version]
  7. Ono, B.A.; Nogueira, M.; Pires, L.; Pratavieira, S.; Kurachi, C. Subcellular localization and photodynamic activity of Photodithazine (glucosamine salt of chlorin e6) in murine melanoma B16-F10: An in vitro and in vivo study. Proc. SPIE 2018, 10476, 1047616. [Google Scholar] [CrossRef]
  8. Kurachi, C.; Pires, L.; Nogueira, M.S.; Pratavieira, S. Lifetime fluorescence for the detection of skin lesions. Biomed. Opt. 2014, 4, 3. [Google Scholar] [CrossRef]
  9. de Andrade, C.T.; Nogueira, M.S.; Kanick, S.C.; Marra, K.; Gunn, J.; Andreozzi, J.; Samkoe, K.S.; Kurachi, C.; Pogue, B.W. Optical Spectroscopy of Radiotherapy and Photodynamic Therapy Responses in Normal Rat Skin Shows Vascular Breakdown Products. In Proceedings of the SPIE 9694 Optical Methods for Tumor Treatment and Detection: Mechanisms and Techniques in Photodynamic Therapy XXV, San Francisco, CA, USA, 13–14 February 2016; Volume 9694. [Google Scholar]
  10. Medeiros-Neto, L.P.; Soto, C.A.T.; Chagas, M.J.; Carvalho, L.F.C.; Rajasekaran, R.; Martin, A.A. In vivo Raman spectroscopic characterization of papillary thyroid carcinoma. Vib. Spectrosc. 2019, 101, 1–9. [Google Scholar] [CrossRef]
  11. Carvalho, L.F.C.S.; Bonnier, F.; O’Callaghan, K.; O’Sullivan, J.; Flint, S.; Byrne, H.J.; Lyng, F.M. Raman micro-spectroscopy for rapid screening of oral squamous cell carcinoma. Exp. Mol. Pathol. 2015, 98, 502–509. [Google Scholar] [CrossRef] [Green Version]
  12. Leal, L.B.; Nogueira, M.S.; Mageski, J.G.A.; Martini, T.P.; Barauna, V.G.; Dos Santos, L.; Carvalho, L.F.C.S. Diagnosis of Systemic Diseases Using Infrared Spectroscopy: Detection of Iron Overload in Plasma—Preliminary Study. Biol. Trace Elem. Res. 2021, 1–15. [Google Scholar] [CrossRef]
  13. Leal, L.B.; Nogueira, M.S.; Canevari, R.A.; Carvalho, L. Vibration spectroscopy and body biofluids: Literature review for clinical applications. Photodiagn. Photodyn. Ther. 2018, 24, 237–244. [Google Scholar] [CrossRef] [PubMed]
  14. Carvalho, L.F.d.C.e.S.d.; Saito Nogueira, M. Optical techniques for fast screening--towards prevention of the coronavirus COVID-19 outbreak. Photodiagn. Photodyn. Ther. 2020, 30, 101765. [Google Scholar] [CrossRef] [PubMed]
  15. Carnevalli, A.C.; Leal, L.; Scherma, A.; Morais, C.; Martin, F.; Bonnier, F.; Baker, M.; Byrne, H.J.; Nogueira, M.S. Identification of Diabetic Patients Via Urine Analysis by FTIR: Preliminary Study (Conference Presentation). In Proceedings of the Photonic Diagnosis and Treatment of Infections and Inflammatory Diseases II, San Francisco, CA, USA, 4–5 February 2019; Volume 10863. [Google Scholar]
  16. Nogueira, M.S. Optical theranostics and treatment dosimetry for COVID-19 lung complications: Towards increasing the survival rate of vulnerable populations. Photodiagn. Photodyn. Ther. 2020, 31, 101892. [Google Scholar] [CrossRef] [PubMed]
  17. Nogueira, M.S. Ultraviolet-based biophotonic technologies for control and prevention of COVID-19, SARS and related disorders. Photodiagn. Photodyn. Ther. 2020, 31, 101890. [Google Scholar] [CrossRef] [PubMed]
  18. Nogueira, M.S. Biophotonic telemedicine for disease diagnosis and monitoring during pandemics: Overcoming COVID-19 and shaping the future of healthcare. Photodiagn. Photodyn. Ther. 2020, 31, 101836. [Google Scholar] [CrossRef] [PubMed]
  19. Nogueira, M.S.; Maryam, S.; Amissah, M.; Lu, H.; Lynch, N.; Killeen, S.; O’Riordain, M.; Andersson-Engels, S. Evaluation of wavelength ranges and tissue depth probed by diffuse reflectance spectroscopy for colorectal cancer detection. Sci. Rep. 2021, 11, 1–17. [Google Scholar]
  20. Nogueira, M.S.; Cosci, A.; Rosa, R.G.T.; Salvio, A.G.; Pratavieira, S.; Kurachi, C. Portable fluorescence lifetime spectroscopy system for in-situ interrogation of biological tissues. J. Biomed. Opt. 2017, 22, 121608. [Google Scholar]
  21. Nogueira, M.S.; Lacerenza, M.; Sekar, S.K.V.; Buttafava, M.; Pifferi, A.; Tosi, A.; Contini, D.; Andersson-Engels, S. Broadband Extraction of Tissue Optical Properties Using a Portable Hybrid Time-Resolved Continuous Wave Instrumentation: Characterization of Ex Vivo Organs. In Proceedings of the Clinical and Translational Biophotonics, Washington, DC, USA, 20–23 April 2020. [Google Scholar]
  22. Lacerenza, M.; Pacheco, A.; Sekar, S.K.V.; Nogueira, M.S.; Buttafava, M.; Tosi, A.; Pifferi, A.; Contini, D.; Andersson-Engels, S. Functional Monitoring of Lung Tissue Using a Hybrid Hyperspectral Time-Resolved GASMAS System: A Systematic Study on Ex Vivo Sample. In Proceedings of the Optical Tomography and Spectroscopy, Washington, DC, USA, 20–23 April 2020. [Google Scholar]
  23. de Paula, D.; Campos, C.; Nogueira, M.S.; Pratavieira, S.; Kurachi, C. Time-Resolved and Steady-State Fluorescence Spectroscopy for the Assessment of Skin Photoaging Process. In Proceedings of the SPIE 9531 Biophotonics South America, Rio de Janeiro, Brazil, 23–25 May 2015; Volume 9531. [Google Scholar]
  24. Nogueira, M.S.; Komolibus, K.; Grygoryev, K.; Gunther, J.E.; Andersson-Engels, S. Fluorescence Spectroscopy of Mouse Organs Using Ultraviolet Excitation: Towards Assessment of Organ Viability for Transplantation. In Proceedings of the SPIE 10876 Optical Interactions with Tissue and Cells XXX, San Francisco, CA, USA, 2–3 February 2019; Volume 10876. [Google Scholar]
  25. Nogueira, M.S.; Raju, M.; Gunther, J.; Grygoryev, K.; Komolibus, K.; Lu, H.; Andersson-Engels, S. Diffuse Reflectance Spectroscopy for Determination of Optical Properties and Chromophore Concentrations of Mice Internal Organs in the Range of 350 nm to 1860 nm. In Proceedings of the SPIE 10685 Biophotonics: Photonic Solutions for Better Health Care VI, Strasbourg, France, 23–26 April 2018; Volume 10685. [Google Scholar]
  26. Nogueira, M.S.; Raju, M.; Komolibus, K.; Grygoryev, K.; Andersson-Engels, S. Assessment of tissue biochemical and optical scattering changes due to hypothermic organ preservation: A preliminary study in mouse organs. J. Phys. D Appl. Phys. 2021, 54, 374003. [Google Scholar] [CrossRef]
  27. Nogueira, M.S.; Raju, M.; Gunther, J.; Maryam, S.; Amissah, M.; Lu, H.; Killeen, S.; O’Riordain, M.; Andersson-Engels, S. Tissue biomolecular and microstructure profiles in optical colorectal cancer delineation. J. Phys. D Appl. Phys. 2021. [Google Scholar] [CrossRef]
  28. Nogueira, M.S.; Cosci, A.; Kurachi, C. Assessment of Oxidative Stress and Metabolic Rates in Liver Grafts Using Time-Resolved Fluorescence Spectroscopy. In Proceedings of the SPIE 10685 Biophotonics: Photonic Solutions for Better Health Care VI, Strasbourg, France, 23–26 April 2018; Volume 10685. [Google Scholar]
  29. Nogueira, M.S.; Kurachi, C. Assessing the Photoaging Process at Sun Exposed and Non-Exposed Skin Using Fluorescence Lifetime Spectroscopy. In Proceedings of the SPIE 9703 Optical Biopsy XIV: Toward Real-Time Spectroscopic Imaging and Diagnosis, San Francisco, CA, USA, 15–17 February 2016; Volume 9703. [Google Scholar]
  30. Nogueira, M.S.; Guimarães, F.E.G. Photophysical processes on biological tissues and photodynamic therapy using steady-state and time-resolved fluorescence techniques: Diagnosis applications, dosimetry and photodegradation kinetics. Photonics 2016, 1, 530. [Google Scholar] [CrossRef]
  31. de Paula Campos, C.; de Paula D’Almeida, C.; Nogueira, M.S.; Moriyama, L.T.; Pratavieira, S.; Kurachi, C. Fluorescence spectroscopy in the visible range for the assessment of UVB radiation effects in hairless mice skin. Photodiagn. Photodyn. Ther. 2017, 20, 21–27. [Google Scholar] [CrossRef]
  32. Nogueira, M.S.; D’Almeida, C.P.; Pratavieira, S.; Kurachi, C. Characterization of a fluorescence lifetime spectroscopy system for diagnostic purposes using an optic fiber probe. Livro Resumos 2014, 9531. [Google Scholar] [CrossRef]
  33. Pires, L.; Nogueira, M.S.; Moriyama, L.T.; Kurachi, C. Fluorescence lifetime for melanoma murine detection. Tech. Summ. 2014, 5, 3080–3089. [Google Scholar]
  34. Silami, F.D.J.; Pratavieira, S.; Nogueira, M.S.; Barrett, A.A.; Sinhoreti, M.A.C.; Geraldeli, S.; Pires-de-Souza, F.C. Quantitative image of fluorescence of ceramic and resin-cement veneers. Braz. Oral Res. 2019, 33, e0088. [Google Scholar] [CrossRef]
  35. Nogueira, M.S.; Panhóca, V.H.; Bagnato, V.S. Fluorescence spectroscopy analysis of light-induced tooth whitening. Proc. SPIE. 2019, 10876. [Google Scholar] [CrossRef]
  36. Nogueira, M.; D’Almeida, C.P.; Cosci, A.; Pratavieira, S.; Kurachi, C.; Schimdt, P.A. Montagem e Caracterização de Sistema de Espectroscopia e Tempo de Vida de Fluorescência Utilizando Fibra Óptica. In Proceedings of the XXIV Congresso Brasileiro de Engenharia Biomédica—CBEB, Uberlandia, Brazil, 13–14 October 2014; pp. 2468–2471. [Google Scholar]
  37. Nogueira, M.S. Fluorescence Lifetime Spectroscopy for Diagnosis of Clinically Similar Skin Lesions. Master’s Thesis, Universidade de São Paulo, São Paulo, Brazil, 2016. [Google Scholar]
  38. Nicolodelli, G.; Tadini, A.M.; Nogueira, M.S.; Pratavieira, S.; Mounier, S.; Huaman, J.L.C.; dos Santos, C.H.; Montes, C.R.; Milori, D.M.B.P. Fluorescence lifetime evaluation of whole soils from the Amazon rainforest. Appl. Opt. 2017, 56, 6936–6941. [Google Scholar] [CrossRef]
  39. Nogueira, M.S.; D’Almeida, C.P.; Pratavieira, S.; Kurachi, C. Sistema de espectroscopia e tempo de vida de fluorescência para diagnóstico clinico. Anais/Resumos 2015. Available online: http://www.sbpcnet.org.br/livro/67ra/resumos/resumos/3575_2645c02c7d44072c127aeef899d0d1bdd.pdf (accessed on 7 February 2021).
  40. Nogueira, M.S.; Pratavieira, S.; Kurachi, C. Portable fluorescence microendoscope system for smartphones and imaging processing software. Tech. Summ. 2015, 26, 040902. [Google Scholar] [CrossRef]
  41. da Silva, A.P.; Saito Nogueira, M.; Jo, J.A.; Salvador Bagnato, V.; Mayumi Inada, N. Optical Based Diagnosis and Treatment of Onychomycosis. Biomed. Opt. 2016, 3, 37. [Google Scholar] [CrossRef]
  42. Carvalho, L.F.C.S.; Nogueira, M.S.; Bhattacharjee, T.; Neto, L.P.M.; Daun, L.; Mendes, T.O.; Rajasekaran, R.; Chagas, M.; Martin, A.A.; Soares, L.E.S. In vivo Raman spectroscopic characteristics of different sites of the oral mucosa in healthy volunteers. Clin. Oral Investig. 2019, 23, 3021–3031. [Google Scholar] [CrossRef]
  43. Nogueira, M.S.; Pratavieira, S.; Júnior, A.T.; Azevedo, R.S.; Kurachi, C. Diagnóstico de queilite actinica por espectroscopia de tempo de vida de fluorescência. Anais/Resumos 2015. Available online: http://www.sbpcnet.org.br/livro/67ra/resumos/resumos/3575_1645c02c7d44072c127aeef899d0d1bdd.pdf (accessed on 7 February 2021).
  44. Salvio, A.G.; Ramirez, D.P.; Inada, N.M.; Stringasci, M.D.; Nogueira, M.S.; Bagnato, V.S. Fractionated Illumination in a Single Visit Photodynamic Therapy for Basal Cell Carcinoma. In Proceedings of the 2017 European Congress of Radiology, Online Conference, 1–5 March 2017. [Google Scholar]
  45. Salvio, A.G.; Ramirez, D.P.; Nogueira, M.S.; Stringasci, M.D.; Oliveira, E.R.; Inada, N.M.; Bagnato, V.S. Evaluation of Pain and Treatment Effect During Large Area Photodynamic Therapy in 140 Patients with Widespread Actinic Keratosis of Upper Limbs. In Proceedings of the 2017 European Congress of Radiology, Online Conference, 1–5 March 2017. [Google Scholar]
  46. Nogueira, M.S.; Rosa, R.G.T.; Pratavieira, S.; de Paula, D.; Kurachi, C. Assembly and characterization of a fluorescence lifetime spectroscopy system for skin lesions diagnostic. In Proceedings of the SPIE 9531 Biophotonics South America, Rio de Janeiro, Brazil, 23–25 May 2015; Volume 9531. [Google Scholar]
  47. Marcelo, S.N.; Fabio Francisco, P.; Raphael Antonio, P.; Kleber Thiago, O.; Vanderlei Salvador, B.; Guimarães, G.; Eduardo, F. Characterization of photophysical properties of curcumin for theranostics of neurodegenerative diseases. Proc. SPIE 2019, 10876. [Google Scholar] [CrossRef]
  48. Nogueira, M.S.; Bagnato, V.S.; Panhoca, V.H. Characterization of teeth fluorescence properties due to coffee pigmentation: Towards optimization of quantitative light-induced fluorescence for tooth color assessment. Proc. SPIE 2020, 11238. [Google Scholar] [CrossRef]
  49. Nogueira, M.S.; Pinto, F.F., Jr.; Caface, R.A.; de Oliveira, K.T.; Guimarães, F.E.G. Optimization of curcumin formulations for fluorescence-based applications. Proc. SPIE 2020, 11238. [Google Scholar] [CrossRef]
  50. Nogueira, M.S.; Bagnato, V.S.; Panhóca, V.H. Calculation of whiteness and yellowness indexes using colorimetric and photographic methods for tooth shade evaluation. Proc. SPIE 2020, 11238. [Google Scholar] [CrossRef]
  51. Nogueira, M.S.; Bagnato, V.S.; Panhoca, V.H. Evaluation of the whitening effectiveness of violet illumination alone or combined with hydrogen peroxide gel. Photobiomodul. Photomed. Laser Surg. 2021, 39, 395–402. [Google Scholar] [CrossRef]
  52. Baker, M.J.; Byrne, H.J.; Chalmers, J.; Gardner, P.; Goodacre, R.; Henderson, A.; Kazarian, S.G.; Martin, F.L.; Moger, J.; Stone, N.; et al. Clinical applications of infrared and Raman spectroscopy: State of play and future challenges. Analyst 2018, 143, 1735–1757. [Google Scholar] [CrossRef]
  53. Carvalho, L.F.C.S.; Bonnier, F.; Tellez, C.; dos Santos, L.; O’Callaghan, K.; O’Sullivan, J.; Soares, L.E.S.; Flint, S.; Martin, A.A.; Lyng, F.M.; et al. Raman spectroscopic analysis of oral cells in the high wavenumber region. Exp. Mol. Pathol. 2017, 103, 255–262. [Google Scholar] [CrossRef] [Green Version]
  54. Carvalho, L.F.C.S.; Nogueira, M.S. New insights of Raman spectroscopy for oral clinical applications. Analyst 2018, 143, 6037–6048. [Google Scholar] [CrossRef]
  55. Bergholt, M.S.; Lin, K.; Wang, J.; Zheng, W.; Xu, H.; Huang, Q.; Ren, J.; Ho, K.Y.; Teh, M.; Srivastava, S.; et al. Simultaneous fingerprint and high-wavenumber fiber-optic Raman spectroscopy enhances real-time in vivo diagnosis of adenomatous polyps during colonoscopy. J. Biophotonics 2016, 9, 333–342. [Google Scholar] [CrossRef]
  56. Slaughter, D.P.; Southwick, H.W.; Smejkal, W. “Field cancerization” in oral stratified squamous epithelium. Clinical implications of multicentric origin. Cancer 1953, 6, 963–968. [Google Scholar] [CrossRef]
  57. Chai, H.; Brown, R.E. Field effect in cancer—An update. Ann. Clin. Lab. Sci. 2009, 39, 331–337. [Google Scholar]
  58. Cope, G.; Cope, A. The periodontium: An anatomical guide. Dent. Nurs. 2011, 7, 376–378. [Google Scholar] [CrossRef]
  59. Motz, J.T.; Hunter, M.; Galindo, L.H.; Gardecki, J.A.; Kramer, J.R.; Dasari, R.R.; Feld, M.S. Optical fiber probe for biomedical Raman spectroscopy. Appl. Opt. 2004, 43, 542–554. [Google Scholar] [CrossRef] [PubMed]
  60. Tsiminis, G.; Chu, F.; Warren-Smith, S.C.; Spooner, N.A.; Monro, T.M. Identification and quantification of explosives in nanolitre solution volumes by Raman spectroscopy in suspended core optical fibers. Sensors 2013, 13, 13163–13177. [Google Scholar] [CrossRef] [PubMed] [Green Version]
  61. Talari, A.C.S.; Movasaghi, Z.; Rehman, S.; Rehman, I.U. Raman spectroscopy of biological tissues. Appl. Spectrosc. Rev. 2015, 50, 46–111, Erratum in 2007, 42, 493–541. [Google Scholar] [CrossRef]
  62. Sahu, A.; Deshmukh, A.; Hole, A.R.; Chaturvedi, P.; Krishna, C.M. In vivo subsite classification and diagnosis of oral cancers using Raman spectroscopy. J. Innov. Opt. Health Sci. 2016, 9, 1650017. [Google Scholar] [CrossRef]
  63. Bergholt, M.S.; Zheng, W.; Huang, Z. Characterizing variability in in vivo Raman spectroscopic properties of different anatomical sites of normal tissue in the oral cavity. J. Raman Spectrosc. 2012, 43, 255–262. [Google Scholar] [CrossRef]
  64. Lascala, N.T.; Moussalli, N.H. Compêndio Terapêutico Periodontal. In Compêndio Terapêutico Periodontal; Editora Artes Médicas: Porto Alegre, Brazil, 1995; p. 522. [Google Scholar]
  65. Martinez, I.R., Jr.; Peters, A. Membrane-coating granules and membrane modifications in keratinizing epithelia. Am. J. Anat. 1971, 130, 93–119. [Google Scholar] [CrossRef]
  66. Berkovitz, B.K.B.; Holland, G.R.; Moxham, B.J. Anatomia, Embriologia e Histologia Bucal; Artmed: Porto Alegre, Brazil, 2004. [Google Scholar]
  67. Gray, G.M.; Yardley, H.J. Different populations of pig epidermal cells: Isolation and lipid composition. J. Lipid Res. 1975, 16, 441–447. [Google Scholar] [CrossRef]
  68. Matoltsy, A.G. Keratinization. J. Investig. Dermatol. 1976, 67, 20–25. [Google Scholar] [CrossRef] [PubMed] [Green Version]
  69. Squier, C.A.; Hall, B.K. The permeability of skin and oral mucosa to water and horseradish peroxidase as related to the thickness of the permeability barrier. J. Investig. Dermatol. 1985, 84, 176–179. [Google Scholar] [CrossRef] [Green Version]
  70. Yardley, H.J.; Summerly, R. Lipid composition and metabolism in normal and diseased epidermis. Pharmacol. Ther. 1981, 13, 357–383. [Google Scholar] [CrossRef]
  71. Wertz, P.W.; Downing, D.T. Ceramides of pig epidermis: Structure determination. J. Lipid Res. 1983, 24, 759–765. [Google Scholar] [CrossRef]
  72. Krinsky, N.I. The biological properties of carotenoids. Pure Appl. Chem. 1994, 66, 1003–1010. [Google Scholar] [CrossRef] [Green Version]
  73. Mesquita, E.T.; Montera, M.W.; Neto, J.D.S.; Pereira, S.B.; Freitas, A.F.; Volschan, A.; Biolo, A.; Filho, A.C.B.N.; Chagas, A.C.P.; Jorge, A.J.L.; et al. Biomarkers in cardiology--part 1-in heart failure and specific cardiomyopathies. Arq. Bras. Cardiol. 2014, 103, 451. [Google Scholar]
  74. Schnieders, J.; Gbureck, U.; Vorndran, E.; Schossig, M.; Kissel, T. The effect of porosity on drug release kinetics from vancomycin microsphere/calcium phosphate cement composites. J. Biomed. Mater. Res. Part B Appl. Biomater. 2011, 99, 391–398. [Google Scholar] [CrossRef]
  75. Kuroki, S.; Yokoo, S.; Terashi, H.; Hasegawa, M.; Komori, T. Epithelialization in oral mucous wound healing in terms of energy metabolism. Kobe J. Med. Sci. 2009, 55, E5–E15. [Google Scholar]
  76. Fried, D.; Xie, J.; Shafi, S.; Featherstone, J.D.B.; Breunig, T.; Le, C.Q. Imaging caries lesions and lesion progression with polarization sensitive optical coherence tomography. J. Biomed. Opt. 2002, 7, 618–627. [Google Scholar] [CrossRef]
  77. Wijesinghe, R.E.; Cho, N.H.; Park, K.; Jeon, M.; Kim, J. Bio-photonic detection and quantitative evaluation method for the progression of dental caries using optical frequency-domain imaging method. Sensors 2016, 16, 2076. [Google Scholar] [CrossRef] [Green Version]
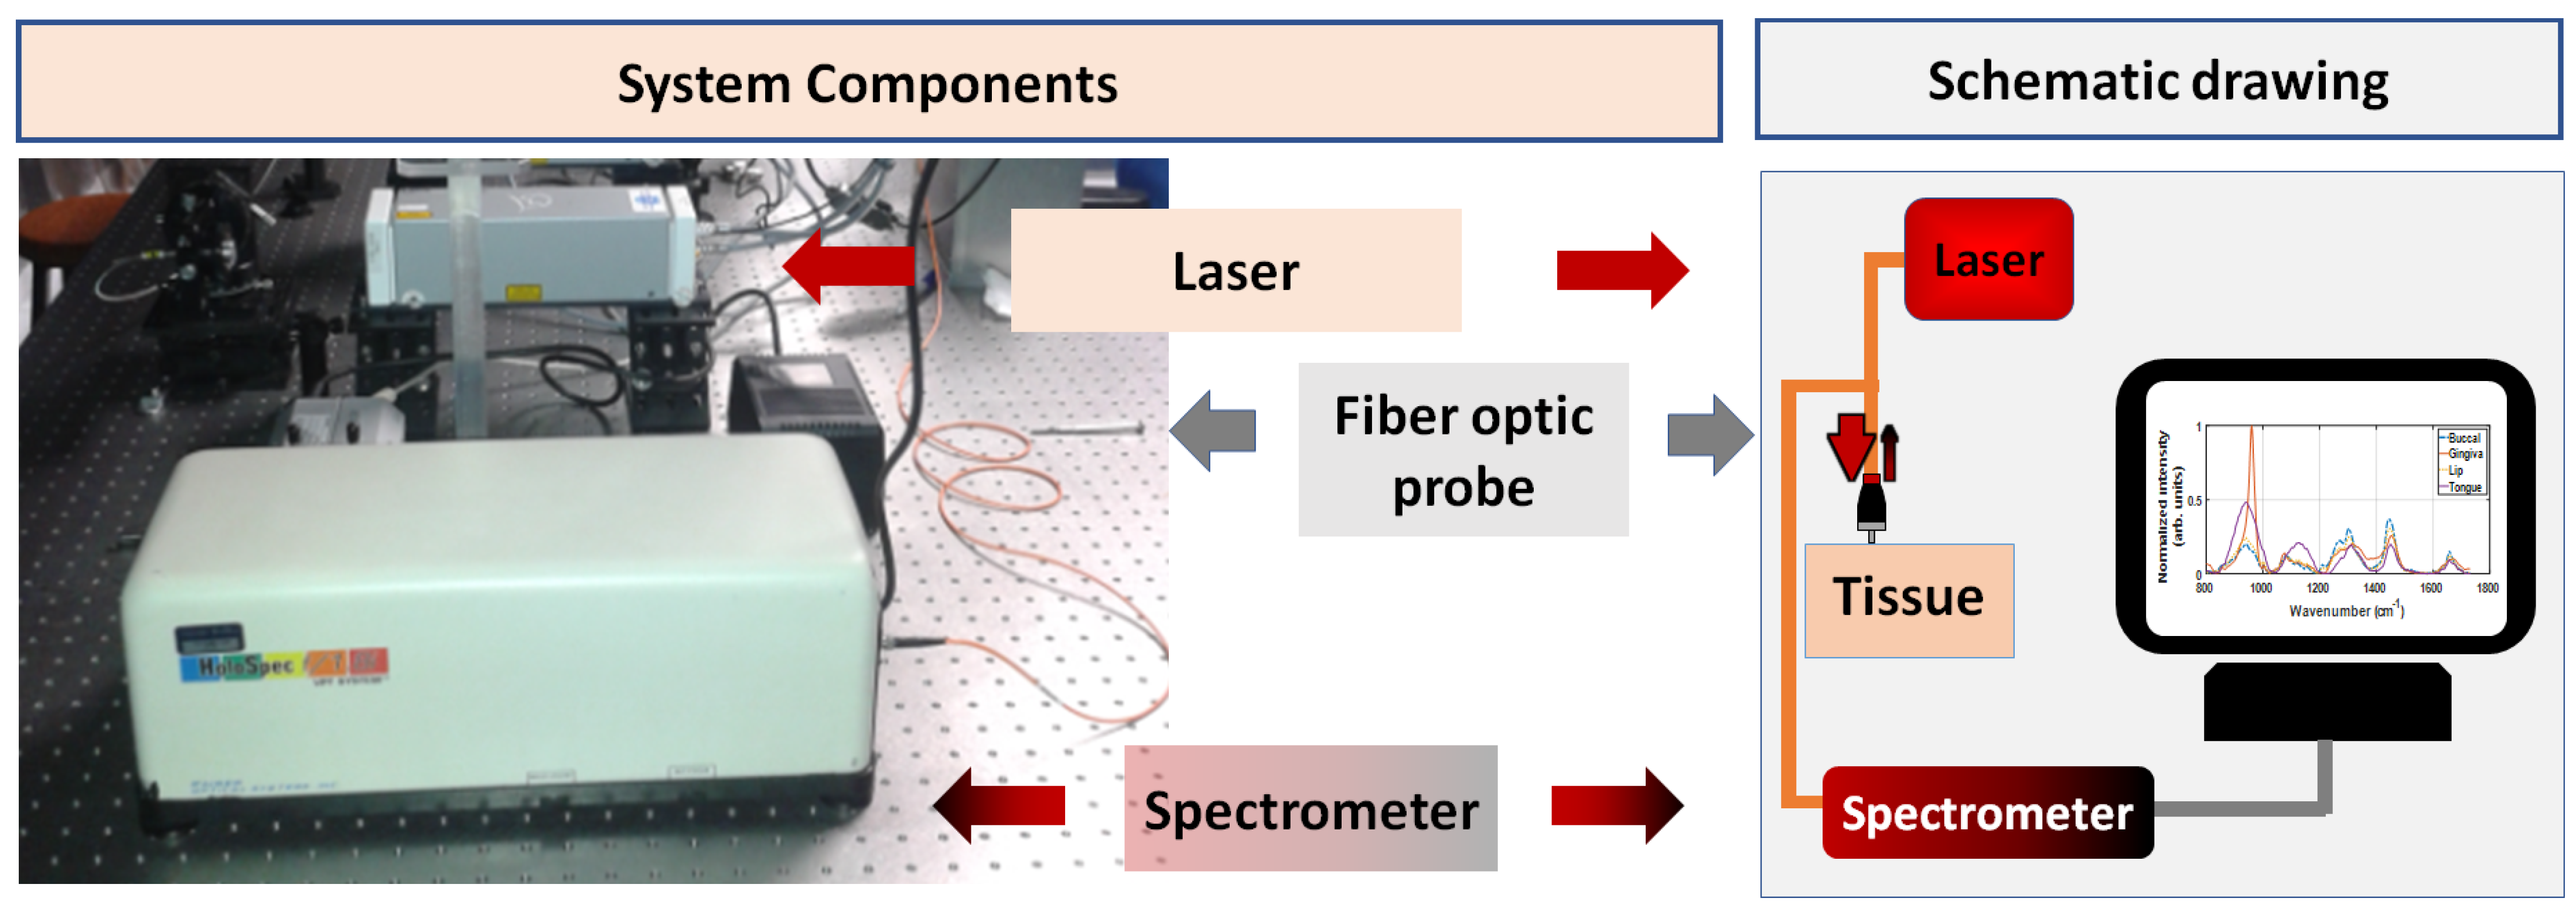
Figure 1. Components and schematic drawing of the Raman spectroscopy system used for the tissue measurements of our study.
Optics 02 00013 g001
Figure 2. Schematic anatomical drawing of the longitudinal section of a premolar and associated periodontal tissues. Adapted from Cope [58].
Optics 02 00013 g002
Figure 3. Flowchart of the steps of Raman spectra analysis collected in this study.
Optics 02 00013 g003
Figure 4. Average Raman spectra of buccal mucosa (blue), gingiva (red), lip (yellow) and tongue (purple) normalized (divided) by the maximum intensity value among all the average Raman spectra.
Optics 02 00013 g004
Figure 5. Cumulative variance explained as a function of the number of PCs.
Optics 02 00013 g005
Figure 6. Scatterplot of PC scores of buccal mucosa (blue), gingiva (red), lip (yellow) and tongue (purple). (A) Scatterplot for PC1 × PC2 × PC3, (B) scatterplot for PC1 × PC2, (C) scatterplot for PC1 × PC3, (D) scatterplot for PC2 × PC3.
Optics 02 00013 g006
Figure 7. Wavenumber-dependent PC1 loadings (blue) and the zero line (red) for easier visualization of the absolute amplitude of loading values.
Optics 02 00013 g007
Figure 8. Wavenumber-dependent PC2 loadings and the zero line (red) for easier visualization of the absolute amplitude of loading values.
Optics 02 00013 g008
Figure 9. Wavenumber-dependent PC3 loadings and the zero line (red) for easier visualization of the absolute amplitude of loading values.
Optics 02 00013 g009
Table 1. Vibrational modes assigned to peaks of absolute values of PC1 loadings [61].
PC1 LoadingsVibrational ModesBiochemical Compound
824 cm−1Out-of-plane ring breathingPhosphodiester bonds
906 cm−1Out-of-plane ring breathingTyrosine
998 cm−1ν45(CC)Red blood cells
1064 cm−1Skeletal C-C stretch of lipidsFatty acids
1133 cm−1Out-of-plane ring breathingPalmitic acid
1245 cm−1Out-of-plane ring breathingAmide III
1428 cm−1B, Z-markerDeoxyribose
1641 cm−1Amide I bandProteins
Table 2. Vibrational modes assigned to peaks of absolute values of PC2 loadings [61].
PC2 LoadingsVibrational ModesBiochemical Compound
946.3 cm−1Skeletal modes or single bond stretching vibrationsPolysaccharides
970.3 cm−1Phosphate monoester groupsPhosphorylated proteins and cellular nucleic acids
1074 cm−1Glucose, triglycerides, C-C (lipid)
1335 cm−1CH3CH2 wagging or twistingCollagen or nucleic acids
1495 cm−1C-C stretching in benzenoid ring
1680 cm−1 Bound and free NADH
Table 3. Vibrational modes assigned to peaks of absolute values of PC3 loadings [61].
PC3 LoadingsVibrational ModesBiochemical Compound
813.6 cm−1C-C and C5′-O-P-O-C3′ Stretching of phosphodiester bondRNA
842.6 cm−1Out-of-plane ring breathingGlucose–saccharide
962.3 cm−1Phosphate symmetric stretching vibrationCalcium hydroxyapatite
1212 cm−1C C6H5 stretching mode andTyrosine and phenylalanine
ν18(δ: CmH)Red blood cells
1305 cm−1CH2 deformationLipids, adenine, cytosine
1380 cm−1δCH3 symmetric (CH3 bond)Lipids
1440 cm−1δ(CH2), CH2 and CH3 deformation vibrationsLipids
1525 cm−1In-plane vibrations of the conjugated -C=C-Carotenoids
1627 cm−1Cα=Cα stretch and amide C=O stretching absorptionβ-form polypeptide films
1688 cm−1Disordered structure; non-hydrogen bondedAmide I
Publisher’s Note: MDPI stays neutral with regard to jurisdictional claims in published maps and institutional affiliations.