Article

Electrochemical Properties of Sputtered Ruthenium Oxide Neural Stimulation and Recording Electrodes

by
Bitan Chakraborty
Department of Materials Science and Engineering, University of Texas at Dallas, Richardson, TX 75080, USA
Electrochem 2023, 4(3), 350-364; https://doi.org/10.3390/electrochem4030023
Submission received: 10 June 2023 / Revised: 4 July 2023 / Accepted: 20 July 2023 / Published: 24 July 2023
(This article belongs to the Collection Feature Papers in Electrochemistry)

Abstract

:
A chronically stable electrode material with a low impedance for recording neural activity, and a high charge-injection capacity for functional electro-stimulation is desirable for the fabrication of implantable microelectrode arrays that aim to restore impaired or lost neurological functions in humans. For this purpose, we have investigated the electrochemical properties of sputtered ruthenium oxide (RuOx) electrode coatings deposited on planar microelectrode arrays, using an inorganic model of interstitial fluid (model-ISF) at 37 °C as the electrolyte. Through a combination of cyclic voltammetry (CV) and an electrochemical impedance spectroscopy (EIS) modelling study, we have established the contribution of the faradaic reaction as the major charge-injection contributor within the safe neural stimulation potential window of ±0.6 V vs. Ag|AgCl. We have also established the reversibility of the charge-injection process for sputtered RuOx film, by applying constant charge-per-phase current stimulations at different pulse widths, and by comparing the magnitudes of the leading and trailing access voltages during voltage transient measurements. Finally, the impedance of the sputtered RuOx film was found to be reasonably comparable in both its oxidized and reduced states, although the electronic contribution from the capacitive double-layer was found to be slightly higher for the completely oxidized film around 0.6 V than for its reduced counterpart around −0.6 V.

1. Introduction

Electrode coatings are an integral part of implantable microelectrode arrays (MEAs) that are intended to restore lost or impaired physiological functionality in humans. Clinical applications that use MEAs include the use of brain–machine interfaces (BMIs) that allow for the volitional control of robotic assistive prosthetics, restoration of vision, and sensory feedback for amputees [1,2,3,4,5]. Electrode coatings are deposited on the exposed electrode sites of the MEAs during the fabrication process and, when implanted into the patient, allow bi-directional communication between the device and the nervous system. Low-impedance electrodes allow the recording of single units with high signal-to-noise ratios (SNRs) [6], and a high charge-injection capacity allows for electrical stimulations for functional responses with high current levels, without exceeding the potential-harm limits [6,7]. However, MEAs are known to decline in stimulation and recording performance overtime, due to a number of failure mechanisms, thereby making it challenging to establish the chronic neural interface [8].
Although noble metal electrodes are useful in recording neural activity, including resolving single-action potentials (single units), the charge-injection levels for functional electrical stimulation are well beyond their capacity [9,10]. It is therefore necessary to investigate electrode materials with a low impedance that allow the injection of the appropriate levels of charge to evoke functional responses, without undergoing corrosion or reacting with the tissue to produce toxic by-products at the electrode–tissue interface. Additionally, these high-charge-capacity electrodes must be chronically stable in the physiological environment.
The materials that have been investigated as electrode coatings in MEAs include platinum (Pt), platinum/iridium (Pt/Ir), titanium nitride (TiN), and conducting polymers, such as PEDOT:PSS and iridium oxide [10,11,12,13]. The performance of these electrode materials for neural stimulation has been detailed in several comprehensive reviews [6,7]. Here, we report on ruthenium oxide (RuOx) as a possible electrode coating candidate for neural stimulation and recording. Ruthenium oxide is a multivalent oxide, with multiple reduction–oxidation (redox) states that are accessible over a potential range that avoids the electrolysis of water [14,15]. These redox states provide a mechanism for charge storage within the three-dimensional structure of the ruthenium oxide film, and provide facile changes in the oxidation state that result in a large charge-storage capacity, low impedance for neural recording, and a high-rate of charge injection for electro-stimulation. Previously, we reported on the microstructure, charge-storage, and charge-delivery properties of sputtered RuOx films, with respect to the changes in reactive gas ratios (O2:H2O) during DC magnetron sputtering [16,17]. The charge-injection characteristics, resistance to oxygen reduction, and long-term pulsing stability in buffered saline solution for this sputtered RuOx film were also established in previous studies [17,18]. In this study, we have further investigated the electrochemical properties, particularly the charge-delivery mechanism, the contribution of different circuit components, the reversibility of charge injection, and the impedance states during the electrochemical stimulation of the RuOx film, sputtered using the previously identified optimal oxygen-to-water-vapor ratio of 1:3, in the reactive plasma, using an inorganic model of interstitial fluid (model-ISF) at 37 °C.
The RuOx film was sputter-deposited on exposed the gold sites of a planar microelectrode array, resulting in circular electrodes of 50 μm diameter, which amounted to a geometric surface area of ~1960 μm2. To understand the charge-injection mechanism, the electrochemical properties of these planar electrodes were studied in the model-ISF at 37 °C, using electrochemical techniques such as cyclic voltammetry (CV), electrochemical impedance spectroscopy (EIS), and voltage transient measurements. The impedance modelling study was performed using the Randles circuit model [19], to understand the contributions of the different circuit components during charge injection. The circuit components allowed us to probe into the different contributors to the charge injection. We found that the faradaic component was the major contributor to the electrochemical charge injection into the model-ISF at 37 °C. The capacitive component was also found to be a secondary contributor to the charge injection, therefore making the sputtered RuOx a mixed conductor [6]. The sputtered RuOx film conduction, associated with the electronic contribution from the capacitive double layer, was found to be slightly higher for the oxidized state at 0.6 V, in comparison to the reduced state at −0.6 V, although the impedance trend across these voltages at 1 Hz, 1 kHz, and 100 kHz frequencies was found to be constant.
For continuous and chronic neural stimulation, it is important that the reactions occurring during charge injection must be reversible. Irreversible reactions can cause damage to the electrode coating, exposing the electrode sites, which in turn might cause unwanted tissue damage during stimulation. Through analytical studies of the sputtered RuOx coating using voltage transient measurements, we have established the reversibility of the faradaic reaction that contributes toward the charge injection. In a previous study, we had already established the capability of this electrode coating to undergo constant current stimulation for up to 1 billion cycles, in a model-ISF at 37 °C [18]. Therefore, by using the best practice stimulation waveforms [6], we can safely inject charge into the tissue via the sputtered RuOx electrode, thus enabling continuous and chronic functional neural stimulation.

2. Materials and Methods

2.1. Planar Microelectrode Fabrication

The planar microelectrode arrays were fabricated on 100 mm diameter single crystal silicon wafers, following the microfabrication procedure described previously [16,20]. Briefly, 2 µm amorphous silicon carbide (a-SiC) was deposited on the wafer via plasma-enhanced chemical vapor deposition (PECVD). Using lift-off photolithography, gold (Au) metal traces were sputter-deposited, using Ar plasma, in an AJA ATC 2200 (AJA Internationals, Scituate MA) DC magnetron sputtering system. A second 2 µm a-SiC layer was deposited on top of the Au layer, in effect making a 200 nm patterned Au trace sandwiched between 4 µm a-SiC. The bond pads and 50 µm diameter electrode sites were created via the reactive ion etching of the a-SiC, using SF6/O2 plasma. Finally, using lift-off photolithography, the sputtered ruthenium oxide film, with a 1:3 O2:H2O ratio in the reactive plasma, was deposited on the electrode sites. The details of the ruthenium oxide deposition process have been described previously [16]. Based on another previous study [17], a 300 nm RuOx film thickness was sputtered. Figure 1a shows an optical image of the circular fabricated electrode sites. Figure 1b shows a scanning electron microscopic (SEM) image of a single circular electrode site, coated with the sputtered RuOx film.

2.2. Electrolyte Preparation

All electrochemical measurements were performed in either phosphate-buffered saline (PBS) at room temperature (~20 °C), or in an inorganic model of the interstitial fluid (model-ISF) at 37 °C, which resembled the physiological environment more closely than PBS [21]. The pH and the conductivity of these electrolytes were measured using a Thermo Scientific Orion pH-meter, and a Fischer Scientific Traceable Bench Conductivity Meter, respectively. The PBS solution comprised 126 mM NaCl, 22 mM NaH2PO4·7H2O, and 81 mM Na2HPO4·H2O, with a pH of 7.2, and an ionic conductivity of 25 mS cm−1. The model-ISF comprised 110 mM NaCl, 28 mM NaHCO3, 7.5 mM KHCO3, 2 mM Na2HPO4·7H2O, and 0.5 mM each of NaH2PO4·H2O, MgSO4, MgCl2, and CaCl2. The pH was maintained at a near-physiological level of 7.4, by purging mixed gas consisting of 5% CO2, 6% O2, and 89% N2 for at least 30 min. Thereafter, the gas mixture was left to flow continuously over the surface of the solution during the electrochemical measurements. The ionic conductivity of the model-ISF was 15 mS cm−1, and a laboratory oven was used to conduct measurements for this electrolyte, in order to maintain the near-physiological temperature of 37 °C.

2.3. Cyclic Voltammetry

A three-electrode configuration, consisting of a Ag|AgCl reference electrode, a large surface area Pt wire counter electrode, and a sputtered RuOx working electrode, was used for all the electrochemical measurements. The cyclic voltammetry (CV) measurements were performed using a Gamry Reference 600+ potentiostat, using vendor-provided data acquisition software. For CV measurements, the potential was modulated with triangular waveform, at sweep rates of 50 mV s−1. Potential limits of −0.9/0.9 V, −0.8/0.8 V, −0.7/0.7 V, and −0.6/0.6 V vs. Ag|AgCl were implemented to carry out the CVs, to establish the water electrolysis window for safe stimulation.

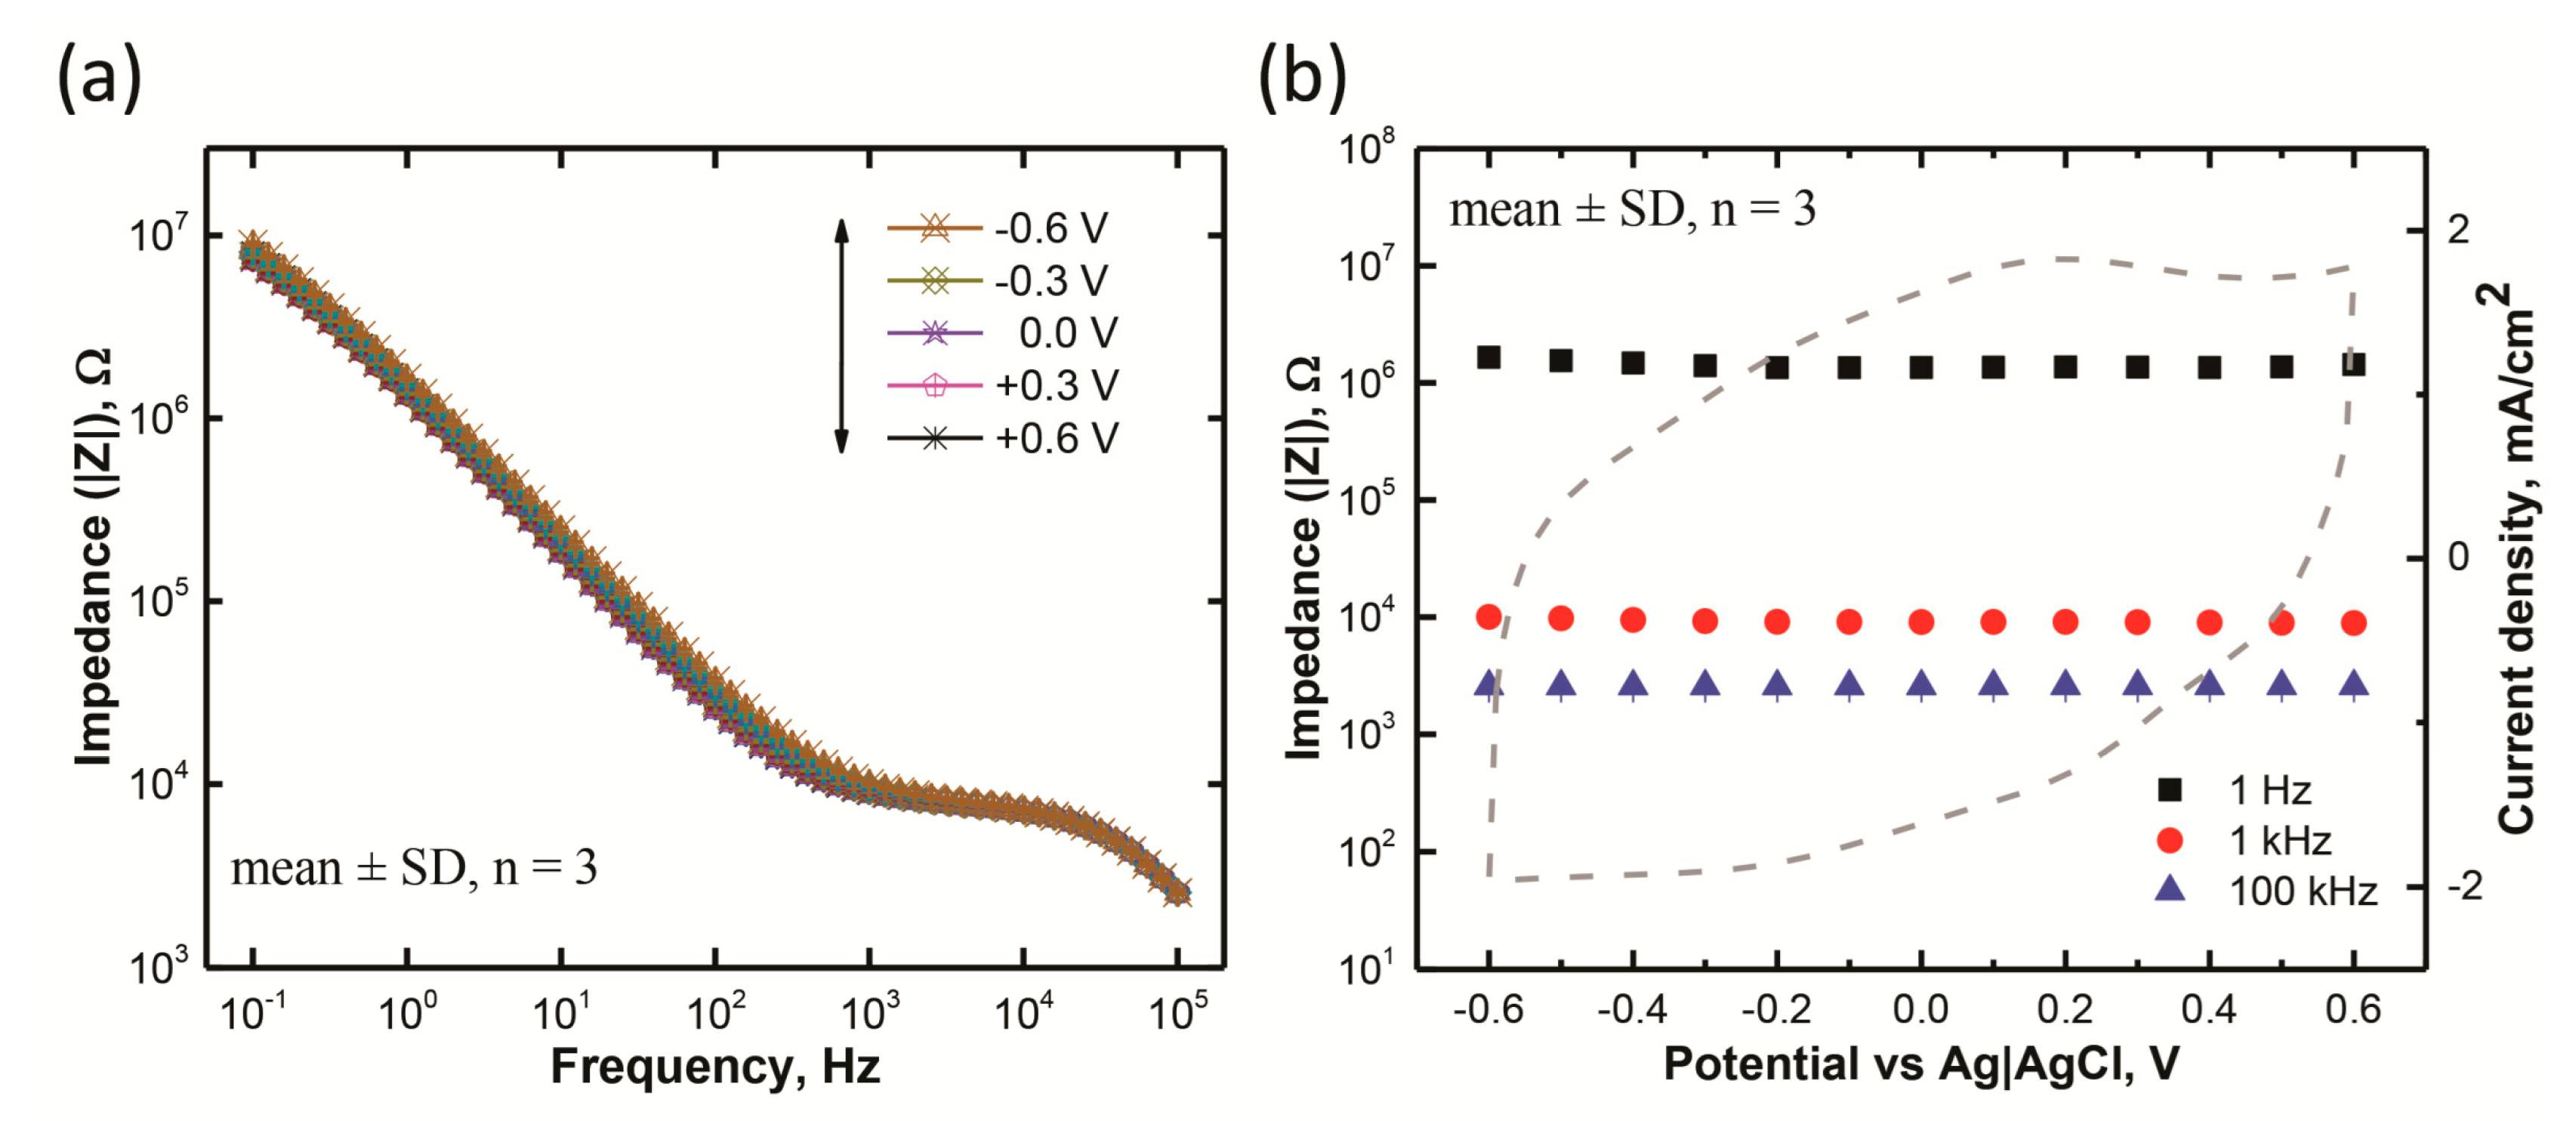
2.4. Electrochemical Impedance Spectroscopy

Similar to the CVs, the electrochemical impedance spectroscopy (EIS) was also measured using a three-electrode configuration with a Gamry Reference 600+ potentiostat. The EIS measurements were obtained using a 10 mV root-mean-square (rms) AC sinusoidal excitation voltage, over a frequency range of 0.1 to 105 Hz. The EIS was measured about the open circuit potential (Eoc), and over an applied DC voltage bias range from −0.6 V to 0.6 V vs. the Ag|AgCl reference electrode, at 0.1 V increments. A time delay of 30 min was allowed between each EIS measurement, to let the RuOx electrode reach the equilibrium open circuit potential. A similar experiment was described previously, to understand the effect of potential on the electrode conductivity in electrochemically deposited iridium oxide (EIROF) electrodes [22].

2.5. Voltage Transient Measurements

The voltage transients in response to current pulsing were measured using a Sigenics stimulator (Sigenics, Chicago, IL, USA), as described previously [20]. The stimulator uses a three-electrode configuration, and provides rectangular cathodal current pulses, with an adjustable pulse width from 100 µs to 1000 µs. The charge-balance is achieved by actively controlling the interpulse potential of the electrode to a pre-determined interpulse bias level, usually 0.6 V vs. Ag|AgCl for ruthenium oxide and iridium oxide electrodes [16,20]. There is also an adjustable interphase period of 0.0–1.0 ms between the end of the cathodal current pulse and the beginning of the anodic recharge phase, in which the electrode is electrically floating under open-circuit conditions, with no applied current. The potential of the electrode in the zero-current interphase period is used as an estimate of the maximum negative electrode potential in response to current pulsing, as overpotentials are minimized in the absence of an impressed current.
An example voltage transient in response to the cathodal current pulsing of a RuOx electrode using ~250 µA, 200 µs pulses is shown in Figure 2. VAL represents the access voltage at the leading edge of the current pulse, and is measured as the abrupt change in electrode voltage at the initiation of the current pulse. Ep represents the polarization across the electrode–electrolyte interface and, together with VAL, defines the electrode-driving voltage (Vdrv = VAL + Ep). VAT represents the trailing phase of the access voltage, and is calculated as the difference between the cathodal electrode potential (Ec) and the maximum negative voltage (Vmin), which is observed at the end of the current pulse. Ec is measured in the interphase period, 12 µs after the end of the cathodal pulse, when the current has decayed to zero (i = 0, iR = 0), so that the measured potential no longer includes a contribution from an ohmic voltage drop in the electrolyte. We define the maximum charge-injection capacity of the electrode to be the charge, at the pulsewidth at which the measurement is made, that polarizes the electrode to an Ec of −0.6 V vs. Ag|AgCl. This maximum potential excursion (Emc) corresponds to a potential that is slightly positive of the water reduction potential on RuOx, estimated from 50 mV s−1 CVs, and is the same Emc typically employed in evaluating iridium oxide- and platinum-based stimulation electrodes [6,9]. Eip is the potential at the end of the zero-current interphase period, just before the beginning of the anodic recharge current.

2.6. Statistical Analysis

The datasets were tested for normality using the Shapiro–Wilk method, with the level of significance α = 0.05. All the normally distributed datasets, measured from electrodes of the same array, were reported as mean ± standard deviation (SD).

3. Results

3.1. Cyclic Voltammetry

In Figure 3a, we observe a very high current onset at both the positive and negative ends of a cyclic voltammogram for a −0.9/0.9 V potential range vs. Ag|AgCl, compared to a −0.8/0.8 V potential range CV in the model-ISF at 37 °C. Such a large current onset associated with charge-injection electrodes is attributed to the water electrolysis reaction, wherein water is reduced at the negative end, and oxidized at the positive end [6]. Therefore, the potential limits for the water electrolysis of RuOx were set based on the observed onset of large reduction and oxidation currents, respectively, at −0.8 V and 0.8 V in the model-ISF at 37 °C, as shown in Figure 3b. Although a −0.7 V to +0.7 V (Ag|AgCl) potential range (Figure 3b) seemed to be within the water electrolysis window, a potential range of −0.6 V to 0.6 V was chosen as the potential limit for safe stimulation. Therefore, most of the analysis is based on CVs with a −0.6 V to 0.6 V scan range.

3.2. Electrochemical Impedance Characteristics

The EIS in the model-ISF at 37 °C was measured as a function of the DC bias voltages from 0.6 to −0.6 V vs. Ag|AgCl, with an increment of 0.1 V, to understand the effect of the potential on the conductivity of the sputtered ruthenium oxide electrodes. A time delay of 30 min was allotted between each EIS measurement, to allow the RuOx electrode to reach equilibrium open circuit potential. Figure 4a shows the Bode plot for the EIS measurements of RuOx electrodes (mean ± SD, n = 3) as a function of bias. The impedance plots measured at all the applied bias values were found to be on top of each other, along the entire frequency range. The impedance values at 1 Hz, 1 kHz, and 100 kHz (mean ± SD, n = 3) was also plotted, in association with the cyclic voltammogram on a common voltage axis (x-axis) in Figure 4b. A similar absence of bias dependence across this frequency range was also observed for sputtered iridium oxide, but not for activated or electrodeposited iridium oxide [22,23,24,25]. The bias dependence of activated and electrodeposited iridium oxide has been attributed to the low density of these oxides, combined with a notable decrease in the electronic conductivity when the oxide is in the Ir3+ redox state [25]. Similarly, it appears that the density of sputtered RuOx was sufficient to maintain an adequately low impedance in the reduced films to support charge injection, as evidenced by the substantial cathodal currents observed in the CV response of the RuOx at negative potentials.
No observable changes in these values were found to be associated with the change in potential for all three chosen frequencies. Therefore, the sputtered ruthenium oxide film is almost equally impeding in both its oxidized and reduced states, allowing reversibility during charge-injection.

3.3. Impedance Modelling Study

A Randles circuit model [19] was used to calculate the circuit elements from the electrochemical impedance spectroscopy of sputtered RuOx electrodes. A similar model was used previously to characterize electrodes for biomedical implants that used sputtered iridium oxide films [26,27]. The model consists of contributions from the electrolyte resistance (Rs), a capacitive double-layer between the film and ions in the electrolyte (Cdl), resistance due to the faradaic charge-transfer reaction in the ruthenium oxide (Rf), and a constant phase element (CPE), defined by the CPE impedance as follows:
Z C P E = 1 Y o j ω a ,
where Yo is the CPE admittance at a frequency of 1 rad/s in units of S s−a, j is the imaginary number, ω is the frequency in rad/s, and “a” is a value between 0 and 1, describing the characteristics between resistive and capacitive behavior, respectively [26,28]. Gamry Echem Analyst software (Gamry Instruments, Inc., Warminster, PA, USA) was used for the impedance modelling analysis. The fit employed Nelder and Mead’s simplex algorithm [29], allowing up to 300 iterations. The objective function (χ2) was used to define the goodness of the fit [30], such that a lower value of χ2 implied a better fit. However, this model cannot account of the fitting of high-frequency and low-frequency measurements, as previously predicted for iridium oxide electrodes [31].
We performed fitting on the EIS of sputtered RuOx films obtained in the PBS, as well as the model-ISF at 37 °C, over a frequency range of 0.1–105 Hz. The Bode plots for the measured EIS and the fitted results are shown in Figure 5a,b. The χ2 values obtained were 0.0032 and 0.0078, respectively, for the PBS and model-ISF. However, lowering the frequency range to 10–104 Hz shows a better fit, as shown in the Bode plots in Figure 5c,d. The value obtained for this fit was 0.0008 for both the PBS and model-ISF at 37 °C and, therefore, a better goodness of fit was obtained for the 10–104 Hz frequency range. When measuring the EIS of electrode coatings at low frequency, artifacts and noise from connecting wires start contributing toward the EIS measurement [32]. Therefore, by eliminating low frequency impedance from 0.1 to 10 Hz, we minimized the components from the connecting wire, and achieved a better model fitting for our electrode coating. The circuit parameters were obtained for the sputtered RuOx electrodes in the PBS and model-ISF from this frequency range, and have been tabulated in Table 1.

3.4. Contribution of Circuit Components in Charge Injection

The EIS data were obtained (Figure 4) by applying bias from −0.6 to 0.6 V were fitted using a Randles circuit (only within 10 to 104 Hz), and the percentage change in the circuit parameters from equilibrium value at the open circuit potential is plotted in Figure 6. Figure 6 shows the percentage charge in the circuit components of the EIS obtained at different bias levels vs. Ag|AgCl with respect to the EIS vs. the open circuit potential, obtained by fitting the Randles circuit model (shown in the inset of Figure 6) to the measured EIS in the model-ISF at 37 °C. An approximate 5% increase in the component associated with double-layer capacitance, Cdl, was obtained at 0.6 V potential. However, a decrease of ~5% in the Cdl was observed at the −0.6 V potential. This is indicative of a higher electronic contribution toward double-layer capacitance associated with the completely oxidized state of the film at 0.6 V. In contrast, the completely reduced film at −0.6 V showed lower electronic conduction, and therefore a lower contribution toward Cdl.
The CPE admittance, Yo, showed an average (n = 3) increase of ~10% for the potential range from −0.4–0.4 V, and fell off to the equilibrium value at both the positive and negative end of the CV. The initiation of the increase in the Yo value was observed from 0.5 V at the oxidation end, and the increased value was observed until −0.5 V at the reduction end. This is attributed to the initiation of the faradaic redox process at these potentials, also indicated by the redox peaks observed in the CV (plotted with the right y-axis on Figure 6). Between these potentials, the film was in a redox transient state and, therefore, the Yo, which is associated with redox reaction rates, showed higher values, and also aligned with the redox peaks of the CV. The Yo value fell off to the equilibrium value, indicating the endpoint of the redox processes at both the positive and negative ends of the CV, where the film was in a completely oxidized state, and completely reduced state, respectively. We also observed that at 0 V vs. the Ag|AgCl, or at the open circuit potential value (vs Ag|AgCl) for RuOx film (~0.2 V), the percentage change in the Yo value did not fall off to zero, which was expected. This is most likely due to the time required to reach the equilibrium after biasing at higher potentials being more than the 30 min used as a delay for each EIS measurement. So, this observation is associated with the transient redox state of the film, rather than its equilibrium state. Minimal changes in both the Rf and “a” values of the circuit component were observed. The minimal change in the Rf value, observed at all the bias levels, indicates a reversible redox process contributing to the charge-injection, and that the ionic pathways are not impeded at these potential ranges (−0.6–0.6 V).

3.5. Charge-Injection Reversibility

The charge-injection capacity is dependent on the current density and, therefore, to understand the limitations of RuOx films during charge-injection, we measured the voltage transient at the relevant current densities. The voltage transient response of a sputtered RuOx electrode at an interpulse bias of 0.6 V vs. Ag|AgCl in response to a current pulse of 36 nC phase−1 or 1.8 mC cm−2, at six different pulse widths from 0.1 to 0.5 ms, is plotted in Figure 7. The current waveform at 50 Hz consisted of a cathodal current pulse followed by a zero-current interphase period of 0.7 ms, before the anodic recharge phase set in, to reestablish the interpulse bias. To keep the charge-per-phase constant at 36 nC phase−1, we applied current densities from 3.67 A cm−2 to 18.34 A cm−2, for 0.5 ms to 0.1 ms cathodal pulse durations, respectively. The Ec was found to vary from −0.16 V at 3.67 A cm−2 to −0.44 V at 18.34 A cm−2, corresponding to a larger activation potential for higher current density. The Eip values for the different pulse durations were also found to be very close to each other (~0.02 V), implying the reversibility of the charge-injection process, especially at higher current densities. We also observed that the electrode potential during the zero-current interphase period recovered rapidly from Ec to Eip, indicating the fast equilibration of the reduced RuOx film during charge injection.
The voltage transient response as a function of the current pulse amplitude, using 0.6 V interpulse bias, was examined, to understand the change in film properties during stimulation using a cathodal pulse at 0.2 ms pulse duration. Such voltage transients for a sputtered RuOx electrode are plotted in Figure 8a. The electrode cathodal potential (Ec) shifted negative, and the driving voltage (Vdrv) increased with the increasing current amplitude. We also observed minimum inflection in the polarization for all the current amplitudes. The magnitudes of the leading (VAL) and trailing (VAT) access voltages were also similar up to the point when the electrodes were polarized to an Emc of −0.6 V (Ag|AgCl). This effect is further shown in detail in Figure 8b, where the access voltages are plotted as a function of Ec, with a representative CV from the sputtered RuOx electrode (mean ± SD, n = 5) plotted on the same potential axis (0.6 V to −0.6 V). The values of the VAL and VAT were found to be very close to each other, going from 0.6 V to −0.6 V, which is different from activated iridium oxide film (AIROF) or electrodeposited iridium oxide film (EIROF) electrodes, and similar to sputtered iridium oxide films (SIROF) [6,22]. The implication is that the admittance of sputtered RuOx film is comparable in both its oxidized and reduced state, and this is consistent with the previous assessment, in the study of impedance that applied DC bias against the reference electrode.

4. Discussion

We have investigated the electrochemical properties of sputtered RuOx electrode coatings, relevant to their use as neural stimulation and recording electrodes. Several electrode coatings have been studied previously, and published in comprehensive reviews, [6,33] including noble metals, metal oxides, carbons, and polymers [33]. However, due to its high charge capacity and long-term stability, iridium oxide (IrOx) has been the material of choice for FDA approved devices [34,35]. The similarity in the electrochemical charge-injection mechanism and the long-term stimulation stability of RuOx in comparison to IrOx [20] makes this film an appealing alternative electrode coating for neural stimulation and recording electrodes. The study was conducted with a model-ISF at 37 °C as the electrolyte, and with a −0.6/0.6 V potential window as the safe stimulation limit. The EIS study and analysis in Figure 4b, at three different frequencies, show no change in the |Z| values within the stimulation safe limits. This indicates that the sputtered ruthenium oxide film is almost equally impeding in both its oxidized and reduced states, allowing reversibility during charge-injection. This observation is also consistent with the voltage transient measurement analysis study shown in Figure 8. No observable difference between the leading and trailing access voltages (VAL and VAT, respectively) during charge injection stimulation with safe stimulation limits were found, as shown in Figure 8b. Therefore, it is clear that the impedance states of this electrode coating do not change between the safe charge injection potential limits. However, sputtered RuOx is a pseudo-capacitive electrode and, therefore, it is difficult to isolate the effect of only the Ru4+/Ru3+ reversible faradaic charge-injection mechanism. So, we cannot state with certainty that the impedance of the oxide in the Ru4+ and Ru3+ valence states is equal. For this reason, the EIS modeling study of the RuOx electrode coating was performed in terms of a suitable circuit model, because it would shed some light on the impedance state of the two oxidation states of Ru, as well as the charge-injection mechanism.
The Randles circuit EIS model was fitted to the 10–104 Hz impedance measurement in the PBS and in the model-ISF at 37 °C, as shown in Figure 5c,d. High frequency impedance is mostly dominated by solution resistance, and low frequency receives contributions from artifacts and noise from the connecting wires [6,32]. Although the bode plot for the EIS seems to be matched with the model in Figure 5a,c, the phase angle in Figure 5b does not fit with the model, specifically at a low frequency. Figure 5d shows that the EIS model fits better, in comparison to Figure 5b. The χ2 value is representative of the EIS model compared to the experimental data, and a lower χ2 value represents a better fit, in order to characterize the circuit components of the electrode coating by eliminating electrolyte resistance at higher frequencies, and artifacts and noise from the connecting wires contributing at lower frequencies. The Randles circuit EIS modelling on the sputtered RuOx coatings, and the analysis of the different circuit elements within the safe limits of electrochemical charge injection, give us a preliminary understanding of the charge-injection mechanism. From Figure 6, we observe that the faradaic impedance (Rf) does not change, and the CPE admittance (Yo) has an increased value with the −0.5/0.5 V window. The Yo being inversely related to ZCPE is indicative of the admittance state of the RuOx film contributed from only the faradaic charge transfer. Therefore, it is clear that the major contributor to the charge injection is the faradaic contribution, or the ionic contribution, where Ru4+/Ru3+ transition occurs with the participation of a counter-ion from the electrolyte. Additionally, we observed that there was a positive percentage change in the Cdl component from −0.3 to 0.6 V, which is indicative of a higher charge contribution toward the double-layer capacitance associated with the oxidized state of the film, which is the Ru4+, as indicated by a previous XPS analysis [16]. Further, the ~5% increase in the Cdl at 0.6 V, and a ~5% decrease in Cdl at −0.6 V, with respect to the equilibrium state, indicate a higher electronic conduction toward the double-layer capacitance associated with the completely oxidized state of the film (Ru4+) at 0.6 V, in contrast to the lower electronic conduction of the completely reduced state of the film (Ru3+) at −0.6 V. The decrease in the double-layer capacitance indicates the lower conductivity of Ru(III) oxide in comparison to Ru(IV) oxide and, as a result, the Ru(III) oxide film will produce a poor charge-injection capacity for stimulation, as well as a higher impedance, degrading the neural recording. Therefore, during stimulation, we must employ a charge-balanced waveform or, at the end of a monophasic cathodal stimulation pulse, must push the electrode, electrostatically or otherwise, to its open circuit potential, to avoid the complete reduction of the RuOx film. Further, it is clear from this study that the sputtered RuOx is a mixed conductor, where contribution from both electrons and ions partake in the charge-transfer mechanism. This is consistent with previous studies [36], and is also similar to an iridium oxide film that is currently used in neural stimulation and recording [6].
We have also studied the reversibility of the charge-injection mechanism for the sputtered RuOx film. To perform safe neural stimulation, as well as record neural single units with good SNR chronically and consistently, the reversibility of the film state after an applied charge injection waveform is crucial. Our study indicates that, during stimulation, the electrode potential during the zero-current interphase period recovered rapidly from Ec to Eip (Figure 7), indicating the fast equilibration of the reduced RuOx film during charge injection. This observation is similar to that of an activated iridium oxide film (AIROF) reported previously [6], and is attributed to the rapid internal equilibration of the non-uniformly reduced RuOx film, to reach a uniform potential (Eip) throughout the film. This non-uniform reduction is due to a non-uniform current distribution, leading to a larger potential at the edges of the electrodes, which is a known limitation of voltage transient measurements [6]. There is also non-uniform potential distribution though the thickness of the porous three-dimensional structure of RuOx, which is very similar to sputtered or activated iridium oxide films [6,16,20]. Additionally, the diffusion-controlled dissipation of the counter-ion concentration gradient within the porous film, and the adjacent electrolyte reestablishes the counter-ion concentration levels to those of the pre-pulse condition. An associated change in the electrode potential occurs. This also contributes to the rapid potential shift in the interphase period [6].
From previous studies on sputtered RuOx film, we found that the counter-ion contribution comes from the H+ ion in the electrolyte [16,17]. Consistent with our results and analysis, we propose a charge-injection model associated with the sputtered RuOx film, as shown in Figure 9, consistent with a previous model studied from iridium oxide films [6]. Charge is injected into tissue from valence changes in multivalent (+4/+3) RuOx electrode coatings that undergo reversible reduction–oxidation (redox) reactions [6]. The Equation (2) shows the reversible redox reaction associated with the ionic contribution indicated in this charge-injection model.
RuOx(OH)y + δH+ + δe ↔ RuOn−δ (OH)n+δ
The sputtered RuOx is, therefore, a mixed conductor, exhibiting both electron and ion transport within the bulk of the coating, similar to an iridium oxide film [6]. The three-dimensional structure of the coating provides more charge for stimulation, but access to this charge is limited by the rate of electron and ion transport within the coating [6]. Although the effect of the sputtered RuOx film thickness on the charge-injection capacity has been published previously [17], the effect of the thickness toward the contribution of different circuit components on charge-injection has not been studied, and may make for an interesting future work. However, the charge-injection reversibility and impedance state of this coating were found to not be affected by the film thickness.
Previous studies of the sputtered RuOx film, deposited using an apparent optimal condition of O2:H2O-vapor = 1:3 in the reactive plasma Ref. [16], show that this film is capable of recording a neuronal single-unit in the rat motor cortex [37]. The long-term stimulation capability of this film has also been studied in PBS, as well as in a model-ISF at 37 °C, and the sputtered RuOx film was found to be stable for up to 1 billion cycles of biphasic stimulation, at 8 nC per phase [17,18]. The present study of the electrochemical charge injection mechanism of the sputtered ruthenium oxide electrode coating indicates that this film can deliver charge reversibly into the tissue, and is capable of chronic neural stimulation and recording. Although this study is consistent with the previous literature, and corroborates well within the scope of our experiments and analysis, we would like to point out that our model is a simplistic one, and must not be extended to animal models, where electrolyte inhomogeneity exists. An in-depth electrochemical modelling study of these and similar electrode coatings is currently underway. Additionally, a chronic in vivo study using these electrode coatings is also currently underway, and will pave the way for the use of these electrode coatings in FDA-approved neural implants.

5. Conclusions

The electrochemical properties of the sputtered ruthenium oxide film as an electrode coating for neural stimulation and recording are presented in this work. The sputtered RuOx film was found to be almost equally impeding in its oxidized and reduced state, at 0.6 V and −0.6 V, respectively, indicating the ease of stimulation using either cathodal or anodal currents for monophasic current stimulation protocols. The oxidized film shows a comparatively higher contribution from the double-layer capacitance than its reduced state does. The faradaic redox process is dominant in the −0.5 to 0.5 V potential range vs. Ag|AgCl, primarily contributing toward charge-injection. The fast reversibility in the oxidation states of the sputtered RuOx film during stimulation ensures no irreversible side -reactions during stimulation. The reversible charge-injection mechanism allows for safe neural stimulation, without producing any toxic side-products or tissue damage, as well as chronic neural recording capability. Previously, we have also established that this film does not contain extractable cytotoxic constituents and is, therefore, deemed non-cytotoxic in accordance with ISO protocol 10993-5 [37]. Additionally, RuOx films sputtered from ruthenium targets are cost-effective alternatives to SIROFs sputtered from iridium targets, as ruthenium is one of the least expensive platinum group metals, having typically less than 10% of the cost of iridium metal [38].

Funding

This research was funded by the grant NIH 5R01NS104344-02 to Stuart F. Cogan.

Institutional Review Board Statement

Not applicable.

Informed Consent Statement

Not applicable.

Data Availability Statement

Not applicable.

Acknowledgments

The author would like to express sincere thanks to Stuart F. Cogan, of Bioengineering at the University of Texas at Dallas for providing funding, resources, and valuable input to this work. The author would also like to thank Alexandra Joshi-Imre, Process Engineer at the Cleanroom Research Laboratory at the University of Texas at Dallas, for helping with the SEM imaging. The author would like to acknowledge the University of Texas at Dallas Natural Sciences and Engineering Research Laboratory Cleanroom staff for their support in the maintenance of all the equipment used in the device fabrication.

Conflicts of Interest

The author declares no conflict of interest.

References

  1. Flesher, S.N.; Collinger, J.L.; Foldes, S.T.; Weiss, J.M.; Downey, J.E.; Tyler-Kabara, E.C.; Bensmaia, S.J.; Schwartz, A.B.; Boninger, M.L.; Gaunt, R.A. Intracortical microstimulation of human somatosensory cortex. Sci. Transl. Med. 2016, 8, 361ra141. [Google Scholar] [CrossRef]
  2. Dhillon, G.S.; Horch, K.W. Direct neural sensory feedback and control of a prosthetic arm. IEEE Trans. Neural Syst. Rehabil. Eng. 2005, 13, 468–472. [Google Scholar] [CrossRef]
  3. Tomlinson, T.; Miller, L.E. Toward a proprioceptive neural interface that mimics natural cortical activity. Prog. Mot. Control Theor. Transl. 2016, 957, 367–388. [Google Scholar] [CrossRef] [Green Version]
  4. Humayun, M.S.; Weiland, J.D.; Fujii, G.Y.; Greenberg, R.; Williamson, R.; Little, J.; Mech, B.; Cimmarusti, V.; Van Boemel, G.; Dagnelie, G.; et al. Visual perception in a blind subject with a chronic microelectronic retinal prosthesis. Vis. Res. 2003, 43, 2573–2581. [Google Scholar] [CrossRef] [Green Version]
  5. Bradley, D.C.; Troyk, P.R.; Berg, J.A.; Bak, M.; Cogan, S.; Erickson, R.; Kufta, C.; Mascaro, M.; McCreery, D.; Schmidt, E.M.; et al. Visuotopic mapping through a multichannel stimulating implant in primate V1. J. Neurophysiol. 2005, 93, 1659–1670. [Google Scholar] [CrossRef] [Green Version]
  6. Cogan, S.F. Neural stimulation and recording electrodes. Annu. Rev. Biomed. Eng. 2008, 10, 275–309. [Google Scholar] [CrossRef] [PubMed] [Green Version]
  7. Merrill, D.R.; Bikson, M.; Jefferys, J.G. Electrical stimulation of excitable tissue: Design of efficacious and safe protocols. J. Neurosci. Methods 2005, 141, 171–198. [Google Scholar] [CrossRef] [PubMed]
  8. Barrese, J.C.; Rao, N.; Paroo, K.; Triebwasser, C.; Vargas-Irwin, C.; Franquemont, L.; Donoghue, J.P. Failure mode analysis of silicon-based intracortical microelectrode arrays in non-human primates. J. Neural Eng. 2013, 10, 066014. [Google Scholar] [CrossRef]
  9. Negi, S.; Bhandari, R.; Rieth, L.; Solzbacher, F. In vitro comparison of sputtered iridium oxide and platinum-coated neural implantable microelectrode arrays. Biomed. Mater. 2010, 5, 015007. [Google Scholar] [CrossRef]
  10. Rose, T.L.; Robblee, L.S. Electrical stimulation with Pt electrodes. VIII. Electrochemically safe charge injection limits with 0.2 ms pulses (neuronal application). IEEE Trans. Biomed. Eng. 1990, 37, 1118–1120. [Google Scholar] [CrossRef]
  11. Weiland, J.D.; Anderson, D.J.; Humayun, M.S. In vitro electrical properties for iridium oxide versus titanium nitride stimulating electrodes. IEEE Trans. Biomed. Eng. 2002, 49, 1574–1579. [Google Scholar] [CrossRef] [PubMed]
  12. Beebe, X.; Rose, T.L. Charge injection limits of activated iridium oxide electrodes with 0.2 ms pulses in bicarbonate buffered saline (neurological stimulation application). IEEE Trans. Biomed. Eng. 1988, 35, 494–495. [Google Scholar] [CrossRef]
  13. Du, Z.J.; Luo, X.; Weaver, C.L.; Cui, X.T. Poly (3, 4-ethylenedioxythiophene)-ionic liquid coating improves neural recording and stimulation functionality of MEAs. J. Mater. Chem. C 2015, 3, 6515–6524. [Google Scholar] [CrossRef] [PubMed] [Green Version]
  14. Chalupczok, S.; Kurzweil, P.; Hartmann, H.; Schell, C. The redox chemistry of ruthenium dioxide: A cyclic voltammetry study—Review and revision. Int. J. Electrochem. 2018, 2018, 1273768. [Google Scholar] [CrossRef] [Green Version]
  15. Hu, C.C.; Chen, W.C.; Chang, K.H. How to achieve maximum utilization of hydrous ruthenium oxide for supercapacitors. J. Electrochem. Soc. 2004, 151, A281. [Google Scholar] [CrossRef]
  16. Chakraborty, B.; Joshi-Imre, A.; Maeng, J.; Cogan, S.F. Sputtered ruthenium oxide coatings for neural stimulation and recording electrodes. J. Biomed. Mater. Res. Part B Appl. Biomater. 2021, 109, 643–653. [Google Scholar] [CrossRef]
  17. Chakraborty, B.; Joshi-Imre, A.; Cogan, S.F. Charge injection characteristics of sputtered ruthenium oxide electrodes for neural stimulation and recording. J. Biomed. Mater. Res. Part B Appl. Biomater. 2022, 110, 229–238. [Google Scholar] [CrossRef]
  18. Chakraborty, B.; Joshi-Imre, A.; Cogan, S.F. Sputtered Ruthenium Oxide Neural Stimulation Electrodes. In Proceedings of the 43rd Annual International Conference of the IEEE Engineering in Medicine & Biology Society (EMBC), Virtual, 1–5 November 2021; pp. 6655–6658. [Google Scholar]
  19. Randles, J.E.B. Kinetics of rapid electrode reactions. Discuss. Faraday Soc. 1947, 1, 11–19. [Google Scholar] [CrossRef]
  20. Maeng, J.; Chakraborty, B.; Geramifard, N.; Kang, T.; Rihani, R.T.; Joshi-Imre, A.; Cogan, S.F. High-charge-capacity sputtered iridium oxide neural stimulation electrodes deposited using water vapor as a reactive plasma constituent. J. Biomed. Mater. Res. Part B: Appl. Biomater. 2020, 108, 880–891. [Google Scholar] [CrossRef]
  21. Cogan, S.F.; Troyk, P.R.; Ehrlich, J.; Gasbarro, C.M.; Plante, T.D. The influence of electrolyte composition on the in vitro charge-injection limits of activated iridium oxide (AIROF) stimulation electrodes. J. Neural Eng. 2007, 4, 79. [Google Scholar] [CrossRef]
  22. Deku, F.; Joshi-Imre, A.; Mertiri, A.; Gardner, T.J.; Cogan, S.F. Electrodeposited iridium oxide on carbon fiber ultramicroelectrodes for neural recording and stimulation. J. Electrochem. Soc. 2018, 165, D375. [Google Scholar] [CrossRef] [Green Version]
  23. Fontes, M.B.A. Electrodes for bio-application: Recording and stimulation. J. Phys. Conf. Ser. 2013, 421, 012019. [Google Scholar] [CrossRef]
  24. Frederick, R.A.; Meliane, I.Y.; Joshi-Imre, A.; Troyk, P.R.; Cogan, S.F. Activated iridium oxide film (AIROF) electrodes for neural tissue stimulation. J. Neural Eng. 2020, 17, 056001. [Google Scholar] [CrossRef]
  25. Pauporté, T.; Durand, R. Impedance spectroscopy study of electrochromism in sputtered iridium oxide films. J. Appl. Electrochem. 2000, 30, 35–41. [Google Scholar] [CrossRef]
  26. Caldwell, R.; Sharma, R.; Takmakov, P.; Street, M.G.; Solzbacher, F.; Tathireddy, P.; Rieth, L. Neural electrode resilience against dielectric damage may be improved by use of highly doped silicon as a conductive material. J. Neurosci. Methods 2018, 293, 210–225. [Google Scholar] [CrossRef] [PubMed]
  27. Franks, W.; Schenker, I.; Schmutz, P.; Hierlemann, A. Impedance characterization and modeling of electrodes for biomedical applications. IEEE Trans. Biomed. Eng. 2005, 52, 1295–1302. [Google Scholar] [CrossRef]
  28. Brug, G.J.; van den Eeden, A.L.; Sluyters-Rehbach, M.; Sluyters, J.H. The analysis of electrode impedances complicated by the presence of a constant phase element. J. Electroanal. Chem. Interfacial Electrochem. 1984, 176, 275–295. [Google Scholar] [CrossRef]
  29. Dellis, J.L.; Carpentier, J.L. Nelder and Mead algorithm in impedance spectra fitting. Solid State Ion. 1993, 62, 119–123. [Google Scholar] [CrossRef]
  30. Sunde, S.; Lervik, I.A.; Tsypkin, M.; Owe, L.E. Impedance analysis of nanostructured iridium oxide electrocatalysts. Electrochim. Acta 2010, 55, 7751–7760. [Google Scholar] [CrossRef]
  31. Weiland, J.D.; Anderson, D.J. Chronic neural stimulation with thin-film, iridium oxide electrodes. IEEE Trans. Biomed. Eng. 2000, 47, 911–918. [Google Scholar] [CrossRef]
  32. Wang, S.; Zhang, J.; Gharbi, O.; Vivier, V.; Gao, M.; Orazem, M.E. Electrochemical impedance spectroscopy. Nat. Rev. Methods Primers 2021, 1, 41. [Google Scholar] [CrossRef]
  33. Zheng, X.S.; Tan, C.; Castagnola, E.; Cui, X.T. Electrode materials for chronic electrical microstimulation. Adv. Healthc. Mater. 2021, 10, 2100119. [Google Scholar] [CrossRef] [PubMed]
  34. Normann, R.A.; Campbell, P.K.; Jones, K.E.; University of Utah. Three-Dimensional Electrode Device. U.S. Patent US5215088A, 1 June 1993. [Google Scholar]
  35. Musk, E. An integrated brain-machine interface platform with thousands of channels. J. Med. Internet Res. 2019, 21, e16194. [Google Scholar] [CrossRef] [PubMed]
  36. McKeown, D.A.; Hagans, P.L.; Carette, L.P.; Russell, A.E.; Swider, K.E.; Rolison, D.R. Structure of hydrous ruthenium oxides: Implications for charge storage. J. Phys. Chem. B 1999, 103, 4825–4832. [Google Scholar] [CrossRef]
  37. Atmaramani, R.; Chakraborty, B.; Rihani, R.T.; Usoro, J.; Hammack, A.; Abbott, J.; Nnoromele, P.; Black, B.J.; Pancrazio, J.J.; Cogan, S.F. Ruthenium oxide based microelectrode arrays for in vitro and in vivo neural recording and stimulation. Acta Biomater. 2020, 101, 565–574. [Google Scholar] [CrossRef]
  38. Available online: https://pmm.umicore.com/en/prices/ (accessed on 10 June 2023).
Figure 1. A fabricated planar microelectrode array with sputtered RuOx electrode sites of 50 μm diameter. (a) Image taken at 20× magnification, using an optical microscope. (b) Image of an electrode site, taken using a scanning electron microscope.
Electrochem 04 00023 g001
Figure 2. A representative voltage transient of a sputtered ruthenium oxide electrode, in response to a rectangular cathodal current pulse.
Electrochem 04 00023 g002
Figure 3. Cyclic voltammograms, at a scan rate of 50 mV s−1, of sputtered RuOx electrodes in a model-ISF at 37 °C. (a) Comparison between the CVs of the same electrode taken at a scan range of −0.9 V to 0.9 V and −0.8 V to 0.8 V, showing the water electrolysis window from the observation of high current onset. (b) Comparison between the CVs at three different scan ranges, −0.8 V to 0.8 V, −0.7 V to 0.7 V, and −0.6 V to 0.6 V.
Electrochem 04 00023 g003
Figure 4. Impedance characteristics of the sputtered RuOx electrode in a model-ISF at 37 °C. (a) Representative impedance curve for a sputtered RuOx electrode as a function of DC bias vs. Ag|AgCl. (b) Impedance magnitude at 1, 103, and 105 Hz against the DC bias plotted (x-axis) in comparison to the CV plotted using the same potential range (x-axis).
Electrochem 04 00023 g004
Figure 5. Electrochemical impedance spectra for the sputtered RuOx electrode fitted to the Randles circuit model. (a) The Bode plot against the frequency range of 0.1–105 Hz in the PBS, model-ISF, and the model fit. (b) The phase angle plotted against the frequency range of 0.1–105 Hz in the PBS, the model-ISF, and the model fit (c) The Bode plot against the frequency range of 10–104 Hz in the PBS, the model-ISF, and the model fit (d) The phase angle plotted against the frequency range of 10–104 Hz in the PBS, the model-ISF, and the model fit.
Electrochem 04 00023 g005
Figure 6. Percentage change in the circuit components calculated from the Randles fit from the measured EIS at different bias levels from −0.6–0.6 V vs. Ag|AgCl, with respect to the circuit components modelled from the EIS, measured with respect to the open circuit potential.
Electrochem 04 00023 g006
Figure 7. A comparison of the voltage transient response of a sputtered ruthenium oxide microelectrode (GSA ~ 1960 µm2) at the 36 nC phase−1, with pulse durations 0.1–0.5 ms.
Electrochem 04 00023 g007
Figure 8. (a) Voltage transient response of a sputtered RuOx microelectrode as it is polarized to different potential excursions (Ec), starting from a 0.6 V bias, to an Emc value of −0.6 V. (b) Comparison of VAL and VAT as a function of Ec (at 50 Hz, 0.6 V bias, and 0.2 ms pulse duration). A CV curve is plotted on the right y-axis for comparison with the same potential range on the x-axis.
Electrochem 04 00023 g008
Figure 9. The three-dimensional faradaic charge injection mechanism of the sputtered RuOx electrode. C+ indicates cation, and A indicates anion.
Electrochem 04 00023 g009
Table 1. Circuit parameters evaluated from the Randles circuit model for the sputtered RuOx electrode. Mean and standard deviation (SD) taken for n = 3.
ElectrolyteRs (kΩ)
Mean ± SD
Rf (kΩ)
Mean ± SD
Cdl (nF)
Mean ± SD
Yo (nS s−a)
Mean ± SD
a
Mean ± SD
PBS2.32 ± 0.121.08 ± 0.146.54 ± 1.05601.70 ± 30.900.85 ± 0.00
model-ISF4.95 ± 0.622.96 ± 0.31 8.86 ± 3.75328.90 ± 33.400.87 ± 0.01
Disclaimer/Publisher’s Note: The statements, opinions and data contained in all publications are solely those of the individual author(s) and contributor(s) and not of MDPI and/or the editor(s). MDPI and/or the editor(s) disclaim responsibility for any injury to people or property resulting from any ideas, methods, instructions or products referred to in the content.

