1. Introduction
The measurement of complex bioimpedance (BioZ) is a low-cost, non-invasive method for measuring the properties of biological tissues. An active area of research, the applications of bioimpedance measurements are numerous, from body composition [
1,
2], assessing the hydration status of athletes [
3,
4] and dialysis patients [
5,
6], to monitoring the volume of blood pumped with each heartbeat in heart failure patients [
7,
8]. Bioimpedance refers to measuring the properties of tissue by injecting a sinusoidal current at some frequency into the tissue and measuring the voltage difference between two points on the body. In a four-electrode or tetrapolar configuration, the current is injected through one electrode (the current source) and passes through the tissue to another electrode (the current sink). Between these two current electrodes, two voltage sense (differential) electrodes are placed. The positive voltage electrode is typically placed near the current source, while the negative voltage electrode is typically placed near the current sink. A typical example is a body composition measurement with a device such as the Impedimed SFB7 [
9], with four segments acting as a current source, sink, and differential input. In a bipolar configuration, the current source and positive voltage sense are connected to the same electrode, while the current sink and negative voltage sense are connected to the other electrode. While the bipolar configuration is simpler, it has the disadvantage of including the electrode–tissue interface impedance in series with the tissue under study. Further complicating matters, the electrode–skin interface impedance changes with frequency. For this reason, the tetrapolar configuration is often used for more accurate measurements, though mismatches in the electrode-skin impedance can still cause errors [
10]. Depending on the application, these electrodes may be placed in any number of locations across the body.
In this paper, measurement configurations and frequencies suitable for real-time wearable BioZ monitoring are evaluated. Typical applications with smart clothes and smartwatches motivated our focus on chest measurements for a direct measurement of heart/lungs, as well as forearm and wrist (unilateral and bilateral) BioZ monitoring. To determine the dynamic response of the tissues, the relative change of the complex bioimpedance (magnitude, phase, real/imaginary) was evaluated as a function of body location, measurement setup, and stimulus frequency for changes resulting from respiration and heart activity. This study uses novel electrode configurations and a wide range of frequencies to investigate the possibility of real-time cardiorespiratory monitoring in a wrist-watch- or clothing-based bioimpedance system. Such a system could enable at-home monitoring of heart and lung diseases and empower primary care providers with additional data on treatment effects. We believe that the results of this comparative site evaluation might guide the design of wearable monitors and implementation of real-time monitoring applications.
There are two broad classes of BioImpedance Analysis (BIA): assessment of the frequency-domain response of the tissue, and monitoring of the time-domain response. Most applications, such as body composition analysis, will use multiple, discrete frequencies (called multiple-frequency BIA (MF-BIA) or bioimpedance spectroscopy (BIS)) in succession in a short span of time to characterize the frequency response of the tissues at different frequencies, typically ranging from single kHz to approximately one MHz. Commercially available devices such as the Impedimed SFB7 [
9] use a frequency sweep of 256 logarithmically spaced frequencies between 1 kHz and 1 MHz in less than one second to collect this response. Applications such as impedance cardiography or pneumography often continuously measure a Single Frequency (SF-BIA) at a high sample rate for a set time period to obtain the changing response of the tissue between the electrodes due to respiration or heart activity. Many single-frequency applications use 50 kHz [
11,
12] as a stimulus frequency, as there are contributions from both intracellular and extracellular water at this frequency [
13]. Frequencies higher than 100 kHz are less common for single frequency applications because of parasitic capacitance at higher frequencies [
14] as well as frequency limitations of the Commercial off-the-shelf (COTS) front ends (e.g., Texas Instruments AFE4300 in IQ mode is limited to 64 kHz [
15]). Many studies use one or a combination of the magnitude, phase, real (resistive), and imaginary (reactive) components of impedance [
3,
16] to evaluate and compare tissue properties.
Advances in integrated circuits have greatly benefited bioimpedance monitoring systems, making them smaller, cheaper, more sensitive, and easier to use [
17]. COTS controllers on the market from Texas Instruments, Analog Devices, and MAXIM feature sensitivity and accuracy of the high-end systems from twenty years ago, while priced under ten dollars. A recent study [
18] found the MAXIM MAX30009 [
19], used in this paper, compares favorably with a Zurich Instruments High Precision Multi-Frequency Impedance Analyzer [
20], USD 12,260 at time of publication, in the 1 kHz to 300 kHz range. Bioimpedance controllers such as this and similar offerings by competitors bring improved range and sensitivity, as well as reduced power consumption to wearable device designers. Moreover, their size and power consumption make them suitable for real-time wearable monitoring applications and remote patient monitoring. Previously published research projects were limited by the hardware (frequency, sensitivity, I vs. Q, etc.), and would certainly benefit from faster sweeps, increased frequency ranges, higher sample rates, and increased resolution offered by the latest generation of integrated controllers.
The COVID-19 pandemic especially emphasized the need for effective triage and at-home monitoring using wearable monitors [
21]. Researchers in the wearable health monitoring and remote patient monitoring area have used bioimpedance technology in several broad research avenues, such as heart health monitoring, where specific applications include cuff-less blood pressure monitoring [
22], non-invasive heart rate variability [
23], heart stroke volume estimation [
7], and respiration monitoring [
24,
25], where specific applications include lung volume measurement [
26] and respiration rate monitoring [
27]. Smart clothes and accessories provide an opportunity for the seamless embedding of the embedded controllers, electrodes, and interconnections necessary for real-time wearable BIA. Wearable physiological monitoring is particularly important for users with chronic conditions [
28,
29]. People with three or more chronic conditions (28% of the population) account for 67% of total healthcare expenditures in the United States, and over 80% of people over 65 have multiple chronic conditions [
30]. Many of these chronic conditions are heart and lung conditions [
31]. Roughly 1 in 4 US adults suffer from hypertension, and 1 in 12 from upper respiratory conditions [
30]. With an aging population and high incidences of heart and lung disease, there has been a continually rising increase in interest in systems that can provide monitoring capabilities for these conditions, especially at home [
32]. We believe that the electrode configurations and frequencies studied may be appropriate for future wearable applications to address these needs.
This paper is structured as follows:
Section 1 contains the introduction;
Section 2, materials and methods, describes the measurement setup, the rationale for measurement locations, subjects, etc.;
Section 3 presents the results;
Section 4 discusses the results and provides the conclusions.
2. Materials and Methods
This section describes the measurement setup, equipment, and protocols used in the evaluation of configurations and setups suitable for wearable real-time BioZ monitoring.
2.1. Measurement Setup
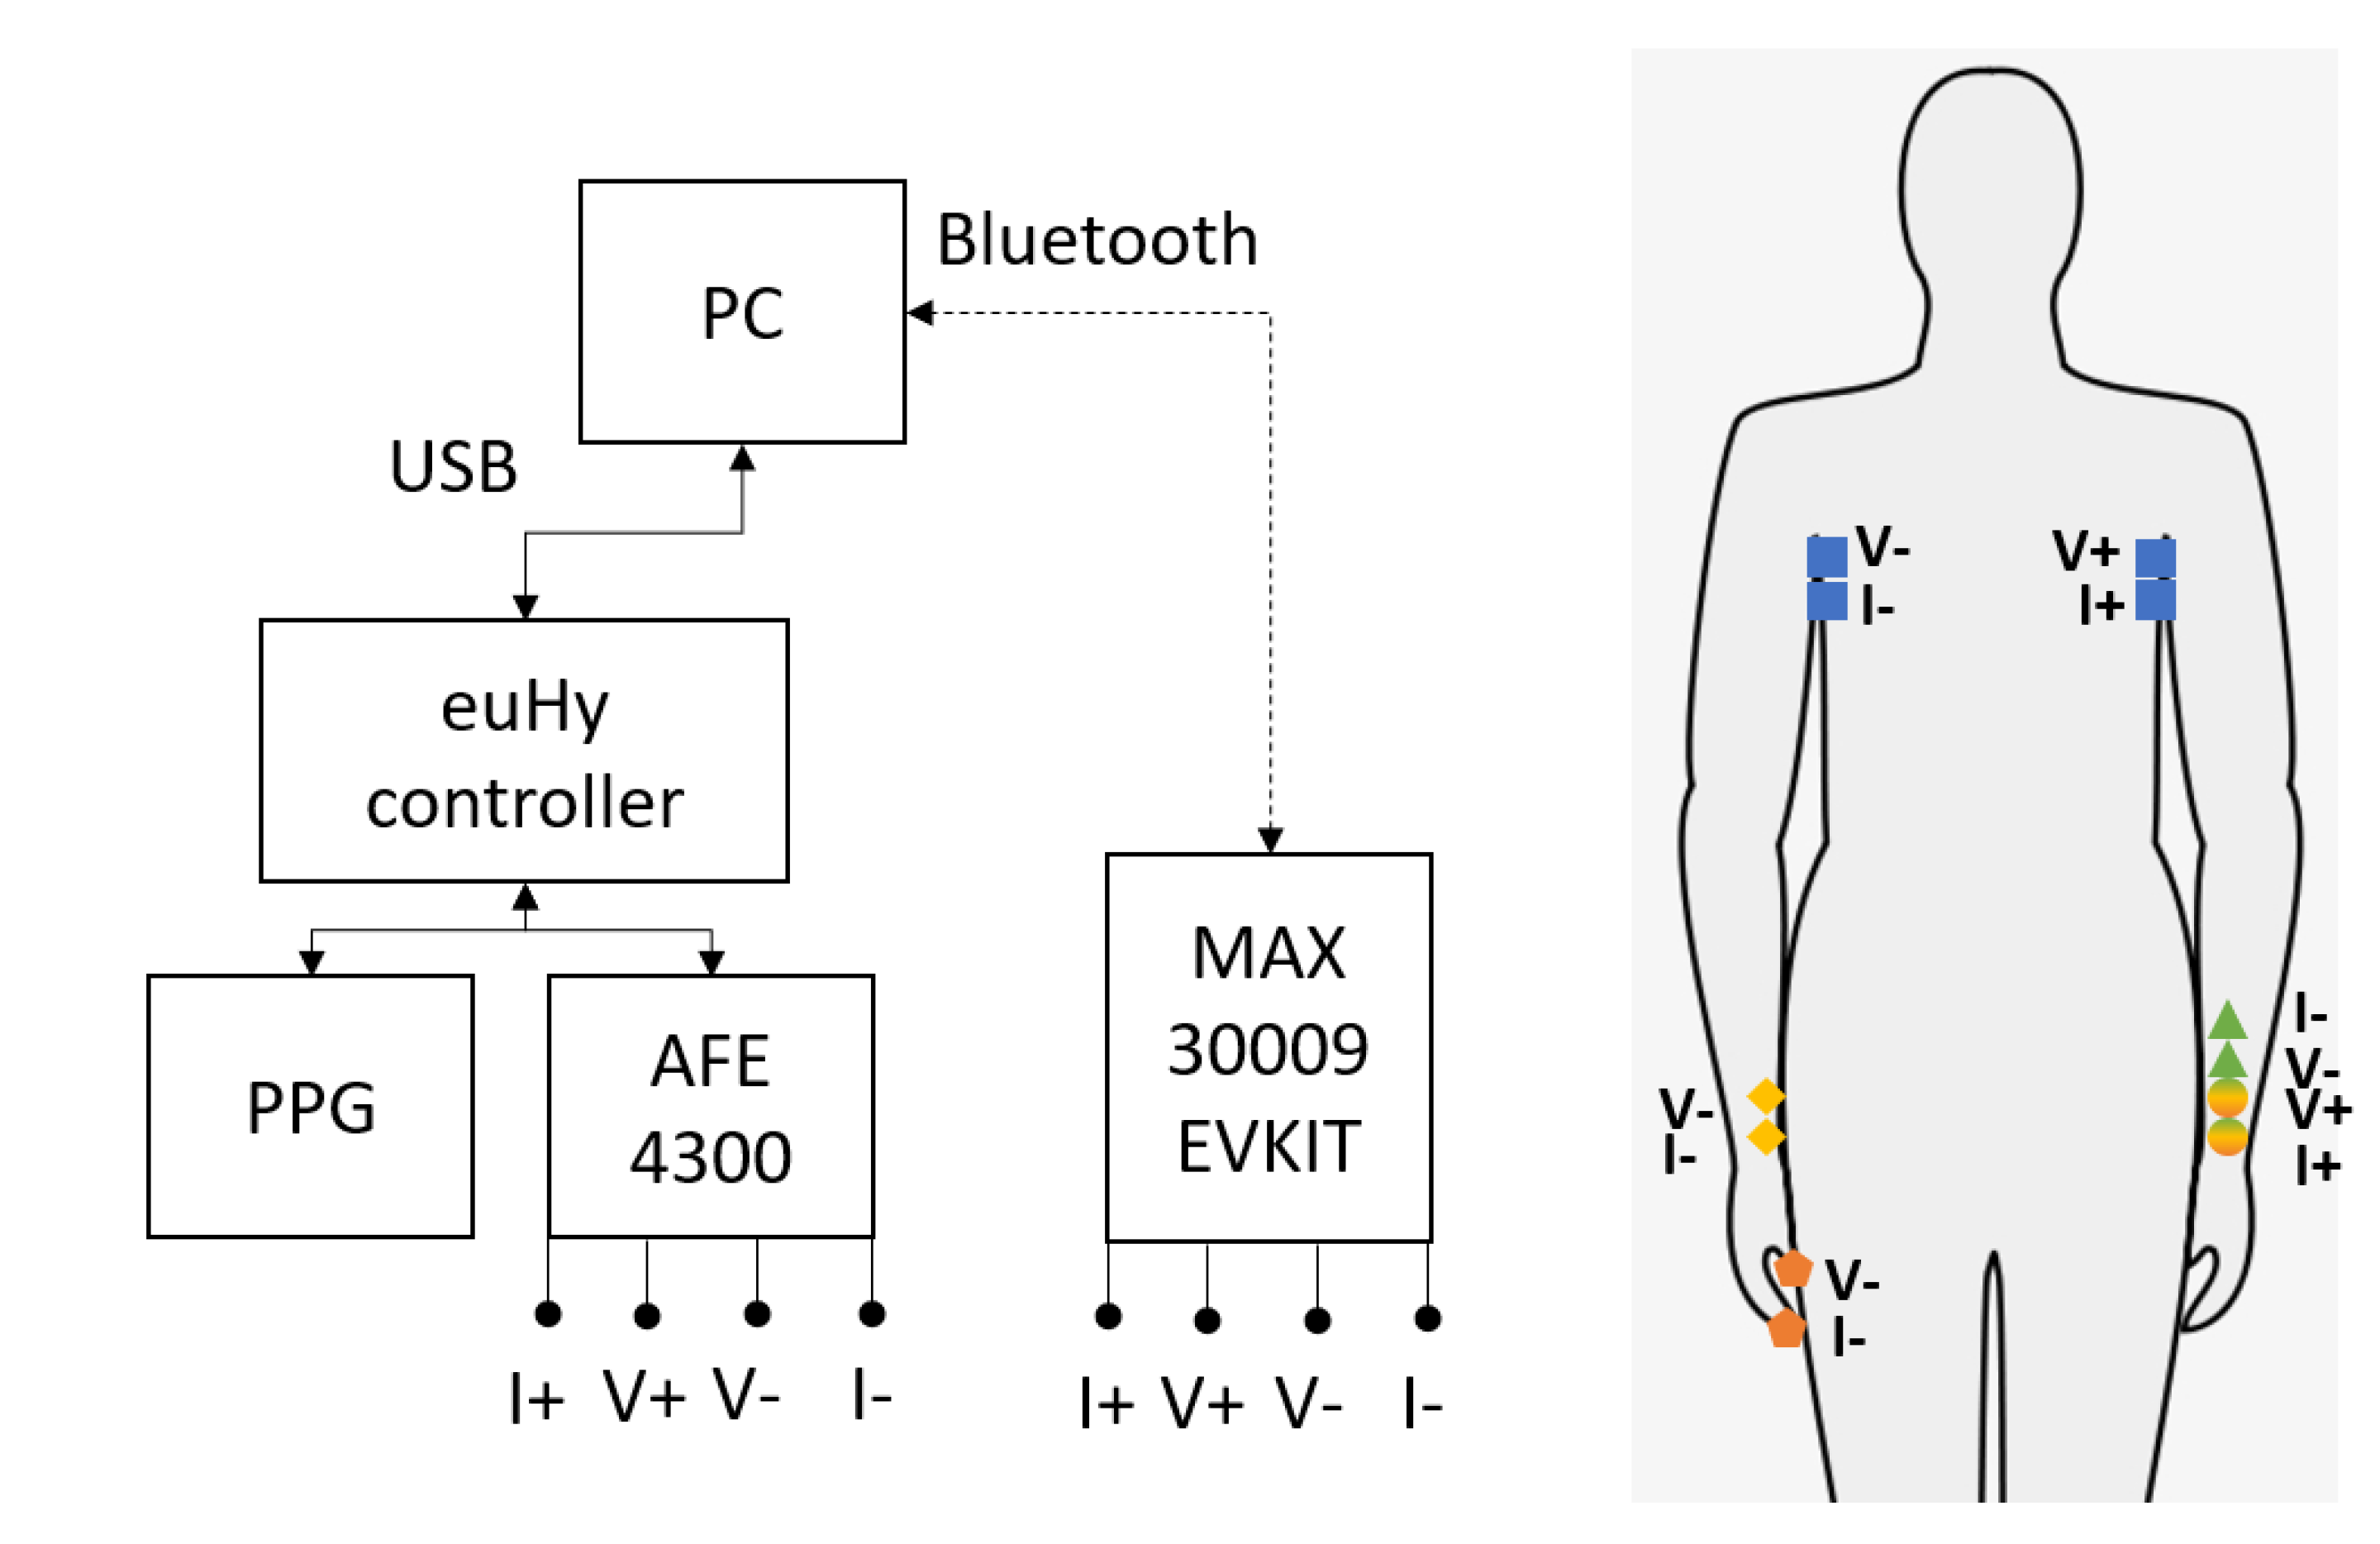
The main candidate locations for the wearable BioZ monitoring evaluated are illustrated in
Figure 1:
Chest (Thoracic, blue, square)
Forearm (unilateral, green, circle to triangle)
Wrist-to-Wrist (bilateral, yellow, circle to diamond)
Wrist-to-Finger (bilateral, orange, circle to pentagon)
All candidate locations are evaluated with the same set of sensors and protocols, which allows analysis of their suitability for different wearable applications. The well-studied chest configuration is used in many impedance cardiography and pneumography applications, and it is used in this paper as the baseline measurement. All of the following measurements are performed with the subject in a seated position, with both feet on the floor and both hands placed palms up in a comfortable resting position.
2.2. Measurement Location Rationale
There are many combinations of possible electrode locations and stimulation frequencies on the body, and to complicate matters further, the changes in the components of the measured impedance vary greatly with the location of electrodes/tissue under electrodes. Many researchers evaluate a single frequency (often 50 kHz [
11], though 10–100 kHz is common) for multiple locations, or multiple frequencies at a single location. In this paper, both multiple frequencies and multiple locations are studied to comparatively evaluate site quality for physiological monitoring, primarily respiration, and heart activity. Therefore, it is important to establish baseline measurements for comparison with other works. Here, the chest configuration is used as the primary reference, and the forearm configuration is used in this paper for comparison with other works. In addition, the novel wrist-to-wrist and wrist-to-finger electrode configurations are evaluated as candidate locations in wearable applications.
2.2.1. Chest
Chest, or thoracic, bioimpedance is well studied for impedance cardiography [
33] and pneumography [
34]. The tetrapolar electrode configuration utilized in this paper was selected to provide a baseline measurement for comparison to other, less-studied configurations. Here, the source current and voltage electrodes are on the left side of the chest, while the sink current and voltage electrodes are on the right side of the chest, resulting in a transverse thoracic measurement. This configuration is similar to configuration D used in [
35], and also used in [
36,
37], which found it to have the highest robustness to noise and the strongest correlation with reference breathing measurements. By sensing the voltage difference closely to the full volume of the lungs and the heart, this configuration gives the largest change in measured impedance for the biological processes of breathing and heartbeat. There are many contributing factors to the changes in measured thoracic impedance [
38] over the studied time period (approximately one minute), but the primary factors are respiration [
39] and heart activity [
33], with studies isolating one of these variables typically requiring suppression of the other [
36,
40]. A further study of inter-heartbeat changes is available in [
41]. Since many other studies have evaluated individual applications, this study focused on the relative changes in complex bioimpedance due to these two processes to further evaluate other electrode configurations.
2.2.2. Forearm
Forearm measurements are well studied in the context of breathing [
23], blood pressure monitoring [
22], and heart rate detection, with multiple papers and avenues of research available. The effect of electrode placement can have a significant impact on the measured impedance [
42]. In this context, a tetrapolar electrode configuration centered on the ulnar artery is used, and similar setups can be found in [
43,
44]. As discussed in [
43], the primary short-term time-varying properties in the forearm are blood flow (modulated by heart activity and respiration) and muscle tension. As the arterial wave pulse travels through the measurement area, it is measured by the change in volume and blood impacting the complex impedance of tissue under the electrodes. A further discussion of this measurement location is available in [
22]. In each measurement, the forearm was placed flat on a table with palm up in a relaxed, comfortable position to minimize the effects of muscle tensions and movement. The advantages of a forearm-based measurement system are numerous in the context of remote patient monitoring. A self contained system on the forearm could be relatively hassle-free to the end user. Wrist-based wearables are already common-place, so adding a bioimpedance sensor to existing wrist-based wearables would be highly beneficial. This research extends the range of frequencies described in the existing literature and provides a direct comparison to the chest measurements, enabling an estimation of the comparative sensitivity to respiration and heart activity.
2.2.3. Wrist-to-Wrist
Those familiar with segmental bioimpedance spectroscopy [
45] recognize that breaking the complex system of the human body into individually measured segments and then adding them together is often more accurate than measuring the entire body at once [
46]. However, whole body measurements are still useful and commonly used (due to electrode setup and convenience). In a similar fashion, impedance cardiography and pneumography measured directly on the chest segment of the body will naturally be more diagnostically relevant and accurate than a whole body measurement containing the chest. Wrist-to-wrist measurement are not well characterized in the literature, but have some promising applications in the wearable space where it can be beneficial to trade some measurement fidelity for usability (e.g., smartwatch applications, treadmill, and other fitness applications). We seek to quantify this trade-off so that other researchers can consider using it in future applications, such as watch- or smart clothes- based wearables. The wrist-to-wrist configuration studied here has current electrodes on the wrist close to the palm, and the respective voltage electrodes situated as close as possible to their associated current electrodes. This adds the nearly entire length of the forearm and upper arm on each side of the body to the measured tissue under study. As the chest now makes up a smaller fraction of the measured volume, the change in impedance due to respiration and heart activity will also be smaller.
2.2.4. Wrist-to-Finger
The wrist-to-finger configuration is similar to that of the wrist-to-wrist, except that the sink electrodes are placed on the ends of the thumb (voltage sense) and index finger (current sink) of the opposite hand from the source. This configuration is similar to [
47] studied for body composition analysis [
48], as well as in commercial devices [
49,
50], and ECG measurements [
51]. However, there have not been studies quantifying the effects of respiration and heart activity on the impedance measured in this configuration, which could have an impact on the calculated body composition using this method.
2.3. Bioimpedance Sensors and Controllers
To measure bioimpedance, we used two commercially available BioZ integrated controllers with analog front ends. The TI AFE 4300 is used for stimulation frequencies of 8, 16, 32, and 64 kHz, and the MAX30009 is used for all ten frequencies. Each was calibrated by following the calibration procedure in the datasheet. For the AFE 4300, this involved measuring two separate resistors (50 and 100 ) to calculate the offset and slope. For the Maxim chip, the provided software GUI calibration uses only one resistor (100 ).
2.3.1. AFE 4300
Released in 2012, the TI AFE 4300 [
15] has been used in numerous bioimpedance studies since its introduction. It was among the first fully integrated bioimpedance solutions, not requiring an analog front end to be added. This board measures up to 860 samples per second (SPS) through a 14-bit ADC and has a frequency range of 1–255 kHz for FWR (magnitude only) mode. IQ mode is limited to stimulation frequencies of 8, 16, 32, and 64 kHz. In this mode, though, I and Q must be measured alternately, limiting the sample rate to effectively 430 SPS of both I and Q. This board is primarily sold in a 12 × 12 mm quad flat package.
2.3.2. MAX30009
Released in early 2022, the MAXIM MAX30009 BioZ front end has only recently been referenced in the literature [
18]. This controller measures up to 4k SPS through a 19-bit ADC across a frequency range of 16–855 kHz. Additionally, this system is capable of simultaneous I and Q measurements, which has advantages for investigations of physiological phenomena requiring fine resolution, such as impedance cardiography. The simultaneous I and Q measurements at all available frequencies is the primary reason that this paper uses the MAX30009 EVKIT for multi-site evaluations. The EVKIT also includes parasitic cancellation traces for high-frequency measurements. Though typical bioimpedance applications stay below 100 kHz due to parasitic capacitance losses [
14], these losses are more significant above 500 kHz [
52]. The highest frequency used in this paper, 512 kHz, is suitable for a comparison of relative changes, as any parasitic effects will be constant. This controller is primarily sold in a 2 × 2 mm wafer level package.
The MAX30009 bioimpedance controller is an electrical impedance spectroscopy device marketed mainly towards bioimpedance analysis. However, many other applications of the device for general spectral analysis of the complex impedance are possible. The MAX30009 has many features that make it a promising candidate for future studies in complex electrical impedance analysis. According to the datasheet, it can measure complex impedance with frequencies as low as 16 Hz and as high as 806 kHz. While the frequency range may not be quite wide enough for all applications, the lowest available frequency (16 Hz) is lower than many complex impedance analyzers such as the Keysight E4990A, which only measures down to 20 Hz. The high input impedance, low noise paths, and 20 bit ADC result in 17 bits of effective resolution and 0.1% accuracy after calibration. The most attractive feature of this device are the price and size, costing over one hundred times less for a ready to use development kit than comparable impedance analyzers, significantly lowering the barrier to entry for many researchers. A small footprint and small number of external components make it very attractive for low-power embedded sensors and controllers. The advances behind the performance gains and the price to performance ratio improvement for galvanostat systems such as the MAX30009 may lead to further improvements in the potentiostat systems used in electrochemical impedance spectroscopy applications as well as other fields.
2.4. Physiological Measurements and Processing
A fine resolution synchronization of BioZ measurements with physiological signals is absolutely necessary to study the changes caused by physiological signals. This study used a custom PPG/ECG sensor MAX 86150 connected to the same microcontroller board as the BioZ module to synchronize our measurements with physiological signals. However, as discussed in [
53], this external synchronization is not strictly necessary if the objective is identification of heartbeats and breathing, and a recent paper used only bioimpedance for respiration tracking [
54]. The breathing protocol used made possible clear identification of the breath-induced changes in BioZ, and for most locations (except the forearm) the heartbeats are visible as well. The PPG serves to increase confidence in the measurements and provide the possibility for future research to include pulse transit time as a measurement.
All data were processed using MATLAB. Calibration was applied to the bioimpedance signals, which were low-pass filtered at 10 Hz to remove high-frequency noise. The MATLAB function findpeaks was adjusted using reference data to identify peaks due to respiration in one process thread, and peaks due to cardiac activity in another. These data were then windowed into individual breaths or heartbeats, with an offset approximately one second before and after the peaks. For example, with the seven breaths captured at a particular frequency, the peak exhalations were identified and the breaths arranged into a single window where the peak exhalation point was aligned. Then, basic statistics such as mean, median, and standard deviation could be applied to determine the “average deep breath”. The change in impedance due to a mean deep breath (peak to peak) was divided by the mean of the measurement to determine the relative percent change. A similar procedure was used for the average heartbeat. The bar figures are used throughout the paper to highlight the relative changes in bioimpedance during cardiorespiratory activity between the excitation frequencies. As many studies [
36,
55] have shown [
56], there is a highly linear change in impedance with breathing, which can be used to accurately measure respiration. This study uses a best-case scenario of deep breathing to create the largest average change possible to evaluate the relative change in impedance caused by respiration across multiple frequencies and locations. Visually, as can be seen in the figures throughout this paper, the impedance change due to respiration can be easily identified by the repeating trapezoidal shape, while smaller visual “spikes” may be visible, which correspond to cardiac activity. As an added point of clarification, the reference value for the percent change is variable depending on the frequency as well as the configuration. The percent change is intended to reflect the ease of sensing the activity (respiration or cardiac) at a given electrode configuration and frequency. While the absolute impedance value is an important factor, the higher frequency (above 100 kHz) measurements are impacted by parasitic effects. However, the authors would like to emphasize that any parasitic effects can be considered a constant over the short time period of the measurement (sixty seconds).
2.5. BioZ Measurements
For each measurement location, up to 10 frequencies are chosen and measured for at least one minute for each frequency. This gives roughly 7 breaths and an average of 65 heartbeats in the sample space to compare frequencies against. With 512 SPS for the MAX30009, this gives roughly 30,000 samples for comparison. With 200 SPS for AFE4300 IQ mode, there are roughly 12,000 samples. The MAX30009 sensor was set to use 64 microAmps of current. The amplifier range and bandwidth were both set to “high”. The voltage mode amplitude (RMS) was set to 354 mV. All onboard filtering was set to bypass.
2.6. Subjects
In this pilot study, we evaluated the sensitivity of signals at candidate locations and excitation frequencies for the monitoring of respiration and heart activity in wearable applications. Since each combination of electrode location and excitation frequency requires a statistically significant number of respiration cycles, in our cases, sixty seconds, the objective of this pilot study is to assess promising combinations of electrode locations and excitation frequencies for follow-up studies. The bioimpedance measurements were taken on a single male subject, age 28, height 71 inches, weight 165 lbs. Reference distance measurements included chest circumference—38 inches (full inhalation), 35.5 inches (full exhalation). Wrist circumference—6.5 inches. Wrist-to-wrist distance: 55 inches.
2.7. Protocols
For each measurement, the area was cleaned with alcohol and allowed to dry before the electrodes were applied. 3M Red Dot 2560 Ag/AgCl electrodes were used for connection to the body. A web-based program [
57] was used to indicate the breathing pattern to the user. This program displayed a two second inhale, four second hold, and two second exhale repeating pattern. Bioimpedance-only identification of breathing is also used in [
54]. The effect of this breathing pattern is an easily identifiable trapezoidal pattern in the measured impedance. Measuring for one minute ensures that at least seven breaths are captured.
4. Discussion
In this paper, methods and locations suitable for the wearable monitoring of vital signs using changes of complex bioimpedance were evaluated. Physiological signals of interest include deep breathing and cardiac activity. The investigation was based on two COTS controllers, the TI AFE4300 and MAX30009, where a subset of the measurements were performed with the AFE4300. The two evaluated devices provide similar accuracy and impedance results in the overlapping frequency range. The TI AFE4300 is limited to stimulation frequencies of 8, 16, 32, and 64 kHz in (non-simultaneous) IQ mode (the magnitude-only stimulation frequencies are much higher). The MAX30009, however, can use any frequency within the range of 1–860 kHz with simultaneous I and Q measurements and has significantly lower power consumption and a smaller PCB footprint. The MAX30009 is nearly a decade newer than the AFE4300, so this increased performance is not necessarily a surprise. We concluded that the MAX30009 is an excellent candidate for future studies of wearable sensors. The extended frequency range as well as simultaneous I and Q measurements provide the option to evaluate changes in magnitude, phase, resistive, and reactive components in one measurement. The relative changes of BioZ across multiple tetrapolar electrode configurations and stimulation frequencies were characterized to identify the best use cases for the combination of frequency and electrode configuration for the given wearable application.
(17% at 64 kHz, 0.5% at 256 kHz, respectively), on the forearm (0.098% at 16 kHz, 0.04% at 8 kHz), wrist-to-wrist across the body (0.28% at 256 kHz, 0.04% at 256 kHz, respectively), and wrist-to-finger across the body (0.35% at 4 kHz, 0.05% at 4 kHz, respectively). By measuring directly at the source, chest measurements have the highest sensitivity to the biological processes of breathing and heart activity, with an average change in magnitude of 12% across all surveyed frequencies for breathing and 0.5% for heart activity. Peak relative changes in magnitude for this measurement location were recorded as 17% at 64 kHz for breathing and 0.5% at 256 kHz for heartbeats. These values are within the expected range for chest-based measurements. As expected, the measurement locations further away from the chest decreased in measurement sensitivity, but might be feasible for certain wearable applications. At the forearm, for instance, the average change due to respiration and heart activity decreased to 0.098% and 0.04%, respectively. The forearm represents an indirect measurement of these parameters. The wrist-to-wrist across the body measurements have changes of 0.25% and 0.015%, respectively, nearly an order of magnitude higher than the forearm measurement. Similarly, the wrist-to-finger measurements have changes of 0.2% and 0.03%, slightly lower than the wrist-to-wrist measurement, but higher than the forearm measurements. Although absolute values change between measurement setups, the short term relative change in impedance is stable and 0.1–1% change is significant on the short time scale relevant for physiological measurements.
The phase may be a more reliable indicator of heart and lung activity than the magnitude in some applications, as shown by the forearm measurements as well as high-frequency ( above 100 kHz) chest measurements, which is a novel finding. We find that, generally, the imaginary component has a higher relative change due to its lower relative magnitude. The relative changes for the wrist-to-wrist and wrist-to-finger configurations were roughly an order of magnitude smaller than the chest measurement. However, this decrease in sensitivity may be acceptable for monitoring applications that need lower resolution or can tolerate occasional missed measurement during continuous monitoring. As an example, an existing wrist-worn body composition measurement device, such as the Samsung Galaxy Watch 4, may be able to be used for intermittent measurements of respiration and heart activity. Additionally, a theoretical wearable with continuous forearm-based measurements used for long term monitoring combined with intermittent wrist-to-wrist or wrist-to-finger measurements for reference and/or calibration may have significant advantages for remote patient monitoring applications. A guided deep breathing routine during simultaneous wrist-to-(finger or wrist) and forearm measurements could provide a user-specific calibration for both measurements, enabling at-home respiration monitoring for at-risk and low-mobility patients.
The biggest limitation of this study is the small sample size. While we minimized the time between measurements, postural changes between measurements could induce small changes in the absolute value of the impedance measured. Future studies need additional subjects to confirm these findings. Future studies would do well to consider additional frequencies that are traditionally not used in bioimpedance, such as those above 100 kHz, when researching physiological phenomena such as respiration and cardiac activity that vary on short time scales.
An important finding of this paper was that deep breathing and heartbeats may influence bioimpedance measurements in the studied whole-body measurement configurations. There may be variations of nearly 0.5% in measured impedance due to the phase of the breathing cycle at the time of measurement, and this variation changes with each excitation frequency. Simple averaging may not be sufficient to account for these variations without special consideration of the frequency spectra of the underlying processes. This can lead to errors in assessed body composition as well as intra- and extra-cellular water and other Cole-dispersion-related variables. Applications that use other components of the impedance may be impacted as well if they include the chest in the tissue under study. The actual change in body composition parameters or the assessment error in body composition depends on the algorithm and frequencies used in a given device or monitor. To demonstrate these effects, we have given the data collected in the wrist-to-wrist sensing configuration as a Cole–Cole plot, shown in
Figure 14, with frequencies of 8, 16, 32, 50, 64, 100, and 128 kHz. These changes shown in the Cole–Cole plot demonstrate the magnitude of the effect of respiration, where each real and imaginary pair are shifted up and to the right for every frequency. Note that the changes here are with a deep breath, not a normal breath, which would result in a smaller change. There are multiple papers on sources of error with BIS measurements, but we were unable to find papers in the open literature that describe this change as a contributing source of error. Our intent was to inform the research community of this lesser-known source of potential error in body composition measurement. It may also enable new applications of traditional body composition equipment, if the change in estimated body composition is strongly correlated with lung volume. Our preliminary testing on a Withings Body+ body composition weight scale indicated a change of approximately 0.2% in estimated body fat percentage and total body water with full vs. empty lungs. We emphasize the need to consider the phase of breathing during the assessment of body composition in wearable health monitoring applications.
This study addressed a gap in the literature for bioimpedance-enabled remote patient monitoring and wearable applications. Four bioimpedance sensing locations and ten measurement frequencies were assessed. This study is unique due to the evaluation of two novel sensing locations in comparison with others and the use of a commercially available bioimpedance controller to enhance the repeatability of the study, as well as the wide frequency range studied. Many other studies cover multiple electrode locations, but typically use only one frequency, or use custom hardware. We observed that the relative change in wrist-to-wrist and wrist-to-finger measurements of respiratory and heart activity compared favorably with forearm measurements for respiration and heart activity applications. The presented results represent signal characteristics for a limited number of subjects used in this study; however, they represent guidance for promising configurations and measurement frequencies for follow-up studies using larger populations or specific conditions. We believe that the presented results may provide guidance for designers of wearable sensors for experimental and deployment setup.


