Article

Predictive Analysis of Mechanical Properties in Cu-Ti Alloys: A Comprehensive Machine Learning Approach

Institute of Metal Science, Equipment and Technologies with Center for Hydro- and Aerodynamics “Acad. A. Balevski”, Bulgarian Academy of Sciences, 1574 Sofia, Bulgaria
Modelling 2024, 5(3), 901-910; https://doi.org/10.3390/modelling5030047
Submission received: 11 June 2024 / Revised: 21 July 2024 / Accepted: 29 July 2024 / Published: 30 July 2024

Abstract

:
A machine learning-based approach is presented for predicting the mechanical properties of Cu-Ti alloys utilizing a dataset of various features, including compositional elements and processing parameters. The features encompass chemical composition elements such as Cu, Al, Ce, Cr, Fe, Mg, Ti, and Zr, as well as various thermo-mechanical processing parameters. This dataset, comprising more than 1000 data points, was selected from a larger collection of various Cu-based alloys. The dataset was divided into training, validation, and test sets, with a Random Forest Regressor model being trained and optimized using GridSearchCV. The model’s performance was evaluated based on the R2 score. The results demonstrate high predictive accuracy, with R2 scores of 0.9929, 0.9851, and 0.9937 for the training, validation, and testing sets, respectively. The Random Forest model was compared with other machine learning models and showed better results in terms of predictive accuracy. A feature importance analysis of the mechanical characteristics was conducted, further clarifying the influence of each feature. The correlation heatmap further elucidates the relationships among the features, offering insights into the effects of alloy composition and processing on mechanical properties. This study underscores the potential of machine learning in advancing the development and optimization of Cu-Ti alloys, providing a valuable tool for materials scientists and engineers.

1. Introduction

Cu-Ti alloys have garnered significant attention in materials science due to their superior mechanical properties and their wide range of applications. These alloys are known for their excellent strength, hardness, and wear resistance, making them ideal for various industrial and technological applications. The study by Huang et al. [1] delves into the effects of microelements on the microstructure and properties of ultrahigh-strength Cu-Ti alloys. They found that adding high Ti and Cr content significantly improves the strength and plasticity of these alloys, emphasizing the importance of precipitation strengthening, particularly the β′-Cu4Ti and β-Cu3Ti phases. Controlled aging time and temperature further optimize these properties, showcasing Cu-Ti alloys’ potential for high-strength, high-ductility applications. In another study, Semboshi et al. [2] explored the suppression of discontinuous precipitation in Cu-Ti alloys by aging in a hydrogen atmosphere. This innovative approach addresses a critical challenge in the use of Cu-Ti alloys: the formation of coarse discontinuous precipitates that deteriorate mechanical properties. Their work demonstrates that aging under controlled hydrogen pressure can effectively suppress these undesirable precipitates, thereby maintaining the alloy’s hardness and mechanical integrity even under over-aging conditions. This research opens new avenues for enhancing the durability and performance of Cu-Ti alloys in electrical and electronic applications. Vorotilo et al. [3] explored the production of conductive copper–titanium alloys, which are strengthened by the presence of Cu3Ti3O inclusions, aiming to improve their tribological properties through the use of semi-oxidized electrolytic copper powder. High-energy ball milling techniques led to the significant refinement of TiH2 particles and the formation of Cu3Ti3O inclusions, contributing to exceptional strength, wear resistance, and high electrical conductivity. These enhanced Cu-Ti alloys are suitable for applications demanding mechanical robustness and electrical performance, such as advanced electronic components and wear-resistant coatings. Furthermore, Liao et al. [4] focused on stabilizing the metastable β′ phase in Cu-Ti alloys with the addition of Gd. Using first-principle calculations, they identified alloying elements that enhance β′-Cu4Ti stability while maintaining moderate electrical conductivity. The experimental validation of Gd as an effective alloying element highlights ongoing innovations aimed at balancing mechanical strength with electrical performance in Cu-Ti alloys, crucial for modern electronics applications. Recent research highlights several advancements and the critical role of microelements and alloying processes in enhancing these properties. These advancements highlight the importance of precise microstructural control and prediction models in optimizing Cu-Ti alloys.
The traditional methods for predicting the mechanical properties of alloys, such as Cu-Ti, often involve extensive experimentation and trial-and-error processes. These methods are time-consuming and resource-intensive, requiring significant effort to optimize alloy compositions and processing parameters to achieve the desired properties. Extensive experimentation involves testing numerous samples under various conditions to gather sufficient data on their performance. This trial-and-error approach, while effective, is inherently slow and inefficient, limiting the speed at which new materials can be developed and optimized.
Current advancements in machine learning (ML) offer a transformative potential for materials science, enabling more efficient and accurate predictions of mechanical properties through data-driven approaches. ML algorithms have the capability to analyze vast amounts of test data to identify patterns and relationships that traditional methods might overlook. These data-driven approaches streamline the prediction and optimization processes, significantly reducing the time and resources required to develop new high-performance alloys.
Zhang et al. [5] demonstrated the use of ML algorithms, including Arrhenius, back-propagation neural network, and support vector machine, to predict the flow stress of Cu-Ti alloys. Their study showed that SVM provided accurate predictions, highlighting the effectiveness of ML in understanding the complex interactions between strain rate, temperature, and deformation. Similarly, Huang et al. [6] employed integrated computational materials engineering to study the effects of Ti additions on Cu-Cr-Ti alloys, utilizing CALPHAD-based approaches and experimental validation to optimize the alloy properties. Moreover, Zhao et al. [7] leveraged ML to discover strong and conductive Cu alloys by mining data from discarded experiments. Their approach, based on Gaussian process regression models, facilitated the design of new alloys with superior hardness and electrical conductivity. This method underscores the efficiency of ML in transforming large datasets into actionable insights, enabling the rapid development of high-performance materials. The study by Zhao et al. [8] highlights the potential of ML in materials design. By employing a back-propagation neural network combined with genetic algorithms and particle swarm optimization, they accurately predicted the flexural strength of open-porous Cu-Sn-Ti composites, demonstrating the precision and reliability of ML models in predicting mechanical properties.
ML not only enhances the accuracy of property predictions but also accelerates the discovery of new alloys. Pan et al. [9] and Xie et al. [10] utilized ML to design Cu-Ni-Co-Si and Cu-Zn alloys, respectively, optimizing compositions and process parameters to achieve high strengths, ductility, and low friction coefficients. These studies illustrate the broad applicability of ML in developing high-performance alloys across various compositions and applications.
Despite significant advancements in the study of Cu-Ti alloys, a notable research gap remains in the predictive modeling of their mechanical properties. The current literature lacks comprehensive models that utilize ML to predict crucial properties such as hardness, yield strength, and ultimate tensile strength using various features including the compositional elements and processing parameters of different Cu-Ti alloys.
The primary aim of this study is to develop a predictive model for assessing the mechanical properties of Cu-Ti alloys using a comprehensive ML approach. Specifically, the study focuses on predicting the hardness, yield strength, and ultimate tensile strength of Cu-Ti alloys based on various compositional and processing parameters using an ML model employing an ensemble algorithm. The model’s performance for the training, testing, and validation phases is evaluated based on the R2 (coefficient of determination) metric. In addition to predictive modeling, a feature importance analysis is conducted to identify the most significant factors influencing these mechanical properties. By leveraging advanced ML techniques, this research seeks to provide accurate and reliable predictions that can aid in the optimization and development of Cu-Ti alloys with desirable mechanical properties.

2. Data and Methodology

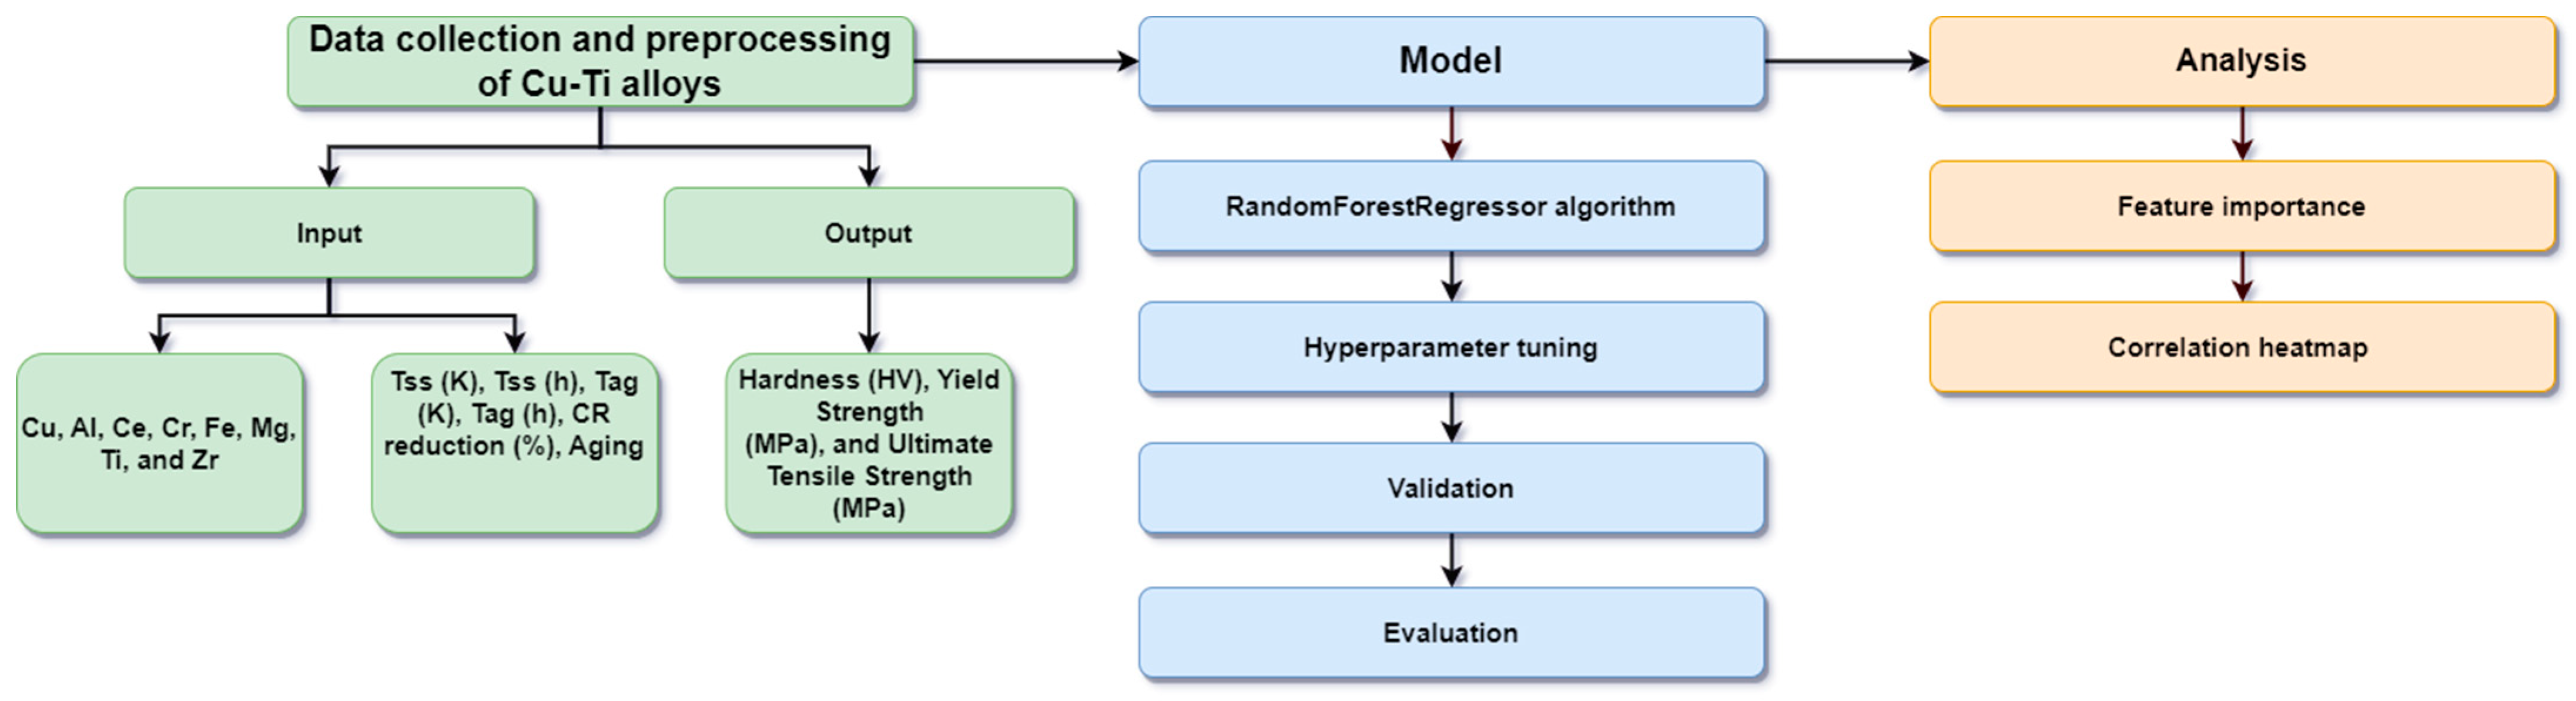
2.1. Data Collection and Preprocessing

The study employed an extensive dataset on Cu-Ti alloys, which included variables like chemical composition, thermo-mechanical processing details, and mechanical properties. This dataset, containing more than 1000 data points, was extracted from a wider collection of copper-based alloys outlined by Gorsse et al. [11,12]. The dataset comprises 17 features, including chemical composition elements (Cu, Al, Ce, Cr, Fe, Mg, Ti, and Zr), thermo-mechanical processing parameters (solution temperature in Kelvin Tss (K), solution duration in hours tss (h), aging temperature in Kelvin Tag (K), aging duration in hours tag (h), and cold rolling reduction percentage CR reduction (%)), process details regarding aging, and mechanical properties (hardness (HV), yield strength (MPa), and ultimate tensile strength (MPa)). The high quality and relevance of the dataset’s data points, combined with advanced techniques such as cross-validation and hyperparameter tuning, ensured robust model performance even with the smaller dataset size.

2.2. Model Training, Testing, Validation, and Analysis

The model training was performed using the RandomForestRegressor (RF) algorithm from the scikit-learn library due to its robustness and effectiveness in handling numerical datasets with complex interactions [13,14,15]. A GridSearchCV approach was employed to tune the hyperparameters, optimizing the model for the best performance. The hyperparameters explored during grid search included the number of estimators (n_estimators: [50, 100, 200]), the maximum depth of the trees (max_depth: [5, 10, 15]), the minimum number of samples required to split an internal node (min_samples_split: [2, 5, 10]), and the minimum number of samples required to be at a leaf node (min_samples_leaf: [1, 2, 5]). The best model was selected based on the negative mean squared error scoring metric and was validated using 20-fold cross-validation. A scatter plot was generated to illustrate the comparison between the actual versus predicted values for the training and test datasets. This visual validation helped assess the model’s predictive accuracy and reliability. The model’s performance was evaluated based on R2.
To ensure a comprehensive analysis, the performance of the RF was compared with two other ML models: Decision Tree (DT) and Support Vector Regression (SVR). The DT model was trained and optimized using GridSearchCV, exploring hyperparameters such as the maximum depth of the tree (max_depth: [5, 10, 15]), the minimum number of samples required to split an internal node (min_samples_split: [2, 5, 8]), and the minimum number of samples required to be at a leaf node (min_samples_leaf: [1, 2, 5]). This model helps in understanding the hierarchical relationships between features and the target variable. The SVR model was also trained using GridSearchCV with a MultiOutputRegressor to handle multiple output targets. The hyperparameters tuned included the kernel type (estimator__kernel: [‘linear’, ‘rbf’, ‘poly’]), the regularization parameter (estimator__C: [0.1, 1, 8]), the kernel coefficient (estimator__gamma: [‘scale’, ‘auto’]), and the degree of the polynomial kernel (estimator__degree: [2, 3, 4]). SVR is particularly useful for capturing complex, non-linear relationships in data.
The feature importance analysis was conducted using the RF model to identify the most significant factors influencing the mechanical properties of the Cu-Ti alloys. This analysis helps in determining which features contribute most to the model’s predictions, thereby providing insights into the key variables that drive the mechanical performance of the alloys [16,17]. Understanding feature importance is essential for optimizing alloy compositions and processing parameters, leading to improved material properties. The importance of each feature was visualized to provide insights into which variables had the greatest impact on the model’s predictions. A correlation heatmap was created to visualize the relationships between the features, helping to understand the interdependencies among the variables and providing additional insights into the dataset. Figure 1 illustrates the overall process of data collection, preprocessing, model training, and analysis for predicting the mechanical properties of the Cu-Ti alloys.

3. Results and Discussions

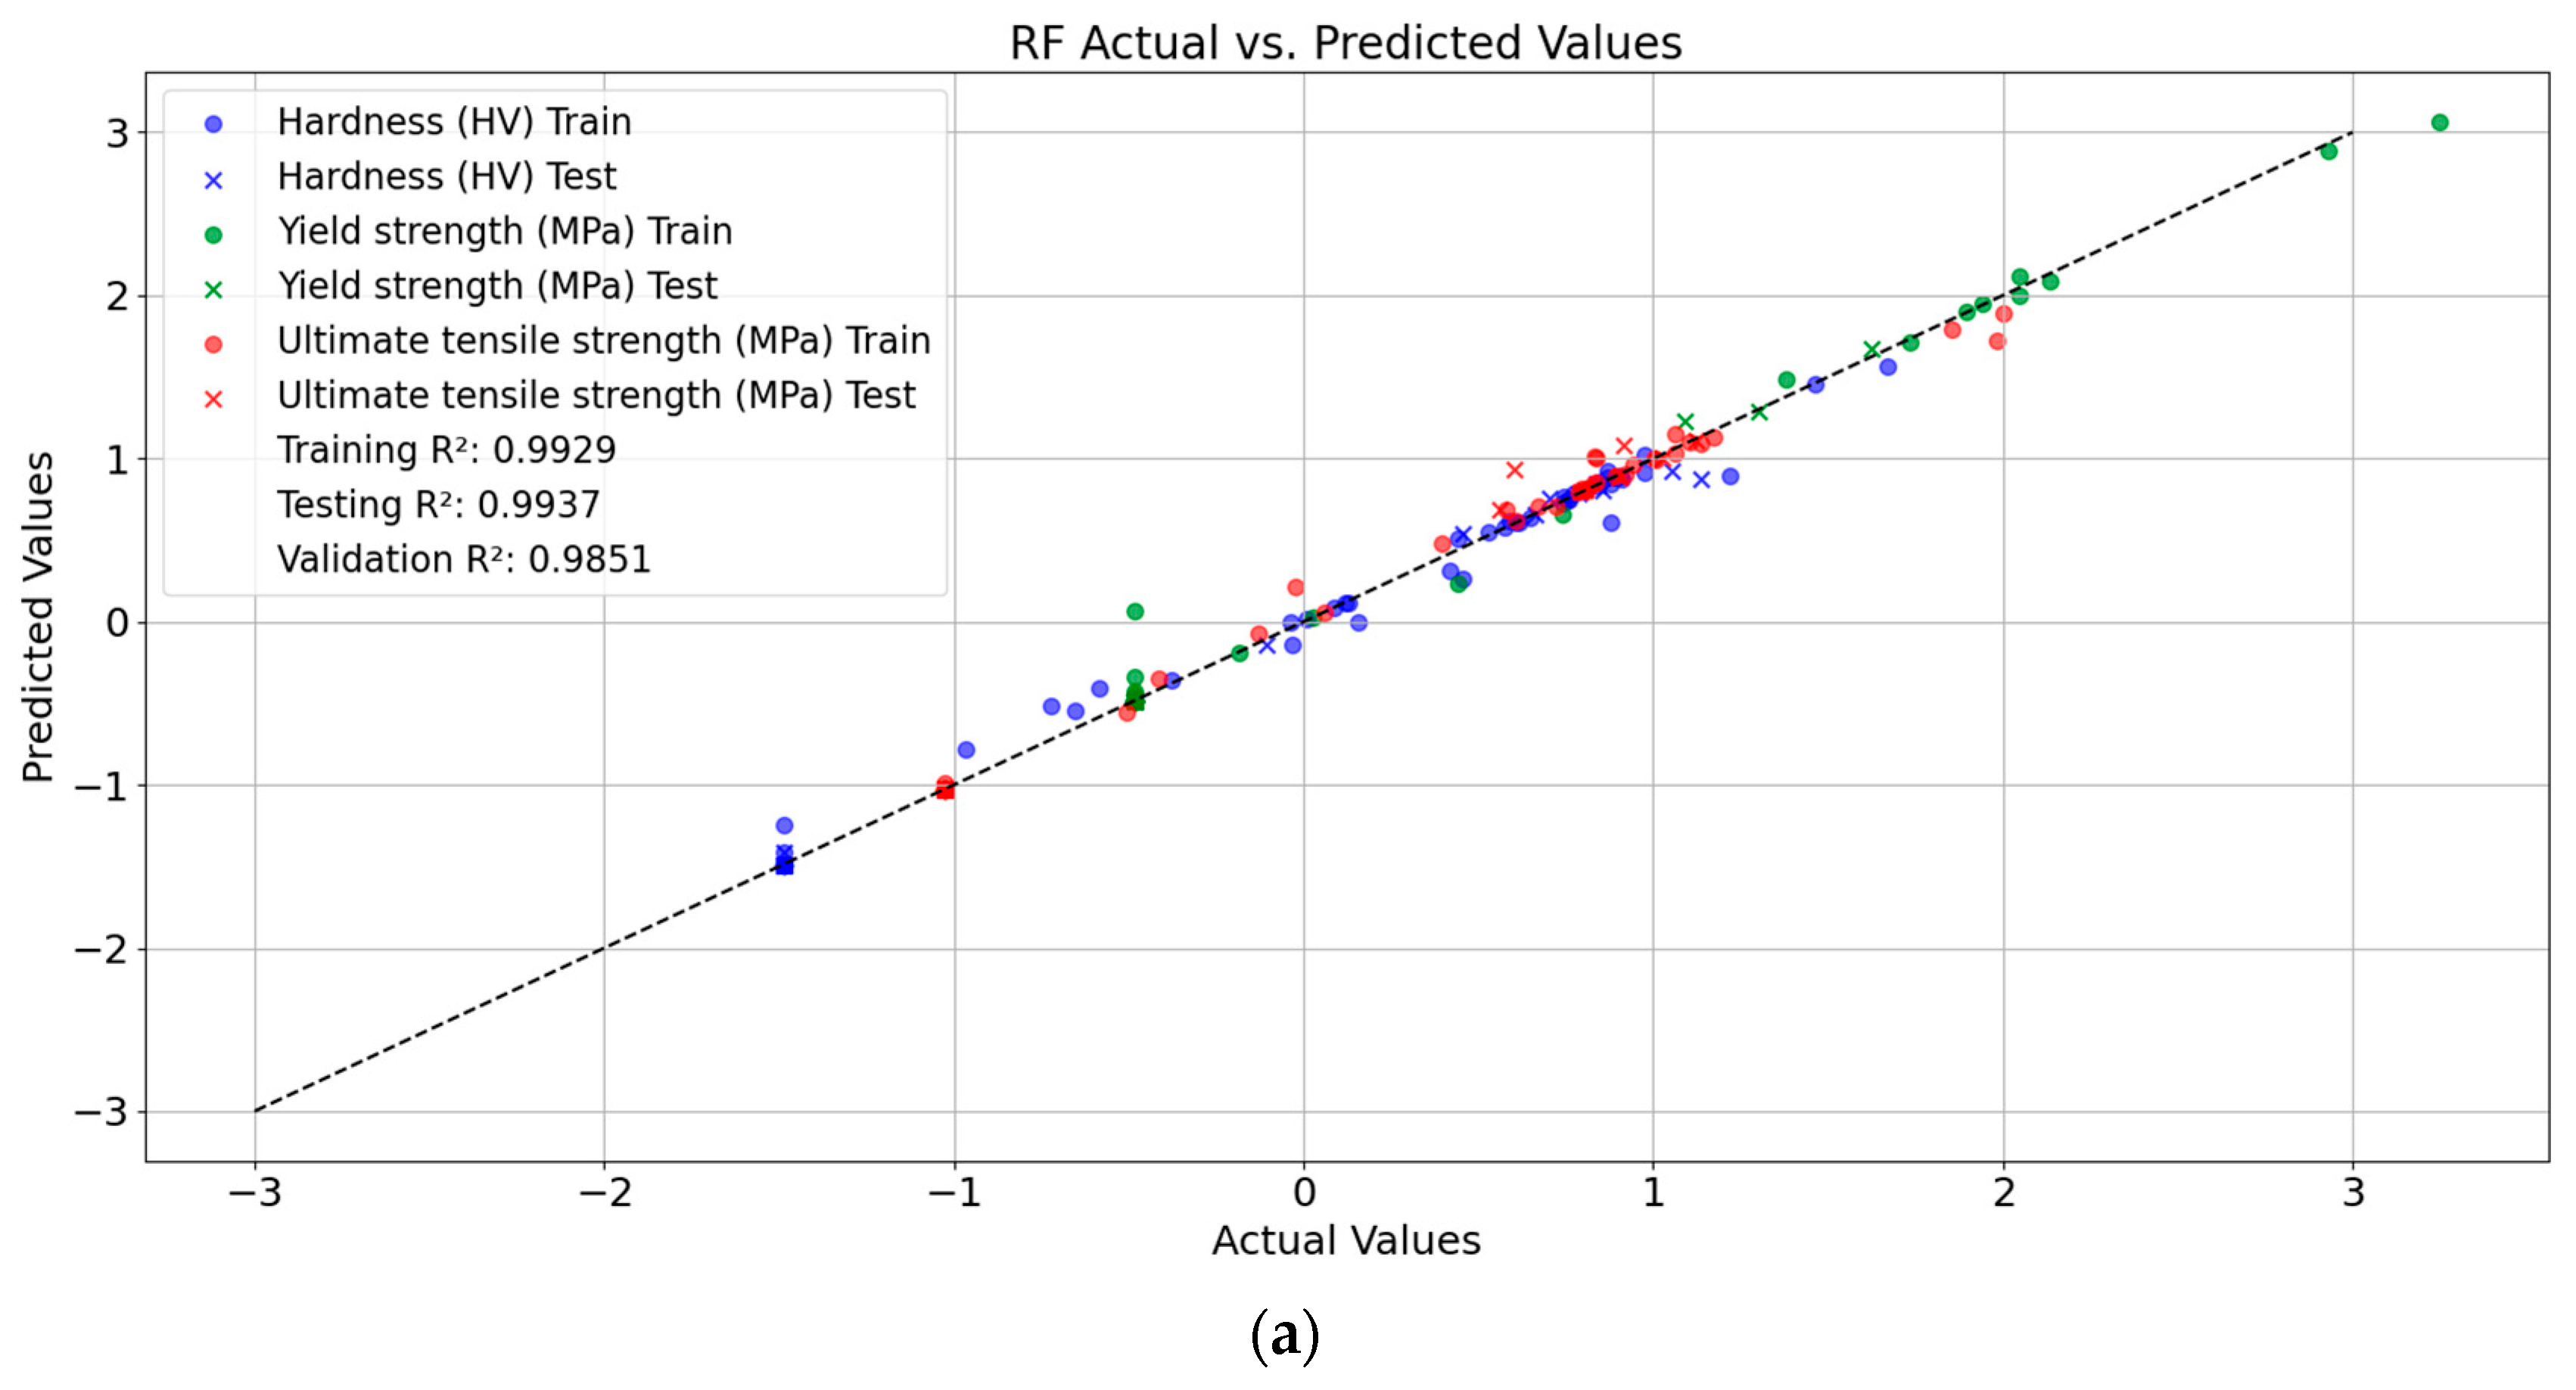
3.1. Model Performance and Validation

The performance of the RF model was evaluated based on R2 for the training, validation, and test datasets. Table 1 presents the descriptive statistics of the Cu-Ti alloy dataset used in the predictive model. The dataset includes key features such as the mean, standard deviation (std), minimum (min), 25th percentile (25%), median (50%), 75th percentile (75%), and maximum (max) values for each compositional element and processing parameter. These statistics provide a comprehensive overview of the variability and distribution of the dataset features. Figure 2 provides a visual comparison of the actual versus predicted values for the hardness (HV), yield strength (MPa), and ultimate tensile strength (MPa) of the Cu-Ti alloys across the three ML models. The RF model’s results, shown in Figure 2a, indicate a high level of predictive accuracy across all the datasets. The model attained a test R2 of 0.9937, a train R2 of 0.9929, and a validation R2 of 0.9851. These high R2 values demonstrate the model’s effectiveness in capturing the underlying patterns in the data and predicting the mechanical properties of the Cu-Ti alloys with high precision. The test R2 value indicates that approximately 99.37% of the variance in the test dataset’s mechanical properties can be explained by the model, which is an excellent result. Similarly, the training R2 shows that 99.29% of the variance in the training dataset is accounted for by the model. The slightly lower validation R2 still represents a very high level of accuracy, with 98.51% of the variance in the validation dataset being explained by the model. Figure 2 illustrates the comparison between the actual and predicted values for the mechanical properties of the Cu-Ti alloys. The close alignment of the data points along the diagonal line indicates that the model’s predictions are very close to the actual values, demonstrating the model’s effectiveness in predicting the mechanical properties of the Cu-Ti alloys. This strong correlation supports the high R2 values obtained in the quantitative analysis and underscores the model’s reliability. The findings indicate that the model generalizes well to unseen data, maintaining high predictive accuracy across different datasets. The minimal difference between the training, validation, and test R2 values indicates that the model is not overfitting and can reliably predict the mechanical properties of Cu-Ti alloys. The performance of the RF model was compared with two other ML models. To further detail the performance of the RF model and compare it with the other models, Table 2 presents the R2 values for the training, testing, and validation datasets of the three ML models discussed—RF, DT, and SVR. The results for each of the DT and the SVR models are illustrated in Figure 2b,c, respectively. For the DT model, shown in Figure 2b, the R2 values were 0.9703 for the test set, 0.9871 for the training set, and 0.8822 for the validation set. These results demonstrate that while the DT model also provides strong predictive performance, it is slightly less accurate and exhibits a higher risk of overfitting compared to the RF model. The SVR model’s results, shown in Figure 2c, indicate the R2 values of 0.9651 for the test set, 0.9519 for the training set, and 0.9593 for the validation set. The SVR model, although effective, did not achieve the same level of accuracy as the RF model.

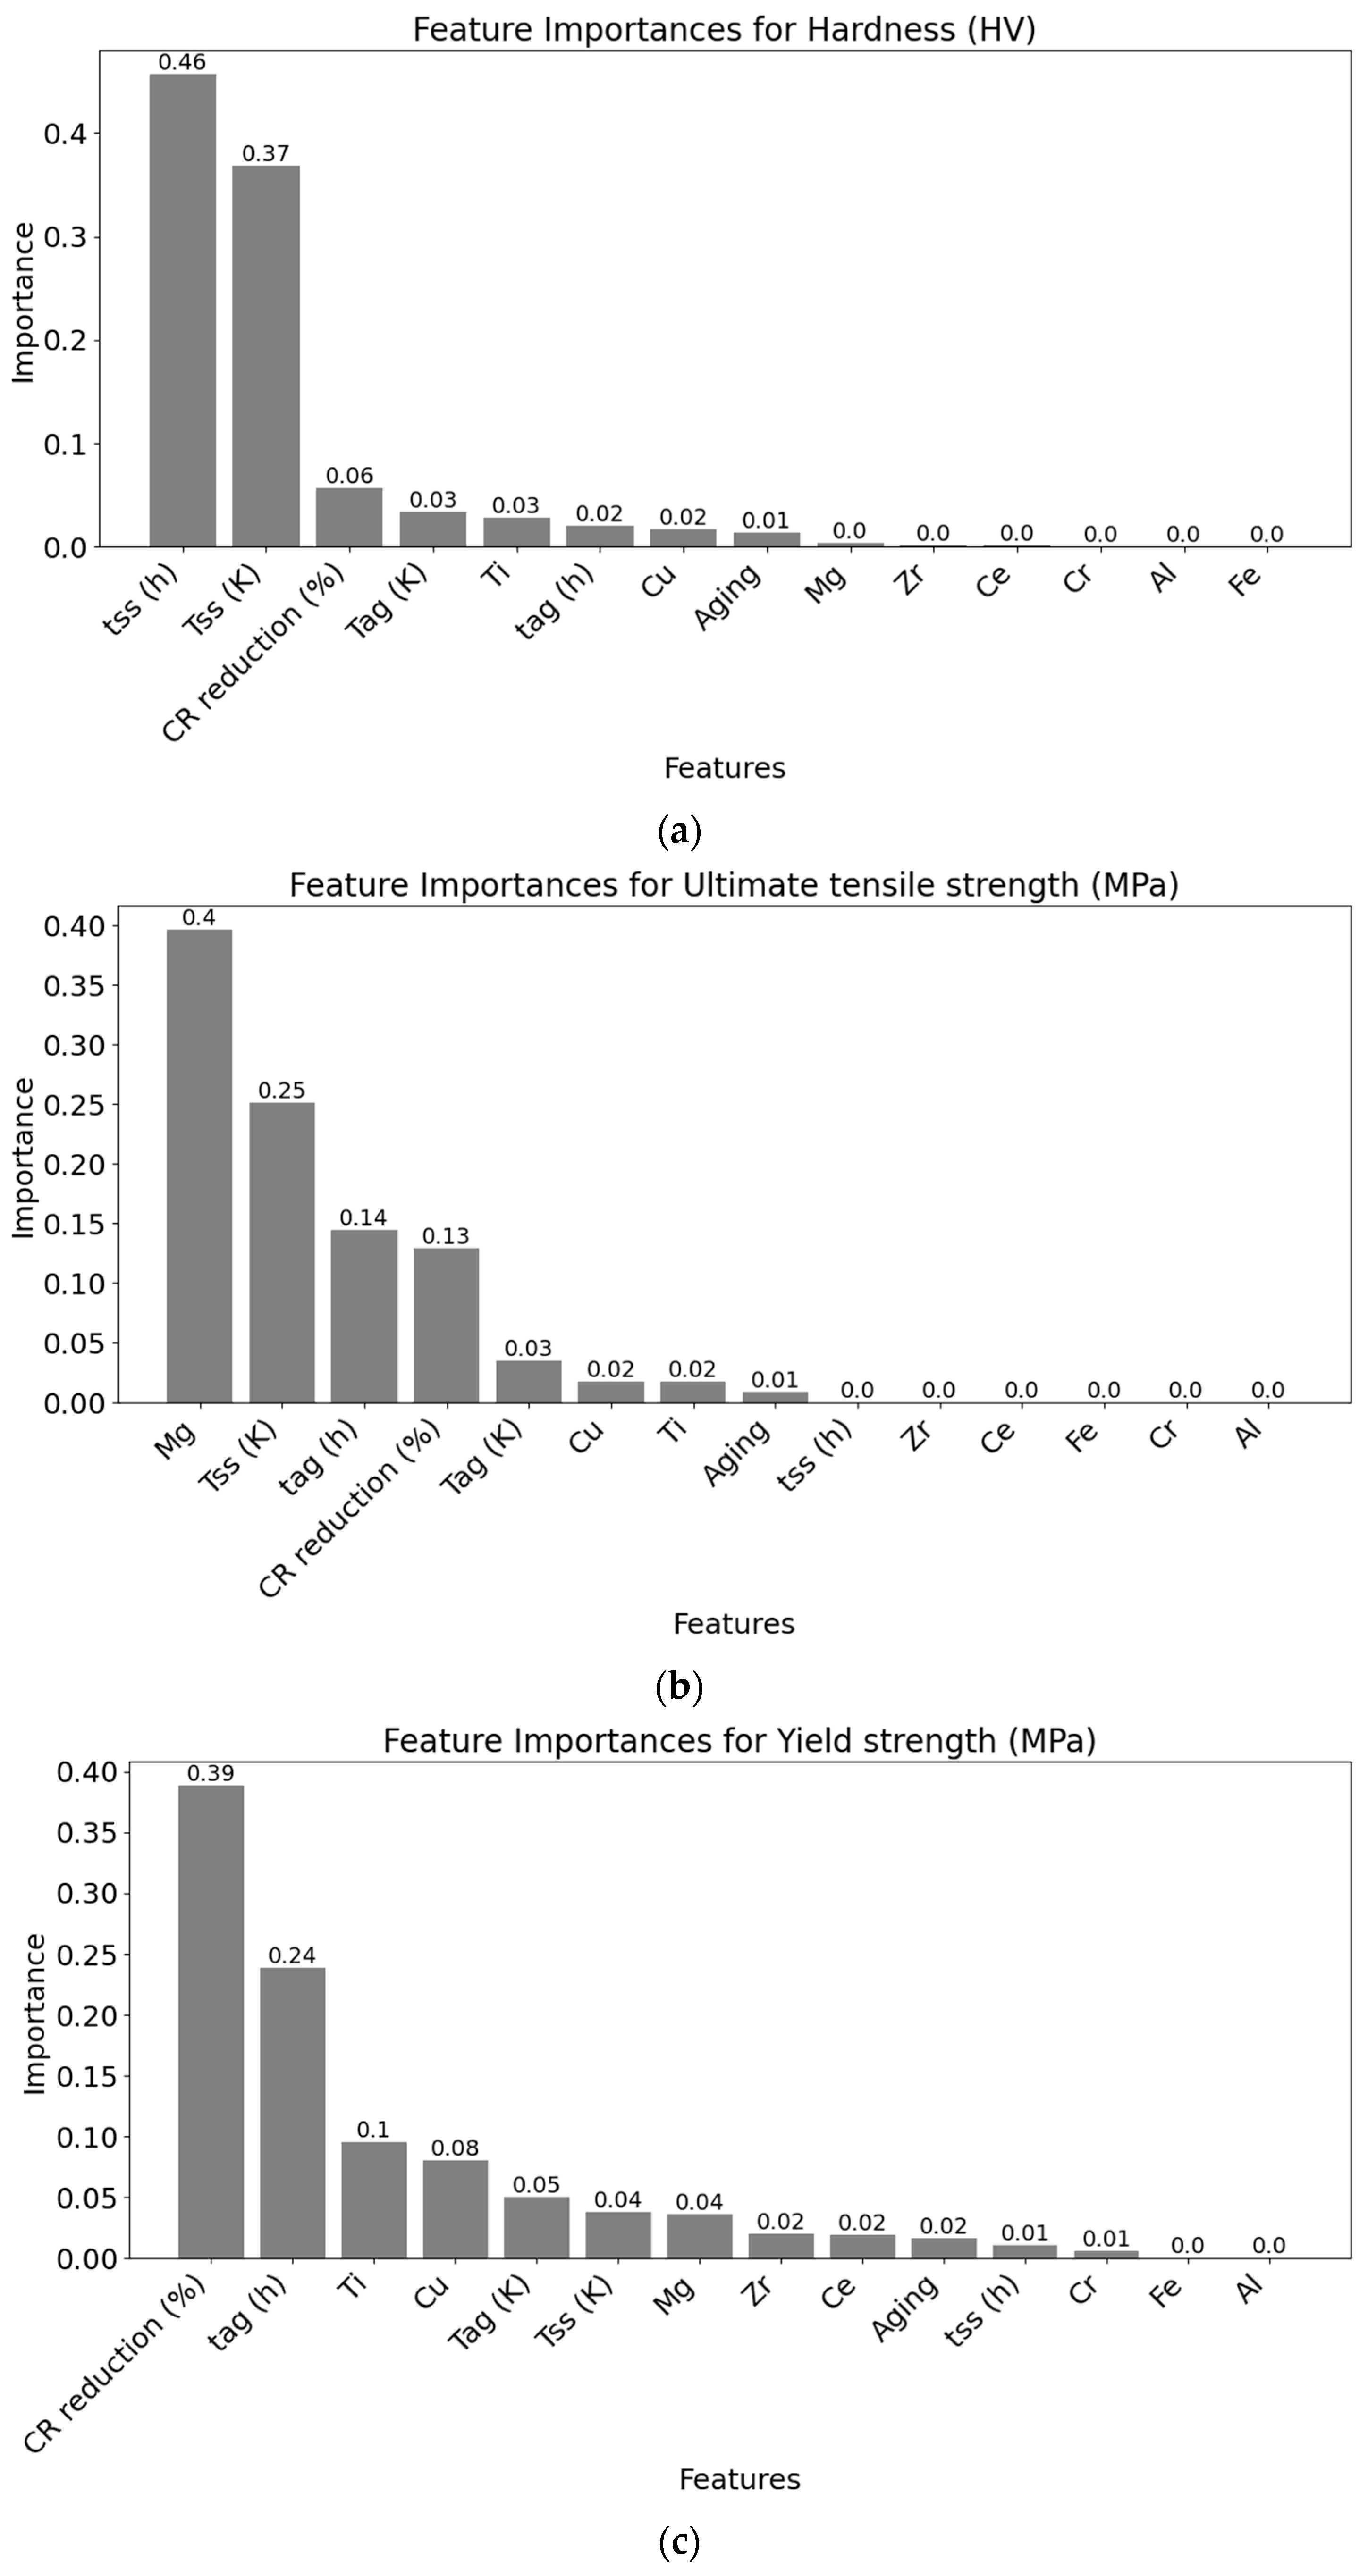
3.2. Feature Importance and Inter-Feature Relationships

Feature importance analysis was conducted using the RandomForestRegressor model to identify the most significant factors influencing the mechanical properties of the Cu-Ti alloys (Figure 3). This analysis helps in determining which features contribute most to the model’s predictions, thereby providing insights into the key variables that drive the mechanical performance of the alloys. Understanding feature importance is essential for optimizing alloy compositions and processing parameters, leading to improved material properties.
The feature importance for predicting hardness was dominated by the tss (h) with an importance score of 0.46, followed by the Tss (K) with a score of 0.37. CR reduction (%) and Tag (K) also had significant contributions, with importance scores of 0.06 and 0.03, respectively. The least important features included elements like aluminum and iron, both contributing negligibly to the model’s predictions. For ultimate tensile strength, magnesium was the most influential feature with an importance score of 0.40, followed by the Tss (K) at 0.25, and tag (h) at 0.14. CR reduction (%) also played a significant role with an importance score of 0.13. Similar to hardness, elements like aluminum and iron had negligible contributions. Yield strength was most influenced by CR reduction (%) with a score of 0.39, tag (h) at 0.24, and titanium content at 0.10. Copper and Tag (K) also had noticeable impacts, with scores of 0.08 and 0.05, respectively.
The inter-feature relationships were visualized using a correlation heatmap (Figure 4) which highlights the strength and direction of the relationships between the different features. The heatmap reveals that copper has strong negative correlations with titanium and chromium, with correlation coefficients of −0.89 and −0.77, respectively. Magnesium showed a strong negative correlation with the Tss (K), with a correlation coefficient of -0.78. The heatmap also indicates several important correlations between process parameters and mechanical characteristics. For instance, Tss (K) showed a strong negative correlation with hardness at −0.73, suggesting that higher solution treatment temperatures may reduce hardness. Similarly, tag (h) had a moderate negative correlation with hardness at −0.52, indicating that prolonged aging might decrease hardness.
These analyses collectively provide a comprehensive understanding of how different factors influence the mechanical properties of Cu-Ti alloys and highlight the complex interplay between the compositional and processing variables. This information is crucial for optimizing alloy designs and processing techniques to achieve the desired mechanical properties.

4. Conclusions

The ML model applied to predict the mechanical properties of the Cu-Ti alloys demonstrated exceptional predictive accuracy and robustness. The model achieved the R2 scores of 0.9929 for training, 0.9851 for validation, and 0.9937 for testing, indicating its effectiveness in capturing data patterns and predicting properties with high precision. The minimal difference in the R2 values across the datasets suggests that the model is not overfitting and generalizes well to new data. Additionally, the RF model was compared with two other ML models, DT and SVR, and demonstrated better predictive accuracy. The comparison revealed that the RF model outperformed both the DT and SVR models in terms of predictive accuracy, demonstrating its superior capability in modeling the mechanical properties of the Cu-Ti alloys. The analysis of feature importance revealed that the solution duration and temperature were the most significant factors for predicting hardness, while magnesium and the solution temperature were crucial for ultimate tensile strength. Yield strength was heavily influenced by cold rolling reduction percentage and aging. These insights aid in optimizing alloy compositions and processing parameters, enhancing material properties for industrial applications. The model’s high accuracy and reliability make it a valuable tool for predicting and optimizing the mechanical properties of Cu-Ti alloys in various metallurgical applications. To further enhance the model and its applicability, future research could focus on incorporating additional alloying elements and processing variables, as well as exploring deep learning algorithms for improved prediction accuracy. The dataset will be expanded to include more comprehensive data, providing a broader foundation for model training and validation.

Funding

This research was funded by the Bulgarian National Science Fund, Project KП-06-Н77/5 “Self-lubricating hybrid aluminum metal matrix composites: synthesis, experimental and computer modeling of mechanical and tribological properties”.

Data Availability Statement

Data will be made available upon request.

Conflicts of Interest

The author declares no conflicts of interest.

References

  1. Huang, L.; Cui, Z.; Meng, X.; Zhang, X.; Zhang, X.; Song, X.; Tang, N.; Xiao, Z.; Lei, Q.; Li, Z. Effects of Microelements on the Microstructure Evolution and Properties of Ultrahigh Strength Cu–Ti Alloys. Mater. Sci. Eng. A 2021, 823, 141581. [Google Scholar] [CrossRef]
  2. Semboshi, S.; Kaneno, Y.; Takasugi, T.; Masahashi, N. Suppression of Discontinuous Precipitation in Cu-Ti Alloys by Aging in a Hydrogen Atmosphere. Metall. Mater. Trans. A 2020, 51, 3704–3712. [Google Scholar] [CrossRef]
  3. Vorotilo, S.; Loginov, P.A.; Churyumov, A.Y.; Prosviryakov, A.S.; Bychkova, M.Y.; Rupasov, S.I.; Orekhov, A.S.; Kiryukhantsev-Korneev, P.V.; Levashov, E.A. Manufacturing of Conductive, Wear-Resistant Nanoreinforced Cu-Ti Alloys Using Partially Oxidized Electrolytic Copper Powder. Nanomaterials 2020, 10, 1261. [Google Scholar] [CrossRef] [PubMed]
  4. Liao, Y.; Guo, C.; Zhou, C.; Xie, W.; Yang, B.; Wang, H. Strengthening of Cu-Ti Alloys by Stabilization of Metastable Β′ Phase with Addition of Gd Element. Mater. Today Commun. 2024, 39, 108671. [Google Scholar] [CrossRef]
  5. Zhang, M.; Chen, D.; Liu, H.; Zhang, Y.; Song, H.; Xu, Y.; Zhang, S. Research on Hot Deformation Behavior of Cu-Ti Alloy Based on Machine Learning Algorithms and Microalloying. Mater. Today Commun. 2024, 39, 108783. [Google Scholar] [CrossRef]
  6. Huang, Z.; Shi, R.; Xiao, X.; Fu, H.; Chen, Q.; Xie, J. Mechanism Investigation on High-Performance Cu-Cr-Ti Alloy via Integrated Computational Materials Engineering. Mater. Today Commun. 2021, 27, 102378. [Google Scholar] [CrossRef]
  7. Zhao, Q.; Yang, H.; Liu, J.; Zhou, H.; Wang, H.; Yang, W. Machine Learning-Assisted Discovery of Strong and Conductive Cu Alloys: Data Mining from Discarded Experiments and Physical Features. Mater. Des. 2021, 197, 109248. [Google Scholar] [CrossRef]
  8. Zhao, B.; Yu, T.; Ding, W.; Li, X.; Su, H. BP Neural Network Based Flexural Strength Prediction of Open-Porous Cu-Sn-Ti Composites. Prog. Nat. Sci. Mater. Int. 2018, 28, 315–324. [Google Scholar] [CrossRef]
  9. Pan, S.; Wang, Y.; Yu, J.; Yang, M.; Zhang, Y.; Wei, H.; Chen, Y.; Wu, J.; Han, J.; Wang, C.; et al. Accelerated Discovery of High-Performance Cu-Ni-Co-Si Alloys through Machine Learning. Mater. Des. 2021, 209, 109929. [Google Scholar] [CrossRef]
  10. Xie, B.; Fang, Q.; Li, J.; Liaw, P.K. Predicting the Optimum Compositions of High-Performance Cu–Zn Alloysviamachine Learning. J. Mater. Res. 2020, 35, 2709–2717. [Google Scholar] [CrossRef]
  11. Gorsse, S.; Gouné, M.; Lin, W.-C.; Girard, L. Dataset of Mechanical Properties and Electrical Conductivity of Copper-Based Alloys. Figshare. Collection. 2023. Available online: https://springernature.figshare.com/collections/Dataset_of_mechanical_properties_and_electrical_conductivity_of_copper-based_alloys/6475600/1 (accessed on 21 July 2024). [CrossRef]
  12. Gorsse, S.; Gouné, M.; Lin, W.-C.; Girard, L. Dataset of Mechanical Properties and Electrical Conductivity of Copper-Based Alloys. Sci. Data 2023, 10, 504. [Google Scholar] [CrossRef] [PubMed]
  13. Breiman, L. Random Forests. Mach. Learn. 2001, 45, 5–32. [Google Scholar] [CrossRef]
  14. Wu, D.; Jennings, C.; Terpenny, J.; Gao, R.X.; Kumara, S. A Comparative Study on Machine Learning Algorithms for Smart Manufacturing: Tool Wear Prediction Using Random Forests. J. Manuf. Sci. Eng. 2017, 139, 071018. [Google Scholar] [CrossRef]
  15. Kolev, M. COF-RF-Tool: A Python Software for Predicting the Coefficient of Friction of Open-Cell AlSi10Mg-SiC Composites Using Random Forest Model. Softw. Impacts 2023, 17, 100520. [Google Scholar] [CrossRef]
  16. Gerstorfer, Y.; Krieg, L.; Hahn-Klimroth, M. A Notion of Feature Importance by Decorrelation and Detection of Trends by Random Forest Regression. arXiv 2023, arXiv:2303.01156. [Google Scholar] [CrossRef]
  17. Kolev, M. A Novel Approach to Predict the Effect of Chemical Composition and Thermo-Mechanical Processing Parameters on Cu–Ni–Si Alloys Using a Hybrid Deep Learning and Ensemble Learning Model. Compos. Commun. 2024, 48, 101903. [Google Scholar] [CrossRef]
Figure 1. Flowchart of data collection, preprocessing, model training, and analysis for predicting mechanical properties of Cu-Ti alloys.
Modelling 05 00047 g001
Figure 2. Scatter plots of the actual vs predicted values for the hardness (HV), yield strength (MPa), and ultimate tensile strength (MPa) of Cu-Ti alloys for the following models: (a) RandomForestRegressor; (b) Decision Tree; (c) Support Vector Regression.
Modelling 05 00047 g002aModelling 05 00047 g002b
Figure 3. Feature importance plots of Cu-Ti alloys: (a) hardness (HV); (b) ultimate tensile strength (MPa); (c) yield strength (MPa).
Modelling 05 00047 g003
Figure 4. Correlation heatmap of the features of the Cu-Ti alloys.
Modelling 05 00047 g004
Table 1. Descriptive statistics of the Cu-Ti alloy dataset.
MeanStdMin25%50%75%Max
Cu96.291.2692.9195.7096.8096.9598.50
Al0.130.000.130.130.130.130.13
Ce0.100.000.100.100.100.100.10
Cr0.340.010.330.330.340.340.34
Fe0.270.000.270.270.270.270.27
Mg0.480.720.150.150.150.162.00
Ti3.341.091.502.703.003.206.18
Zr0.120.080.100.100.100.100.44
Tss (K)1151.4960.071023.001123.001123.001223.001223.00
tss (h)3.566.400.250.252.002.0024.00
CR reduction (%)60.8024.5815.0050.0060.0090.0090.00
Tag (K)678.1331.66623.00653.00673.00723.00723.00
tag (h)22.0436.521.004.008.0016.00168.00
Hardness (HV)295.2872.5375.00245.00320.00340.00455.00
Yield strength (MPa)747.72345.59112.00492.50811.50950.001400.00
Ultimate tensile strength (MPa)853.92256.17217.00780.00892.00982.001450.00
Table 2. R2 values for the training, testing, and validation datasets of the three ML models.
ModelTraining R2Testing R2Validation R2
RF0.99290.99370.9851
DT0.98710.97030.8822
SVR0.95190.96510.9593
Disclaimer/Publisher’s Note: The statements, opinions and data contained in all publications are solely those of the individual author(s) and contributor(s) and not of MDPI and/or the editor(s). MDPI and/or the editor(s) disclaim responsibility for any injury to people or property resulting from any ideas, methods, instructions or products referred to in the content.

