Abstract
The increasing use of drones for safety-critical applications, particularly beyond visual lines of sight and over densely populated areas, necessitates safer and more reliable designs. To address this need, this paper introduces a novel methodology integrating Null Controllability with the Model-Based Safety Assessment (MBSA) framework AltaRica 3.0 to optimize propulsor configurations and system architectures. The main advancement of this method lies in the automation of reliability modeling and the integration of controllability assessment, eliminating restrictions on the types of propulsor configurations and system architectures that can be evaluated and significantly reducing the effort required for each design iteration. Through a hexarotor drone case study, the proposed method enabled a high number of design iterations, efficiently exploring various aspects of the design problem simultaneously, such as configuration, system architecture, and controllability hypothesis, which is not possible with state-of-the-art techniques. This approach demonstrated significant reliability improvements by implementing and optimizing redundancies, reducing the probability of loss of control by up to 99%. The case study also highlighted the increasing difficulty of enhancing reliability with each iteration and confirmed that it is unnecessary to consider more than two simultaneous failures for design optimization. A comparison of reliability figures with previous studies highlights the crucial role of system architecture in effectively enhancing drone design reliability. This work advances the field by providing an effective multidisciplinary modeling framework for drone design, enhancing reliability in safety-critical applications.
1. Introduction
The increasing use of drones for critical applications, particularly for operations beyond visual lines of sight and over densely populated areas, highlights the need for safe and reliable drone designs. This requires incorporating safety and reliability considerations from the outset to achieve an optimal balance between performance, safety, and reliability. Consequently, this study focuses on integrating reliability considerations into the preliminary design of drones, encompassing both propulsor configuration and system architecture optimizations.
Various methodologies have been developed and applied over the years to enhance unmanned aerial vehicle (UAV) design reliability. The following literature review discusses the evolution of these methodologies, emphasizing key contributions and their limitations in integrating reliability, controllability, and redundancy optimization. The review focuses on methodologies that address changes to propulsor configuration and system architecture to achieve higher reliability, excluding works that explore other means, such as preventive maintenance as discussed in [1].
In 2007, Franco et al. [2] illustrated a conventional approach using Failure Modes and Effects Analysis (FMEA) and Fault Tree Analysis (FTA) to enhance the reliability of fixed-wing UAVs. This method focused on identifying potential failures and implementing preventive measures to minimize their impact on mission-critical systems. The analyses were conducted manually, requiring the expertise of control, system, and reliability specialists.
In 2015, Venkataraman et al. [3] introduced probabilistic models to assess fault impacts and analyzed the UAV’s flight envelope to manage fault levels without catastrophic failure. Despite its insightful evaluation of the remaining flight envelope after failures, the scope was limited to propulsor configurations and did not address system architecture.
A significant advancement was achieved in 2016 when Shi et al. [4] investigated the reliability of multicopter configurations using the Null Controllability theory, assessing various designs based on the Available Control Authority Index (ACAI). This pioneering work integrated controllability and reliability for configuration optimization but required manual reliability modeling and did not consider system architecture.
In 2018, Wang et al. [5] applied fault tree modeling and Monte Carlo simulation to assess quadrotor UAV reliability, evaluating component importance for design improvement. This approach did not include controllability evaluation, as the loss of any rotor in a quadrotor is catastrophic, and it focused solely on propulsor configuration.
In 2019, building on Shi et al.’s work, Aslansefat et al. [6], and later in 2023, Thanaraj et al. [7], proposed frameworks integrating ACAI-based controllability analysis with Markov chain modeling for evaluating the reliability of multirotor UAVs. These frameworks integrated dynamic reliability models based on state transitions (i.e., Markov chain models) but required manual reliability modeling from the controllability assessment and did not include system architecture considerations. Also in 2019, Guo et al. [8] presented a framework that integrates controllability analysis based on operational balance with k-out-of-n requirements and state transition modeling. This work automated the reliability evaluation of propulsor configurations but was limited to multi-level balanced configurations and did not address system architecture.
Another significant advancement was achieved in 2022 when Nazarudeen et al. [9] and Liscouët et al. [10] introduced a method to integrate Null Controllability, reliability, and sizing of multirotor UAVs. They combined ACAI-based controllability analysis and Reliability Block Diagrams (RBD) for reliability analysis. This method enabled automatic reliability modeling by integrating propulsor configuration and system architecture, combining models of generic power/control systems with propulsor systems for overall UAV reliability. This integrated approach optimized and compared various configurations and architectures in terms of reliability, weight, and mission performance. However, it was limited to system architectures with generic power/control systems and propulsor configurations, whose reliability can be expressed independently. Section 4.3.1 and Section 4.3.6 describe independent and dependent generic power/control systems and propulsor configurations, respectively. In the system outlined in Section 4.3.6, the intricate connection between the batteries and the ESCs prevents the overall system reliability from being expressed as a product of the power/control system and propulsor configuration reliabilities.
Building on previous work and addressing the limitations of system architectures, this article proposes a novel methodology that integrates ACAI-based controllability analysis with the Model-Based Safety Assessment (MBSA) framework AltaRica 3.0 [11]. The aim is not only to optimize propulsor configuration and system architecture jointly without any restrictions but also to facilitate extensive design iterations. This enables the designer to explore a higher number and more intricate design solutions, thereby broadening the scope and depth of the investigation. Through a case study of a hexarotor drone designed for a safety-critical mission, the paper illustrates the modeling advancements facilitated by the proposed methodology, showcasing its potential to enhance drone reliability through effective configuration and system redundancy optimization. Table 1 summarizes the previous literature review, comparing the proposed methodology with state-of-the-art techniques and highlighting its advancement: seamlessly integrating both control effector configuration and system architecture reliability considerations into a single design framework.

Table 1.
Comparison of the proposed methodology and state-of-the-art techniques.
The structure of this paper is organized as follows: Section 2 outlines the methodological approach used to evaluate the reliability and controllability of UAV flight control systems. Section 3 describes the custom-designed hexarotor case study. Section 4 demonstrates the effectiveness of the developed method and tool by analyzing and optimizing the reliability of the hexarotor case study. Finally, Section 5 concludes the study and suggests directions for future work.
2. Method
This section outlines the methodology used to evaluate the reliability and controllability of UAV flight control systems. This methodology is divided into four main steps, detailed as follows:
Step 1: Determine the propulsor configuration (detailed in Section 2.1) and establish the reliability hypothesis, including the failure rates of system components, while considering any limitations on the reconfigurability.
Step 2: Design the physical system architecture (detailed in Section 2.2). Define the components, their quantities, and their interconnections. Utilize a graphical interface for efficient task execution, resulting in a physical representation of the design. The selected graphical modeling environment is System Analyst 1.3 [12]. Convert this graphical representation into an AltaRica 3.0 language-based model using the embedded compiler.
Step 3: Assess the design’s controllability for all possible failure combinations using the ACAI method (detailed in Section 2.3). This analysis and the next step are conducted in MATLAB R2022b.
Step 4: Integrate the controllability assessment into the AltaRica 3.0 model (detailed in Section 2.4). First, convert the controllability assessment into logical instructions for each combination of working propulsors that provide sufficient control. Importantly, these instructions must be written to enable their compilation into Boolean equations. Then, rewrite the AltaRica 3.0 model of the physical system to include these instructions. Finally, compile and execute the updated model in the AltaRicaWizard 1.2.0 modeling environment [13] to compute the UAV’s probability of loss of control and perform a reliability sensitivity analysis.
The designer’s main tasks are determining the propulsor configuration in Step 1 and designing the system’s physical architecture in Step 2 to evaluate reliability. Steps 3 and 4 are primarily automated for efficiency. Figure 1 illustrates the methodology and its integration into the case study optimization process presented in Section 4.
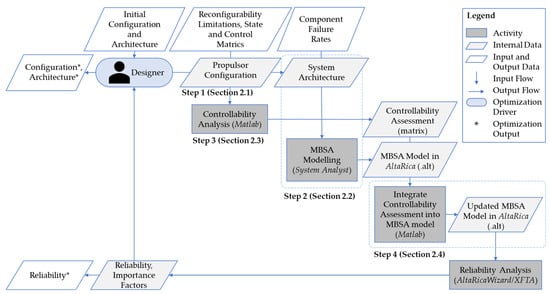
Figure 1.
Overview of the methodology for multirotor UAV reliability and controllability evaluation in design optimization using extended design structure matrix (XDSM) representation [14,15].
2.1. Step 1—UAV Configuration Model
The configuration of a multirotor UAV refers to its geometric layout, encompassing the number of propulsors (motors and propellers), their spatial positions, their orientations relative to the vehicle’s center of gravity, and the direction of rotation of each propulsor. This configuration determines how the propulsors’ thrusts and torques contribute to the overall forces and moments acting on the UAV. For instance, in a hexarotor configuration, six propulsors are arranged in a hexagonal pattern around the center of gravity. These propulsors alternate rotational directions (clockwise and counterclockwise) to provide yaw controllability. Each propulsor’s position, orientation, and rotation direction significantly influence the UAV’s control dynamics and effectiveness.
To mathematically capture the influence of the propulsors on the UAV’s dynamics, we utilize the control effectiveness matrix [16]. This matrix establishes the relationship between the individual propulsor thrusts and the resultant forces and moments acting on the vehicle, as follows:
where represents the forces and moments acting on the vehicle, is the control effectiveness matrix, is the rotor thrust vector, and is the number of control effectors, in effect rotors for multirotor UAVs. Typically, for rotorcraft design, where denotes the vertical lift, and , , and represent the pitch, roll, and yaw moments, respectively. Hence, typically, .
Deriving for a multirotor UAV involves mapping the thrusts generated by each propulsor to the resultant forces and moments acting on the vehicle. This matrix is constructed by first identifying the position vectors of the propulsors relative to the UAV’s center of gravity and their thrust directions. The total thrust is the sum of all propulsor thrusts, while the roll and pitch moments are calculated based on the propulsors’ and -coordinates, respectively. The yaw moment considers the reactive torque of the propellers, typically alternating in direction. Each row of corresponds to a specific component of the virtual control input. Examples of control effectiveness matrices for hexarotor UAVS are provided in Section 3.1.
Finally, the controllability assessment, detailed in Section 2.3, requires defining the state matrix and control matrix from the dynamics model presented in Equation (3). An example is provided in Section 3.1.
2.2. Step 2—Physical System Architecture Model
This research aims to simplify the designer’s task by deriving the reliability model from an intuitive representation of the physical system architecture, eliminating the need for expertise in reliability modeling. A physical system architecture model includes hardware components, their physical interfaces, system layout, component positioning, wiring, and critical design constraints [17,18]. This visualization helps designers understand and optimize component relationships, enhancing design efficiency and effectiveness. The recommended approach is to create, assess, and compare several candidate physical architecture models to select the most suitable one [17].
The proposed approach leverages Model-Based Safety Assessment (MBSA). MBSA is an approach for evaluating the safety and reliability of complex systems using formal models. It involves modeling component faults and their propagation, automatically computing safety analyses, and ensuring consistency between design and safety models [19]. It facilitates automated analysis, including reliability modeling derived from the physical system architecture. Utilizing a graphical modeling environment within an MBSA framework, the approach presented in this study allows designers to focus on defining the physical system architecture while providing a visual model representation. Implemented in System Analyst 1.3 [12], which uses the AltaRica 3.0 language for MBSA [11], it facilitates intuitive and effective design processes.
The AltaRica 3.0 language is an object-oriented modeling language dedicated to probabilistic risk and safety analyses [20] using guarded transition formalism [21]. In this study, the component models are designed following the hierarchical architectural pattern [22], mirroring the physical architecture and connections between components. Each component’s simplified operational dynamics are modeled using a non-repairable component class [23], extended with a flow variable. The formal definition of each non-repairable component model is represented by the quintuple , where:
- is a set of state and flow variables. A state variable indicates whether the component is working or failed. Flow variables connect the component model to other models.
- is a set of events. For simplicity, each component model includes one event , characterizing the component’s inherent failure, associated with a probabilistic function.
- is a set of transitions. Each component model includes one transition , defined as a triple and denoted by . Here, is a Boolean condition on variables in (the guard of the transition), and is an instruction (the action of the transition) that changes the state variable from working to failed.
- is a set of instructions, called the assertion, that defines the values of flow variables based on the state variable values.
- is a function that gives the initial value of the state and flow variables.
The component models used in this study are illustrated by an ESC model created in System Analyst 1.3, as shown in Figure 2 The corresponding AltaRica 3.0 code is also provided in Figure 2. This model includes a state variable (ESC1_29_working, line 53), and eight flow variables: external inputs from the flight controller command (In_cmd_32, line 49) and battery DC power supply (In_DC_34, line 51), an external output to the motor (Out_AC_33, line 50), internal input (ESC1_29_in, line 54) and output (ESC1_29_out, line 55), and a logic operator variable (Logic_310, line 52).
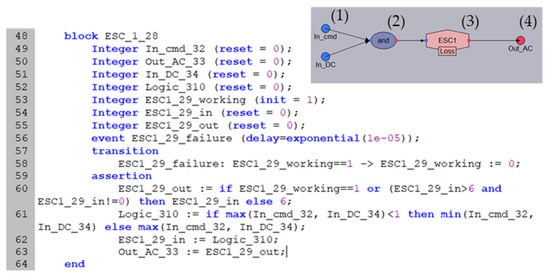
Figure 2.
AltaRica 3.0 code generated from ESC block model in System Analyst 1.3 (top right) The model components are: (1) Model inputs, (2) Logic assertion, (3) State transition, and (4) Model output.
Event ESC1_29_failure (line 56) represents the inherent failure of the ESC, characterized by an exponential cumulative probability distribution with a constant failure rate of 10−5 per hour. The transition ESC1_29_failure (line 58) is as follows:
where denotes the Walrus operator assigning values to variables.
The assertion includes multiple instructions (lines 60 to 63) based on the dependency-oriented modeling principle used in System Analyst 1.3 [12]. This approach allows for the definition of operation modes as follows: working mode (value of 0), failure mode (value of 6), and alternate working, failure, and testing modes (values other than 0 and 6). This framework enables the future integration of various performance and failure modes, including cascading failures. In the ESC example, if both external inputs In_DC_34 and In_cmd_32 indicate working modes, and the state variable ESC1_29_working shows the component has not failed, the working mode is communicated to the motor via Out_AC_33. Otherwise, a failure mode is communicated to the motor.
The initialization sets all flow variables to the default value of zero and the component state to work. Manual coding of this model could optimize it further, for example, by removing internal flow variables and creating a class for each component instead of using a block model.
The integration of various system components, such as the ESC, to model the entire system replicates the conventional physical system architecture. Examples of these physical system architectures, modeled in System Analyst 1.3, are described in Section 4.3.1 and Section 4.3.6. Notably, the proposed modeling method includes a generic controllability model that links the control effectors to the flight control function, represented by an observer block, for analysis purposes.
2.3. Step 3—Controllability Assessment
The controllability assessment is based on the ACAI method from [24]. The ACAI computation is based on a linear state-space model of multirotor drones in hovering conditions, such as:
where is the state vector, is the number of state variables, is the state matrix, represents the control matrix, and represents the forces and moments acting on the vehicle resulting in the reference state . The main component of the control authority is the control vector , which results from the rotor thrust vector as described in Equation (1). Each rotor provides a purely positive and limited thrust, leading to the following constraint set for the rotor thrust vector [24]:
where is the thrust of -th rotor and is the maximum thrust of the -th rotor. The virtual control vector constraint set is expressed as follows [24]:
The ACAI quantifies the maximum effort achievable in all control directions taking into account the impact of constrained rotor thrusts and the influence of a disturbance, such as the weight of the vehicle. More specifically, if is contained within , then the ACAI is the radius of the largest enclosed four-dimensional sphere centered at in . If is not contained within , then the ACAI is the radius of the largest enclosed sphere centered at in the complementary set of , denoted as [24]:
where denotes the boundary of , and is the Euclidean norm. Detailed information on the computation of the ACAI is provided in [24]. Finally, as demonstrated in [24], a configuration is locally controllable in all directions of only if
where is the system controllability matrix.
The proposed methodology involves assessing the controllability of each potential failure case. Initially, the full set of failure cases is defined by systematically combining one to rotor failure(s). Limiting the number of failed rotors to prevents overdesigning for highly improbable scenarios. This assumes the UAV flight control system will not adapt to more than rotor failures, leading to loss of control for any combination exceeding . The total number of failure cases to be assessed, j, is given by [10]:
where p denotes the total number of rotors (i.e., control effectors), and is the maximum number of simultaneous rotor failures to be considered in the design. The second step is to define a failure matrix for each possible failure case as follows [10]:
where Hj represents the failure matrix of the j-th failure case, and with represents available () and failed () rotors. The third step is to define the control effectiveness matrix from the failure matrix for each failure case [10]:
where is the control effectiveness matrix reflecting the effect of the j-th failure case.
The fourth step is to define the system total thrust/torque constraint set for each failure case as follows [10]:
where is the remaining system total thrust/torque constraint in the j-th failure case.
Finally, the ACAI can be calculated for each failure case by revising Equation (7) as follows [10]:
where is the ACAI for the j-th failure case, is the boundary of and is the complementary set of . The result of the controllability analysis represents the controllability assessment of all failure combinations, ranging from no failure to every combination of failures.
The controllability assessment is conducted in MATLAB R2022b and outputs a matrix that lists all the controllable cases, where is the number of controllable cases. This matrix is exemplified here with the PPNNPN hexarotor case study, described in Section 3 with a system assumed to be capable of reconfiguring for up to two simultaneous failures:
Some applications may involve transporting a payload. The controllability assessment can accommodate any payload by adding this weight component to the UAV’s empty weight . Additionally, the controllability hypothesis can either aim to maintain control of all control directions or to sacrifice one of them, such as yaw as proposed in various fault tolerant control studies [25,26,27,28], before engaging in an emergency landing. This hypothesis can significantly impact UAV reliability. Sacrificing a control direction is achieved in the ACAI calculation by removing it from the corresponding row in , , and before proceeding to the previous computations.
2.4. Step 4—Integrating Controllability Assessment into the Safety Assessment Model
The integration of the controllability assessment involves converting all controllable cases into Boolean expressions, which are then transformed into an assertion instruction for the controllability block model in AltaRica 3.0. Initially, the controllability block is designed in System Analyst 1.3 as an empty block model with an input flow variable for each propulsor and one output to observe the resulting controllability for reliability analysis. At this stage, the block contains no events, transitions, or assertions.
Once the MATLAB script completes the controllability analysis, as described in Section 2.3, it edits the AltaRica 3.0 code of the system model generated using the method in Section 2.2. Specifically, to populate the assertion of the controllability block, each row of the controllability assessment matrix is converted into logic flow variables and logical instructions. These instructions evaluate the input from each propulsor to determine whether each controllable failure case is true or not using an AND operator, represented by the maximum function. If a controllable failure case is true, the associated logic flow variable is set to 0; otherwise, it is set to 6. The assessments are then combined using an OR operator, represented by the minimum function: if any controllable case is true, the UAV controllability variable is set to 0 (working); otherwise, it is set to 6 (failed) before being communicated to the observer. An example of an edited controllability block model in AltaRica 3.0 for a hexarotor PPNNPN configuration is shown in Figure 3.
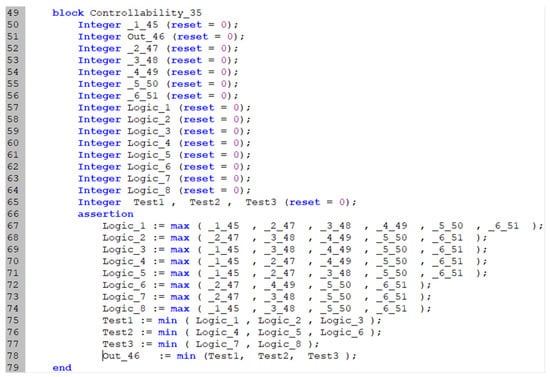
Figure 3.
AltaRica 3.0 code of the controllability block model, automatically edited to include flow variables (lines 57 to 65) and instructions (lines 67 to 78) representing the controllability assessment logic for the hexarotor PPNNPN case study provided in Section 3.1.
An instruction such as the minimum and maximum function requires testing all combinations of the values of their inputs to compile them into Boolean equations. For example, the PPNNPN hexarotor configuration with two extra coaxial rotors discussed in Section 4.3.4 has 72 controllable cases when considering up to 4 failures simultaneously. Assuming that each logic integer representing one controllable case can have seven different values (from 0 to 6), if these 72 cases are combined using a minimum function in a final instruction, this instruction requires testing 772 (~7 × 1060) possible combinations of inputs. This combinatorial explosion of tests is not computationally viable.
To minimize this effect, the combination of logic integers is divided into multiple instructions associated with test integers. To optimize computational effort, we minimize the maximum number of inputs for these intermediate instructions. Although multiple layers of intermediate instructions could further reduce the maximum number of inputs, a single-layer approach is chosen for simplicity.
Thus, minimizing the maximum number of inputs is achieved when the number of logic integers allocated to each instruction, denoted , and the number of test integers that are input to the final instruction, denoted , are equal. Since the optimal number of allocated logic integers is given by . In the previous example, the problematic instruction is divided into 9 intermediate instructions handling 8 logic integers, and one final instruction handling 9 test integers. This way, the maximum number of possible combinations to test for this final instruction is significantly reduced to a manageable number of 79 (~40,353,607). The example shown in Figure 3 has 9 controllable cases, and therefore the optimal number of test integers is 3.
The fundamental issue of combinatorial explosion arises because the AltaRica 3.0 model is automatically generated from another model in System Analyst 1.3, resulting in it not being optimized for the assessment tools AltaRicaWizard 1.2.0. While the implemented solution has proven efficient in its application to the case study, it could be limited to more complex reliability models. Addressing this limitation should be included in future work, which is expected to further increase the complexity of the reliability model. A possible solution could be to use Boolean variables instead of logic and test flow variables to optimize the generation of Boolean equations. However, the integer approach, inherent to the System Analyst 1.3 modeling environment, provides a solid basis for implementing various working and failure modes and their logical propagation throughout the system components. Future work will need to further address this risk of complexity issues while enabling the propagation of different working and failure modes.
In integrating AltaRica 3.0 and MATLAB R2022b, several coding challenges were encountered, including difficulty in distinguishing unordered inputs and outputs, ensuring proper syntax with commas, semicolons, and parentheses, and separating sections like Transition and Assertion into different lines within AltaRica 3.0 code. To address these issues, automated identification of inputs and outputs was implemented, and both syntax schemes and separate sections were stored in text variables to structure the code correctly.
3. Case Study
The hexarotor drone design was chosen for this case study due to its balance of simplicity and potential for varied fault tolerance capabilities, offering different reliability outcomes based on its configuration compared to quadrotors and octorotors. For instance, the conventional hexarotor PNPNPN configuration lacks fault tolerance under the requirement to maintain control of each axis, while the unconventional PPNNPN configuration provides some fault tolerance [24]. Additionally, the hexarotor was selected because of the availability of an in-house prototype, which provides detailed and accurate data for controllability and weight analysis. This makes the hexarotor design an ideal basis to illustrate the capability of the proposed methodology to effectively explore and evaluate both configuration and system design changes.
The case study involves the custom-designed hexarotor depicted in Figure 4. This design has a total weight of 3.48 kg, a rotor-to-rotor center diameter of 102 cm, a thrust-to-weight ratio of 2, and an autonomy of approximately 7 min in hover conditions. The maximum number of simultaneous rotor failures to be considered in the design is assumed to be two. This is because increasing the system’s capability to reconfigure for more failures also increases its complexity, development work, and the number of tests required to verify its effectiveness. Two failures are assumed to be a good balance between reliability and these drawbacks.
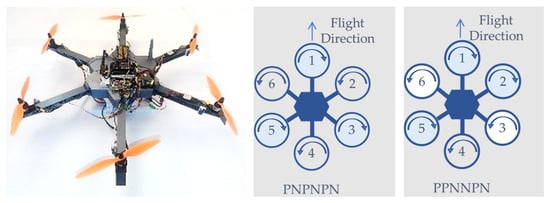
Figure 4.
Hexarotor case study photograph (left) extracted from [29], PNPNPN-configuration (center), and PPNNPP-configuration (right). The “P” designation represents rotors rotating clockwise, while “N” designates rotors rotating counterclockwise.
3.1. UAV Configuration, State, and Control Matrices
For a hexarotor design with propulsors located at equal distances (here, m) from the center of gravity at angles of 0°, 60°, 120°, 180°, 240°, and 300°, as illustrated in Figure 4, the positions in Cartesian coordinates are: , , , , , and . For the hexarotor PNPNPN configuration, based on alternating propeller rotations for yaw control, the control effectiveness matrix is:
where is the ratio of aerodynamic torque to propeller thrust. This coefficient captures the relationship between the thrust generated by a propeller and the resulting drag torque, which contributes to the yaw moment. Similarly, for the PPNNPN hexarotor configuration, the control effectiveness matrix is:
The state matrix and control matrix are identical for both the PNPNPN and PPNNPN hexarotor configurations. These matrices are derived from a linearized dynamics model for hover flight conditions, as described in Equation (3), with the assumption of negligible drag forces. The state vector is , where represents altitude, and , , and are the roll, pitch, and yaw angles, respectively [30]:
where , is the total mass of the UAV (in kg), and , , and are the moments of inertia around the x-, y-, and z-axes (in kg·m2), respectively. The moments of inertia and total mass for the custom-designed hexarotor, obtained from a 3D computer-aided design model, are:
3.2. Physical System Architecture and Failure Rates
In this study, we consider a simplified power, propulsion, and control system for multirotor UAVs, illustrated in Figure 5, which employs a simplex architecture—an architecture without redundancy. The components of this simplified architecture include:
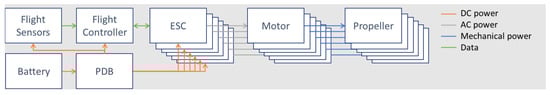
Figure 5.
Simplified simplex power, propulsion, and control system architecture for multirotor UAVs.
- Battery: Provides the necessary electrical direct current (DC) power to all components of the UAV. They are typically high-capacity lithium polymer (LiPo) batteries.
- Power Distribution Board (PDB): Distributes DC power from the battery to various components of the UAV, ensuring each component receives the appropriate power supply.
- Flight Sensors: Include inertial measurement units (IMUs), GPS modules, and other sensors that provide real-time feedback data on the UAV’s orientation, position, altitude, and velocity to the flight controller.
- Flight Controller: The central processing unit of the UAV responsible for processing input from the flight sensors and executing control algorithms to stabilize and navigate the UAV. It sends motor speed commands to the electronic speed controllers (ESCs) to maintain desired flight characteristics.
- ESC: An electronic component that acts as an electric power converter between the battery and the electric motor. The ESC receives motor speed commands from the flight controller and adjusts the power supplied to the motors, thereby controlling their speed.
- Electric Motor: Converts electrical power from the ESC into mechanical power to drive the propeller. For weight efficiency, it is typically a three-phase alternate current (AC) motor with permanent magnets and an outrunner arrangement, meaning the casing is part of the rotor.
- Propeller: Attached to the electric motor, the propeller generates thrust by spinning at high speeds. For simplicity and cost efficiency, it typically has a fixed pitch and an aerodynamic profile optimized for rotation in one direction, generating upward thrust only.
We assume that the reliability of each component follows an exponential cumulative probability distribution with constant failure rates, as provided in Table 2. These failure rate values are derived from transport category airplane data in [10], with an arbitrarily applied derating factor of 100 to reflect the quality of commercial drones.
Table 2.
Normalized weights and failure rate hypothesis.
4. Case Study Analysis and Optimization
To demonstrate the effectiveness of the developed method and tool, we analyze and optimize the reliability of the hexarotor case study presented in Section 3 following the method detailed in Section 2. The design is optimized iteratively, with each iteration involving a reliability sensitivity analysis to guide the implementation of redundancy measures. Alongside the reliability evaluation, we qualitatively assess the weight impact of these redundancy measures to provide perspective on the trade-offs involved in increasing the UAV design reliability.
We investigate two design scenarios. In the first scenario, we assume a highly dynamic typical flight mission that requires maintaining control of all axes [9,10] to ensure the drone can continue safe flight and landing after a failure. The iterations of this scenario are detailed in Section 4.3.1, Section 4.3.2, Section 4.3.3, Section 4.3.4, Section 4.3.5 and Section 4.3.6. In the second scenario, to further demonstrate the capability of the proposed method and tool, the design optimization process is repeated with a change in the controllability hypothesis. Here, it is assumed that the drone performs rather static typical flight missions and can execute an emergency landing immediately, sacrificing yaw control if necessary [25,26,27,28]. Thus, Scenario 2 requires revising the controllability analysis to exclude the yaw control axis requirement, as discussed in Section 2.3. The iterations of Scenario 2 are not detailed for conciseness. The results of both scenarios are summarized and compared in Section 4.3.7.
For simplicity, we assume components have a single mode of failure, such as an electric motor stopping without affecting the connected ESC and flight controller. Future work should revise this assumption to include more complex failure modes for more realistic design improvements.
4.1. Sensitivity Analysis: Fussell–Vesely Importance Factor
The sensitivity analysis aims to identify components with the greatest impact on system reliability that would benefit most from redundancy. This is achieved using the Fussell–Vesely Importance Factor [31,32], also referred to as the diagnostic importance factor. The Fussell–Vesely Importance Factor, denoted as , evaluates the probability that the UAV loss of control, , is due to the failure of the -the component.
Specifically, it represents the probability that at least one minimal cut set containing component has failed at time , given that the system has failed at time . It is expressed as [33]:
where is the probability of failure of the -th component, is the conditional probability of UAV loss of control at time given the -th component failure, and is the normalization factor. A higher value indicates that the component contributes more to the risk of UAV loss of control.
The normalization factor is defined as the sum of all the scores, ensuring that the values are scaled to provide a relative measure of importance for each component:
where is the total number of components.
The sensitivity is performed using the software tool XFTA 1.0 [33] embedded in the integrated modeling environment AltaRicaWizard Editor 1.2.0 [13], assuming a flight duration of = 1 h.
4.2. Qualitative Weight Evaluation
For simplicity, component weights are qualitatively evaluated using actual weight data from the in-house drone design presented in Figure 4. The weight of each component is normalized with respect to the total UAV weight. These normalized component weights are listed in Table 2.
When adding a component for redundancy, its weight is simply added to the total UAV weight. An exception is made for the battery weight, which is adjusted based on the number of ESCs it supplies. The battery weight in Table 2 corresponds to a design where a single battery powers six ESCs, and this weight is linearly scaled according to the actual number of ESCs supplied.
To account for the wiring weight of additional components, the total wiring weight is adjusted based on the number of electrical components in the architecture. The wiring weight in Table 2 corresponds to a design with sixteen electrical components, and this weight is linearly scaled according to the actual number of electrical components.
4.3. Results
4.3.1. Scenario 1—Iteration 1
Iteration 1 compares the PNPNPN and PPNNPN configurations. The control effectiveness, state, and control matrices of the simplex PNPNPN and PPNNPN hexarotor configurations, as described in Section 3.1, are input into the MATLAB script for the controllability assessment detailed in Section 2.3. The physical system architecture modeled in System Analyst 1.3 is shown in Figure 6. The controllability and reliability assessments are executed automatically and evaluate a probability of loss of control of 1.199 × 10⁻² for the PNPNPN configuration and a probability of loss of control of 7.6 × 10⁻³ for the PPNNPN configuration. The better results for the PPNNPN configuration align with its propulsor fault tolerance capability, while the PNPNPN has no fault tolerance as demonstrated in [24].
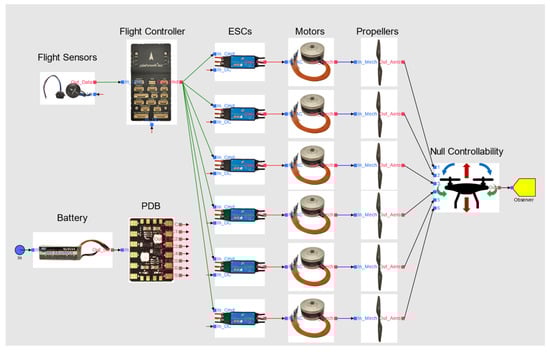
Figure 6.
Iterations 1 and 2—MBSA model of the power, propulsion, and control system architecture for multirotor UAVs in System Analyst 1.3.
Decision: Based on these results, the PPNNPN configuration is selected for further analysis and development.
4.3.2. Scenario 1—Iteration 2
Iteration 2 initiates the design optimization of the PPNNPN configuration. The controllability assessment performed in iteration 1 does not need to be repeated in iteration 2, as there is no change to the PPNNPN configuration at this stage. Since the system architecture serves as the baseline for qualitative weight evaluation, this qualitative weight is set to one. The results of the sensitivity analysis are presented in Table 3, highlighting only the components with a first-order effect on UAV loss of control, indicating single points of failure. In other words, if any of these components fail, UAV control is lost. The data in Table 3 highlights that the flight controller has the highest criticality.
Table 3.
Fussell–Vesely Importance Factors (first-order only) for Scenario 1 with full control axes requirement. The highest importance factors for each iteration are shown in bold.
Decision: Based on these findings, redundancy will be applied to the flight controller. A critical failure mode of the flight controller involves providing corrupted commands to the ESCs, necessitating a strategy to ensure its integrity. Two viable strategies that limit the addition of flight controllers to two are pair-and-spare and triple majority redundancy (TMR) [34], also known as majority-voting-based redundancy. The majority-voting-based redundancy is selected to avoid the delays associated with starting the spare controller in the pair-and-spare approach, which could lead to a loss of control.
4.3.3. Scenario 1—Iteration 3
The controllability assessment in iteration 1 remains unchanged due to the unaltered PPNNPN configuration. The system architecture now includes three flight controllers and a majority voter. The PDB has been updated to supply DC power from the battery to each flight controller. A databus distributes flight sensor data to each flight controller. The qualitative weight evaluation now accounts for the two additional flight controllers for majority-voting-based redundancy. The design’s probability of loss of control and qualitative weight are now 2.707 × 10⁻³ and 1.055, respectively. The sensitivity analysis results in Table 3 show that ESCs 5 and 6 have the highest criticality, as propulsors 5 and 6 are the only non-fault-tolerant propulsors in the PPNNPN configuration.
Decision: Based on these findings, redundancy will be applied to propulsors 5 and 6 by adding two sets of ESCs, motors, and propellers. These new motors and propellers will be installed coaxially with propulsors 5 and 6 and will rotate in the same direction as their coaxial counterparts.
4.3.4. Scenario 1—Iteration 4
The controllability effectiveness and assessment are updated to account for the coaxial propulsors 5 and 6. The qualitative weight evaluation now includes the two additional propulsors, resulting in a total qualitative weight of 1.224. The probability of loss of control is now 5.107 × 10⁻⁴. The results of the sensitivity analysis in Table 3 indicate that the flight sensors have the highest criticality.
Decision: Based on this result, redundancy will be applied to the flight sensors in the next iteration. To keep the design simple and avoid adding another majority voter, a set of flight sensors will be associated with each flight controller. This change will also allow for the removal of the databus used in design iteration 3.
4.3.5. Scenario 1—Iteration 5
The controllability assessment has been updated to account for the added flight sensors. The qualitative weight increases to 1.250 and the probability of loss of control has improved to 2.099 × 10⁻⁴. The sensitivity analysis results in Table 3 now indicate that the battery has the highest criticality.
Decision: Based on this result, redundancy will be applied to the battery in the next and final iteration.
4.3.6. Scenario 1—Iteration 6
The controllability assessment performed in iteration 4 remains unchanged. Using the graphical interface of System Analyst 1.3, the physical system architecture model is modified, and reliability is assessed multiple times for architectures with two and three batteries, each with various connection schemes to the flight controllers and ESCs. This analysis reveals that adding a single redundant battery, resulting in a two-battery design, offers negligible improvement in UAV flight control reliability unless both batteries are connected to all eight propulsors, which incurs a significant weight penalty. In contrast, a three-battery design significantly improves reliability without requiring each battery to connect to all flight controllers and ESCs. The optimal three-battery system architecture is illustrated in Figure 7. The connection between the batteries and the ESCs is managed by the PDB block, with the following connections: the three batteries to the flight sensors and the three flight controllers; battery 1 to ESCs 1, 3, 5, and 6; battery 2 to ESCs 2, 4, 5, and 6; and battery 3 to ESCs 7 and 8. With this final design change, the qualitative weight is now 1.347, and the probability of loss of control lowered to 1.120 × 10⁻⁴. The primary risk of failure is not due to a first-order issue but rather the simultaneous failure of any two flight controllers ().
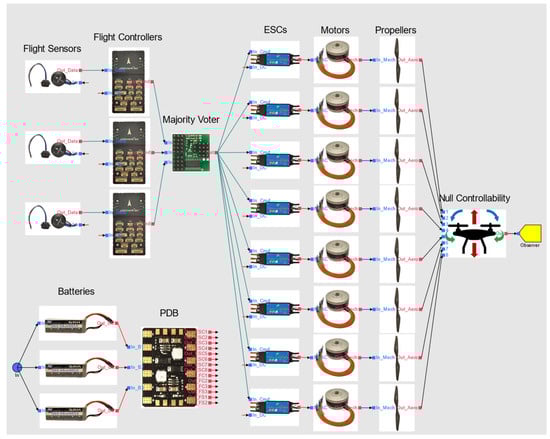
Figure 7.
Iteration 6—MBSA model of the power, propulsion, and control system architecture for multirotor UAVs in System Analyst 1.3.
To evaluate the impact of the hypothesis limiting the number of simultaneous failures that the system can accommodate by reconfiguring itself, we repeated the controllability analysis and integration assuming a maximum of three simultaneous failures, and then four. The controllability analysis shows that the hexarotor PPNNPN configuration with two extra coaxial rotors is not controllable with any combination of five or more rotor failures. With a three-simultaneous-failures limit, the probability of failure decreases slightly to 1.1061 × 10⁻⁴, and with a four-simultaneous-failures limit, it reduces insignificantly to 1.1060 × 10⁻⁴. These results confirm that it is not worth significantly increasing the complexity of the system design and its development to accommodate more than two simultaneous failures.
4.3.7. Summary
The results of the six design optimization iterations of Scenario 1 are summarized in Table 3 and Figure 8. Figure 8 illustrates the evolution of the probability of loss of control and the qualitative weight throughout the iterations, highlighting the impact of each design decision. Notably, it demonstrates the well-known principle that improving reliability becomes increasingly difficult with each design iteration [34], reaching, here, a plateau by iteration 4. In contrast, the design complexity and weight impact continue to rise. Additionally, as discussed in Section 4.3.6, the evaluations of increasing the number of simultaneous failures the system can handle show that accommodating more than two simultaneous failures results in marginal reliability improvements while significantly increasing system complexity and development effort.
The results of Scenario 2 are summarized in Table 4 and Figure 8. Additionally, Table 5 provides a comparison of the design changes in Scenarios 1 and 2. Scenario 2 displays a lower probability of failure due to the alleviated controllability requirements. There is also no advantage for the PPNNPN configuration, and the selection of this configuration is motivated by the comparison with Scenario 1. The change in controllability requirement removes the criticality of propulsors 5 and 6, thus no coaxial rotors are added in this scenario, providing significant weight savings. These results demonstrate that a change in the controllability hypothesis can significantly impact the optimal design, reliability, and weight outcomes and that the proposed methodology can rapidly evaluate these impacts.
Table 4.
Fussell–Vesely Importance Factors (first-order only) for Scenario 2 sacrificing yaw control requirement for emergency landing. The highest importance factors for each iteration are shown in bold.
Table 5.
Summary of the design changes.

Figure 8.
Evolution of probability of loss of control and qualitative weight throughout design optimization iterations. Refer to Table 5 for a description of the design iterations.
Figure 8.
Evolution of probability of loss of control and qualitative weight throughout design optimization iterations. Refer to Table 5 for a description of the design iterations.

There are few publications providing reliability figures for multirotor drones. Petritoli et al. [1] report a reliability level of approximately 10−3 per flight hour for generic drones. For conventional PNPNPN hexarotor designs, assuming the requirement for control of all axes in case of failure, Shi et al.’s model [4] returns a probability of failure of 6.58 × 10⁻³ per flight hour, Nazarudeen et al. [9] extrapolated result is 1.75 × 10⁻² assuming a failure rate derating factor of 100 for commercial applications, and Liscouët et al. [10] report 1.44 × 10⁻². These results are consistent with the present study’s finding of 1.2 × 10⁻² for PNPNPN hexarotor designs. For PPNNPN hexarotor designs, under similar assumptions and without redundancy optimization, Shi et al.’s model [4] provides a probability of failure of 2.2 × 10⁻³, while the present study finds 7.6 × 10⁻³. This indicates an increase in reliability with the PPNNPN configuration, though the present study shows only half the improvement compared to Shi’s study, likely due to the non-optimized system architecture. Under the assumption that yaw control can be sacrificed for an immediate emergency landing, Shi et al.’s model [4] provides a probability of failure of 7.25 × 10⁻⁶ per flight hour for both PNPNPN and PPNNPN hexarotor designs, while the present study finds 5.405 × 10⁻³ with a conventional system architecture and 1.125 × 10⁻⁴ with an optimized architecture. This discrepancy suggests that Shi et al.’s model prediction may not be realistic and highlights the importance of considering system architecture to effectively improve reliability.
5. Conclusions
This study presents a novel methodology that integrates advanced controllability assessment techniques, specifically Null Controllability (ACAI), with the MBSA framework, AltaRica 3.0, using the System Analyst 1.3 and AltaRicaWizard 1.2.0 modeling environments. This approach optimizes propulsor configurations and system architectures for multirotor UAVs. The key advancement is the joint optimization of propulsor configuration and system architecture, allowing for the evaluation of any configuration without limitations and accommodating changes in controllability hypotheses, such as accepting the loss of yaw control for immediate emergency landing. Combining these capabilities is not possible with state-of-the-art techniques. This method significantly reduces the effort required for each design iteration and enables efficient exploration of numerous and diverse design options.
The methodology was demonstrated through a hexarotor drone case study. Integrating Null Controllability with the MBSA framework provided an efficient way to model a wide range of configurations and system architectures, enabling the computation of reliability metrics like Fussell–Vesely Importance Factors to guide the implementation and optimization of redundancies. This approach offered valuable design insights, reducing the probability of loss of control by up to 99% while balancing qualitative weight impacts. Notably, the iterative design optimization process highlighted the increasing difficulty of enhancing reliability with each iteration and confirmed the rationale for limiting system design complexity to accommodate a maximum of two simultaneous failures for reconfigurability. It also demonstrated that a change in the controllability hypotheses can significantly impact optimal design, reliability, and weight outcomes. For conventional non-redundant designs, assuming the need for control of all axes in case of failure, the present study’s results align with previous studies, although those that disregard system architecture report slightly higher reliabilities. When assuming yaw control can be sacrificed for emergency landings, the discrepancy becomes significant, highlighting the crucial role of system architecture in effectively enhancing drone design reliability.
Regarding limitations, the study primarily considers a single failure mode for each component and a binary assessment of controllability, which may not encompass all real-world scenarios. A more granular controllability assessment, evaluating different levels of criticality such as hazardous, major, and minor [35], would allow for a more comprehensive safety and reliability analysis. Additionally, the qualitative sizing of components does not account for detailed weight impacts, which may affect the assessment of trade-offs between reliability improvements and overall system weight. Another limitation is the issue of combinatorial explosion, which arises because the AltaRica 3.0 model is automatically generated from another model, resulting in it not being optimized for the assessment tools. Although the implemented solution has proven efficient for the case study, it may be limited to more complex reliability models.
Therefore, future work should prioritize addressing various failure modes and incorporating wiring reliability for a more accurate reliability evaluation. Integrating advanced sizing tools such as FAST-UAV [10,36] would provide more precise and comprehensive weight and performance evaluations. Extending the controllability assessment to evaluate performance degradation across different levels of criticality will refine the safety and reliability analysis. Lastly, future work will need to tackle the complexity issues stemming from the conversion of the AltaRica 3.0 model, optimizing it for the assessment tools while enabling the propagation of different working and failure modes.
Author Contributions
Conceptualization, Z.M.R. and J.L.; methodology, Z.M.R. and J.L.; software, Z.M.R. and J.L.; validation, Z.M.R.; formal analysis, Z.M.R. and J.L.; investigation, Z.M.R. and J.L.; resources, J.L.; data curation, Z.M.R. writing—original draft preparation, Z.M.R.; writing—review and editing, J.L.; visualization, Z.M.R. and J.L.; supervision, J.L.; project administration, J.L.; funding acquisition, J.L. All authors have read and agreed to the published version of the manuscript.
Funding
This research was funded by the Natural Sciences & Engineering Research Council (NSERC) grant number [RGPIN-2022-05166].
Data Availability Statement
The primary codes and models used in this study are available in the GitHub repository: https://github.com/jliscouet/NullControllability_MBSA_DroneReliability (accessed 13 June 2024).
Acknowledgments
We sincerely thank Antoine B. Rauzy from the Norwegian University of Science and Technology and Tatiana Prosvirnova from The French Aerospace Lab ONERA for their invaluable support and prompt, helpful responses to our technical questions regarding AltaRica 3.0.
Conflicts of Interest
The authors declare no conflict of interest.
Nomenclature
| Abbreviations | |
| AC | Alternate Current |
| ACAI | Available Control Authority Index |
| DC | Direct Current |
| ESC | Electronic Speed Controller |
| FMEA | Failure Mode and Effect Analysis |
| FTA | Fault Tree Analysis |
| GPS | Global Positioning System |
| IMU | Inertial Measurement Unit |
| MBSA | Model-Based Safety Assessment |
| PDB | Power Distribution Board |
| PPNNPN | Rotor configuration: two clockwise, two counterclockwise, two clockwise |
| PNPNPN | Rotor configuration: alternating clockwise and counterclockwise |
| RBD | Reliability Block Diagram |
| UAV | Unmanned Aerial Vehicle |
| Latin Variables | |
| Set of instructions | |
| State matrix | |
| Instruction | |
| Control matrix | |
| Control effectiveness matrix | |
| Controllability matrix | |
| Propulsor center’s distance to center of gravity | |
| Set of events | |
| Event | |
| Probability of failure per flight hour | |
| Constraint set for the rotor thrust vector | |
| Rotor thrust vector | |
| Thrust of -th rotor | |
| Conditional probability of UAV loss of control | |
| Probability of failure of the -th component | |
| Vertical lift | |
| Boolean condition on variables | |
| Failure matrix of the j-th failure case | |
| Altitude | |
| Initialization function | |
| Fussell–Vesely Importance Factor of -th component | |
| , , | Moments of inertia |
| Inertia matrix | |
| Total number of failure cases to be assessed | |
| Maximum number of simultaneous rotor failures | |
| Aerodynamic torque/thrust coefficient | |
| Matrix of controllable cases | |
| , , | Pitch, roll, and yaw moments |
| Number of state variables | |
| Total mas of the UAV | |
| Number of forces and moments acting on the vehicle | |
| Total number of components | |
| Number of logic integers allocated to each instruction | |
| Number of test integers that are inputs to the final instruction | |
| Normalization factor | |
| Number of control effectors (i.e., rotors) | |
| Number of controllable cases | |
| Cartesian coordinates of -th rotor | |
| Set of transitions | |
| Time | |
| Transition | |
| Vector of forces and moments acting on the vehicle | |
| Set of state and flow variables | |
| Vertical velocity | |
| Qualitative weight | |
| State vector | |
| Greek Variables | |
| Rotor availability | |
| , , | Roll, pitch, and yaw angles |
| Virtual control vector constraint set | |
| Complementary set of | |
| Boundary of | |
| Available Control Authority Index (ACAI) | |
| Superscripts and Subscripts | |
| Denotes the effect of the j-th failure case | |
| Denotes the maximum value | |
| 0 | Denotes the reference state |
References
- Petritoli, E.; Leccese, F.; Ciani, L. Reliability and Maintenance Analysis of Unmanned Aerial Vehicles. Sensors 2018, 18, 3171. [Google Scholar] [CrossRef] [PubMed]
- Franco, B.; Góes, L.C.S. Failure Analysis Methods in Unmanned Aerial Vehicle (UAV) Applications. In Proceedings of the COBEM 2007, Brasilia, Brazil, 5–8 November 2007; ABCM: Brasília, Brazil, 2017; p. 11. [Google Scholar]
- Venkataraman, R.; Lukátsi, M.; Vanek, B.; Seiler, P. Reliability Assessment of Actuator Architectures for Unmanned Aircraft. IFAC-PapersOnLine 2015, 48, 398–403. [Google Scholar] [CrossRef][Green Version]
- Shi, D.; Yang, B.; Quan, Q. Reliability Analysis of Multicopter Configurations Based on Controllability Theory. In Proceedings of the 2016 35th Chinese Control Conference (CCC), Chengdu, China, 27–29 July 2016; pp. 6740–6745. [Google Scholar]
- Wang, Q.; Mao, J.; Wei, H. Reliability Analysis of Multi-Rotor UAV Based on Fault Tree and Monte Carlo Simulation. In Advances in Mechanical Design, Proceedings of the 2017 International Conference on Mechanical Design (ICMD2017), Prague, Czech Republic, 6–8 September 2017; Tan, J., Gao, F., Xiang, C., Eds.; Springer: Singapore, 2018; pp. 1525–1534. [Google Scholar]
- Aslansefat, K.; Marques, F.; Mendonça, R.; Barata, J. A Markov Process-Based Approach for Reliability Evaluation of the Propulsion System in Multi-Rotor Drones. In Technological Innovation for Industry and Service Systems, Proceedings of the 10th IFIP WG 5.5/SOCOLNET Advanced Doctoral Conference on Computing, Electrical and Industrial Systems, DoCEIS 2019, Costa de Caparica, Portugal, 8–10 May 2019; Camarinha-Matos, L.M., Almeida, R., Oliveira, J., Eds.; Springer International Publishing: Cham, Switzerland, 2019; pp. 91–98. [Google Scholar]
- T., T.; Govind, S.; Roy, A.; Ng, B.F.; Low, K.H. A Reliability Framework for Safe Octorotor UAV Flight Operations. In Proceedings of the 2023 International Conference on Unmanned Aircraft Systems (ICUAS), Warsaw, Poland, 6–9 June 2023; pp. 1013–1020. [Google Scholar]
- Guo, J.; Elsayed, E.A. Reliability of Balanced Multi-Level Unmanned Aerial Vehicles. Comput. Oper. Res. 2019, 106, 1–13. [Google Scholar] [CrossRef]
- Nazarudeen, S.B.; Liscouët, J. State-of-the-Art and Directions for the Conceptual Design of Safety-Critical Unmanned and Autonomous Aerial Vehicles. In Proceedings of the 2021 IEEE International Conference on Autonomous Systems (ICAS), Montreal, QC, Canada, 11–13 August 2021; IEEE: Piscataway, NJ, USA, 2021; pp. 1–5. [Google Scholar]
- Liscouët, J.; Pollet, F.; Jézégou, J.; Budinger, M.; Delbecq, S.; Moschetta, J.-M. A Methodology to Integrate Reliability into the Conceptual Design of Safety-Critical Multirotor Unmanned Aerial Vehicles. Aerosp. Sci. Technol. 2022, 127, 107681. [Google Scholar] [CrossRef]
- Batteux, M.; Prosvirnova, T.; Rauzy, A.; Kloul, L. The AltaRica 3.0 Project for Model-Based Safety Assessment. In Proceedings of the 11th IEEE International Conference on Industrial Informatics (INDIN), Bochum, Germany, 29–31 July 2013; pp. 741–746. [Google Scholar]
- Breton, S.; Le-Com, P.; Thomas, T.; Clement, E. System-Analyst—Un Outil MBSA Pour L’analyse Des Risques, Libre De Diffusion Et Compatible Avec Arbre-Analyste Et Open-Altarica. In Proceedings of the Congrès Lambda Mu 21 «Maîtrise des Risques et Transformation Numérique: Opportunités et Menaces», Reims, France, 16–18 October 2018; p. hal-02063690. [Google Scholar]
- Batteux, M.; Prosvirnova, T.; Rauzy, A. A Guided Tour of AltaRica Wizard, the AltaRica 3.0 Integrated Modeling Environment. In Proceedings of the 32nd European Safety and Reliability Conference (ESREL 2022), Dublin, Ireland, 28 August–1 September 2022; p. hal-03785784. [Google Scholar]
- Lambe, A.B.; Martins, J.R.R.A. Extensions to the Design Structure Matrix for the Description of Multidisciplinary Design, Analysis, and Optimization Processes. Struct. Multidisc. Optim. 2012, 46, 273–284. [Google Scholar] [CrossRef]
- Martins, J.; Ning, A. Engineering Design Optimization; Cambridge University Press: Cambridge, UK, 2021; ISBN 978-1-108-83341-7. [Google Scholar]
- Quan, Q. Introduction to Multicopter Design and Control; Springer: Berlin/Heidelberg, Germany, 2017. [Google Scholar]
- Faisandier, A. Systems Architecture and Design; Practical Guidelines; Sinergy’Com: Belberaud, France, 2013; Volume 3, ISBN 979-10-91699-03-7. [Google Scholar]
- ISO/IEC 26702:2007; Systems Engineering—Application and Management of the Systems Engineering Process. ISO: Geneva, Switzerland, 2007.
- Sun, M.; Gautham, S.; Ge, Q.; Elks, C.; Fleming, C. Defining and Characterizing Model-Based Safety Assessment: A Review. Saf. Sci. 2024, 172, 106425. [Google Scholar] [CrossRef]
- Batteux, M.; Prosvirnova, T.; Rauzy, A. AltaRica 3.0 Language Specification; AltaRica Association: Les Essarts le Roi, France, 2015; Available online: https://www.openaltarica.fr/docs/AltaRica%203.0%20Language%20Specification%20-%20v1.1.pdf (accessed on 13 June 2024).
- Rauzy, A.B. Guarded Transition Systems: A New States/Events Formalism for Reliability Studies. Proc. Inst. Mech. Eng. Part O J. Risk Reliab. 2008, 222, 495–505. [Google Scholar] [CrossRef]
- Batteux, M.; Prosvirnova, T.; Rauzy, A.B. AltaRica 3.0 in Ten Modelling Patterns. Int. J. Crit. Comput.-Based Syst. 2019, 9, 133–165. [Google Scholar] [CrossRef]
- Batteux, M.; Prosvirnova, T.; Rauzy, A.; Yang, L. Reliability Assessment of Phased-Mission Systems with AltaRica 3.0. In Proceedings of the 2018 3rd International Conference on System Reliability and Safety (ICSRS), Barcelona, Spain, 23–25 November 2018; pp. 400–407. [Google Scholar]
- Du, G.-X.; Quan, Q.; Yang, B.; Cai, K.-Y. Controllability Analysis for Multirotor Helicopter Rotor Degradation and Failure. J. Guid. Control Dyn. 2015, 38, 978–985. [Google Scholar] [CrossRef]
- Freddi, A.; Lanzon, A.; Longhi, S. A Feedback Linearization Approach to Fault Tolerance in Quadrotor Vehicles. IFAC Proc. Vol. 2011, 44, 5413–5418. [Google Scholar] [CrossRef]
- Lippiello, V.; Ruggiero, F.; Serra, D. Emergency Landing for a Quadrotor in Case of a Propeller Failure: A Backstepping Approach. In Proceedings of the 2014 IEEE/RSJ International Conference on Intelligent Robots and Systems, Chicago, IL, USA, 14–18 September 2014; pp. 4782–4788. [Google Scholar]
- Mueller, M.W.; D’Andrea, R. Stability and Control of a Quadrocopter despite the Complete Loss of One, Two, or Three Propellers. In Proceedings of the 2014 IEEE International Conference on Robotics and Automation (ICRA), Hong Kong, China, 31 May–7 June 2014; pp. 45–52. [Google Scholar]
- Lanzon, A.; Freddi, A.; Longhi, S. Flight Control of a Quadrotor Vehicle Subsequent to a Rotor Failure. J. Guid. Control Dyn. 2014, 37, 580–591. [Google Scholar] [CrossRef]
- Liscouët, J.; Uwantare, I.; Remoundos, A.; Desrosiers, J.; Heit, Z.; Senouci, A.; Chen, O. Validation of Reliability-Based Flight Control Optimization for UAVs. In Proceedings of the AIAA SCITECH 2024 Forum, Orlando, FL, USA, 8–12 January 2024; p. AIAA 2024-0341. [Google Scholar]
- Du, G.-X.; Quan, Q.; Cai, K.-Y. Controllability Analysis and Degraded Control for a Class of Hexacopters Subject to Rotor Failures. J. Intell. Robot. Syst. 2015, 78, 143–157. [Google Scholar] [CrossRef]
- Fussell, J.B. How to Hand-Calculate System Reliability and Safety Characteristics. IEEE Trans. Reliab. 1975, R-24, 169–174. [Google Scholar] [CrossRef]
- Vesely, W.E. A Time-Dependent Methodology for Fault Tree Evaluation. Nucl. Eng. Des. 1970, 13, 337–360. [Google Scholar] [CrossRef]
- Rauzy, A.B. Probabilistic Safety Analysis with XFTA; AltaRica Association: Les Essarts le Roi, France, 2020; ISBN 978-82-692273-0-7. [Google Scholar]
- Hecht, H. Systems Reliability and Failure Prevention; Artech House Inc.: Norwood, MA, USA, 2004; ISBN 1-58053-372-8. [Google Scholar]
- SAE International. Guidelines and Methods for Conducting the Safety Assessment on Civil Airborne Systems and Equipment; SAE International: Warrendale, PA, USA, 1996. [Google Scholar]
- Pollet, F.; Delbecq, S.; Budinger, M.; Moschetta, J.-M.; Liscouët, J. A Common Framework for the Design Optimization of Fixed-Wing, Multicopter and VTOL UAV Configurations. In Proceedings of the ICAS 2022 Congress, Stockholm, Sweden, 4–9 September 2022. [Google Scholar]


Disclaimer/Publisher’s Note: The statements, opinions and data contained in all publications are solely those of the individual author(s) and contributor(s) and not of MDPI and/or the editor(s). MDPI and/or the editor(s) disclaim responsibility for any injury to people or property resulting from any ideas, methods, instructions or products referred to in the content. |
© 2024 by the authors. Licensee MDPI, Basel, Switzerland. This article is an open access article distributed under the terms and conditions of the Creative Commons Attribution (CC BY) license (https://creativecommons.org/licenses/by/4.0/).