Article

Simulation Analysis of the Annular Liquid Disturbance Induced by Gas Leakage from String Seals During Annular Pressure Relief

1
Northwest Sichuan Division of Petro China Southwest Oil & Gas Field Company, Jiangyou 621741, China
2
State Key Laboratory of Oil and Gas Reservoir Geology and Exploitation, Southwest Petroleum University, Chengdu 610500, China
*
Author to whom correspondence should be addressed.
Modelling 2024, 5(4), 1674-1686; https://doi.org/10.3390/modelling5040087
Submission received: 5 October 2024 / Revised: 22 October 2024 / Accepted: 4 November 2024 / Published: 8 November 2024
(This article belongs to the Topic Oil and Gas Pipeline Network for Industrial Applications)

Abstract

:
Due to the failure of string seals, gas can leak and result in the abnormal annulus pressure in gas wells, so it is necessary to relieve the pressure in gas wells. In the process of pressure relief, the leaked gas enters the annulus, causes a the great disturbance to the annulus flow field, and thus reduces the protection performance of the annular protection fluid in the string. In order to investigate the influence of gas leakage on the annular flow field, a VOF finite element model of the gas-liquid two-phase flow disturbed by gas leakage in a casing was established to simulate the transient flow field in the annular flow disturbed by gas leakage, and the influences of leakage pressure differences, leakage direction, and leakage time on annular flow field disturbance and wall shear force were analyzed. The analysis results showed that the larger leakage pressure difference corresponded to the faster diffusion rate of the leaked gas in the annulus, the faster the flushing rate of the leaked gas against the casing wall, and a larger shear force on the tubing wall was detrimental to the formation of the corrosion inhibitor film on the tubing wall and casing wall. Under the same conditions, the shear action on the outer wall of tubing in the leakage direction of 90° was stronger than that in the leakage directions of 135° and 45° and the diffusion range was also larger. With the increase in leakage time, leaked gas further moved upward in the annulus and the shear effect on the outer wall of tubing was gradually strengthened. The leaked acid gas flushed the outer wall of casing, thus increasing the peeling-off risk of the corrosion inhibitor film. The study results show that the disturbance law of gas leakage to annular protection fluid is clear, and it was suggested to reduce unnecessary pressure relief time in the annulus to ensure the safety and integrity of gas wells.

1. Introduction

The abnormal pressure in the wellhead annulus is caused by gas leakage and channeling in case of a seal failure [1,2,3] and seriously affects the production safety of gas wells. The phenomenon of annular pressure is particularly common in the production of high-temperature and high-pressure gas wells, and it is necessary to relieve the pressure of gas wells when the annular pressure threshold is exceeded [4,5]. Injecting the annular protection fluid into the annulus is an important measure to reduce the casing damage caused by corrosive gas [6,7]. In the annular pressure relief process, the gas leaked into the annulus may cause a major disturbance to the annular flow field and destroy the corrosion inhibitor film attached to the tube wall [8,9]. When corrosive gases such as hydrogen sulfide and carbon dioxide leak into the annulus, they corrode the casing string, and it is difficult to ensure the normal function of the annulus protection fluid [10,11,12]. Therefore, it is necessary to explore the annular flow field disturbed by gas leakage and analyze the disturbance of annular protection fluid caused by gas leakage so as to reduce the risk to the safety of gas wells and improve the wellbore corrosion protection performance.
Recently, different gas leakage conditions and casing string corrosion have been extensively explored at home and abroad. Montiel et al. [13] proposed the calculation model of gas release for the first time. Kostowsk et al. [14] proposed a leakage model with a discharge coefficient and indicated that the discharge coefficient should be considered in the case of medium-pressure pipeline leakage so as to ensure the experimental accuracy. Liu et al. [15] conducted a two-dimensional study on the gas leakage from pipelines during the pressure disturbance based on the consideration of both steady and unsteady flows. Li et al. [16] established a three-dimensional leakage model of submarine natural gas pipelines in ANSYS FLUENT R1 and proposed the relationship between leakage rate and leakage aperture. Oke et al. [17] established a three-dimensional unsteady leakage model of pipelines and analyzed the boundary conditions of the upstream and downstream leakage of pipelines. Nouri and Ziaei [18] simplified a leakage model of buried high-pressure pipelines into a one-dimensional model and studied the effects of wall heat transfer rate, friction, inlet temperature, Mach number, and other parameters on gas leakage based on the consideration of compressible flows. Moloudi and Esfahani [19] used Euler’s equation to study dimensionless gas release parameters in transient compressible flows and indicated that the gas leakage rate of the hole model was independent of friction factors. Ebrahimi-Moghadam et al. [20] established a three-dimensional leakage model of a buried natural gas pipeline, indicated the cross-section distributions of pressure and velocity at the leakage points of a pipeline; analyzed the correlations between pipeline diameter, aperture, and gas flow pressure; and obtained the corresponding calculation function. Jing et al. [21] conducted corrosion experiments of different casing materials CO2 under different temperature and partial pressure conditions, created a coupling model of a combined two-phase flow wellbore temperature and pressure, and established a reverse propagation neural network corrosion rate prediction model optimized based on a genetic algorithm, which can be used to predict corrosion rate along wellbore depth. Li et al. [22] developed a one-dimensional model based on the finite element method to predict the physical and chemical phenomena of carbon steel corrosion in supercritical CO. Mubarak et al. [23] proposed that the failure of J55 pipe was mainly due to the degree of corrosion of CO2 material accelerated by chloride ions, so that the remaining wall thickness did not have the structural integrity to withstand the longitudinal stress. Due to complex underground working conditions, gas rapidly disperses after entering the oil jacket annulus along the leak hole under high temperature, high pressure, and high sulfur content, disturbing the flow field of the annular protective fluid, reducing the performance of the annular protective fluid, corroding the oil casing string, and damaging wellbore integrity [24]. However, the current research results on pipeline leakage mainly focus on natural gas pipelines [25,26,27,28]. There are few reports on the disturbance of annular protective fluid caused by gas leakage due to the effective sealing of wellbore tubing, and the disturbance law of gas leakage on annular protective fluid is not clear, so it is urgent for numerical simulation research on gas well leakage in annular flow fields to be carried out.
Therefore, in this paper, the flow field of natural gas leakage in the casing annulus was simulated with the CFD method and the flow distribution in the leakage flow field was simulated by the finite element method in order to reveal the disturbance of leaked gas under various leakage directions, leakage pressure differences, and leakage times into the annulus protection fluid. This study provides the basis for wellbore integrity protection.

2. Numerical Simulation Method

2.1. Governing Equations of Fluid Motion

Natural gas can be regarded as a compressible gas. The main gas components are methane (87%), ethane (9%), carbon dioxide (2%), and hydrogen sulfide (2%). The gas flow rate in a gas well is stable and unchanged. In other words, gas leakage is continuous and stable for a long time and the annulus protection fluid is regarded as static water. The gas temperature in the wellbore is 300 K, and the temperature of the annulus protection fluid is 280 K. The turbulent flow generated by casing leakage is the basic motion form of fluids and follows the basic conservation law of fluids. The basic conservation laws involved in fluid motion include the law of mass conservation, the law of momentum conservation, and the law of energy conservation. The governing equations of fluid mechanics are closed equations composed of the mathematical equations of the above conservation laws, namely the continuity equation, momentum equation, and energy equation. In computational fluid mechanics, numerical methods are used to solve the basic governing equations of fluid mechanics.

2.1.1. Continuity Equation

The continuity equation describes the changes in density distribution and mass distribution in the motion of a certain volume of fluid. The velocity distribution of fluid particles is also affected by the changes.
ρ t + ( ρ u x ) x + ( ρ u y ) y + ( ρ u z ) z = 0
where ux, uy, and uz are, respectively, the velocity components in X. Y, and Z directions, in m/s; t is time, in s; and ρ is the density, in kg/m3.

2.1.2. Energy Equation

The energy equation is derived from the first law of conservation of energy, which states that energy is neither created nor lost and only changed from one form to another or from one object to another. However, the total energy of an isolated system remains constant.
( ρ E ) t + [ u ( ρ E + p ) ] = [ K e f f T j h j J j + ( τ e f f · u ) ] + S h
where E is the total energy of the fluid element (including internal energy, kinetic energy, and potential energy), in J/kg; hj is the enthalpy of component j; keff is the effective heat conduction coefficient, in W/(m·K); Jj is the diffusion flux of component j; and Sh includes the chemical reaction heat and other volume heat source terms defined by users.

2.1.3. Momentum Equation

The momentum equation is derived from the law of conservation of momentum. In other words, the total momentum of an object remains constant in the absence of an external force.
ρ ( u x t + u x u x x + u y u y y + u z u z z ) = p x + μ ( 2 u x x 2 + 2 u x y 2 + 2 u x z 2 ) + F x
ρ ( u y t + u x u x x + u y u y y + u z u z z ) = p y + μ ( 2 u y x 2 + 2 u y y 2 + 2 u y z 2 ) + F y
ρ ( u z t + u x u x x + u y u y y + u z u z z ) = p z + μ ( 2 u z x 2 + 2 u z y 2 + 2 u z z 2 ) + F z
where p is the pressure acting on the fluid, in N·s/m2; μ is the dynamic viscosity coefficient; Fx, Fy, and Fz are the unit mass forces in three directions, in N.

2.1.4. Turbulence Model

Due to the complexity of turbulent motion, it is impossible to obtain the exact solution of the motion equation in the calculation of fluid mechanics. The casing leakage flow field is a typical impingement jet flow field, so the feasible k-ε model is chosen as the turbulence model in this paper. The standard k-ε model is a two-equation turbulence model, in which the turbulent viscosity factor is a function of the parameters of k and ε. The k and ε equations are defined as follows.
x i ( ρ k u i ) = x j [ ( μ + μ t σ k ) k x j ] + G k + G b Y M ρ ε
x i ( ρ ε u i ) = x j [ ( μ + μ t σ ε ) k x j ] + C 1 ε ε k ( G k ) C 2 ε ρ ε 2 k
where Gk is the turbulent kinetic energy generated by the mean velocity gradient, in J/kg; Gb is the turbulent kinetic energy generated by buoyancy, in J/kg; YM is the proportion of pulsating expansion to the overall dissipation rate in the compressible turbulence; and μt is the turbulent viscosity, in Pa·s.

2.2. Geometric Models and Meshing

According to the wellbore parameters and leakage characteristics of oil and gas wells, gas enters the annulus due to the aperture caused by the wellbore seal failure and disturbs the annular protection fluid. The leakage model involves annular casing, leakage hole, and tubing. According to wellbore parameters and leakage characteristics of oil and gas wells, the leakage model considered annulus, leakage hole, and tubing. The casing length was 1000 mm. The inner diameter and outer diameter of tubing were, respectively, 62 mm and 73 mm. The inner diameter of casing was 146 mm. The leakage hole diameter was 0.3 mm, and the leakage length was 5.5 mm. The geometric model is shown in Figure 1a. In the flow field, the high-pressure gas flowed into the annulus through the leakage hole and changed dramatically. Therefore, the connection between the leakage hole and tubing/annulus was selected as the key area to be analyzed and the grids near the connection were meshed to improve the calculation accuracy (Figure 1b).
In order to explore the influences of different leakage directions on the flow field in the annulus, three leakage direction modes were considered. As shown in Figure 2a, the angle between the leakage direction and the direction of the tubing axis at the leakage point is 90°. As shown in Figure 2b,c, the upward direction is the positive direction and the positive directions between the leakage direction and the tubing axis at the leakage point are 45° and 135°, respectively.

2.3. Mesh Independence Verification

In order to prove the independence of the calculation results and the number of calculated cells, two grid models with different number of cells were generated, and the grid quality of two models with different number of cells was compared and analyzed, as shown in Table 1. The grid quality of the two models was similar. The wall shear force at the monitoring point under 5 MPa pressure difference was simulated and analyzed. As shown in Figure 3, the relative difference between the wall shear force of the model with 69,184 units and the model with 100,717 units at different times was less than 1%. The grid division of the model was relatively reasonable, and the selection of a lower number of grids saved computing power.

3. Results and Discussion

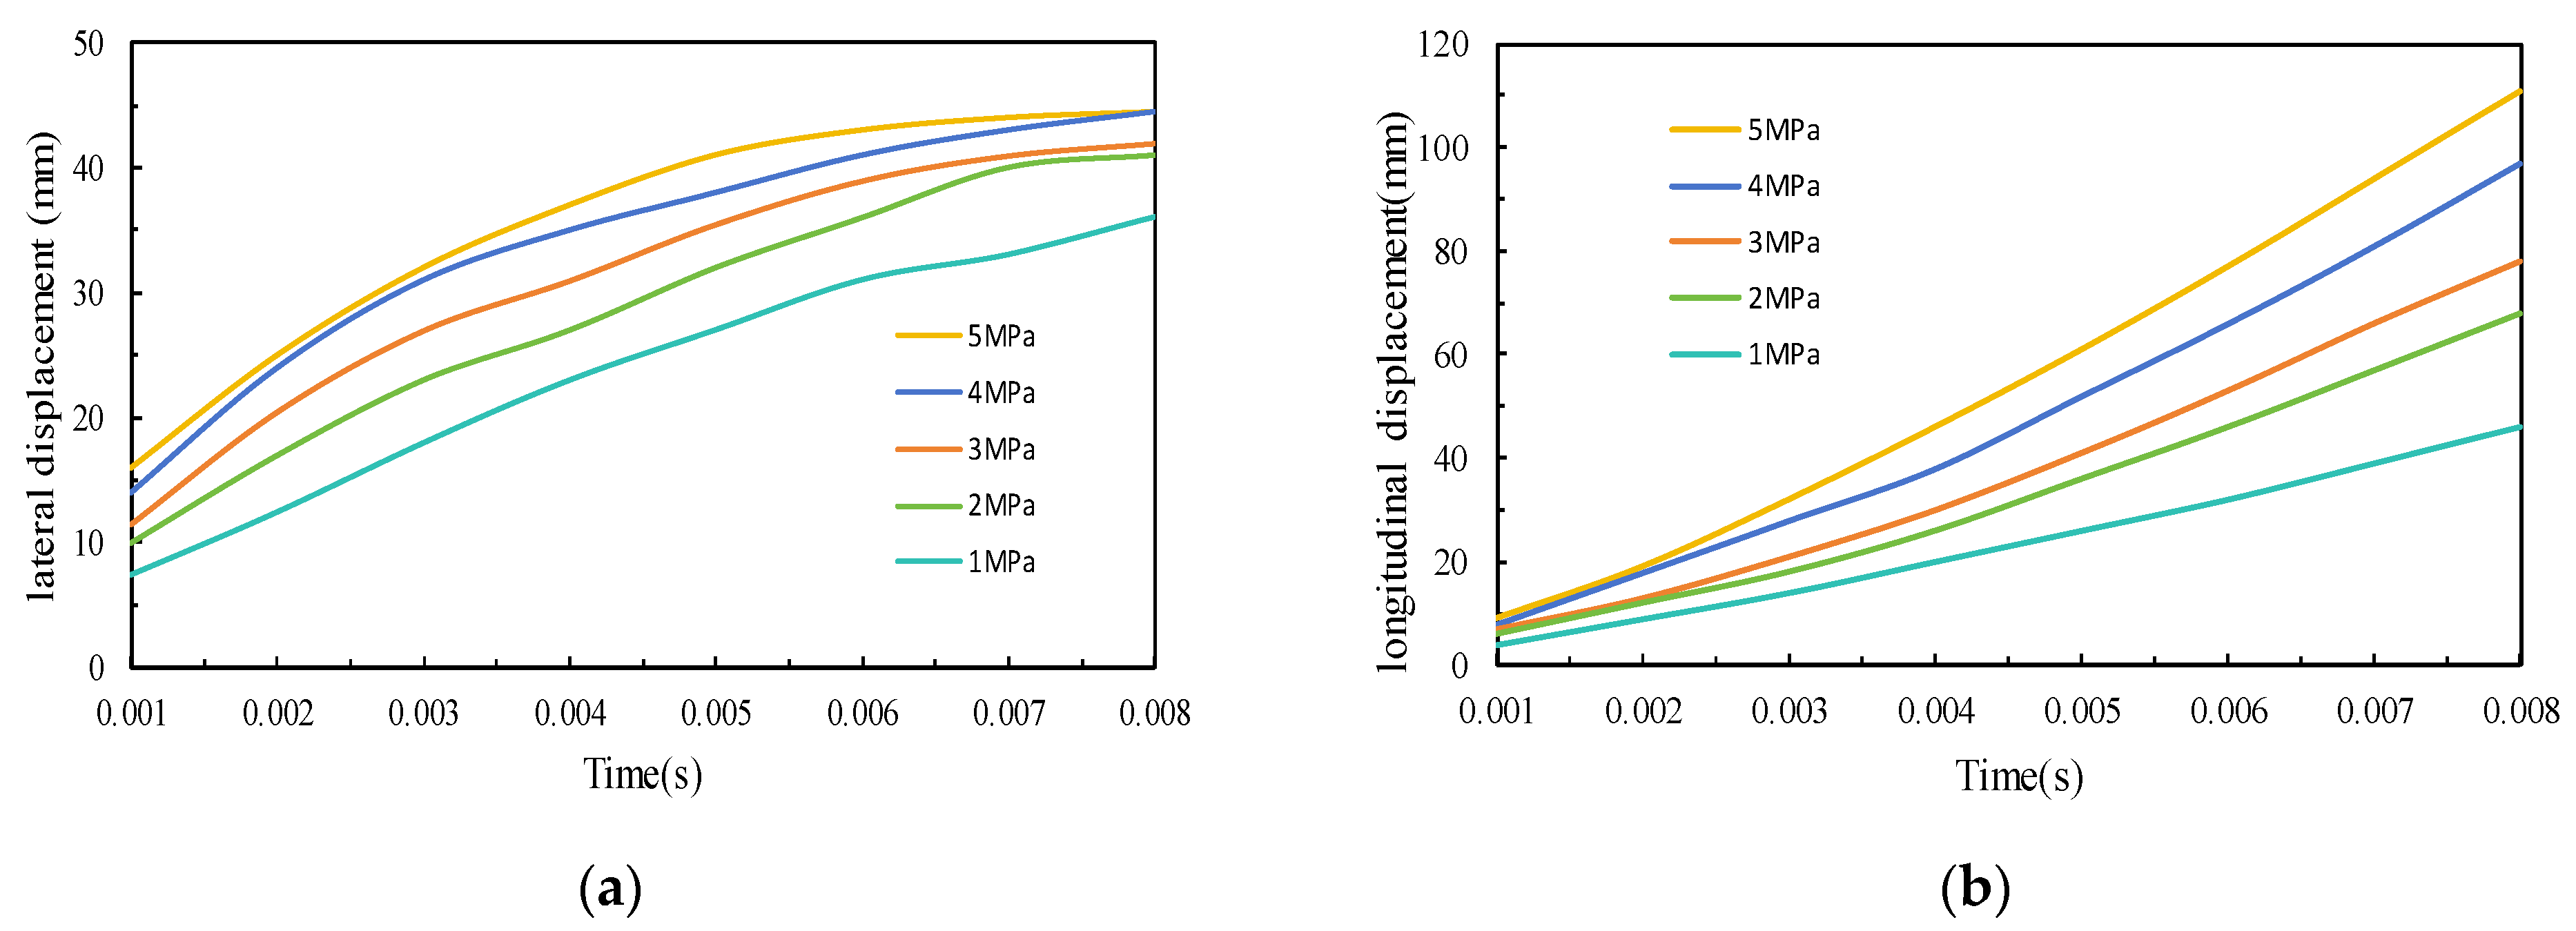
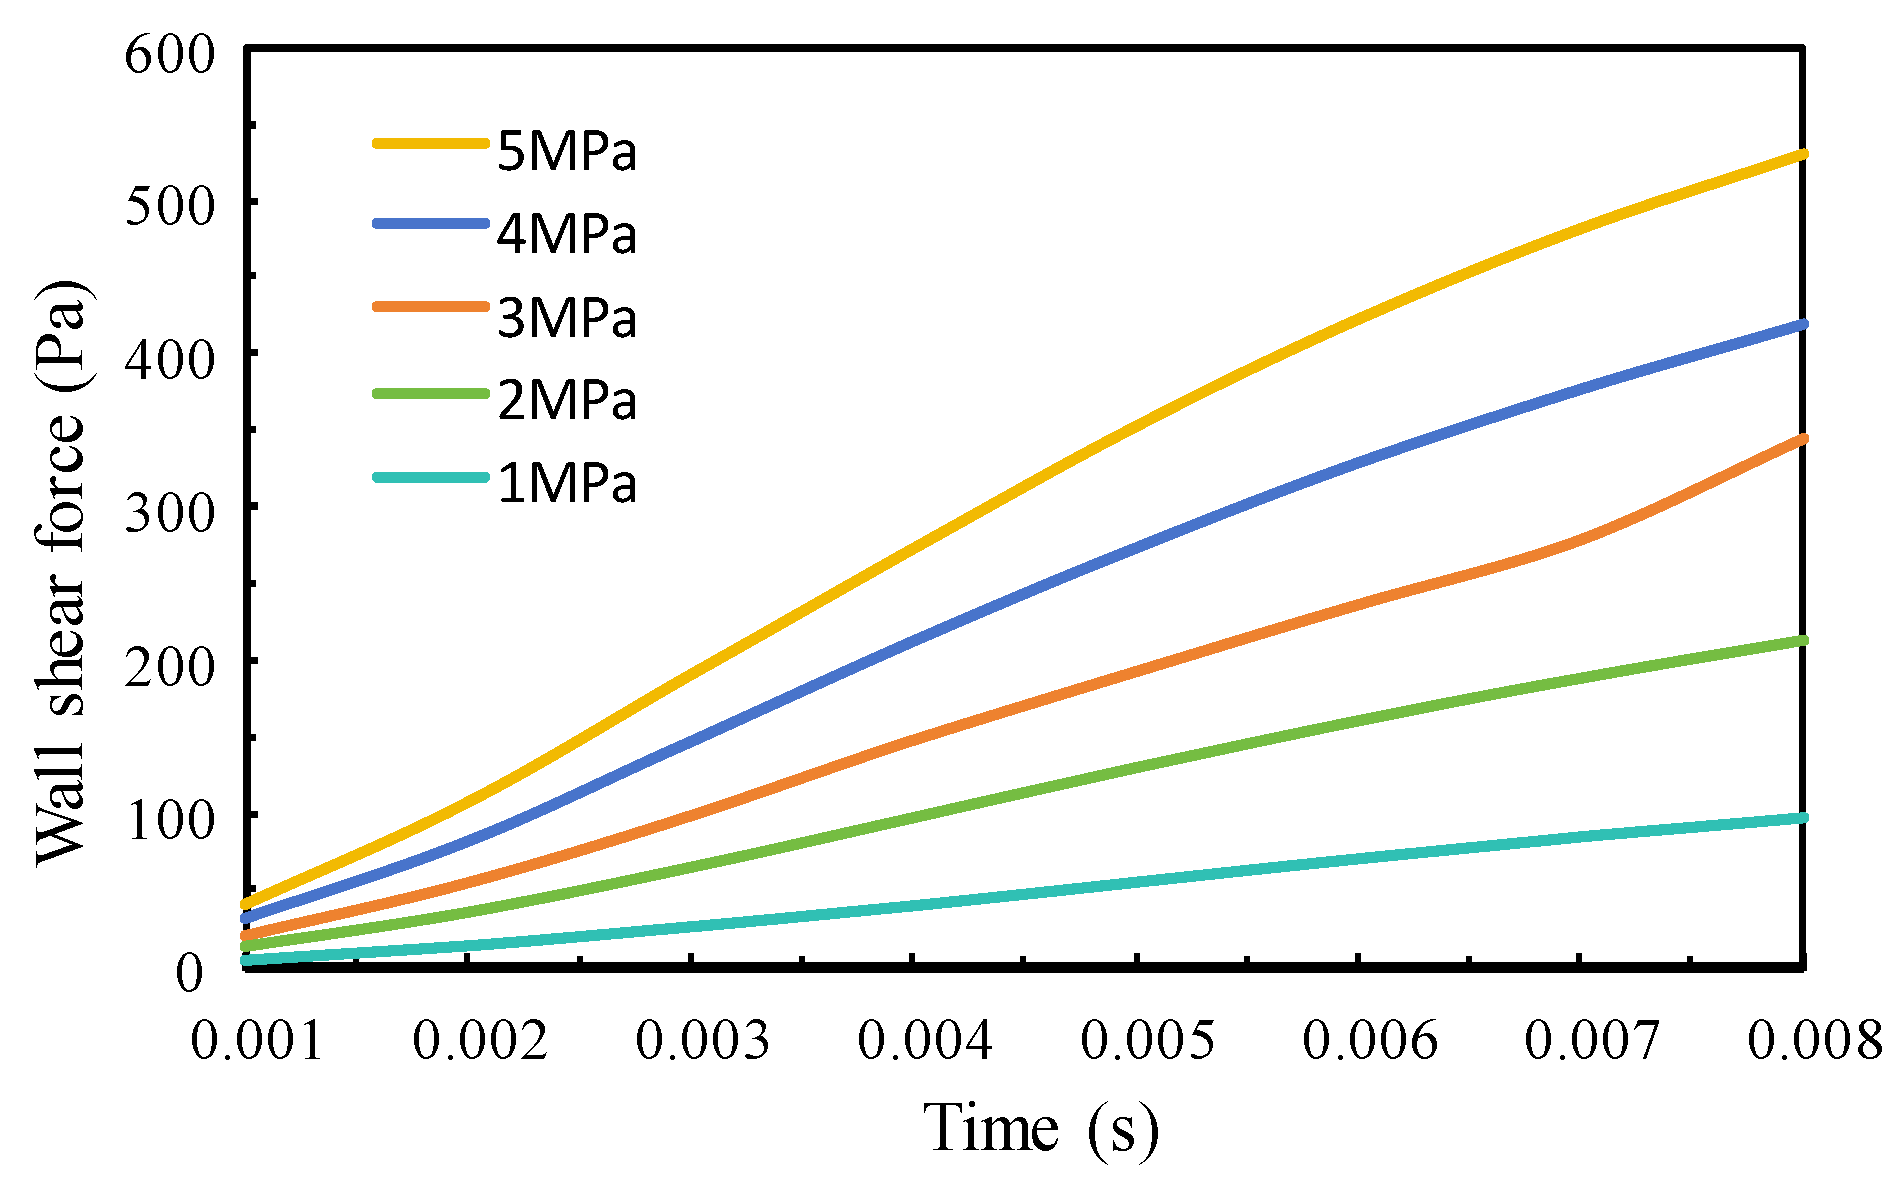
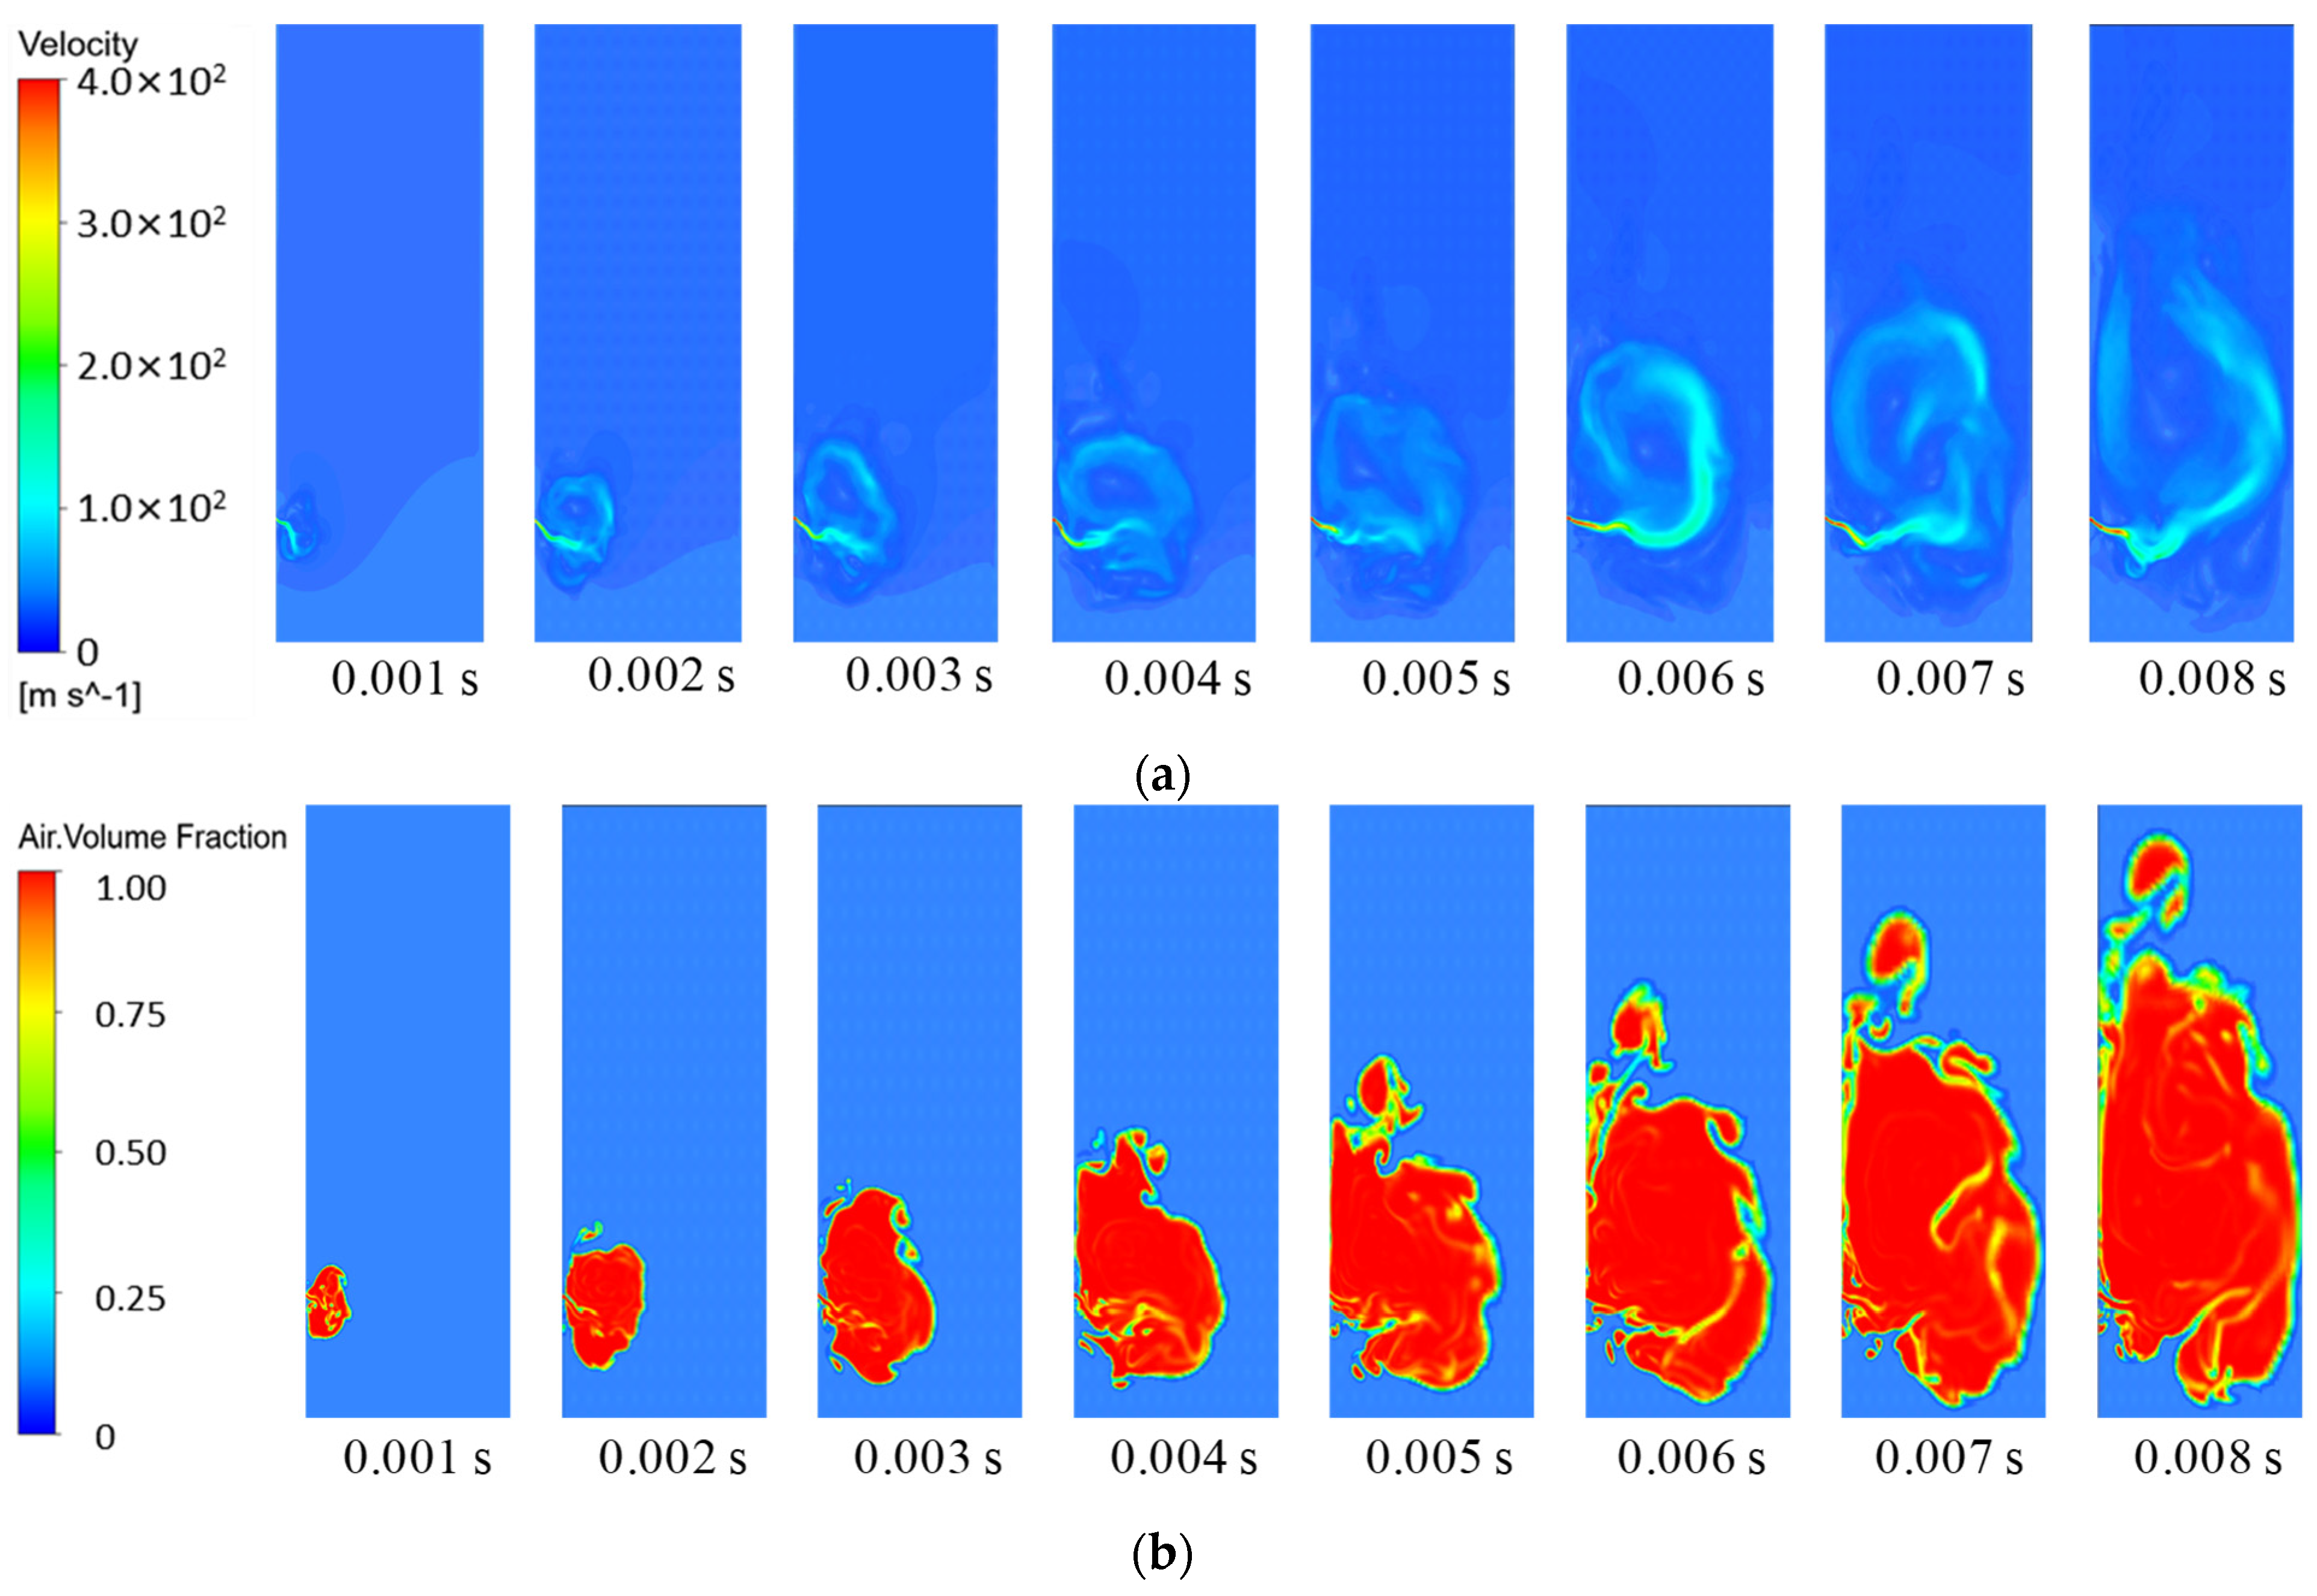
3.1. Simulation Analysis of Leakage Under Different Pressure Differential Conditions

Under the leakage pressure difference of 5 MPa, the pressure distribution in casing and tubing is shown in Figure 4. The internal pressure of the tubing was stable at 5 MPa. The gas pressure gradually decreased along the leakage hole and the pressure of the liquid phase in the annulus increased. The maximum pressure in the annulus was 1.5 MPa. Due to the small leakage aperture, gas leakage had no obvious influence on the internal pressure of tubing. When gas passed through the leakage hole, it was throttled and expanded, thus resulting in the pressure drop at the leakage hole. However, the outlet pressure of the leakage hole was still higher than the annulus pressure. When the high-pressure gas leaked into the annulus, gas expanded rapidly and increased the annulus pressure. In serious cases, it even caused annular pressure and affected the safe production of the gas well.
Under the leakage pressure differences of 5 MPa, 4 MPa, 3 MPa, 2 MPa, and 1 MPa, the velocity and phase distributions in the leakage field at 0.008 s were, respectively, simulated in Figure 5.
The flow velocity of leaking gas was the largest at the outlet of the leakage hole and the flow velocity decreased sharply along the axis of the leakage hole (Figure 5a). Under the leakage pressure difference of 2 to 5 MPa, the flow velocity at the outlet of the leakage hole reached the supersonic speed and the maximum gas flow velocity was 400 m/s. When the leakage pressure difference was 5 MPa, the maximum gas flow velocity was maintained for the longest time and the disturbance area in the annular flow field was the largest. According to the momentum equation, when the wellbore flow was stable, the larger leakage pressure difference corresponded to the larger gas mass flow into the section of the leakage hole and the faster gas flow rate at the outlet of the leakage hole. As shown in Figure 5b, red indicates the volume fraction of natural gas and blue indicates the liquid phase, the annular protection liquid. In the simulation interval, under the leakage pressure differences of 4 MPa and 5 MPa, the leaking gas contacted the inner wall of casing. In the same leakage interval, the gas leakage range was the largest under the pressure difference of 5 MPa and the lowest under the pressure difference of 1 MPa. This difference can be interpreted as follows: Under the same cross-section of the leakage hole, a larger pressure difference corresponded to a faster flow rate, a larger volume of leaking gas, and a larger disturbance range of the annulus. Therefore, the contact area between the leaking gas and the oil casing wall also increases, which increases the risk of the corrosion inhibitor stripping and oil casing corrosion.
Natural gas is compressed in the tubing. In the case of gas leakage, gas expands rapidly in the annulus after it passes through the leakage hole. Under the simulation conditions of different leakage pressure differences, the transverse and longitudinal extension displacements of leaking gas in the annulus gradually changed in Figure 6. As the quantity of leaked gas further increased, the leaking gas stripped the corrosion inhibitor film and generated the shear force on the outer wall of tubing. Under different leakage pressure differences, the shear force on the outer wall of tubing gradually changed in Figure 7.
Both shear force and extension displacement were positively correlated with leakage time (Figure 6 and Figure 7). With the increase in leakage time, the transverse and longitudinal extension displacements increased (Figure 6). Within the same interval, under the leakage pressure difference of 5 MPa, the longitudinal extension displacement was the longest. At 0.008 s, the transverse displacements under the pressure differences of 4 MPa and 5 MPa were the largest (44.45 mm), indicating that the inner wall of casing was contacted by the leaked gas. Due to the inhibition effect of the annular protection liquid on the leaked gas and the density difference between gas and liquid, the longitudinal expansion of the leaked gas was faster than its transverse expansion. The shear force on the outer wall of tubing increased with the increase in leakage time (Figure 7). Within the same interval, the shear force under the leakage pressure difference of 5 MPa was the largest and reached 540 Pa at 0.008 s. This is because the larger the leakage pressure difference, the larger the gas leakage volume, and the leaked gas accumulates on the outer wall of the tubing when the shear force on the wall is increased.

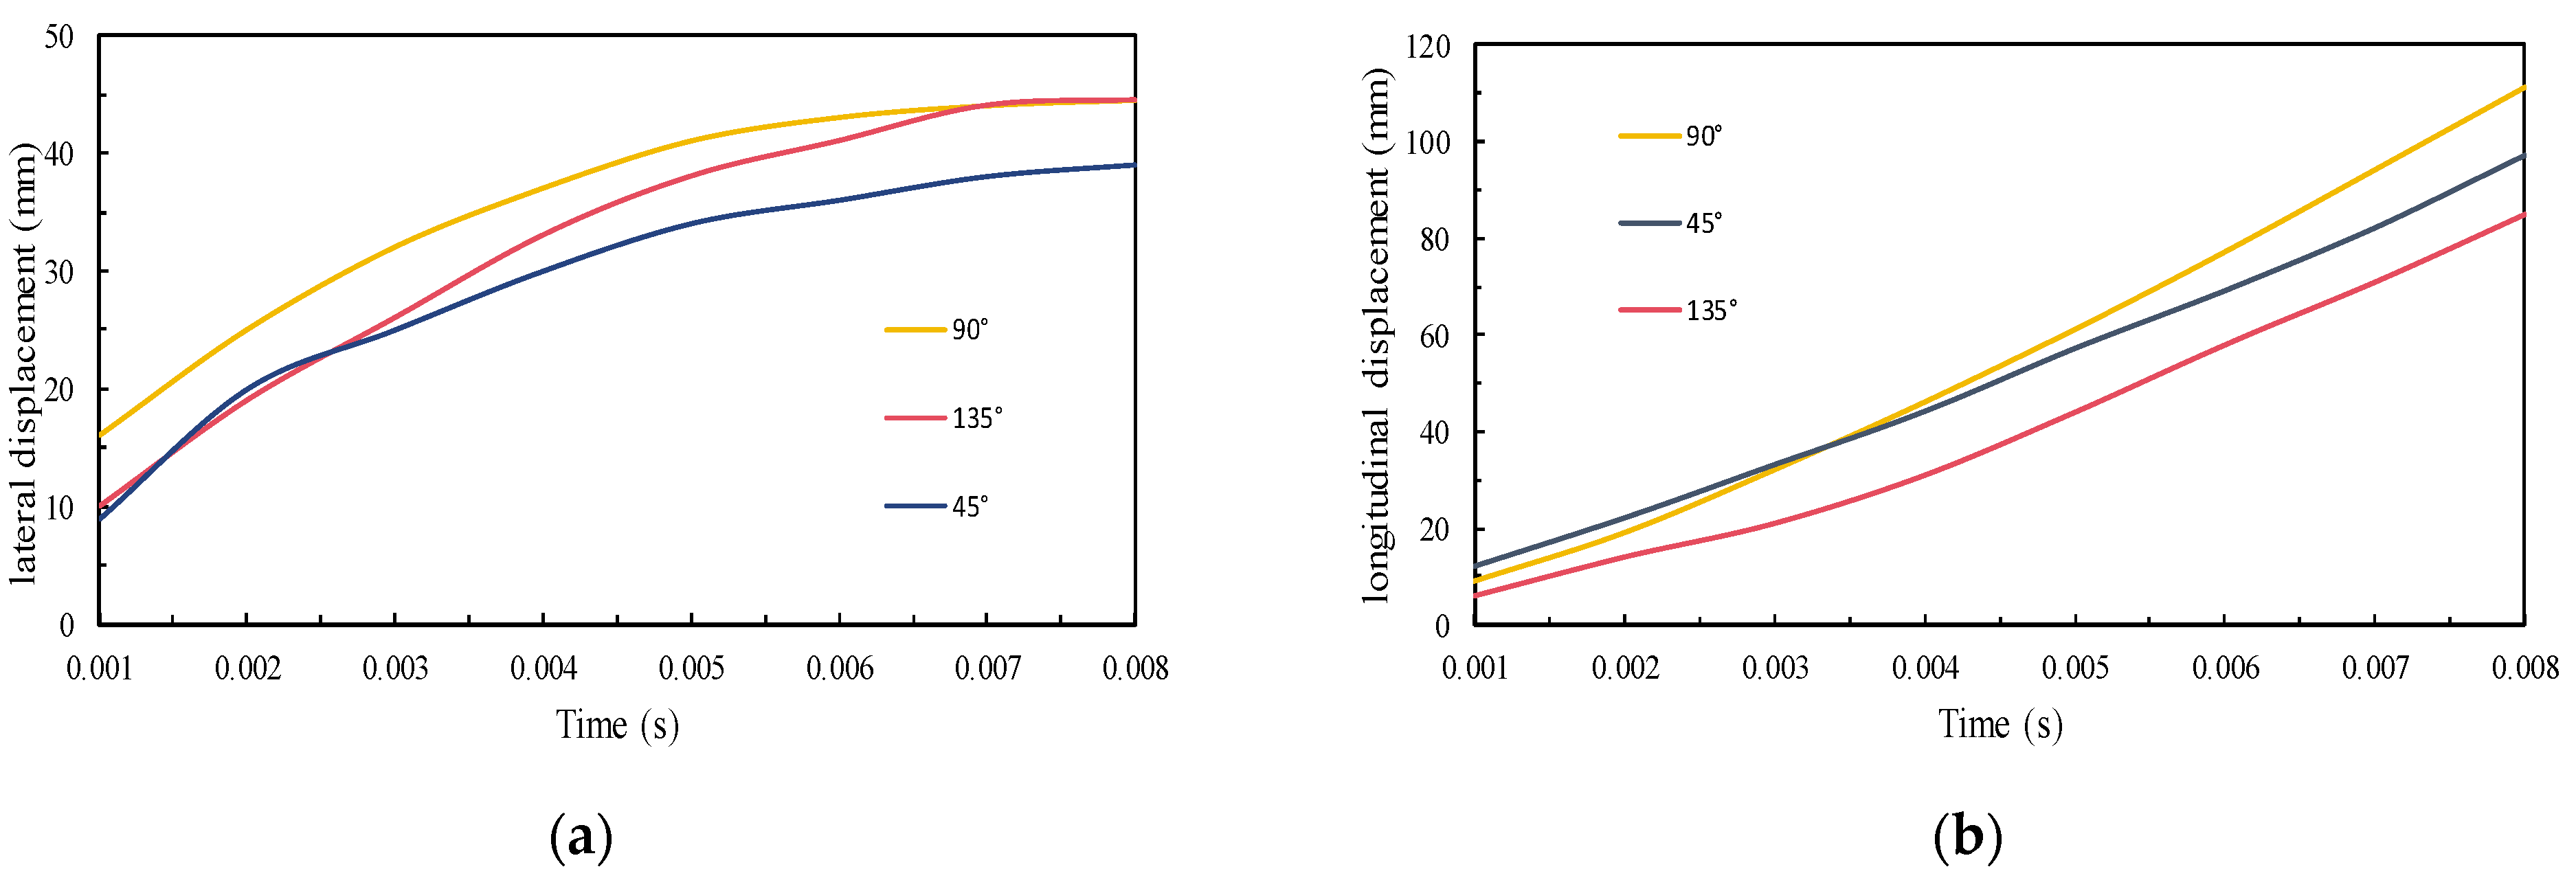
3.2. Leakage Simulation Analysis Under Different Leakage Directions

Under the leakage pressure difference of 5 MPa, leakage time of 0.008 s, and the leakage directions of 45° and 135°, the velocity and phase distributions were simulated in Figure 8 and Figure 9.
The flow velocity at the leakage outlet was the largest, and the gas flow velocity into the annulus in the direction of 45° reached the supersonic speed so as to form a high-speed flow beam in the 45° direction in the annulus, which mainly affected the flow field above the leakage hole (Figure 8a). The leaking gas made direct contact with the outer wall of the tubing above the leakage hole at 0.001 s and accumulated at the outer wall of tubing (Figure 8b). With the increase in leakage time, the gas phase gradually floated upward, so that the corrosion inhibitor film of the outer wall of tubing gradually peeled off. Although the gas flow field by the outer wall of tubing below the leakage hole was disturbed by the leaked gas, the gas phase distribution indicated that the gas leakage in the leakage direction of 45° did not affect the adhesion of the annular protection fluid below the leakage hole to the tubing wall.
Gas flowed into the annulus at a supersonic speed in the leakage direction of 135° so as to form an arc gas flow in the annulus (Figure 9a), which had a significant impact on the flow field above and below the leakage hole. The leaked gas further expanded outwards (Figure 9b). At 0.004 s, gas came into contact with the outer wall of tubing. At 0.007 s, gas came into contact with the inner wall of casing. Leaked gas peeled off the corrosion inhibitor film above and below the leakage hole and the inner wall of casing, especially the corrosion inhibitor film above the leakage hole.
Under the leakage pressure difference of 5 MPa, the variation of gas extension displacement in different leakage directions is shown in Figure 10. When leakage time was 0.008 s, the transverse extension displacements in the leakage directions of 90° and 135° were the largest and reached 44.45 mm, and the longitudinal extension displacement in the leakage direction of 90° was the largest and reached 111 mm.
Under the leakage pressure difference of 5 MPa, the wall shear force in different leakage directions gradually varied in Figure 11. Gas leaked in the direction of 90° had a stronger shear effect on the outer wall of tubing. The shear effects on the outer wall of tubing in leakage directions of 135° and 45° were almost the same. At 0.008 s, the shear force on the wall in leakage directions of 135° and 45° was reduced by about 35% compared to that in the leakage direction of 90°.

3.3. Leakage Simulation Analysis Under Different Leakage Times

The variations of the shear force on the outer wall of tubing in the leakage direction of 90° under the leakage pressure difference of 5 MPa are shown in Figure 12. At 0.023 s, gas diffused into the annulus outlet. The disturbance range of shear force caused by gas leakage on the outer wall of tubing was always ahead of the longitudinal extension distance of gas until gas reached the annulus outlet. The shear effect of leaked gas on the outer wall of tubing was gradually enhanced with the increase in leakage time. When leakage time was 0.024 s, the shear force on the wellbore wall at the leakage hole reached the maximum value of 2365 Pa. Leaked gas further accumulated and diffused in the annulus. When the annular protection fluid was pushed out of the annulus by the leakage gas phase, the inhibition effect of the annular protection fluid on the leakage gas expansion was weakened and the leakage gas cavity rapidly expanded. Finally, the shear force on the outer wall of tubing was rapidly enhanced.

4. Conclusions

The larger leakage pressure difference in the leakage hole corresponded to the larger flow rate at the outlet of the hole, the faster extension speed in the annulus, and the stronger shear force on the outer wall of the tubing. The flow velocity of the leakage gas was the largest at the outlet of the leakage hole and decreased sharply along the axis of the leakage hole. The flow field in the annulus was generally above the leakage hole.
Under the same conditions, the gas leakage in the direction of 135° affected the corrosion inhibitor film on the outer wall of tubing below the leakage hole, whereas the gas leakage in other directions only peeled off the corrosion inhibitor film on the outer wall of tubing and the inner wall of casing above the leakage hole. The shear force and extension range on the outer wall of tubing in the leakage direction of 90° were larger than those of other leakage directions. The wall shear force in the leakage direction of 135° was close to that in the leakage direction of 45°. At 0.008 s, the shear force in the leakage directions of 135° and 45° was 35% smaller than that in the leakage direction of 90°.
With the increase in leakage time, the gas phase expanded outwards and its shear effect on the outer wall of tubing was enhanced. The leaking gas further flushed the outer wall of tubing and the inner wall of casing, so that it is difficult for the corrosion inhibitor to be stably adsorbed on the wall surface and it is easy for it to cause local corrosion. It is recommended to reduce unnecessary annular pressure relief and shorten the pressure relief time.

Author Contributions

Q.D.: investigation, writing—original draft; R.K.: writing—review and editing; X.B. and C.D.: data curation; Z.L.: visualization; Y.H.: project administration; L.D.: supervision; S.P.: project administration; D.Z.: conceptualization, funding acquisition, methodology. All authors have read and agreed to the published version of the manuscript.

Funding

This work was supported by the National Natural Science Foundation of China (grant no. 51774249) and Sichuan Province Science and Technology Support Program (grant no. 21JCQN0066).

Data Availability Statement

Data are contained within the article.

Conflicts of Interest

Author Qiang Du, Xiangwei Bai, Cheng Du, Zhaoqian Luo, Yao Huang, Lang Du, and Senqi Pei are employed by the Northwest Sichuan Division of PetroChina Southwest Oil & Gas Field Company. The remaining authors declare that the research was conducted in the absence of any commercial or financial relationships that could be construed as a potential conflict of interest.

References

  1. Zhang, B.; Xu, Z.; Lu, N.; Liu, H.; Liu, J.; Hu, Z.; Xie, J.; Wang, K. Characteristics of sustained annular pressure and fluid distribution in high pressure and high temperature gas wells considering multiple leakage of tubing string. J. Pet. Sci. Eng. 2021, 196, 108083. [Google Scholar] [CrossRef]
  2. Cao, L.; Sun, J.; Zhang, B.; Lu, N.; Xu, Y. Analysis of Multiple Annular Pressure in Gas Storage Well and High-Pressure Gas Well, Energy Engineering. J. Assoc. Energy Eng. 2023, 120, 35–48. [Google Scholar] [CrossRef]
  3. Martins, I.O.; da Silva, A.K.; Silva, E.C.C.M.; Hasan, A.R.; Barbosa, J.R. Predicting the annular pressure behavior during water injection in offshore wells with a transient, multiphysics model. J. Pet. Sci. Eng. 2022, 218, 110992. [Google Scholar] [CrossRef]
  4. Wei, L.; Fu, C.; Li, W.; Gao, Y.; Guo, L.; Liu, Y.; Liang, F.; Jia, A.; Guo, Q. Integrity assessment of shale gas wells in Changning Block based on hierarchical analysis method. J. Pet. Explor. Prod. 2024, 14, 2129–2142. [Google Scholar] [CrossRef]
  5. Zeng, D.; He, Q.; Yu, Z.; Jia, W.; Zhang, S.; Liu, Q. Risk assessment of sustained casing pressure in gas wells based on the fuzzy comprehensive evaluation method. J. Nat. Gas Sci. Eng. 2017, 46, 756–763. [Google Scholar] [CrossRef]
  6. Zeng, D.; Dong, B.; Zhang, S.; Yi, Y.; Huang, Z.; Tian, G.; Yu, H.; Sun, Y. Annular corrosion risk analysis of gas injection in CO2 flooding and development of oil-based annulus protection fluid. J. Pet. Sci. Eng. 2022, 208, 109526. [Google Scholar] [CrossRef]
  7. Dong, B.; Zeng, D.; Yu, Z.; Le Cai, L.; Yu, H.; Shi, S.Z.; Tian, G.; Yi, Y. Major corrosion influence factors analysis in the production well of CO2 flooding and the optimization of relative anti-corrosion measures. J. Pet. Sci. Eng. 2021, 200, 108052. [Google Scholar] [CrossRef]
  8. Qin, M.; Liao, K.; He, G.; Huang, Y.; Wang, M.; Zhang, S. Main control factors and prediction model of flow-accelerated CO2/H2S synergistic corrosion for X65 steel. Process Saf. Environ. Prot. 2022, 160, 749–762. [Google Scholar] [CrossRef]
  9. Hu, J.; Xiong, Q.; Chen, L.; Zhang, C.; Zheng, Z.; Geng, S.; Yang, Z.; Zhong, X. Corrosion inhibitor in CO2-O2-containing environment: Inhibition effect and mechanisms of Bis(2-ehylhexyl) phosphate for the corrosion of carbon steel. Corros. Sci. 2021, 179, 109173. [Google Scholar] [CrossRef]
  10. Zeng, D.; Dong, B.; Zeng, F.; Yu, Z.; Zeng, W.; Guo, Y.; Peng, Z.; Tao, Y. Analysis of corrosion failure and materials selection for CO2–H2S gas well. J. Nat. Gas Sci. Eng. 2021, 86, 103734. [Google Scholar] [CrossRef]
  11. Zhi, Z.; Jing, L.; Yushan, Z.; Cheng, Z.; Qingsheng, Z.; Dezhi, Z.; Xiankang, Z. Finite service life evaluation method of production casing for sour-gas wells. J. Pet. Sci. Eng. 2018, 165, 171–180. [Google Scholar] [CrossRef]
  12. Ha, H.Y.; Jang, J.H.; Lee, T.H.; Won, C.; Lee, C.H.; Moon, J.; Lee, C.G. Investigation of the localized corrosion and passive behavior of type 304 stainless steels with 0.2–1.8 wt % B. Materials 2018, 11, 2097. [Google Scholar] [CrossRef]
  13. Montiel, H.; Vílchez, J.A.; Casal, J.; Arnaldos, J. Mathematical modelling of accidental gas releases. J. Hazard. Mater. 1998, 59, 211–233. [Google Scholar] [CrossRef]
  14. Kostowski, W.J.; Skorek, J. Real gas flow simulation in damaged distribution pipelines. Energy 2012, 45, 481–488. [Google Scholar] [CrossRef]
  15. Liu, C.; Li, Y.; Meng, L.; Wang, W.; Zhao, F.; Fu, J. Computational fluid dynamic simulation of pressure perturbations generation for gas pipelines leakage. Comput. Fluids 2015, 119, 213–223. [Google Scholar] [CrossRef]
  16. Xinhong, L.; Guoming, C.; Renren, Z.; Hongwei, Z.; Jianmin, F. Simulation and assessment of underwater gas release and dispersion from subsea gas pipelines leak. Process Saf. Environ. Prot. 2018, 119, 46–57. [Google Scholar] [CrossRef]
  17. Oke, A.; Mahgerefteh, H.; Economou, I.; Rykov, Y. A transient outflow model for pipeline puncture. Chem. Eng. Sci. 2003, 58, 4591–4604. [Google Scholar] [CrossRef]
  18. Nouri-Borujerdi, A.; Ziaei-Rad, M. Simulation of compressible flow in high pressure buried gas pipelines. Int. J. Heat Mass Transf. 2009, 52, 5751–5758. [Google Scholar] [CrossRef]
  19. Moloudi, R.; Esfahani, J.A. Modeling of gas release following pipeline rupture: Proposing non-dimensional correlation. J. Loss Prev. Process. Ind. 2014, 32, 207–217. [Google Scholar] [CrossRef]
  20. Ebrahimi-Moghadam, A.; Farzaneh-Gord, M.; Deymi-Dashtebayaz, M. Correlations for estimating natural gas leakage from above-ground and buried urban distribution pipelines. J. Nat. Gas Sci. Eng. 2016, 34, 185–196. [Google Scholar] [CrossRef]
  21. Jing, J.; Tian, Y.; Zhu, X.; Zhou, Y.; Shi, C.; Lei, Q. Safety evaluation of offshore oil and gas well string based on corrosion rate prediction. J. Loss Prev. Process. Ind. 2024, 91, 105385. [Google Scholar] [CrossRef]
  22. Li, Y.Y.; Zhu, G.Y.; Hou, B.S.; Zhang, Q.H.; Zhang, G.A. A numerical model based on finite element method for predicting the corrosion of carbon steel under supercritical CO2 conditions. Process Saf. Environ. Prot. 2021, 149, 866–884. [Google Scholar] [CrossRef]
  23. Mubarak, G.; Elkhodbia, M.; Gadala, I.; Al Fantazi, A.; Barsoum, I. Failure analysis corrosion rate prediction, and integrity assessment of J55 downhole tubing in ultra-deep gas and condensate well. Eng. Fail. Anal. 2023, 151, 107381. [Google Scholar] [CrossRef]
  24. Zeng, D.; Dong, B.; Yu, Z.; Huang, Z.; Yi, Y.; Yu, H.; Li, J.; Tian, G. Design of water-based annulus protection fluid for CO2 flooding injection well. J. Pet. Sci. Eng. 2021, 205, 108726. [Google Scholar] [CrossRef]
  25. Liu, C.; An, J.; Xie, C.; Wu, H.; Zhang, Z. Numerical simulation-based pinhole leakage characteristics and hazard boundaries of buried natural gas risers. Process Saf. Environ. Prot. 2024, 184, 462–476. [Google Scholar] [CrossRef]
  26. Bu, F.; Liu, Y.; Liu, Y.; Xu, Z.; Chen, S.; Jiang, M.; Guan, B. Leakage diffusion characteristics and harmful boundary analysis of buried natural gas pipeline under multiple working conditions. J. Nat. Gas Sci. Eng. 2021, 94, 104047. [Google Scholar] [CrossRef]
  27. Bonnaud, C.; Cluzel, V.; Corcoles, P.; Dubois, J.P.; Louvet, V.; Maury, M.; Narbonne, A.; Orefice, H.; Perez, A.; Ranty, J.; et al. Experimental study and modelling of the consequences of small leaks on buried transmission gas pipeline. J. Loss Prev. Process. Ind. 2018, 55, 303–312. [Google Scholar] [CrossRef]
  28. Ayyildiz, B.; Sheriff, M.Z.; Rahman, M.A.; Delgado, A.; Hassan, I.; Nounou, H.; Nounou, M. Research on pinhole accidental gas release in pipelines: Statistical modeling, real gas CFD simulation, and validation. Process Saf. Environ. Prot. 2023, 176, 786–796. [Google Scholar] [CrossRef]
Figure 1. Gas leakage model of wellbore tubing. (a) Gas leakage model and (b) model mesh.
Modelling 05 00087 g001
Figure 2. Three leakage models in different directions. (a) Leakage direction at 90°, (b) leakage direction at 45°, and (c) leakage direction at 135°.
Modelling 05 00087 g002
Figure 3. Wall shear force.
Modelling 05 00087 g003
Figure 4. Cloud map of the pressure distribution under the leakage pressure difference of 5 MPa.
Modelling 05 00087 g004
Figure 5. Cloud maps of the velocity and phase distributions under different pressure differences. (a) Velocity field and (b) phase distribution.
Modelling 05 00087 g005
Figure 6. Comparison of the gas extension displacements under different pressure differences. (a) Lateral displacement and (b) longitudinal displacement.
Modelling 05 00087 g006
Figure 7. Shear force on the outer wall of tubing under different leakage pressure differences.
Modelling 05 00087 g007
Figure 8. Variations in the velocity field and phase distribution in the leakage direction of 45°. (a) Velocity field and (b) phase distribution.
Modelling 05 00087 g008
Figure 9. Variations of the velocity field and phase distribution in the leakage direction of 135°. (a) Velocity field and (b) phase distribution.
Modelling 05 00087 g009
Figure 10. Comparison diagram of extension displacements in different leakage directions. (a) Lateral displacement and (b) longitudinal displacement.
Modelling 05 00087 g010
Figure 11. Comparison of wall shear forces in different leakage directions.
Modelling 05 00087 g011
Figure 12. Variations in shear force and gas phase on the outer wall of tubing.
Modelling 05 00087 g012
Table 1. Influence of the number of elements on mesh quality in two-dimensional modeling.
Serial NumberMesh QuantityMesh Quality
169,1840.97988
2100,7170.97832
Disclaimer/Publisher’s Note: The statements, opinions and data contained in all publications are solely those of the individual author(s) and contributor(s) and not of MDPI and/or the editor(s). MDPI and/or the editor(s) disclaim responsibility for any injury to people or property resulting from any ideas, methods, instructions or products referred to in the content.

