Article

Evaluation of Antidiabetic Potential of Mangifera indica Leaf in Streptozotocin-Induced Type 2 Diabetic Rats: Focus on Glycemic Control and Cholesterol Regulation

1
Department of Pharmacy, School of Pharmacy and Public Health, Independent University, Bangladesh (IUB), Dhaka 1229, Bangladesh
2
Department of Pharmacology, National Medical College and Teaching Hospital, Bhediyahi 15, Parsa, Birgunj 44300, Nepal
3
Centre for Diabetes, School of Biomedical Sciences, Ulster University, Coleraine BT52 1SA, Northern Ireland, UK
*
Author to whom correspondence should be addressed.
Endocrines 2024, 5(2), 137-152; https://doi.org/10.3390/endocrines5020010
Submission received: 23 January 2024 / Revised: 18 March 2024 / Accepted: 2 April 2024 / Published: 8 April 2024
(This article belongs to the Section Obesity, Diabetes Mellitus and Metabolic Syndrome)

Abstract

:
Mangifera indica (Anacardiaceae family) is renowned for its diverse pharmacological properties, encompassing antidiabetic, antioxidant, and anti-inflammatory effects. The present study delves into the insulin-releasing and glucose-lowering potential of the ethanolic extract of Mangifera indica (EEMI) leaves in streptozotocin-induced type 2 diabetic (STZ-T2D) rats, concurrently investigating its phytoconstituents. EEMI’s effects on insulin secretion were measured using BRIN BD11 β-cells and isolated mouse islets. Its enzymatic inhibitory properties on carbohydrate digestion, and absorption, and free radicals were investigated using in vitro methods. In vivo parameters including the lipid profile and liver glycogen content were assessed in STZ-T2D rats. EEMI exhibited a dose-dependent increase in insulin secretion from clonal pancreatic BRIN BD11 β-cells and isolated mouse islets. EEMI inhibited starch digestion, glucose diffusion over time, and DPPH activity in vitro. In acute in vivo studies, EEMI improved food intake and oral glucose tolerance. Moreover, following 28 days of treatment with EEMI, a remarkable amelioration in body weight, fasting blood glucose, plasma insulin, liver glycogen content, total cholesterol, triglyceride, LDL, VLDL, and HDL levels was observed. Further phytochemical analysis with EEMI identified the presence of alkaloids, tannins, saponins, steroids, and flavonoids. The synergistic effects of EEMI, potentially attributable to naturally occurring phytoconstituents, hold promise for the development of enriched antidiabetic therapies, offering a promising avenue for the management of type 2 diabetes.

1. Introduction

In this contemporary era, the pathogenesis and etiology of diabetes mellitus is comprehended as a highly intricate metabolic disorder attributed to the excessive glucose production in the liver [1]. Diabetes poses a significant global health challenge, with over half a billion people affected in 2021. Projections indicate a continued rise, reaching 783.2 million people living with diabetes by 2045, contributing to high morbidity and mortality rates [2]. The vast majority, approximately 90%, of individuals diagnosed with diabetes are battling type 2 diabetes mellitus (T2DM) which can progressively lead to severe secondary complications such as retinopathy, cardiovascular disease, cognitive decline, nephropathy, end-stage renal disease, dementia, and susceptibility to infections [3].
Lifestyle and dietary modifications are common preventative measures employed during the initial stages of T2DM. However, as the disease progresses, advanced therapeutic strategies are often necessary to combat further deterioration. These strategies include medications such as sulfonylureas, glucosidase inhibitors, amylin analogs, meglitinides, dipeptidyl peptidase-4 (DPP-IV) enzyme inhibitors, and GLP-1 analogs [4]. Despite the effectiveness of these pharmaceutical interventions, their widespread use is often limited by factors such as cost, limited accessibility in some regions, and severe adverse side effects. These limitations have fueled the search for alternative therapeutic approaches that are safe, economical, and effective in managing T2DM [5]. In fact, traditional medicine, accounting for nearly 90% of treatments in developing countries, is predominantly obtained from medicinal plants, employed in the treatment of gastrointestinal disorders, diarrhea, diabetes, wound healing, malaria, cholera, pneumonia, tuberculosis, and asthma [5]. On top of that, the global markets for plant-derived medicines are thriving, generating over USD 100 billion per year with their considerable contributions to public health [6]. At present, more than 400 species of traditional medicinal plants have been identified, exhibiting notable antidiabetic and antihyperlipidemic effects, making them potential alternatives for T2DM treatment [7]. These medicinal plants exhibit the potential to restore pancreatic tissue function and alleviate hyperglycemia by enhancing insulin secretion and promoting insulin-dependent metabolic processes, and additionally, inhibiting α-amylase and α-glucosidase enzymes hinders the breakdown of dietary starches, leading to a reduction in glucose production [8,9].
Mangifera indica, commonly referred to as mango, is a member of the Anacardiaceae family and Mangifera genus, which comprises around 69 species of edible fruits. The highest cultivation of mangos is known to be in India and Bangladesh, where it has been used as an essential ethnomedicine in Ayurveda and indigenous medicine for over 4000 years [10]. The bark of the plant is a familiar ethnomedicine used traditionally for the remedy of diarrhea, cancer, toothache, and urinary tract and dermal infections [11]. The alcoholic extract of M. indica also exhibited anti-bacterial, antioxidant, anti-ulcerogenic, hepatoprotective, and hypolipidemic activities [12]. The hydro-alcoholic extract of the plant leaves has been reported to reduce postprandial glucose within 7 days, prevent a rise in blood glucose, enhance glucose tolerance, and decrease body weight [13]. Conversely, the aqueous extract of Mangifera indica also showed a reduction in serum glucose levels, indicating improved insulin release into the bloodstream [14]. Another study highlighted the potential of the seed extract of this plant in improving glucose tolerance, blood lipid levels, diabetes-induced liver damage, and β-cell apoptosis [15]. The isolated compounds from the leaves, bark, and peel of M. indica included mangiferin, isomangiferin, quercetin 3-O-galactoside, quercetin 3-O-glucoside, quercetin 3-O-xyloside, quercetin 3-O-arabinoside, iriflophenone 3-C-β-D-glucoside, quercetin, and kaempferol [13,16]. Mangiferin, a key component of Mangifera indica, enhances oral glucose tolerance and the lipid profile, while its accompanying phytochemicals, powerful free radical scavengers like quercetin, combat ROS-induced harm through their scavenging activity [11]. Given the known pharmacological properties of Mangifera indica, this study aims to investigate its effects on glycemic control and cholesterol regulation, as well as to unravel the mechanistic pathways underlying its antihyperglycemic properties in a streptozotocin-induced type 2 diabetic rat model.

2. Materials and Methods

2.1. Plant Collection and Extract Preparation

Cultivated mango (Mangifera indica) leaves were sourced from Jahangirnagar University in Savar, Dhaka, Bangladesh. The botanical identification was subsequently verified as herbarium specimen number 123 by an herbal taxonomist at the National Herbarium in Mirpur, Dhaka, Bangladesh. The collected leaves were thoroughly washed before being air-dried at 40 °C in an oven. The dried leaves were then ground into a fine powder using a grinding machine. About 200 g of the dried powder of the plant leaves was added to 1 L of 80% ethanol and placed in an orbital shaker at 550 rpm for 48–72 h. Then, the mixture was filtered using Whatman No. 1 filter paper to remove insoluble granular particles. The residual product was evaporated using a rotary evaporator machine (BibbyRE-200, Sterilin Ltd., Newport, UK) to remove any moisture, followed by the collection of a solid crude extract of Mangifera indica leaves, which was then stored at 4 °C for experimental studies.

2.2. In Vitro Insulin-Releasing Studies Using BRIN-BD11 Cells

BRIN-BD11 cells, a clonal pancreatic β-cell line, were created by the electrofusion of primary β cells from New England Deaconess Hospital rat pancreatic islets with RINm5F cells [17]. BRIN-BD11 cells were cultured in an RPMI 1640 medium supplemented with 10% FCS, 1% penicillin/streptomycin (100 U/mL penicillin, 0.1 mg/mL streptomycin), and 11.1 mmol/L D-glucose at 37 °C in a humidified atmosphere of 5% CO2 and 95% air. Cells at passage 27 were used for subsequent experiments. They were seeded in 24-well plates followed by cells being incubated overnight at 37 °C in an RPMI medium. The insulin-releasing effect was measured by incubating clonal pancreatic BRIN-BD-11 β-cells at 5.6 mM glucose plus/minus EEMI (1.6–5000 µg/mL) or insulin secretagogues 10 mM alanine for 20 min at 37 °C [18,19,20]. Alanine, an amino acid, prompts calcium ions’ influx [21].

2.3. In Vitro Insulin-Releasing Studies Using Isolated Mouse Islets

The isolated mouse islets of Langerhans were used to assess the EEMI leaves’ in vitro insulin-releasing effect. The pancreases from mice were isolated using Clostridium histolyticum-derived collagenase P and cultured at 37 °C for 48 h [22]. The islets were then incubated in a CO2 incubator with 1.4 and 16.7 mM glucose in the presence or absence of EEMI, alanine, and GLP-1 at 37 °C for 1 h. Following centrifugation, the supernatants were collected and stored at 20 °C for insulin radioimmunoassay. An acid–ethanol extraction method was employed to assess the total insulin content in the islet cells [23].

2.4. In Vitro Starch Digestion Using EEMI

An in vitro starch digestion study was conducted to investigate the influence of EEMI on glucose release. The experiment involved preparing a starch solution (2 mg/mL) using starch from Sigma-Aldrich (St. Louis, MO, USA). This solution was divided into aliquots and supplemented with varying concentrations of EEMI (8–25,000 µg/mL) or acarbose (0.32–1000 µg/mL), a known α-glucosidase inhibitor. And 40 µL of heat-stable α-amylase (0.01%) derived from Bacillus licheniformis (Sigma-Aldrich, St. Louis, MO, USA) was added to each aliquot. The mixtures were then incubated at 80 °C for 20 min. Following the α-amylase incubation, 30 µL of amyloglucosidase (0.1%) sourced from Rhizopus mold (Sigma-Aldrich, St. Louis, MO, USA) was added to each 1 mL of the pre-incubated solution. To maintain optimal enzyme activity, 2 mL of 0.1 M sodium acetate buffer (pH 4.75) was also incorporated. The mixture was then subjected to a further incubation period of 30 min at 80 °C to ensure complete starch digestion. Samples were then collected and stored at 4 °C for subsequent analysis using the GOD-PAP (liquid glucose oxidase–phenol aminophenazone) (Randox GL 2623) method [24].

2.5. In Vitro Glucose Diffusion Using EEMI

The in vitro glucose diffusion assay was conducted using cellulose ester dialysis tubes (20 cm × 7.5 mm, Spectra/Por® CE layer, MWCO: 2000, Spectrum). Two milliliters of NaCl (0.9%) and 220 mM of glucose were added to each dialysis tube, with or without EEMI (200–25,000 µg/mL) [25]. The ends of each tube were securely sealed and placed in a 50 mL Falcone tube (Orange Scientific, Northern Orange County, CA, USA) containing 45 mL of 0.9% NaCl. The tubes were incubated in an orbital shaker at 37 °C for 24 h, and glucose levels were measured at 0, 3, 6, 12, and 24 h, respectively.

2.6. In Vitro DPPH Assay Using EEMI

To evaluate the free radical scavenging activity of EEMI, the 2,2-Diphenyl-1-picrylhydrazyl (DPPH) assay was employed [26,27]. Various concentrations (1.6–5000 µg/mL) of EEMI (treatment) and L-ascorbic acid (standard) were prepared. A volume of 2 mL of 0.2 mmol/L DPPH solution, dissolved in methanol, was added to each concentration of treatment and standard solutions. A solution containing 2 mL of 0.2 mmol/L DPPH in 1 mL of distilled water was considered as the control. The samples were incubated in a dark room for 30 min, and the absorbance at 517 nm was measured using a UV/VIS spectrophotometer (Mettler-Toledo, Columbus, OH, USA).

2.7. Animals

Male, 6–8-weeks-old Long–Evans rats were used for the in vivo experimentations. They were kept at a constant room temperature of 22 ± 5 °C and humidity of 50–70% with a 12 h day–night cycle. The animals were given a nutrient-rich diet consisting of carbohydrates (36.2%), protein (20.9%), fat (4.4%), and fiber (38.5%), with 11.8 MJ/kg of metabolizable energy content. The rats were kept in translucent plastic cages with a bedding of wood shavings. Streptozotocin (STZ) was injected intraperitoneally into 12 h fasted rats at a dose of 90 mg/kg body weight in a 0.5 M citrate buffer solution (pH 4.5). After three months of streptozotocin administration, oral glucose tolerance tests (OGTTs) at a dosage of 2.5 g/kg body weight were conducted to ensure the diabetic model. At the end of the 28-day study, the rats were anesthetized with ketamine (0.15 mL/kg) before euthanasia by cervical dislocation. Blood was then collected from the heart, and the liver was extracted [28]. To ensure the ethical guidelines were followed, the animal experiments were approved by the Animal Welfare and Ethical Review Board (AWERB) of Ulster University in May 2018 and conformed to U.K. regulations (Animal project/personal licenses PIL1822 and PPL 2804, UK Act 1986, EU Directive 2010/63EU). No animal harm occurred during the study.

2.8. Acute Effects of EEMI on Feeding Test

The impact of EEMI (250–500 mg/kg) on acute food intake in streptozotocin-induced diabetic rats following a 12 h fasting period was analyzed. Food intake levels were assessed at 0, 30, 60, 90, 120, 150, and 180 min subsequent to the oral administration of saline (5 mL/kg), EEMI (250–500 mg/kg), or glibenclamide (0.5 mg/kg), respectively [22].

2.9. Acute Effects of EEMI Leaves on Oral Glucose Tolerance Test

The acute effects of EEMI on oral glucose tolerance were measured prior and after the oral administration of glucose (2.5 g/5 mL/kg body weight) plus/minus EEMI (250 and 500 mg/kg) or glibenclamide (0.5 mg/kg) in 12 h fasted STZ-induced T2DM rats. Control groups were given glucose solutions only, while the standard group received glibenclamide (0.5 mg/kg). Blood samples were obtained from the tail vein at 0, 30, 60, 90, 120, and 180 min to measure the blood glucose concentration (mmol/L) with respect to time [21].

2.10. Effect of EEMI on Body Weight, Fasting Blood Glucose, and Plasma Insulin

To evaluate the chronic effects of the twice-daily oral gavage of EEMI (250 and 500 mg/kg) or glibenclamide (0.5 mg/kg) on body weight and fasting blood glucose, STZ-induced T2DM rats were starved overnight, followed by the collection of blood from the lateral tail vein and body weight measurements at 0, 7, 14, 21, and 28 days using the Ascensia Contour glucose meter (Bayer, Newbury, UK) [29] and a digital weighing scale (Kent Scientific Corporations, Torrington, CT, USA), respectively. A Rat Insulin ELISA Kit (Crystal ChemTM, Elk Grove Village, IL, USA) was used to assess the plasma insulin level at the end of the studies [23].

2.11. Effects of EEMI Leaves on Liver Glycogen Content

On day 28 of the chronic study, the rats were sacrificed, and their livers were extracted and analyzed for glycogen content using the method described by [30,31]. The liver was weighed and homogenized with 20 mL of 5% trichloroacetic acid (TCA). The protein precipitate was filtered, and the clear filtrate was used for the analysis. A total of 1 mL of the filtrate was mixed with 2 mL of 10 N KOH and boiled at 100 °C for 1 h. Upon cooling, 1 mL of glacial acid was added to the cooled mixture, followed by deionized water to make up a final volume of 10 mL. Then, 1 mL of this diluted solution was mixed with 2 mL of anthrone solution (100 mg in 50 mL of concentrated H2SO4) on ice. After an additional 10 min of boiling at 100 °C, the mixture was allowed to cool, and the absorbance of samples was measured at 490 nm using a microplate reader (Biochrom Ltd., Cambridge, UK).

2.12. Effects of EEMI on Lipid Profile

During 28 days of twice-daily oral treatment with EEMI (250 and 500 mg/5 mL/kg) or glibenclamide (0.5 mg/kg) in STZ-induced T2DM rats, a lipid profile test was conducted as previously described [23]. Blood samples were obtained from the tip of the tail in heparin microcentrifuge tubes (Sarstedt, Numbrecht, Germany) to prevent clotting and centrifuged at 12,000 rpm for 5 min. Plasma serum was then separated and HDL, LDL, TG, and TC levels were analyzed using COD-PAP, GPO-PAP (Elabscience Biotechnology Co., Ltd., TX, USA), and CHOD-PAP (Biolabo SAS, Maizy, France) reagents in an automated analyzer [30].

2.13. Phytochemical Screening of EEMI

To evaluate the presence or absence of phytoconstituents (such as flavonoids, alkaloids, saponins, glycosides, tannins, reducing sugars, anthraquinone, and steroids), the phytochemical screening of EEMI was carried out as previously described [22,23]. To determine the presence or absence of alkaloids, 2 mL of EEMI was combined with 1 mL of hydrochloric acid (HCl), followed by the addition of 1 mL of Dragendorff’s reagent to observe the emergence of a red color, suggesting the presence of alkaloids. Later, for the investigation of tannins’ presence, a few drops of 10% lead acetate were mixed with 2 mL of EEMI to observe the formation of a white sediment, suggesting the presence of tannins. Flavonoids were examined by heating 4 mL of EEMI mixed with 1.5 mL of methanol, followed by the addition of metal magnesium and a few drops of HCL to identify the formation of a pink color, indicating the existence of flavonoids. To validate the presence of saponins, 1 mL of EEMI was mixed with 9 mL of distilled water. The resulting mixture was allowed to stand for about 10–15 min, where the formation of a stable foam confirmed their presence. To detect the presence of steroids, 2 mL of EEMI was combined with 10 mL of chloroform, 1 mL of acetic anhydride, and 2 mL of sulfuric acid, yielding a bluish-green color indicative of the presence of steroids. The presence of glycosides was determined by combining 1 mL of EEMI with a few droplets of glacial acetic acid, ferric chloride, and concentrated sulfuric acid to detect the bluish-green color and identify the presence of glycosides. The identification of reducing sugars was detected by heating a solution containing 1 mL of EEMI, 1 mL of water, and a few drops of Fehling’s reagent that yielded a red-brick color, confirming the presence of reducing sugars. Lastly, anthraquinone was examined by placing 0.5 g of EEMI in a test tube with 5 mL of chloroform and shaking the mixture rapidly for 5 min, followed by filtration. The presence of anthraquinone was verified by adding 5 mL of a 10% ammonia solution to the filtered mixture and observing for the development of a pink-violet or red color in the bottom layer [22,23,32].

2.14. Statistical Analysis

Statistical analysis was performed using GraphPad Prism 5. Student’s t-test and a one/two-way ANOVA with Bonferroni adjustment were conducted to analyze the data which were collected over various time intervals. The results are represented as means ± SEM using a statistical limit at a p-value of <0.05.

3. Results

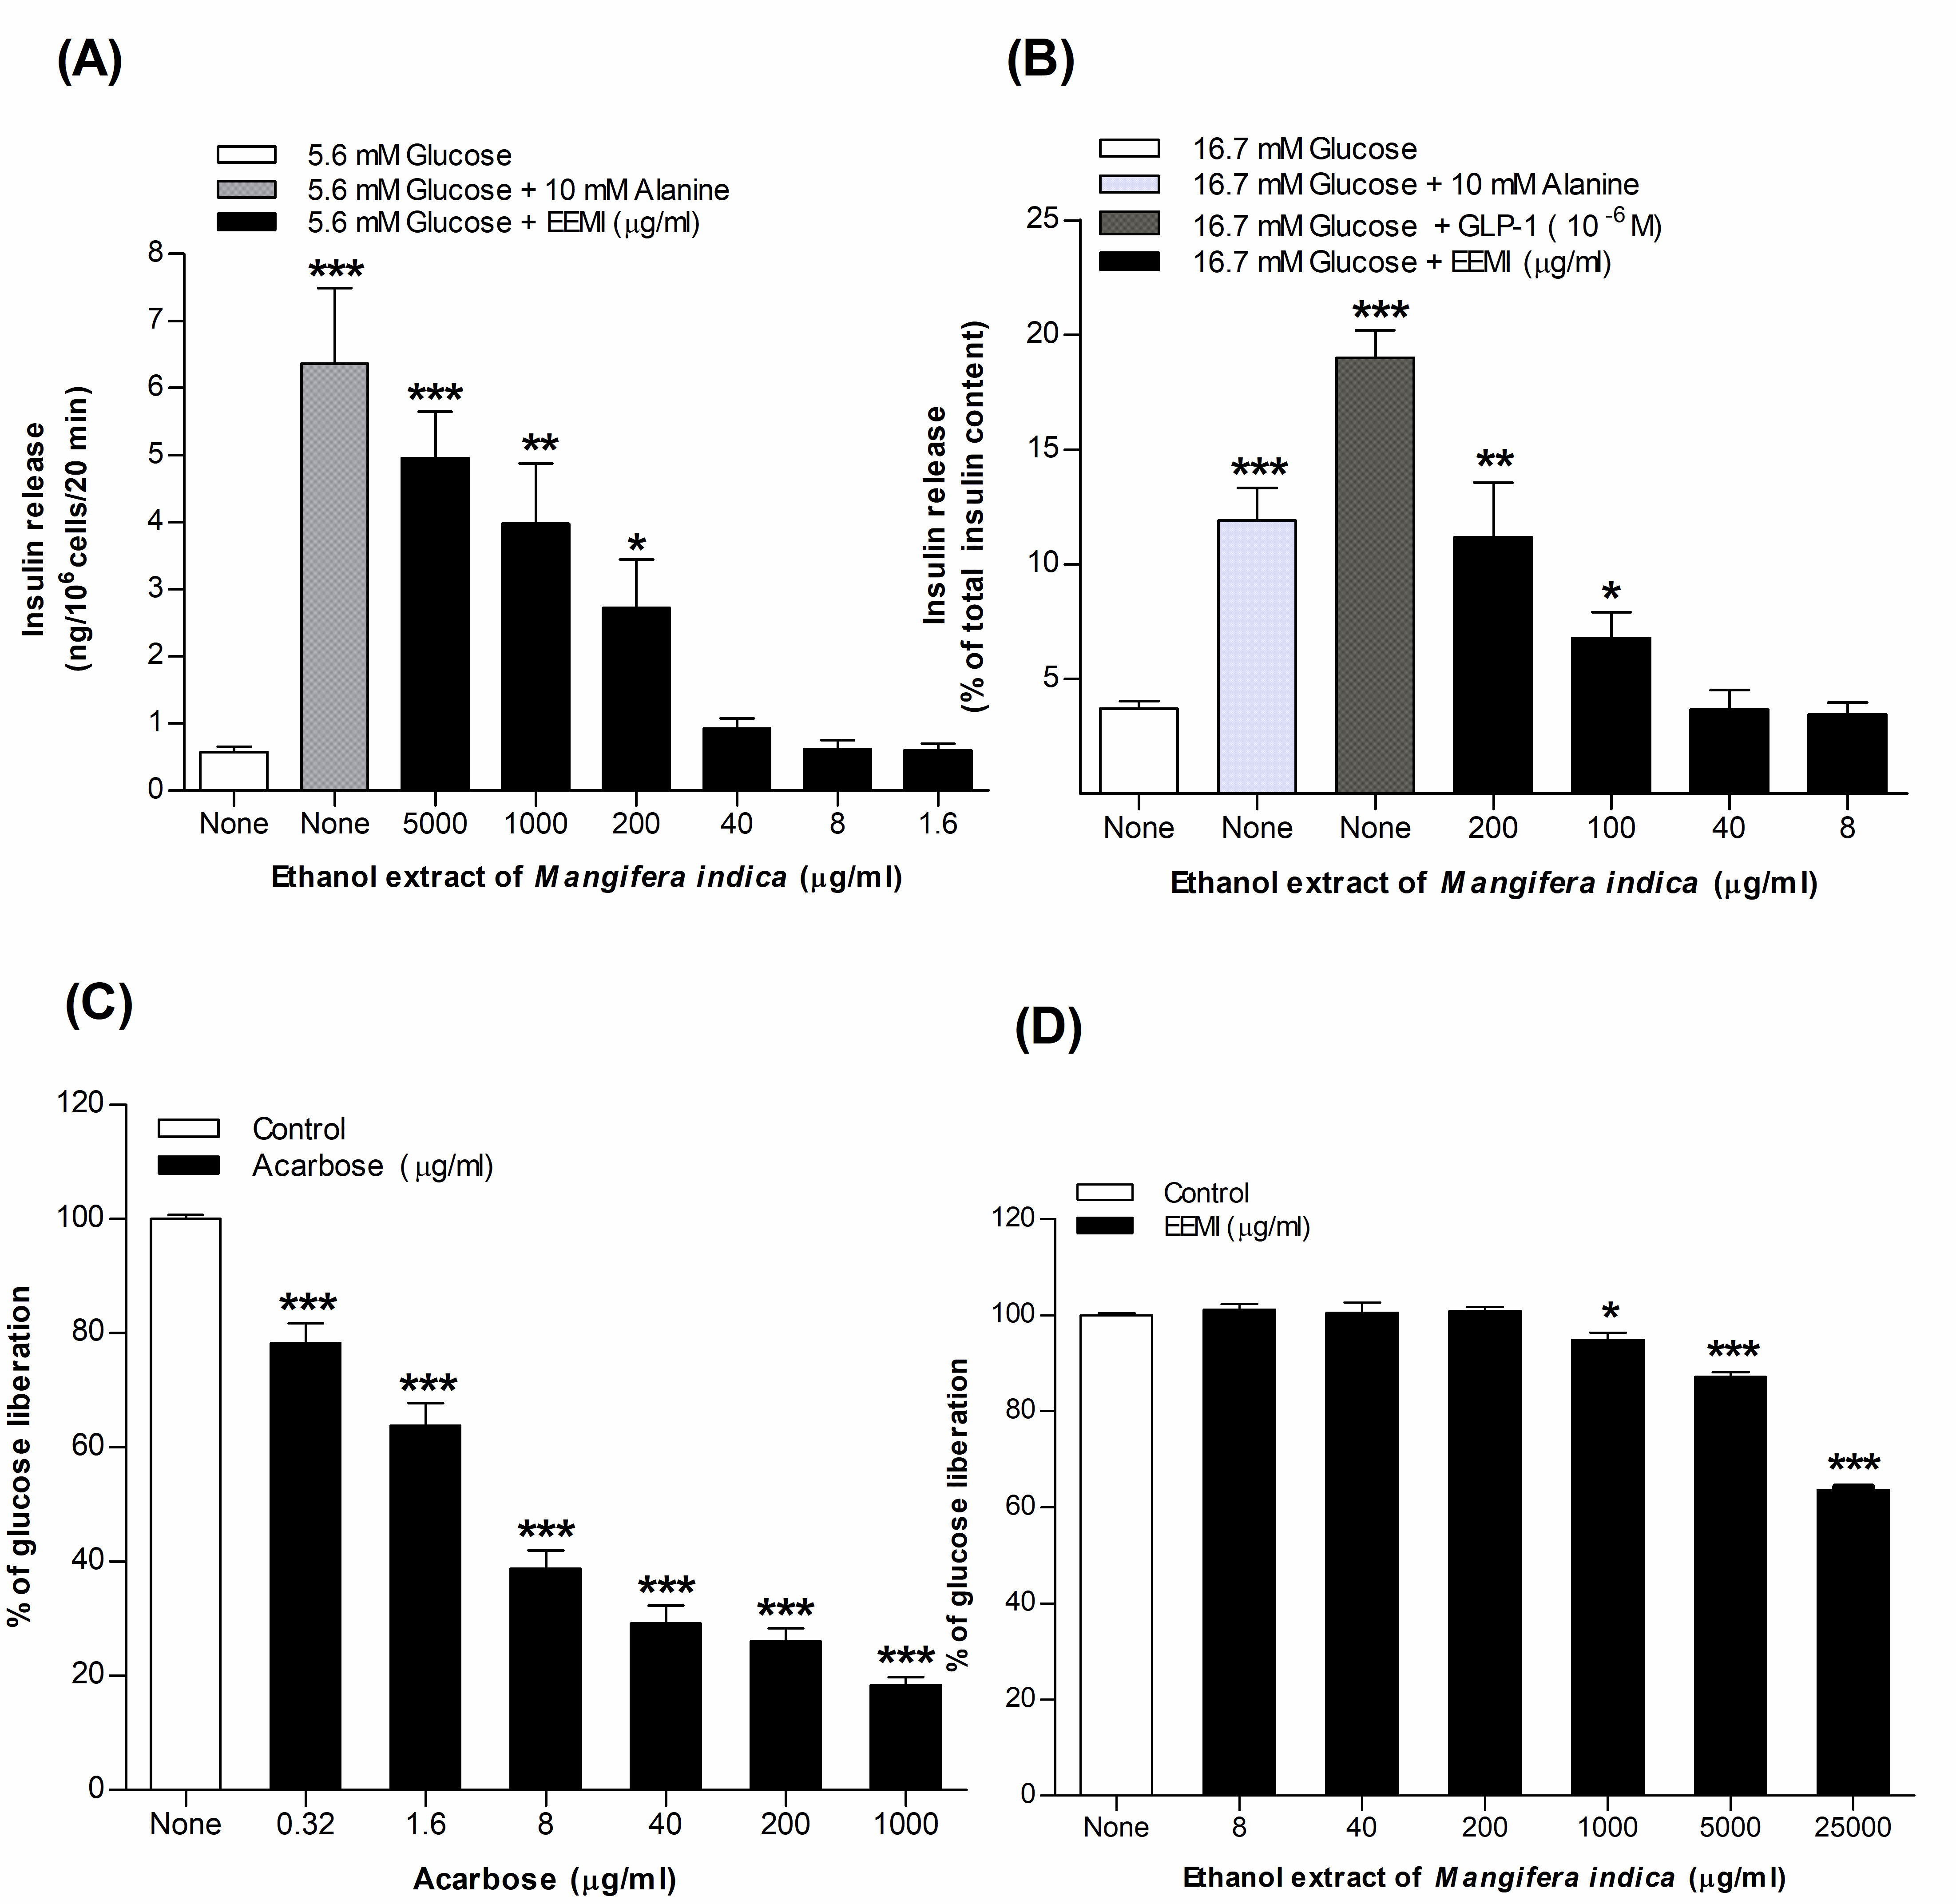
3.1. Insulin Release from BRIN-BD11 Cells Using EEMI

The insulin-releasing activity of EEMI (1.6–5000 µg/mL) using BRIN-BD11 cells is depicted in Figure 1A. The insulin secretory basal rate in BRIN-BD11 cells was 0.58 ± 0.08 ng/106 cells/20 min, and insulin secretagogues, alanine (10 mM), increased (p < 0.001) the insulin secretory rate to 6.37 ± 1.12 ng/106 cells/20 min in the presence of 5.6 mM glucose (Figure 1A). EEMI at 5.6 mM glucose significantly (p < 0.05–0.001) improved the insulin releasing rate from 2.73 ± 0.72 to 4.95 ± 0.70 ng/106 cells/20 min in a dose-dependent (200–5000 µg/mL) manner (Figure 1A).

3.2. Insulin Release from Isolated Mouse Islets Using EEMI

The dose-dependent (8–200 µg/mL) insulin-releasing effects of EEMI from isolated mouse islets are shown in Figure 1B. In the presence of 16.7 mM glucose, the basal level of insulin release from isolated mouse islets was 3.73 ± 0.30 ng/106 cells/20 min, and the positive controls’ alanine (10 mM) and GLP-1 (10−6 and 10−8 M) significantly (p < 0.001) increased insulin secretion to 11.92 ± 1.40 and 19.00 ± 1.21 ng/106 cells/20 min, respectively (Figure 1B). EEMI (100–200 µg/mL) at 16.7 mM glucose enhanced (p < 0.05–0.01) insulin release, ranging from 6.79 ± 1.14 to 11.16 ± 2.41 ng/106 cells/20 min (Figure 1B). At high concentration, EEMI demonstrated insulin-releasing properties nearly comparable to the alanine-stimulated insulin secretagogue (Figure 1B).

3.3. Starch Digestion Using EEMI

Figure 1C,D illustrate the concentration-dependent effects of acarbose (0.32–1000 µg/mL) and EEMI (8–25,000 µg/mL) on starch digestion, respectively. Acarbose, as a positive control, displayed a dramatic dose-dependent inhibition of glucose liberation (21.76% to 81.59%) at increasing concentrations (0.32–1000 µg/mL) (p < 0.001; Figure 1C). EEMI exhibited a significant (p < 0.05–0.001) reduction in enzymatic glucose liberation ranging from 5.04% to 36.44% in a concentration-dependent manner (1000–25,000 µg/mL), as shown in Figure 1D.

3.4. DPPH Assay Using EEMI

EEMI significantly (p < 0.01–0.001) scavenged DPPH activity by 9.95 ± 1.15% to 80.99 ± 1.35% in a dose-dependent manner (1.6–5000 µg/mL) (Table 1). Similarly, L-ascorbic acid strongly (p < 0.01–0.001) suppressed DPPH activity by 10.82 ± 1.32% to 97.24 ± 1.10% in a concentration-dependent manner (1.6–5000 µg/mL) (Table 1).

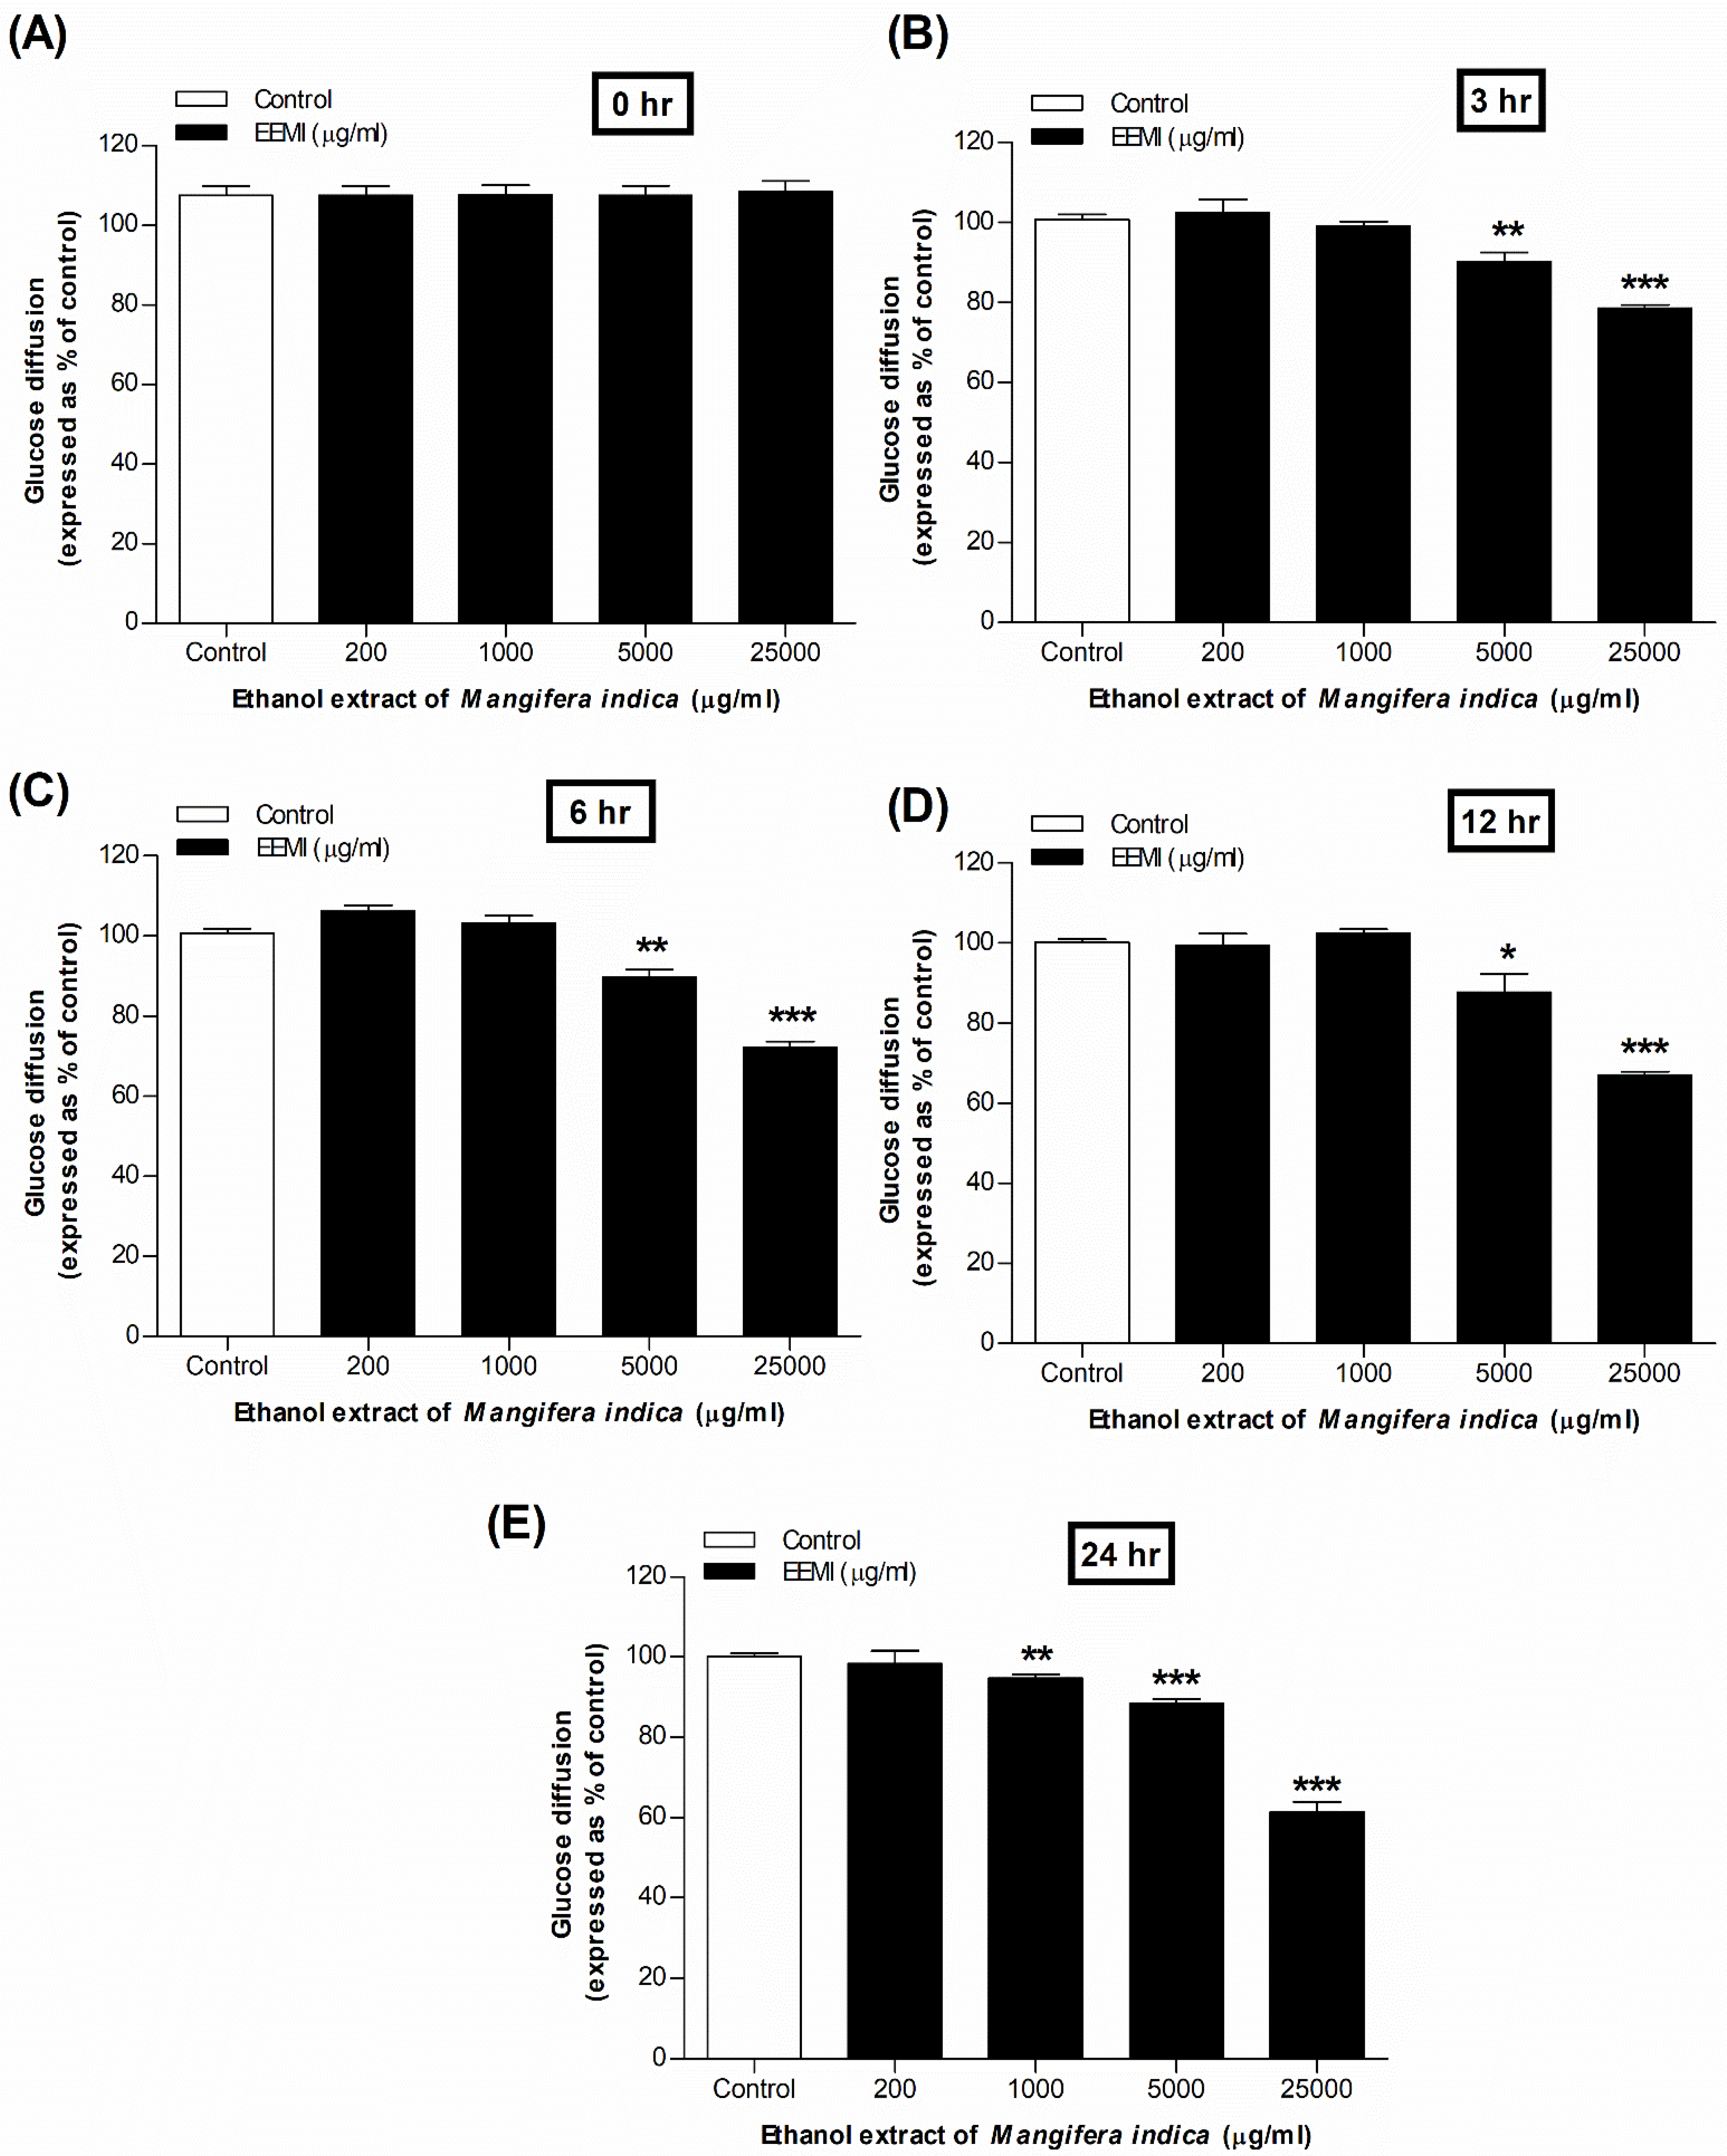
3.5. Glucose Diffusion Using EEMI

No significant inhibition of glucose absorption was observed at 0 h with EEMI (Figure 1A). At 3, 6, and 12 h, however, a significant (p < 0.05–0.01) decrease was observed in a dose-dependent manner (10.62 ± 2.56% to 33.00 ± 1.25% at concentrations from 5000 to 25,000 µg/mL) (Figure 2B–D). Finally, at 24 h, the most significant (p < 0.01–0.001) reduction in glucose absorption was observed, with a range of 5.53 ± 1.2% to 38.85 ± 2.62% at 1000–25,000 µg/Ml (Figure 2E).

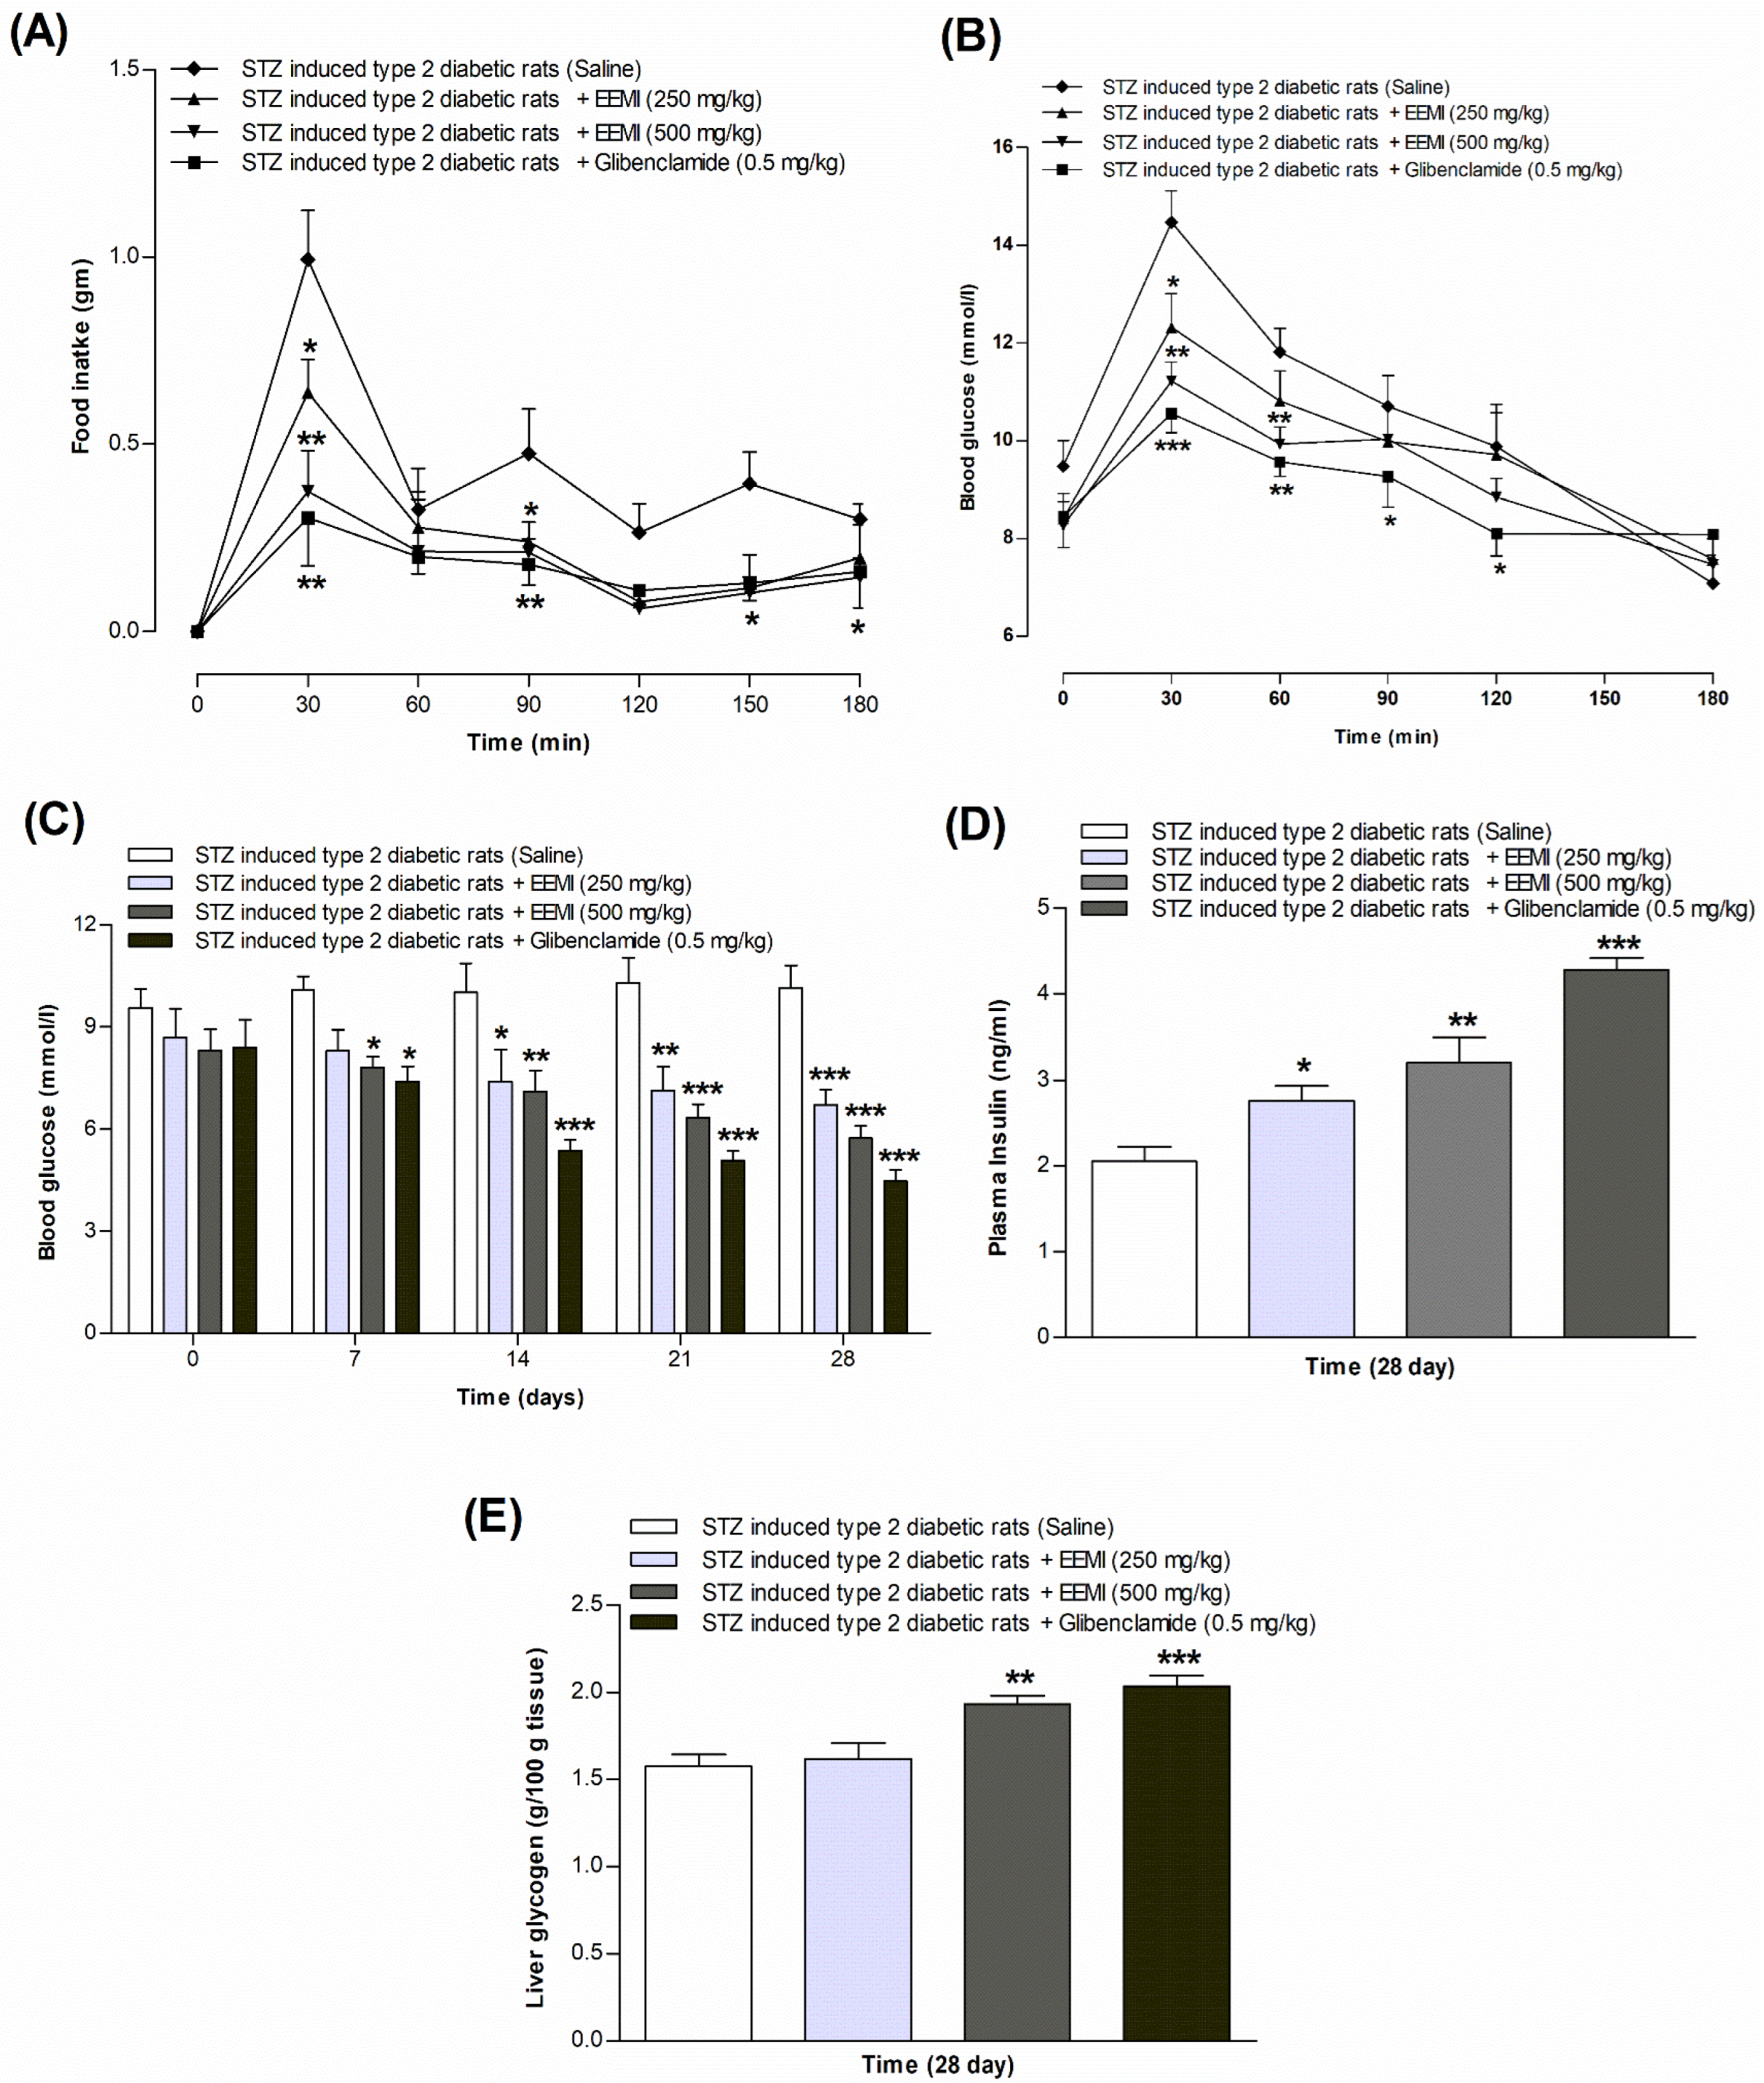
3.6. Feeding Test Using EEMI

The oral administration of EEMI or glibenclamide significantly (p < 0.05–0.01; Figure 3A) improved food intake in STZ-induced T2DM rats compared to untreated rats. EEMI at 250 mg/kg showed a significant (p < 0.05) reduction in food intake at 30 and 90 min. EEMI at 500 mg/kg showed a remarkable (p < 0.05–0.01) decrease in food intake at 30, 90, and 150 min. Glibenclamide (0.5 mg/kg) consistently (p < 0.05–0.01) decreased food intake throughout the test.

3.7. Oral Glucose Tolerance Test Using EEMI

Following the oral gavage of EEMI or glibenclamide with glucose, oral glucose tolerance significantly improved in STZ-induced T2DM rats compared to untreated rats (p < 0.05–0.001; Figure 3B). EEMI at 250 mg/kg with glucose (2.5 g/kg) significantly (p < 0.05) improved glucose tolerance at 30 min. EEMI at 500 mg/kg with glucose (2.5 g/kg) remarkably (p < 0.05–0.01) improved glucose tolerance at 30 and 60 min. The glucose tolerance improvement (p < 0.05–0.001) with glibenclamide (0.5 mg/kg) and glucose (2.5 g/kg) remained consistent over the 180 min experiment.

3.8. Fasting Blood Glucose, Plasma Insulin, and Liver Glycogen Using EEMI

Figure 3C shows fasting blood glucose (FBG) levels over 28 days at 7-day intervals. Initially, on day 0, no significant differences were observed between the groups. However, after 7 days of treatment, EEMI at 500 mg/kg and glibenclamide at 0.5 mg/kg significantly (p < 0.05) improved blood glucose levels, dropping to 7.82 and 7.42 mmol/L, respectively. This improvement continued throughout the 28-day study period, with EEMI (250–500 mg/kg) and glibenclamide (0.5 mg/kg) exhibiting significant reductions in FBG at 14 and 21 days (p < 0.05–0.001), respectively. Notably, the most significant (p < 0.001) reduction was observed on day 28, reaching 6.71, 5.73, and 4.46 mmol/L for EEMI (250–500 mg/kg) and glibenclamide (0.5 mg/kg), respectively.
Additionally, plasma insulin levels were significantly (p < 0.05–0.001) improved after 28 days of treatment with EEMI at both doses and glibenclamide (Figure 3D). Similarly, a significant (p < 0.01–0.001) increase in liver glycogen was observed following 28 days of treatment with EEMI at 500 mg/kg and glibenclamide (Figure 3E).

3.9. Chronic Effects of Using EEMI

Treatment with EEMI (250 and 500 mg/kg) or glibenclamide (0.5 mg/kg) for 28 days did not significantly affect body weight in STZ-induced T2DM rats during the first two weeks (Table 2). However, significant (p < 0.01–0.001) improvements were observed on days 21 and 28. Both EEMI and glibenclamide notably increased serum HDL cholesterol throughout the study period (p < 0.05–0.01 for EEMI on day 21 and 28; p < 0.01–0.001 for glibenclamide on day 7, 14, 21, and 28) (Table 2). EEMI also gradually (p < 0.05–0.001) reduced LDL (day 21 and 28; Table 2), triglyceride (day 21 and 28; Table 2), and total cholesterol (day 14, 21, and 28; Table 2) levels. Similarly, glibenclamide significantly (p < 0.01–0.001) decreased all three lipid levels over the 28-day study period (Table 2). These findings suggest that both EEMI and glibenclamide possess promising potential in improving lipid profiles of STZ-induced T2DM rats.

3.10. Phytochemical Screening Using EEMI

A preliminary phytochemical screening was conducted to determine the presence or absence of effective antidiabetic phytoconstituents. The study indicated the presence of alkaloids, tannins, saponins, steroids, glycosides, flavonoids, and reducing sugar and the absence of anthraquinone in EEMI (Table 3).

4. Discussion

In developed countries, people with diabetes have a 2- to 4-fold higher risk of cardiovascular disease compared to the general population [33]. While oral antihyperglycemic agents can manage T2DM, they often require the addition of synthesized insulin, which increases the risk of undesirable side effects [34,35]. This has led to a growing interest in plant-based organic antidiabetic drugs, which offer a promising avenue for managing diabetes with fewer side effects by potentially improving β-cell function and addressing diabetes-related disorders [34].
Mangifera indica (MI) is an evergreen fruit tree that has played a significant role in both ancient and indigenous medical practices for more than 4000 years [10]. Among the many bio-macromolecules found in mango leaves (MLs), protein is the most prevalent. Other nutrients that are frequently found in MLs include nitrogen, potassium, phosphorus, iron, sodium chloride, calcium, magnesium, and vitamins A and B complex, as well as E and C [36]. Previous studies have reported that ML extracts are effective for treating a wide range of illnesses, including diabetes, bronchitis, diarrhea, asthma, renal disease, scabies, respiratory issues, syphilis, and urinary disorders [10,37]. However, the exact molecular mechanism underlying these effects remains unclear. The current study aimed at discovering the underlying mechanism of action of the ethanolic extract of Mangifera indica (EEMI) leaves.
The regulation of insulin secretion in the pancreatic β-cell is intricately associated with glucose metabolism in peripheral tissue [38]. Impaired insulin secretion is considered the initial culprit in the progression towards T2DM [39]. Our in vitro study reveals EEMI’s stimulatory effect on insulin release in a concentration-dependent manner. Both clonal BRIN-BD11 cells and isolated mouse islets exhibited increased insulin secretion at 5.6 mM and 16.7 mM glucose, respectively, signifying EEMI’s role in β-cell function. To validate EEMI’s insulinotropic effect, we employed alanine and GLP-1 as positive controls. These well-known insulin-modulating agents trigger insulin secretion by depolarizing ATP-sensitive K+ channels in response to glucose, leading to membrane depolarization and elevated intracellular calcium levels [22]. Furthermore, the presence of specific phytochemicals like alkaloids, tannins, saponins, and flavonoids in EEMI suggests its potential to increase insulin secretion through multiple mechanisms and pathways [40,41,42,43].
A carbohydrate digestion study investigated the potential of EEMI to inhibit starch breakdown. EEMI showed a concentration-dependent reduction in glucose liberation, suggesting it may act on α-amylase and α-glucosidase enzymes crucial for breaking down carbohydrates into glucose and potentially leading to elevated blood sugar after meals [20]. Additionally, the dietary fiber content of M. indica may deter hunger by impeding stomach emptying and delaying energy and nutrient absorption. This could contribute to reduced postprandial glucose levels [44], consistent with previous findings that the M. indica leaf acts as a promising antidiabetic agent by inhibiting digestive enzymes, enhancing glucose uptake, and suppressing free radicals [45].
A subsequent in vitro diffusion assay revealed that EEMI significantly reduced glucose absorption and diffusion over a 24 h period. These findings align with previous research suggesting that M. indica may hinder intestinal glucose absorption due to its enriched polyphenol content [46]. Additionally, dietary fibers are known to reduce postprandial blood sugar via a variety of mechanisms, including increasing the viscosity of small intestine fluid, decreasing glucose diffusion, and delaying digestion via α-amylase inhibition [47].
Recent evidence highlights the key role of oxidative stress in diabetes, where it contributes to non-enzymatic protein glycation, heightened lipid peroxidation, and glucose oxidation, all of which lead to free radical generation. This, in turn, damages cellular machinery and enzymes, ultimately contributing to insulin resistance [48]. Interestingly, our DPPH study revealed the significant radical scavenging ability of EEMI. This suggests that M. indica might help prevent cellular damage and improve insulin sensitivity in diabetes by reducing oxidative stress and its associated complications, such as endothelial dysfunction and inflammation [49,50]. Furthermore, the identified phytochemicals in this current study may be responsible for these potential effects.
Excessive food intake is a major risk factor for obesity, insulin resistance, and T2DM. Our feeding test revealed that EEMI significantly reduces food intake in rats, indicating the effects of EEMI on appetite suppression. Previous studies suggest that Mangiferin, a compound found in M. indica, may be responsible for this effect [51]. An acute oral glucose tolerance test (OGTT) showed that EEMI treatment significantly improves blood sugar control in T2DM rats. This aligns with previous findings suggesting that M. indica’s phytochemicals, including Mangiferin, quercetin, kaempferol, catechin, and epicatechin, may enhance insulin sensitivity and directly impact blood sugar levels [16]. Over 28 days of treatment, EEMI led to a decrease in fasting blood glucose levels and an increase in plasma insulin levels; this is consistent with previous studies of M. indica and suggests potential insulin-secretory properties [52]. Furthermore, the liver glycogen content also increased, which indicates pancreatic beta-cell regeneration and decreased fat deposition [30]. Notably, EEMI also led to a substantial reduction in body weight, suggesting a potential shift in energy expenditure that warrants further investigation [30].
Non-esterified fatty acids (NEFAs) released from adipose tissue contribute to insulin resistance and β-cell dysfunction, ultimately leading to T2DM. EEMI significantly improved the lipid profile, suggesting that it may reduce NEFA levels through various mechanisms, including blocking HMG-CoA reductase activity and hepatic glucose production while enhancing glucose uptake. This aligns with previous findings on M. indica’s multifaceted approach to metabolic regulation [16,53,54,55].
Our analysis of EEMI revealed a diverse range of active pharmacological components, including alkaloids, tannins, saponins, flavonoids, and reducing sugars. Interestingly, several of these compounds have been linked to improved glucose management in T2DM through various mechanisms [2,56,57,58]. For example, tannins and certain alkaloids have been shown to stimulate glucose absorption and regulate glucose homeostasis through different pathways such as the phosphatidylinositol (PI3) and AMPK pathway [59,60,61]. Additionally, the combination of triterpenoid and saponins has exhibited promising results in inhibiting intestinal glucose absorption [62]. Furthermore, the presence of antioxidant flavonoids aligns with existing research demonstrating their ability to enhance insulin secretion, protect pancreatic β-cells, and improve overall glucose tolerance in HFF- and STZ-induced diabetic rats [63,64]. The limitation of these studies is the lack of identification of the exact biomolecules and the specific mechanisms by which they lower blood glucose and stimulate insulin secretion. Therefore, further investigation is crucial to pinpoint the precise role of M. indica leaves in diabetes management; this preliminary analysis suggests EEMI possesses a fascinating combination of potentially beneficial phytochemicals warranting a further exploration of their antidiabetic potential.

5. Conclusions

Our research unveils the potential of Mangifera indica as a natural approach to managing T2DM. In vitro studies showed that EEMI efficiently increases insulin secretion from BRIN-BD11 cells and isolated mouse islets and inhibits carbohydrate digestion, DPPH activity, and glucose diffusion. This suggests its ability to directly influence key factors in blood sugar control. Further, in vivo experiments with diabetic rats demonstrated EEMI’s effectiveness in reducing food intake, improving body weight, enhancing oral glucose tolerance, and regulating blood sugar, insulin levels, and the lipid profile. These findings align with the traditional use of Mangifera indica for diabetes and suggest the presence of potent bioactive compounds. The identified phytoconstituents in EEMI, including alkaloids, tannins, and flavonoids, offer promising leads for future research. Further exploration, including isolating and characterizing these active compounds, could pave the way for developing innovative pharmacological strategies to address the complications associated with T2DM. Subsequent human clinical trials would be crucial to confirm the antihyperglycemic effects observed in this study and potentially establish Mangifera indica as a viable alternative to synthetic drugs. This exciting prospect underscores the immense potential of natural resources like Mangifera indica in shaping a healthier future for those living with this chronic condition.

Author Contributions

P.A. and Y.H.A.A.-W. conceived and designed the research study and equally supervised it. P.A., J.T.K., A.E.R., S.A.R., T.J., R.J.O., S.S. and P.B. conducted the experiments and analyzed the data. P.A. and J.T.K. interpreted the results, prepared the figures, and drafted the manuscript with Y.H.A.A.-W.; P.A. and Y.H.A.A.-W. edited the revised manuscript. All authors have read and agreed to the published version of the manuscript.

Funding

This research received no external funding.

Institutional Review Board Statement

The animal study protocol was approved by Animal Welfare and Ethical Review Board (AWERB) of Ulster University on May 2018 for studies involving animals in accordance with the Declaration of UK regulations and Act 1986 (Animal project/personal licenses PIL1822 and PPL 2804; EU Directive 2010/63EU).

Informed Consent Statement

Not Applicable.

Data Availability Statement

Due to ethical or legal restrictions, the data underlying this study cannot be publicly shared. However, the corresponding author welcomes reasonable requests for data access.

Acknowledgments

We gratefully acknowledge the support of Ulster University Strategic Research Funding and Independent University, Bangladesh (IUB), Dhaka 1229, Bangladesh, for providing the laboratory facilities that enabled this research.

Conflicts of Interest

The authors disclose no conflicts of interest.

Abbreviations

BRIN-BD11Clonal pancreatic BRIN-BD11 β-cells
DPPH2,2-diphenyl-1-picrylhydrazyl
GLP-1Glucagon-Like Peptide 1
HDLHigh-Density Lipoprotein
KATPATP-sensitive K+ channel
LDLLow-Density Lipoprotein
T2DMType 2 diabetes mellitus
VLDLVery-Low-Density Lipoprotein

References

  1. Banday, M.Z.; Sameer, A.S.; Nissar, S. Pathophysiology of Diabetes: An Overview. Avicenna J. Med. 2020, 10, 174–188. [Google Scholar] [CrossRef] [PubMed]
  2. Ansari, P.; Samia, J.F.; Khan, J.T.; Rafi, M.R.; Rahman, S.; Rahman, A.B.; Abdel-Wahab, Y.H.A.; Seidel, V. Protective Effects of Medicinal Plant-Based Foods against Diabetes: A Review on Pharmacology, Phytochemistry, and Molecular Mechanisms. Nutrients 2023, 15, 3266. [Google Scholar] [CrossRef] [PubMed]
  3. Fan, W. Epidemiology in Diabetes Mellitus and Cardiovascular Disease. Cardiovasc. Endocrinol. Metab. 2017, 6, 8–16. [Google Scholar] [CrossRef] [PubMed]
  4. George, M.M.; Copeland, K.C. Current Treatment Options for Type 2 Diabetes Mellitus in Youth: Today’s Realities and Lessons from the TODAY Study. Curr. Diabetes Rep. 2013, 13, 72–80. [Google Scholar] [CrossRef] [PubMed]
  5. Abu-Odeh, A.M.; Talib, W.H. Middle East Medicinal Plants in the Treatment of Diabetes: A Review. Molecules 2021, 26, 742. [Google Scholar] [CrossRef] [PubMed]
  6. Sofowora, A.; Ogunbodede, E.; Onayade, A. The Role and Place of Medicinal Plants in the Strategies for Disease Prevention. Afr. J. Tradit. Complement. Altern. Med. 2013, 10, 210–229. [Google Scholar] [CrossRef] [PubMed]
  7. Modak, M.; Dixit, P.; Londhe, J.; Ghaskadbi, S.; Devasagayam, T.P.A. Indian Herbs and Herbal Drugs Used for the Treatment of Diabetes. J. Clin. Biochem. Nutr. 2007, 40, 163–173. [Google Scholar] [CrossRef] [PubMed]
  8. Patel, D.; Prasad, S.; Kumar, R.; Hemalatha, S. An overview on Antidiabetic Medicinal Plants Having Insulin Mimetic Property. Asian Pac. J. Trop. Biomed. 2012, 2, 320–330. [Google Scholar] [CrossRef] [PubMed]
  9. Pang, G.-M.; Li, F.-X.; Yan, Y.; Zhang, Y.; Kong, L.-L.; Zhu, P.; Wang, K.-F.; Zhang, F.; Liu, B.; Lu, C. Herbal Medicine in the Treatment of Patients with Type 2 Diabetes Mellitus. Chin. Med. J. 2019, 132, 78–85. [Google Scholar] [CrossRef]
  10. Ediriweera, M.K.; Tennekoon, K.H.; Samarakoon, S.R. A Review on Ethnopharmacological Applications, Pharmacological Activities, and Bioactive Compounds of Mangifera indica (Mango). Evid.-Based Complement. Altern. Med. 2017, 2017, 6949835. [Google Scholar] [CrossRef]
  11. Shah, K.; Patel, M.; Patel, R.; Parmar, P. Mangifera indica (Mango). Pharmacogn. Rev. 2010, 4, 42–48. [Google Scholar] [CrossRef]
  12. Akram, M.; Hamid, A.; Khalil, A.; Ghaffar, A.; Tayyaba, N.; Saeed, A.; Ali, M.; Naveed, A. Review on Medicinal Uses, Pharmacological, Phytochemistry and Immunomodulatory Activity of Plants. Int. J. Immunopathol. Pharmacol. 2014, 27, 313–319. [Google Scholar] [CrossRef]
  13. Saleem, M.; Tanvir, M.; Akhtar, M.F.; Iqbal, M.; Saleem, A. Antidiabetic Potential of Mangifera indica L. cv. Anwar Ratol Leaves: Medicinal Application of Food Wastes. Medicina 2019, 55, 353. [Google Scholar] [CrossRef] [PubMed]
  14. Aderibigbe, A.O.; Emudianughe, T.S.; Lawal, B.A.S. Evaluation of the antidiabetic action of Mangifera indica in mice. Phytotherapy Res. 2001, 15, 456–458. [Google Scholar] [CrossRef] [PubMed]
  15. Yoopum, S.; Wongmanee, N.; Rojanaverawong, W.; Rattanapunya, S.; Sumsakul, W.; Hanchang, W. Mango (Mangifera indica L.) seed kernel extract suppresses hyperglycemia by modulating pancreatic β cell apoptosis and dysfunction and hepatic glucose metabolism in diabetic rats. Environ. Sci. Pollut. Res. 2023, 30, 123286–123308. [Google Scholar] [CrossRef] [PubMed]
  16. Meneses, M.A.; Caputo, G.; Scognamiglio, M.; Reverchon, E.; Adami, R. Antioxidant Phenolic Compounds Recovery from Mangifera indica L. by-Products by Supercritical Antisolvent Extraction. J. Food Eng. 2015, 163, 45–53. [Google Scholar] [CrossRef]
  17. McClenaghan, N.H.; Barnett, C.R.; Ah-Sing, E.; Abdel-Wahab, Y.H.A.; O’Harte, F.P.M.; Yoon, T.-W.; Swanston-Flatt, S.K.; Flatt, P.R. Characterization of a Novel Glucose-Responsive Insulin-Secreting Cell Line, BRIN-BD11, Produced by Electrofusion. Diabetes 1996, 45, 1132–1140. [Google Scholar] [CrossRef] [PubMed]
  18. Abdel-Wahab, Y.H.; Power, G.J.; Flatt, P.R.; Woodhams, D.C.; Rollins-Smith, L.A.; Conlon, J.M. A Peptide of the Phylloseptin Family from the Skin of the Frog Hylomantis Lemur (Phyllomedusinae) with Potent In Vitro and In Vivo Insulin-Releasing Activity. Peptides 2008, 29, 2136–2143. [Google Scholar] [CrossRef] [PubMed]
  19. Moran, B.M.; Abdel-Wahab, Y.H.A.; Flatt, P.R.; McKillop, A.M. Evaluation of the Insulin-Releasing and Glucose-Lowering Effects of GPR120 Activation in Pancreatic β-Cells. Diabetes Obes. Metab. 2014, 16, 1128–1139. [Google Scholar] [CrossRef]
  20. Ansari, P.; Choudhury, S.T.; Abdel-Wahab, Y.H.A. Insulin Secretory Actions of Ethanol Extract of Eucalyptus citriodora Leaf, including Plasma DPP-IV and GLP-1 Levels in High-Fat-Fed Rats, as Well as Characterization of Biologically Effective Phytoconstituents. Metabolites 2022, 12, 757. [Google Scholar] [CrossRef]
  21. Ansari, P.; Hannan, J.; Seidel, V.; Abdel-Wahab, Y.H. Polyphenol-Rich Leaf of Annona squamosa Stimulates Insulin Release from BRIN-BD11 Cells and Isolated Mouse Islets, Reduces (CH2O)n Digestion and Absorption, and Improves Glucose Tolerance and GLP-1 (7-36) Levels in High-Fat-Fed Rats. Metabolites 2022, 12, 995. [Google Scholar] [CrossRef] [PubMed]
  22. Ansari, P.; Hannan, J.M.A.; Choudhury, S.T.; Islam, S.S.; Talukder, A.; Seidel, V.; Abdel-Wahab, Y.H.A. Antidiabetic Actions of Ethanol Extract of Camellia sinensis Leaf Ameliorates Insulin Secretion, Inhibits the DPP-IV Enzyme, Improves Glucose Tolerance, and Increases Active GLP-1 (7–36) Levels in High-Fat-Diet-Fed Rats. Medicines 2022, 9, 56. [Google Scholar] [CrossRef] [PubMed]
  23. Ansari, P.; Islam, S.S.; Akther, S.; Khan, J.T.; Shihab, J.A.; Abdel-Wahab, Y.H.A. Insulin Secretory Actions of Ethanolic Extract of Acacia Arabica Bark in High Fat-Fed Diet-Induced Obese Type 2 Diabetic Rats. Biosci. Rep. 2023, 43, BSR20230329. [Google Scholar] [CrossRef]
  24. Ansari, P.; Hannan, J.A.; Abdel-Wahab, Y.H.; Flatt, P.R. Antidiabetic and Insulinotropic Properties of Bark of Heritiera Fomes: Inhibits Starch Digestion, Protein Glycation, DPP-IV Activity, and Glucose Absorption in Gut. Planta Medica 2021, 87, 1252. [Google Scholar] [CrossRef]
  25. Ansari, P.; Azam, S.; Seidel, V.; Abdel-Wahab, Y.H.A. In Vitro and In Vivo Antihyperglycemic Activity of the Ethanol Extract of Heritiera Fomes Bark and Characterization of Pharmacologically Active Phytomolecules. J. Pharm. Pharmacol. 2022, 74, rgac010. [Google Scholar] [CrossRef] [PubMed]
  26. Katalinic, V.; Milos, M.; Kulisic, T.; Jukic, M. Screening of 70 Medicinal Plant Extracts for Antioxidant Capacity and Total Phenols. Food Chem. 2006, 94, 550–557. [Google Scholar] [CrossRef]
  27. Chaves, N.; Santiago, A.; Alías, J.C. Quantification of the Antioxidant Activity of Plant Extracts: Analysis of Sensitivity and Hierarchization Based on the Method Used. Antioxidants 2020, 9, 76. [Google Scholar] [CrossRef] [PubMed]
  28. Lenzen, S. The Mechanisms of Alloxan- and Streptozotocin-Induced Diabetes. Diabetologia 2008, 51, 216–226. [Google Scholar] [CrossRef] [PubMed]
  29. Shill, M.C.; Rakib, A.A.; Khan, S.I.; Hossain, M.; Alam, S.; Hossain, H.; Karmakar, U.K.; Bhuia, S.; Shahriar, M.; Reza, H.M.; et al. Polyphenol-Standardized Aphanamixis Polystachya Leaf Extract Ameliorates Diabetes, Oxidative Stress, Inflammation, and Fibrosis in Streptozotocin-Induced Diabetic Rats. J. Food Biochem. 2024, 2024, e9441968. [Google Scholar] [CrossRef]
  30. López-Soldado, I.; Guinovart, J.J.; Duran, J. Increasing Hepatic Glycogen Moderates the Diabetic Phenotype in Insulin-Deficient Akita Mice. J. Biol. Chem. 2021, 296, 100498. [Google Scholar] [CrossRef]
  31. Hannan, J.M.A.; Ansari, P.; Azam, S.; Flatt, P.R.; Wahab, Y.H.A.A. Effects of Spirulina Platensis on Insulin Secretion, Dipeptidyl Peptidase IV Activity and both Carbohydrate Digestion and Absorption Indicate Potential as an Adjunctive Therapy for Diabetes. Br. J. Nutr. 2020, 124, 1021–1034. [Google Scholar] [CrossRef] [PubMed]
  32. Gul, R.; Jan, S.U.; Faridullah, S.; Sherani, S.; Jahan, N. Preliminary Phytochemical Screening, Quantitative Analysis of Alkaloids, and Antioxidant Activity of Crude Plant Extracts from Ephedra intermedia Indigenous to Balochistan. Sci. World J. 2017, 2017, 5873648. [Google Scholar] [CrossRef]
  33. Dal Canto, E.; Ceriello, A.; Rydén, L.; Ferrini, M.; Hansen, T.B.; Schnell, O.; Standl, E.; Beulens, J.W. Diabetes as a Cardiovascular Risk Factor: An Overview of Global Trends of Macro and Micro Vascular Complications. Eur. J. Prev. Cardiol. 2019, 26 (Suppl. S2), 25–32. [Google Scholar] [CrossRef] [PubMed]
  34. Ansari, P.; Akther, S.; Khan, J.T.; Islam, S.S.; Masud, S.R.; Rahman, A.; Seidel, V.; Abdel-Wahab, Y.H.A. Hyperglycaemia-Linked Diabetic Foot Complications and Their Management Using Conventional and Alternative Therapies. Appl. Sci. 2022, 12, 11777. [Google Scholar] [CrossRef]
  35. Nathan, D.M.; Buse, J.B.; Davidson, M.B.; Ferrannini, E.; Holman, R.R.; Sherwin, R.; Zinman, B. Medical Management of Hyperglycemia in Type 2 Diabetes: A Consensus Algorithm for the Initiation and Adjustment of Therapy. Diabetes Care 2009, 32, 193–203. [Google Scholar] [CrossRef] [PubMed]
  36. Kumar, M.; Saurabh, V.; Tomar, M.; Hasan, M.; Changan, S.; Sasi, M.; Maheshwari, C.; Prajapati, U.; Singh, S.; Prajapat, R.K.; et al. Mango (Mangifera indica L.) Leaves: Nutritional Composition, Phytochemical Profile, and Health-Promoting Bioactivities. Antioxidants 2021, 10, 299. [Google Scholar] [CrossRef]
  37. Kulkarni, V.M.; Rathod, V.K. Extraction of Mangiferin from Mangifera indica Leaves Using Three Phase Partitioning Coupled with Ultrasound. Ind. Crop Prod. 2014, 52, 292–297. [Google Scholar] [CrossRef]
  38. Henquin, J.C. Triggering and Amplifying Pathways of Regulation of Insulin Secretion by Glucose. Diabetes 2000, 49, 1751–1760. [Google Scholar] [CrossRef] [PubMed]
  39. Porte, D. Clinical Importance of Insulin Secretion and Its Interaction with Insulin Resistance in the Treatment of Type 2 Diabetes Mellitus and Its Complications. Diabetes Metab. Res. Rev. 2001, 17, 181–188. [Google Scholar] [CrossRef]
  40. Kwon, D.Y.; Kim, Y.S.; Ryu, S.Y.; Choi, Y.H.; Cha, M.-R.; Yang, H.J.; Park, S. Platyconic Acid, a Saponin from Platycodi Radix, Improves Glucose Homeostasis by Enhancing Insulin Sensitivity In Vitro and In Vivo. Eur. J. Nutr. 2012, 51, 529–540. [Google Scholar] [CrossRef]
  41. Kumari, D.M.; Jain, S. Tannin: An Antinutrient with Positive Effect to Manage Diabetes. Res. J. Recent Sci. 2012, 2277, 2502. [Google Scholar]
  42. Muhammad, I.; Rahman, N.; Nayab, G.E.; Nishan, U.; Shah, M. Antidiabetic Activities of Alkaloids Isolated from Medicinal Plants. Braz. J. Pharm. Sci. 2021, 57, e19130. [Google Scholar] [CrossRef]
  43. Hajiaghaalipour, F.; Khalilpourfarshbafi, M.; Arya, A. Modulation of Glucose Transporter Protein by Dietary Flavonoids in Type 2 Diabetes Mellitus. Int. J. Biol. Sci. 2015, 11, 508–524. [Google Scholar] [CrossRef] [PubMed]
  44. Slavin, J.; Savarino, V.; Paredes-Diaz, A.; Fotopoulos, G. A Review of the Role of Soluble Fiber in Health with Specific Reference to Wheat Dextrin. J. Int. Med. Res. 2009, 37, 1–17. [Google Scholar] [CrossRef] [PubMed]
  45. Ngo, D.-H.; Ngo, D.-N.; Vo, T.T.N.; Vo, T.S. Mechanism of Action of Mangifera Indica Leaves for Anti-Diabetic Activity. Sci. Pharm. 2019, 87, 13. [Google Scholar] [CrossRef]
  46. Irondi, E.A.; Oboh, G.; Akindahunsi, A.A. Antidiabetic Effects of Mangifera Indica Kernel Flour-Supplemented Diet in Streptozotocin-Induced Type 2 Diabetes in Rats. Food Sci. Nutr. 2016, 4, 828–839. [Google Scholar] [CrossRef] [PubMed]
  47. Gondi, M.; Basha, S.A.; Bhaskar, J.J.; Salimath, P.V.; Rao, U.J.S.P. Anti-Diabetic Effect of Dietary Mango (Mangifera indica L.) Peel in Streptozotocin-Induced Diabetic Rats. J. Sci. Food Agric. 2015, 95, 991–999. [Google Scholar] [CrossRef] [PubMed]
  48. Maritim, A.C.; Sanders, R.A.; Watkins, J.B., 3rd. Diabetes, Oxidative Stress, and Antioxidants: A Review. J. Biochem. Mol. Toxicol. 2003, 17, 24–38. [Google Scholar] [CrossRef] [PubMed]
  49. Van Den Oever, I.A.M.; Raterman, H.G.; Nurmohamed, M.T.; Simsek, S. Endothelial Dysfunction, Inflammation, and Apoptosis in Diabetes Mellitus. Mediat. Inflamm. 2010, 2010, 792393. [Google Scholar] [CrossRef]
  50. Baliyan, S.; Mukherjee, R.; Priyadarshini, A.; Vibhuti, A.; Gupta, A.; Pandey, R.P.; Chang, C.-M. Determination of Antioxidants by DPPH Radical Scavenging Activity and Quantitative Phytochemical Analysis of Ficus religiosa. Molecules 2022, 27, 1326. [Google Scholar] [CrossRef]
  51. Minniti, G.; Laurindo, L.F.; Machado, N.M.; Duarte, L.G.; Guiguer, E.L.; Araujo, A.C.; Dias, J.A.; Lamas, C.B.; Nunes, Y.C.; Bechara, M.D.; et al. Mangifera indica L., By-Products, and Mangiferin on Cardio-Metabolic and Other Health Conditions: A Systematic Review. Life 2023, 13, 2270. [Google Scholar] [CrossRef] [PubMed]
  52. Boas, G.R.V.; Lemos, J.M.R.; de Oliveira, M.W.; dos Santos, R.C.; da Silveira, A.P.S.; Bacha, F.B.; Ito, C.N.A.; Cornelius, E.B.; Lima, F.B.; Rodrigues, A.M.S.; et al. Aqueous Extract from Mangifera indica Linn. (Anacardiaceae) Leaves Exerts Long-Term Hypoglycemic Effect, Increases Insulin Sensitivity and Plasma Insulin Levels on Diabetic Wistar Rats. PLoS ONE 2020, 15, e0227105. [Google Scholar] [CrossRef]
  53. Anila, L.; Vijayalakshmi, N. Flavonoids from Emblica Officinalis and Mangifera Indica—Effectiveness for Dyslipidemia. J. Ethnopharmacol. 2002, 79, 81–87. [Google Scholar] [CrossRef] [PubMed]
  54. Aromdee, C.; Pranakhon, R.; Pannangpetch, P. Effects of Iriflophenone 3-C-β-Glucoside on Fasting Blood Glucose Level and Glucose Uptake. Pharmacogn. Mag. 2015, 11, 82–89. [Google Scholar] [CrossRef] [PubMed]
  55. Alkhalidy, H.; Moore, W.; Wang, Y.; Luo, J.; McMillan, R.P.; Zhen, W.; Zhou, K.; Liu, D. The Flavonoid Kaempferol Ameliorates Streptozotocin-Induced Diabetes by Suppressing Hepatic Glucose Production. Molecules 2018, 23, 2338. [Google Scholar] [CrossRef]
  56. Somkuwar, D.; Kamble, V.A. Phytochemical Screening of Ethanolic Extracts of Stem, Leaves, Flower and Seed Kernel of Mangifera indica L. Int. J. Pharma Bio Sci. 2013, 4, P383–P389. [Google Scholar]
  57. Olasehinde, G.I.; Sholotan, K.J.; Openibo, J.O.; Taiwo, O.S.; Bello, O.A.; Ajayi, J.B.; Ayepola, O.O.; Ajayi, A.A. Phytochemical and Antimicrobial Properties of Mangifera Indica Leaf Extracts. Covenant J. Phys. Life Sci. 2018, 6, 1. [Google Scholar]
  58. Bbosa, G.S.; Kyegombe, D.B.; Ogwal-Okeng, J.; Bukenya-Ziraba, R.; Odyek, O.; Waako, P. Antibacterial activity of Mangifera indica (L.). Afr. J. Ecol. 2007, 45, 13–16. [Google Scholar] [CrossRef]
  59. Muthusamy, V.; Anand, S.; Sangeetha, K.; Sujatha, S.; Arun, B.; Lakshmi, B. Tannins Present in Cichorium Intybus Enhance Glucose Uptake and Inhibit Adipogenesis in 3T3-L1 Adipocytes through PTP1B Inhibition. Chem. Interactions 2008, 174, 69–78. [Google Scholar] [CrossRef]
  60. Li, Y.; Park, J.; Wu, Y.; Cui, J.; Jia, N.; Xi, M.; Wen, A. Identification of AMPK Activator from Twelve Pure Compounds Isolated from Aralia Taibaiensis: Implication in Antihyperglycemic and Hypolipidemic Activities. Korean J. Physiol. Pharmacol. 2017, 21, 279–286. [Google Scholar] [CrossRef]
  61. Perez, G.R.M.; Zavala, S.M.A.; Perez, G.S.; Perez, G.C. Antidiabetic Effect of Compounds Isolated from Plants. Phytomedicine 1998, 5, 55–75. [Google Scholar] [CrossRef] [PubMed]
  62. Shigemasa, H. Partial purification of crude gymnemic acids by affinity chromatography and effects of purified fractions on the oral glucose tolerance test in rats. Yonago Igaku Zasshi 1992, 43, 350–364. [Google Scholar]
  63. Esmaeili, M.A.; Zohari, F.; Sadeghi, H. Antioxidant and Protective Effects of Major Flavonoids from Teucrium polium on β-Cell Destruction in a Model of Streptozotocin-Induced Diabetes. Planta Medica 2009, 75, 1418–1420. [Google Scholar] [CrossRef] [PubMed]
  64. AL-Ishaq, R.K.; Abotaleb, M.; Kubatka, P.; Kajo, K.; Büsselberg, D. Flavonoids and Their Anti-Diabetic Effects: Cellular Mechanisms and Effects to Improve Blood Sugar Levels. Biomolecules 2019, 9, 430. [Google Scholar] [CrossRef] [PubMed]
Figure 1. Insulin releasing effects of ethanol extract of M. indica (EEMI) on (A) clonal BRIN-BD11 pancreatic β-cells, as well as (B) islets of Langerhans of pancreas, (C) acarbose, and (D) starch digestion, expressed as bar graphs. Effect of insulin secretion from clonal pancreatic BRIN-BD11 cells and isolated mouse islets of Langerhans were measured with or without insulin secretagogues and EEMI (1.6–5000 µg/mL and 8–200 µg/mL) in presence of 5.6 mM or 16.7 mM glucose. Additionally, glucose release reduction from starch was observed with or without EEMI (8–25,000 µg/mL) and acarbose (0.32–1000 µg/mL). Values are shown as mean ± SEM for insulin release and starch digestion; n = 4–8. *, **, *** p < 0.05–0.001 as compared to control.
Endocrines 05 00010 g001
Figure 2. The effects of the ethanol extract of M. indica (EEMI) on in vitro glucose diffusion at different time points of (A) 0, (B) 3, (C) 6, (D) 12, and (E) 24 h are depicted as bar graphs. The experiment was performed with or without EEMI using a dialysis tube, and parameters were recorded in a time-dependent (0, 3, 6, 12, 24 h) manner for 24 h at 37 °C while being shaken in an orbital shaker. Values are shown as mean ± SEM for the diffusion of glucose; n = 4. *, **, *** p < 0.05–0.001 as compared to the control.
Endocrines 05 00010 g002
Figure 3. In vivo effects of ethanol extract of M. indica (EEMI) on (A) feeding test, (B) oral glucose tolerance, (C) fasting blood glucose, (D) plasma insulin, and (E) liver glycogen using STZ-induced T2DM rats are represented in graphs. Test was conducted following 28 days of twice-daily administration of EEMI (250 and 500 mg/kg). Food intake was noted down on 12 h fasted rats at 0, 30, 60, 90, 120, 150, and 180 min, whereas oral glucose tolerance test was carried out on 12 h fasted rats at 0, 30, 60, 90, 120, and 180 min after oral administration of glucose alone (18 mmol/kg, control) with EEMI (250 and 500 mg/kg) or glibenclamide (0.5 mg/kg). Fasting blood glucose was measured from rat tail tip following a 7-day interval on 0th, 7th, 14th, 21st, and 28th day of twice-daily treatment. After 28 days of treatment, plasma insulin and liver glycogen content was measured from obtained plasma serum and extracted livers. Values are shown as mean ± SEM for each parameter; n = 6. *, **, *** p < 0.05–0.001 as compared to STZ-induced diabetic rats.
Endocrines 05 00010 g003
Table 1. Dose-dependent effects of DPPH scavenging activity of L-ascorbic acid and EEMI.
Concentration (µg/mL)Ascorbic Acid (% Inhibition)EEMI (% Inhibition)
1.610.82 ± 1.32 **9.95 ± 1.15 **
832.91 ± 1.15 ***30.42 ± 1.17 ***
4070.47 ± 1.85 ***47.25 ± 2.07 ***
20087.11 ± 1.61 ***62.14 ± 2.15 ***
100095.04 ± 1.55 ***73.32 ± 2.25 ***
500097.24 ± 1.10 ***80.99 ± 1.35 ***
Experiment was carried out in presence or absence of different concentrations (1.6–5000 µg/mL) of EEMI, followed by 30 min incubation with DPPH at room temperature in dark; percentage of DPPH inhibition was determined. Values n = 3 are expressed in mean ± SEM. **, *** p < 0.01–0.001 compared to control.
Table 2. Chronic effects of EEMI on body weight, and lipid profile in STZ-induced T2DM rats after 28 days of treatment.
DaysTreatment GroupBody wt. (gm)HDL
(mg/dL)
LDL
(mg/dL)
TG
(mg/dL)
Total Cholesterol
(mg/dL)
0 daysDiabetic control170.0 ± 0.835.92 ± 2.857.26 ± 3.193.22 ± 2.192.00 ± 1.2
EEMI (250 mg/kg)169.3 ± 2.131.68 ± 2.746.83 ± 6.187.17 ± 6.189.10 ± 2.7
EEMI (500 mg/kg)164.9 ± 2.333.17 ± 1.752.78 ± 4.579.57 ± 5.785.97 ± 3.0
Glibenclamide (0.5 mg/kg)158.8 ± 5.234.05 ± 2.155.54 ± 3.085.00 ± 2.994.77 ± 2.4
7 daysDiabetic control176.1 ± 3.129.92 ± 2.877.55 ± 6.9118.0 ± 6.983.67 ± 3.9
EEMI (250 mg/kg)166.2 ± 2.734.39 ± 2.966.69 ± 6.1107.0 ± 6.179.31 ± 1.5
EEMI (500 mg/kg)167.2 ± 1.042.10 ± 1.7 76.32 ± 2.3105.1 ± 4.572.29 ± 2.8
Glibenclamide (0.5 mg/kg)166.9 ± 2.062.81 ± 2.6 ***36.99 ± 3.1 **47.55 ± 3.1 **76.51 ± 2.9
14 daysDiabetic control171.6 ± 0.933.91 ± 2.757.57 ± 4.198.00 ± 4.188.14 ± 2.2
EEMI (250 mg/kg)167.2 ± 1.933.61 ± 1.775.94 ± 6.1116.3 ± 6.172.18 ± 1.0 **
EEMI (500 mg/kg)164.5 ± 3.536.05 ± 2.958.61 ± 4.584.05 ± 4.563.43 ± 4.2 **
Glibenclamide (0.5 mg/kg)167.8 ± 1.170.79 ± 2.9 ***39.09 ± 3.8 *49.65 ± 3.8 ***53.72 ± 1.7 ***
21 daysDiabetic control191.4 ± 1.537.29 ± 3.282.05 ± 3.4122.5 ± 3.4100.6 ± 2.5
EEMI (250 mg/kg)160.8 ± 4.4 **26.78 ± 1.772.91 ± 6.1113.2 ± 6.157.45 ± 5.2 **
EEMI (500 mg/kg)154.1 ± 2.3 ***41.05 ± 2.0 *61.45 ± 4.5 *86.89 ± 4.5 **63.12 ± 2.0 ***
Glibenclamide (0.5 mg/kg)155.4 ± 2.7 ***85.28 ± 2.5 **39.64 ± 0.1 ***46.87 ± 3.4 ***48.10 ± 1.8 ***
28 daysDiabetic control196.4 ± 2.123.19 ± 2.595.88 ± 3.3136.3 ± 3.3105.6 ± 2.7
EEMI (250 mg/kg)154.9 ± 2.3 ***31.62 ± 1.759.69 ± 6.1 **100.0 ± 6.1 **60.96 ± 3.8 ***
EEMI (500 mg/kg)150.0 ± 3.1 ***42.67 ± 1.9 **57.27 ± 4.5 **82.71 ± 4.5 ***57.44 ± 3.6 ***
Glibenclamide (0.5 mg/kg)153.1 ± 3.0 ***92.34 ± 1.9 ***44.37 ± 1.0 ***41.59 ± 2.8 ***41.66 ± 2.3 ***
Chronic effect of ethanol extract of Mangifera indica (EEMI) at 250 and 500 mg/kg or glibenclamide at 0.5 mg/kg or saline (control) in STZ-induced T2DM rats administered for 28 days twice-daily. Body weight was measured on 0th, 7th, 14th, 21st, and 28th day of treatment. After 28-day treatment, lipid profiles of rats were measured from separated plasma serum from centrifuged blood using COD-PAP, GPO-PAP, and CHOD-PAP reagents. Values are mean ± SEM for body wt., HDL, LDL, TG, and cholesterol; n = 8. * p < 0.05, ** p < 0.01, and *** p < 0.001 compared with STZ-induced T2DM control rats.
Table 3. Preliminary phytochemical screening of EEMI.
GroupResults
Alkaloids+
Tannins+
Saponins+
Steroids+
Glycosides+
Flavonoids+
Reducing sugar+
Anthraquinone
(+) = Presence, (−) = absence.
Disclaimer/Publisher’s Note: The statements, opinions and data contained in all publications are solely those of the individual author(s) and contributor(s) and not of MDPI and/or the editor(s). MDPI and/or the editor(s) disclaim responsibility for any injury to people or property resulting from any ideas, methods, instructions or products referred to in the content.

